Australian non-domestic buildings policy as an international exemplar
←
→
Page content transcription
If your browser does not render page correctly, please read the page content below
Australian non-domestic
buildings policy as an
international exemplar                                                                        RESEARCH

PETER MALLABURN
RAYAN AZHARI
TINA FAWCETT
MARINA TOPOUZI
*Author affiliations can be found in the back matter of this article

ABSTRACT                                                                                      CORRESPONDING AUTHOR:
                                                                                              Peter Mallaburn
The Australian policy approach, based on the NABERS energy performance benchmarking           UCL Energy Institute, University
scheme for commercial offices, is promoted as a ‘success story’ and is of interest to         College London, London, UK
governments internationally. This paper explores the evidence for the impacts of the          peter.mallaburn@ucl.ac.uk
Australian approach on energy use and carbon emissions, identifies the key elements
of its conception, design and implementation, and investigates the role of government.
It uses a mixture of literature review, re-analysis of quantitative data and analysis of 30
                                                                                              KEYWORDS:
original stakeholder interviews. The literature suggests that NABERS’ appeal to multiple      energy efficiency policy;
benefits of energy efficiency and its place in the wider policy mix should help deliver       governance; multiple benefits;
positive results. Analysis of publicly available data has highlighted data gaps. However,     non-domestic buildings; offices;
evidence suggests significant energy savings have been made, although the attribution         performance standards and
                                                                                              disclosure; policy mix
to NABERS alone, given the policy mix, is uncertain. The interviews show high levels of
agreement that the policy mix has transformed large commercial office buildings. They
also highlight the wide range of actors mobilised to deliver this change and the central      TO CITE THIS ARTICLE:
                                                                                              Mallaburn, P., Azhari, R.,
role of well-designed government intervention and support. The Australian experience is
                                                                                              Fawcett, T., & Topouzi, M.
rightly of interest to international governments, but they must recognise that replicating
                                                                                              (2021). Australian non-
its success requires attention to detail and long-term commitment.                            domestic buildings policy as
                                                                                              an international exemplar.
POLICY RELEVANCE                                                                              Buildings and Cities, 2(1),
                                                                                              pp. 318–335. DOI: https://doi.
The decarbonisation of commercial buildings is challenging and many countries, including      org/10.5334/bc.114
the UK, are struggling to make progress. In-use performance benchmarking policies such
as NABERS are considered to be effective by engaging with industry and promoting the
multiple benefits of energy efficiency. The lessons from the Australian experience help
to identify four key policy design features for governments to consider: (1) political
leadership, adequate financial resources and people with the right engineering and
market skills and experience; (2) an in-use performance benchmark designed to allow Mallaburn et al. 319
Buildings and Cities
industry to innovate and aligned with the way both buildings and energy managers DOI: 10.5334/bc.114
operate; (3) the careful and progressive application of government interventions to tackle
poor performance without compromising the voluntary nature of the policy; and (4) a
governance model to give industry effective, but measured and proportionate, influence
over the design and implementation of the policy.
1. INTRODUCTION
Carbon emissions are not declining at the rate required to deal with the climate emergency.
Reducing emissions from non-residential buildings is an essential part of the response because,
globally, the sector is responsible for 8% of energy-related CO2 emissions (GABC et al. 2019).
Evidence about policies that successfully deliver emission reductions is therefore of considerable
practical value to both policymakers and researchers (IPEEC 2014a).
This is particularly relevant to the UK, where past successes in reducing emissions have recently
begun to falter (Mallaburn & Eyre 2014; CCC 2018). Commercial buildings are a concern because,
unlike homes and industry, emissions have not reduced and in recent years may have even begun
to rise (Mallaburn et al. 2019). As a result, policies to address the sector are at the centre of the
government’s developing plans for new policies and programmes (BEIS 2019a).
The UK government launched a formal consultation on a new in-use energy performance
benchmarking scheme for large buildings in March 2021 (BEIS 2021). Benchmarking is a popular
policy: by 2018 it had been adopted in 85 countries (GABC et al. 2019). The government’s thinking
has been strongly influenced by the Australian government’s policy approach,1 key elements of
which are the mandatory disclosure of operational energy performance of office buildings >1000
m2 under the Commercial Buildings Disclosure Act (CBD) (Australian Government 2017) based on
a benchmarking tool called the National Australian Built Environment Rating System (NABERS)
rating tool (BEIS 2019b).
The Australian approach has assumed exemplary status and is widely considered to have
transformed the Australian office market (IPEEC 2014b). NABERS has been licenced for use in New
Zealand and trialled in India, Hong Kong and Indonesia. The UK Better Buildings Partnership (BBP),
representing leading sustainable office developers and owners, has assessed the suitability of a
NABERS-style approach for new office buildings in the UK (BBP 2019; Bordass et al. 2016) and a UK
version of NABERS was launched in November 2020 (NABERS 2021).
There are no peer-reviewed studies on the suitability of NABERS and the wider Australian policy
approach as a model for adoption by other countries. This paper attempts to fill this gap by
addressing three research questions:
• What has been the impact on energy use and carbon emissions and on the sector generally?
• What are the key features of the conception, design and implementation?
• What role has the government played using policy measures and its relationship with industry?
Although we hope this paper has broad applicability in the non-residential sector, the focus is on
existing offices >1000 m2 because these are the parameters underpinning both the Australian and
the nascent UK policy approaches. We do not directly address new buildings or other subsectors
such as retail or hospitality. The discussion and conclusions sections contain comments on the
merit of the Australian system and set out general lessons for the UK and other countries, but we
do not comment on how in-use benchmarking might work in the UK policy environment.
This paper comprises a short review of energy performance benchmarking and how it has been
applied in Australia, a methodology covering the techniques and approaches used, and a discussion
of the results in relation to the research questions. A conclusion section summarises the findings
and makes several policy recommendations.2. LITERATURE REVIEW OF BUILDING ENERGY PERFORMANCE Mallaburn et al.
Buildings and Cities
320
BENCHMARKING DOI: 10.5334/bc.114
2.1 BENCHMARKING IN GENERAL
Benchmarking compares the energy performance of a building with other similar buildings
and best practice. There are two types. Operational schemes, such as NABERS, measure in-use
performance in terms of energy use or CO2 emissions, typically as a function of area. The second
type, asset-based benchmarks, uses predictions at the design stage compared with a reference
building built to specific standards. Benchmarks can also vary significantly in terms of the metrics
used and how the building and its services are assessed (Bordass 2020). Current UK policy is based
on asset ratings in the form of Energy Performance Certificates (MHCLG 2013).
Countries apply benchmarks in different ways. They can be voluntary, acting simply as information
tools. More typically, some degree of coercion is used by requiring their disclosure at the point of
sale or lease of a property, or by setting minimum performance standards for certain buildings
such as those owned or occupied by the government. In some countries, including Australia and
the US, schemes that began as voluntary became mandatory once established, whereas in the
European Union (EU) disclosure has always been mandatory (IPEEC 2014b; Burt et al. 2015).
The current UK policy debate centres around the relative merits of operational and asset-based
benchmarks. Asset-based ratings are relatively simple to use but they are thought to contribute
to the ‘performance gap’, where the in-use efficiency of the building can be significantly lower
than intended because of a lack of a feedback loop between design and operation (Cohen et al.
2017). Operational benchmarking can help to overcome these issues (Liddiard et al. 2008; Hong et
al. 2013) and the NABERS approach was considered by the BBP to be particularly effective in this
respect (Bordass et al. 2016).
2.2 HOW DO BENCHMARKS WORK?
Benchmarking works by providing market actors with information about the energy performance
of the building. In the mid- to late 2000s, sustainability became a key differentiator in the real
estate market leading to increased interest from tenants, owners, investors and developers
to demonstrate their environmental credentials. By making energy performance visible and
understandable, benchmarking allowed these actors to distinguish the most efficient buildings
from the rest of the market (Palmer & Walls 2017).
Benchmarking is also useful for actors within an organisation. For all but the most energy-intensive
companies, energy use is marginal and delegated to energy and facilities management teams.
By exposing poor performance relative to the competition, benchmarking raises the salience
of energy, especially if disclosure is mandatory (DECC 2012; Mallaburn 2018; Cohen & Bordass
2015). This gives agency to the energy manger, attracts the attention of the board and makes
investments in energy efficiency much more likely.
There is some evidence that benchmarking policy, and the implementation of minimum
operational performance standards more generally, can have a positive impact on the retrofit
supply chain, both internationally and specifically in Australia (RAP 2020; Energy Action 2016).
Having to focus on actual performance means that specialists such as engineers, contractors
and facilities managers need to upskill to identify and deliver the improvements in annual energy
efficiency needed to meet the benchmark standards.
But why does a relatively simple information tool have these effects? A key barrier to investment
in energy efficiency is the low value to the company of the potential savings and hence the
return on the investment. The concept of ‘multiple benefits’ (IEA 2014) argues that other, non-
energy benefits can be significantly more valuable to organisations (Ürge-Vorsatz et al. 2015),
offering ‘meaningful monetary contributions’ in the case for investment in office retrofits
(Bleyl et al. 2019).Energy-efficient buildings have been associated with increased corporate reputation, staff health Mallaburn et al. 321
Buildings and Cities
and welfare, and productivity (WGBC 2018; Businge et al. 2019; IEA 2014). Studies in the US DOI: 10.5334/bc.114
and the UK have identified a ‘green premium’ associating high energy performance with asset
value drivers such as increased rental income and lease length (Eichholtz et al. 2010; Fuerst &
McAllister 2010).
This effect was also seen in Australia (Warren-Myers 2018) with a study by the Australian Property
Institute finding a 10% premium for highly rated NABERS buildings (Newell et al. 2011, 2014),
although this correlation has been disputed (Gabe & Rehm 2014). Nonetheless, the investment
community took notice in 2006 when the Property Council of Australia made a 5-star NABERS rating
a requirement for Prime and A-rated offices, its two most prestigious quality benchmarks. NABERS
is now considered to be an important reason why Australia performs strongly in international
rankings such as the Global Real Estate Sustainability Benchmark (GRESB) (2019).
2.3 BENCHMARKING IN CONTEXT
Information on its own is rarely enough to trigger material change. Policymakers usually make
benchmarking part of a policy mix where multiple instruments simultaneously address complex
policy objectives (Gunningham & Sinclair 1999). Getting the balance right is important because
some measures work well together, whereas others can cancel out or conflict (Kern et al. 2018;
Rosenow et al. 2016; Wiese et al. 2018). Energy taxes, performance standards and information
programmes are generally complementary, whereas different types of financial measures can
over-subsidise the energy user (Rosenow et al. 2016).
The optimal policy mix for commercial buildings is reasonably well understood. Information
tools such as energy audits and benchmarking are typically implemented alongside building
codes and minimum performance standards to remove the worst performing buildings from the
market. Governments exert leverage by requiring disclosure and ensuring that public buildings
meet minimum performance standards. Financial incentives are used to overcome the additional
capital cost associated with an energy efficient project (IPEEC 2014b, 2017).
2.4 BENCHMARKING POLICY IN AUSTRALIA
NABERS originated in New South Wales (NSW) in 1998 as the Australian Building Greenhouse Rating
(ABGR) before being incorporated into the Federal NABERS scheme and extending nationwide in
2009 (Pears 1998; Bannister 2012). The ABGR was conceived and designed by the Sustainable
Energy Development Authority (SEDA), a statutory agency set up in 1996 to implement the
environmental policies of the NSW government (Government of New South Wales 1995).
Energy performance was originally represented on a 1–5-star scale, with 2.5 stars representing
average performance and 4.5 stars industry ‘best practice’. As the performance of the stock
improved a sixth star was added in 2011 marking the halfway point between 5 stars and net-
zero carbon emissions. NABERS is based on 12 months of metered energy data adjusted for local
weather conditions and hours of use and converted to carbon emissions and normalised by floor
area (Bannister 2012; Bannister et al. 2016; CIE 2019).
NABERS is unique in that, as well as rating the building as a whole, it also separates the ‘base
building’ controlled by the landlord from the space occupied by the tenant. It primarily focuses on
existing offices, and in the 20 years since it was introduced it has been applied to 3586 buildings
at least once (NABERS 2020). In 2019/20, a total of 1952 ratings were carried out. NABERS has
been extended to cover new offices, apartments, hospitals, data and shopping centres, and for
water use, the indoor office environment and waste. However, office energy ratings dominate
the scheme.
NABERS, as the ABGR, began as a voluntary scheme. However, in 2004 the NSW government
set 3.5 stars as a minimum standard for its own offices and extended this nationwide in 2006
(Government of New South Wales 2008), tightened to 4.5 stars and applied to all new government
buildings, major refurbishments and new leases >2000 m2 (Australian Government 2020).In 2010, NABERS was effectively made mandatory for offices >2000 m2 under the CBD (Australian Mallaburn et al. 322
Buildings and Cities
Government 2017). This required a Building Energy Efficiency Certificate (BEEC) to be published DOI: 10.5334/bc.114
on sale or lease. Each BEEC was made up of a NABERS Base Building rating and a tenancy lighting
assessment. The threshold was reduced to 1000 m2 in 2018.
3. METHODOLOGY
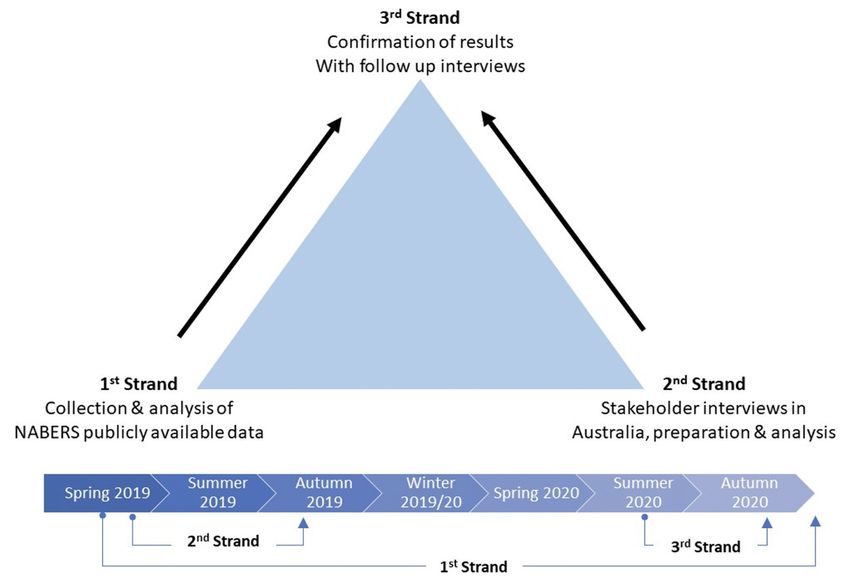
A mixed-method approach was used to address the research questions in three interlinked strands
(Figure 1). Strand 1 collated and analysed publicly available NABERS and CBD reports and impact
assessments. Strand 2 addressed the second and third research questions by collecting primary
qualitative data through semi-structured interviews with a range of Australian stakeholders.
Strand 3 cross-checked the preliminary results from Strands 1 and 2 using follow-up interviews.
Figure 1: Strands 1–3 of the
mixed-method approach as
carried out in the study.
3.1 PUBLICLY AVAILABLE IMPACT DATA (STRAND 1)
Data on the impact of NABERS over the life of the scheme were extracted from the official NABERS
online portal (NABERS 2020). This holds data on all NABERS ratings in several formats, from the
original annual report pdfs to online presentations. The more recent reports also contain ‘life of
programme’ statistics going back to the start of the ABGR.
Four datasets were analysed using MS Excel to investigate the impact on three metrics over the life
of the programme: star ratings, CO2 emissions and market coverage.
• The ‘certified buildings & tenancies’ dataset was analysed to show the number of buildings
with ratings of either ≤4 or ≥4.5.
• The ‘office energy market penetration’ dataset to show the proportion of the office market
with a NABERS rating.
• The ‘annual carbon intensity’ dataset to show the carbon reduction over time.
• The ‘distribution count of office energy ratings’ dataset to show how annual star ratings
change over time.Our analysis used simple averages to produce the mean star rating based on number of ratings Mallaburn et al. 323
Buildings and Cities
for a given year, in contrast to the NABERS approach, which was last mentioned in 2016 (NABERS DOI: 10.5334/bc.114
2016), of weighting average by floor area. A simple average was chosen to treat all buildings
equally and to avoid giving relative importance to larger buildings based on their floor area.
The analysis also took account of the two formal impact assessments of the CBD and NABERS
carried out by the Federal government in 2015 and 2019 (Acil Allen 2015; CIE 2019). These
examined a wide range of data to assess the impact, additionality and cost-effectiveness of the
policy, and to make recommendations on its development. Much of these data are not publicly
available.
To provide context we also reviewed several government and third-party reports examining the
impact of the policy on the broader market (IPD & DOI 2013; Gabe & Rehm 2014; Newell et al.
2014), or to provide detail on the Australian non-domestic buildings market (Ernst & Young 2015;
Ostwald et al. 2015; Department of Climate Change and Energy Efficiency 2012).
3.2 STAKEHOLDER INTERVIEWS (STRANDS 2 AND 3)
Strand 2 involved 20 face-to-face interviews with Australian stakeholders familiar with the
development, management and impact of NABERS and the Australian policy mix. The interviewees
were selected to provide a range of opinions from State and Federal government and its agencies,
building owners, developers and tenants, trade and professional bodies, and market specialists
and consultants (Table 1).
Table 1 Interview number by
INTERVIEWEES N
stakeholder type carried out in
Government Civil servants from the New South Wales (NSW) Department of Planning, Industry 3 Australia.
and Environment
Former NSW civil servants who helped set the scheme up in 1998–99 2
NABERS Representatives from the current NABERS senior management team 5
Former special advisor to the premier of NSW in 2003–04 1
Building sector and Australian property developers and building owners 3
property market
Representatives from the Australian Property Institute, the Australian Energy 3
Efficiency Council and the Green Building Council of Australia
Representative from thefifthestate.com, a sustainable built-environment website 1
Academia Academic and consultant involved with the design of the original Australian 2
Building Greenhouse Rating (ABGR) scheme
Total 20
The interviews were carried out in Australia over the summer of 2019. They were structured
following an interview guide to ensure the three research questions were covered. The interviews
were open-ended ensuring that the data gathered fully addressed each interviewee’s expertise
and interests (Cassell & Symon 2004) and to reflect the fact a given individual was unlikely to have
considered views on all the research questions.
Each interview lasted between 40 and 60 minutes. Detailed notes from each interview were
systematically archived and anonymised following research ethics procedures. Content analysis
was used to examine the answers to collate the views of interviewees and ascribe them to
different market perspectives shown in Table 1.
For Strand 3 the preliminary findings from Strands 1 and 2 were used in follow-up interviews (n = 10)
to cross-check emerging insights, fill gaps and answer queries. These interviews were carried out
remotely in the summer and autumn of 2020. Using triangulation methods, the interviews were
structured in a schematic format in which key findings associated with the three core questions
were explored by the interviewer.Seven Strand 3 interviews involved stakeholders already covered in Strand 2. Of these, three were Mallaburn et al. 324
Buildings and Cities
reflective conversations on the emerging findings of the research with interviewees with a broad DOI: 10.5334/bc.114
knowledge of the programme and four were to clarify specific issues raised by the analysis or gaps
in coverage.
There were also three interviews with new stakeholders: a senior representative of the Property
Council of Australia, a trade body representing building owners and developers; a former
representative of real estate investment analytics company Investment Property Databank (IPD);
and a representative from the Australian Institute of Refrigeration, Air conditioning and Heating,
a trade body representing heating, ventilation and air-conditioning (HVAC) manufacturers and
installers. These interviews lasted between 20 and 30 minutes and were structured broadly
around the research questions, with queries specific to the interviewee. The interviews with new
stakeholders followed the format used for the original Strand 1 interviews.
The two trade bodies interviewed in Strand 3 provided a variety of written cases study material
describing in detail how buildings were upgraded and reflections on the role of the ABGR and
NABERS and other policy interventions. These case studies covered a range of building types and
sizes, mainly from the period 2008–16. They were provided in confidence and cannot be reproduced
in detail. However, several insights were analysed and incorporated into the interview results.
4. RESULTS
The results address the three research questions set out in Section 1 using data drawn from
all three methodological strands, i.e. a blend of data from the public record and from interview
testimony.
4.1 THE IMPACT OF THE AUSTRALIAN POLICY APPROACH
4.1.1 Reports published by the NABERS programme
Figure 2 shows the mean star rating for all rated buildings in a given year, and the total number
of certified whole building, base building and tenancy ratings each year, broken down into the
number of buildings with a rating >4 (dark grey) and the number with a rating of ≤4 (light grey).
Discounting the fluctuations in the mean star rating before 2004, which is due to the small sample
size, the mean star rating has increased by 1.6 stars, from 2.5 in 2003 to 4.1 in 2020. Using a
simple average to calculate the mean rating for a given year depressed the rating by around 0.2
stars in 2010, increasing to around 0.4 stars in 2020 compared with the average rating reported
by NABERS.2 This difference highlights how outcomes could vary based on different reporting
methods. The proportion of ratings >4 stars has increased substantially from around 10% in 2005
to 57% in 2020. The average annual carbon intensity of NABERS-rated buildings has decreased by
36% between 2010 and 2020, from 136 to 86 kg CO2/m2.
The impact of the three government interventions can be seen in the numbers of rated buildings:
a small increase in 2003–05 following the introduction of government procurement standards,
followed by a significant acceleration of around 40%, most noticeable in the lower rated buildings,
following the introduction of mandatory disclosure under the CBD policy in 2010, and finally a
modest uptake in 2018 after the minimum floor area threshold for the CBD was reduced from
2000 to 1000 m2. Despite the uptake in 2018, mainly by buildingsMallaburn et al. 325
Buildings and Cities
DOI: 10.5334/bc.114
Figure 2: Total number of
certified NABERS office energy
ratings (pale grey) and• Energy intensity changes are even more marked: a zero-rated building improves 10 times as Mallaburn et al. 326
Buildings and Cities
much as a 5-star building (reductions in energy use per m2 of 176 MJ versus 15 MJ). DOI: 10.5334/bc.114
• Most buildings showed an increase in ratings over the life of the CBD programme. But a
significant proportion (around 20%) showed progressively lower ratings, with some as much
as 2 stars.
• A degree of gaming was happening where organisations were shifting energy use outside
the base building to improve their rating.
4.1.3 Distributional impacts
IPD compiled a ‘Green Property Index’ asset value tracker between 2008 and 2013. A report
published with the Australian government showed that buildings with NABERS ratings of ≥4 had
10.8% higher rental income, 18.1% higher operating income and 49.5% lower capital costs (IPD
& DOI 2013). The analysis also showed a shift in the mean rating of the buildings studied from 3
stars in 2008 to 4.5 stars in 2013.
However, on closer analysis the IPD results are mixed. The uplift was not as marked in lower rated
buildings. More complex investment indicators such as annualised total returns showed only a
small uplift. To add to the uncertainty, a study of office transactions in Sydney (Gabe & Rehm
2014) found no correlation between energy performance and the rent that tenants were prepared
to pay. The 2015 CBD review also found a correlation between asset value and productivity, but
the review equivocates on the meaning of this linkage, also citing Gabe & Rehm (2014).
Interviewees familiar with the developer market pointed to a wider impact on business perceptions
and behaviour. There was a particularly strong wave of corporate investment in highly rated
buildings during the period 2007–13 driven by a combination of a supportive policy environment,
increased demand from tenants and international investor pressure.
Specifically relating to NABERS and the ABGR, developers said that ratings had a crucial role in
facilitating emissions reductions once the decision to invest in a refurbishment had been made
by senior managers. One leading developer familiar with the investment market summed this up
as follows:
NABERS changed the rules of the game. Having the pension funds breathing down our
necks about sustainability flipped our default view of energy efficiency from ‘why should
I bother?’ to ‘how can I afford not to?’
4.2 KEY DESIGN FEATURES
This section summarises stakeholders’ views broken down into several key features of the
Australian policy approach. Where necessary an indication is given on the degree of consensus
and which stakeholder type was prevalent.
4.2.1 The focus on performance
All interviewees said that the performance-based approach used by the ABGR was a critical
factor in gaining early industry acceptance. Former officials and consultants from SEDA, the NSW
government’s delivery agency, said that the priority was to focus on existing buildings, which
meant engaging energy managers and commissioning agents rather than with designers. A
more practical problem was that predictive models were poor at generating realistic greenhouse
gas estimates.
The driving philosophy was to create market pressure for businesses to make use of their energy
managers. SEDA therefore took great care to develop a benchmark that worked for those running
the building rather something that might be cheaper to administer. Simplicity and relevance were
key drivers, with one comment being: ‘you don’t need a Gucci handbag when a carrier bag will do
the job’. A more measured view was:Key to the success of the NABERS rating system has been an underlying set of Mallaburn et al. 327
Buildings and Cities
benchmarks which are essentially fair, reasonably accurate and stable. Absolute DOI: 10.5334/bc.114
accuracy is neither possible nor necessary for a successful rating system.
(Bannister 2012: 9)
This approach was not entirely altruistic. SEDA did not want to get involved in technical detail.
The intention was that if a developer decided to adopt the scheme, the rating should offer basic
feedback on the most effective measures in terms of design and operation. The analogy used was
project managers who were not technical specialists but instead set broad parameters and relied
on the professional expertise of their subcontractors to interpret the brief and deliver the outcomes.
4.2.2 Operational relevance
Commissioning agents, energy managers and trade bodies strongly supported the operational
focus of NABERS. The separation of ‘base building’ and tenancy was particularly relevant because
it aligned with the way metering boundaries worked in Australia. This is important to the energy
manager because it dictated how the energy services operated. It also allowed prospective tenants
to judge the underlying energy performance of ‘their’ space irrespective of existing activities.
The second operational feature was the way the star boundaries worked. Rather than using a
potentially unattainable definition of ‘best practice’, they were grounded in reality, reflecting
the actual distribution of building performance across the building stock. SEDA officials simply
drew lines on a 1998 performance distribution curve. A rating of 4.5 stars meant market leading
performance, and 5 stars was aspirational at the time. Average buildings received 2.5 stars. Poorly
performing buildingstaking part in the scheme and, crucially, the aspirational value of moving from one star to the Mallaburn et al. 328
Buildings and Cities
next. It also gave them the evidence they needed to make the investment case to their senior DOI: 10.5334/bc.114
managers, particularly the finance director, with each star gained helping to make the business
case to progress to the next one. One energy manager said:
Suddenly I was in demand. The CFO’s [Chief Financial Officer] office was on the phone
constantly and I was asked to make a Board presentation to explain where we stood on
energy use compared to others. When they realised that we would be ABGR 2 star I got
a budget to get us to 3.
Businesses also mentioned that NABERS helped initiate a broader market transformational impact.
There was a strong degree of competitiveness between owners and developers to deliver ≥5-star
buildings, particularly with prime offices. Developers are keen to outdo each other, not simply to
achieve a good rating but to do it on a difficult building without resorting to expensive technical
solutions.
4.2.4 Asset and reputational value
Several interviewees mentioned the impact of a NABERS rating on asset value, and indirectly on
the perceptions of the wider investment community. Developers and owners said that whilst asset
value was an important driver, the less tangible non-economic benefits tended to be more useful
when competing for tenants who prefer an efficient building for reputational or staff welfare
reasons. This connection features strongly in the case study material.
Interviewees familiar with the investment community pointed to the period 2004–08 as a ‘golden
age’ when the Australian real estate market began to take a strong interest in sustainability.
NABERS made energy performance visible to investors, helped considerably by the Property
Council of Australia making a NABERS 5-star rating a requirement for Prime and A-rated offices.
This conferred ‘investment grade’ status on NABERS, which was important because of the high
proportion of buildings owned by real estate investment trusts (Bordass et al. 2016; Bannister et
al. 2016). Two interviewers commented that the high GRESB rating for Australian real estate was
directly linked to NABERS.
4.2.5 The role of government
Interviewees said that the role of government in the conception and development of the Australian
policy approach was essentially a story of two Labor administrations: the State-level government
of Bob Carr from 1995 to 2005 and the Federal government of Kevin Rudd and Julia Gillard from
2007 to 2013.
The ABGR scheme arose during a period of close public scrutiny of corporate sustainability
stimulated by the negotiation of the 1997 Kyoto Protocol. Real estate was no exception and prime
office developers in Sydney asked the NSW government for help so they could distinguish their
highly efficient buildings from the rest of the market. The ABGR was the result.
Several interviewees mentioned the key role played by NSW Premier Carr. Although prime office
developers were supportive, the rest of the market was sceptical. Carr’s involvement gave SEDA
political cover in its dealings with industry together with adequate resources and a statutory
base. Carr recruited Cathy Zoi as chief executive officer (CEO), bringing high-level experience from
the Bill Clinton White House and the US Environmental Protection Agency. A scoping report was
commissioned (Pears 1998) and work began in July 1998 overseen by an industry steering group
drawn from across the market (Pears et al. 1999).
When take-up began to falter in the early 2000s, the government recognised that some degree of
coercion was necessary, but also that a mandatory scheme would alienate industry. A compromise
was reached in 2004 when a 3.5-star-base building rating was required for the sale or lease of
existing government buildings. This had considerable market leverage because government
occupied a significant proportion of the office stock. Developers said that this relatively simplechange elevated the ABGR from a technical curiosity to something of considerable strategic Mallaburn et al. 329
Buildings and Cities
interest: DOI: 10.5334/bc.114
[Government procurement standards] changed our entire approach. At the time 3.5
stars was pretty cutting edge. But because public tenants were in 30% of our stock we
had to scramble to upgrade because we didn’t know which buildings they were going to
move into next.
Take-up accelerated significantly between 2004 and 2010, a trend that is clearly visible in Figure 2.
The Federal government in 2007 harnessed the rapidly growing interest of the Australian real
estate industry in sustainability. In addition to expanding NABERS into a Federal programme,
the energy efficiency requirements in the building codes were significantly tightened for new
buildings. A A$90 million Green Building Fund was introduced, which developers considered to be
a significant measure, particularly for smaller office developments.
The financial crash of 2008 arrested the international momentum for sustainable buildings.
However, the supportive political climate in Australia kept interest alive and gave the government
an opportunity to tackle the organisations that the scheme so far had failed to reach, particularly
smaller organisations. This led to introduction of the Buildings Energy Disclosure Act and the CBD
scheme in 2010/11.
Business interviewees and sector experts said that the success of the voluntary phase scheme
was crucial in paving the way for mandated ratings under the CBD without undue pushback
from industry. The close relationship government had established with industry helped to build
confidence and develop the capacity to deliver. Several interviewees said that the ultimate test of
the scheme’s resilience was that it survived the close scrutiny of the highly climate-sceptical Tony
Abbott government in 2013.
5. DISCUSSION
The research questions this paper set out to answer were to estimate the impact of the policy
approach both quantitatively and qualitatively, identify the key features of the Australian policy
approach, and finally explore the role of the government at State and Federal levels.
5.1 IMPACT
The evidence from the data published by NABERS is mixed. The impact on carbon and energy
use seems clear. However, public access to the data is limited and the published data contain
ambiguities and inconsistencies. NABERS operates in a complex and stratified office market
where impacts seem to vary by office grade, size and geographical location. Simple analysis, for
example, looking at the changing average star ratings of office buildings, is not sufficient for policy
evaluation purposes. The ‘learning story’ for other governments is that high-quality data collection
and a strong evaluation methodology are needed alongside benchmarking to feed into improving
policy design and implementation (Janda & Topouzi 2015).
In this respect, we can be, in part, reassured by the two Federal government impact assessments
that had access to a much wider dataset. Although they do not extend before 2010 when the CBD
was introduced, they clearly show a reduction in carbon emissions and energy intensity and that this
can be attributed to the CBD and NABERS. Both reports were widely considered by the interviewees
to be robust and credible policy evaluations. It seems likely that any major shortcomings would
have been highlighted in these reports. Indeed, the lack of detail in the published NABERS data could
be a consequence of confidentiality concerns or reporting requirements placed on organisations,
issues that overseas governments could address in their own schemes.
Additionality is a key issue for governments. NABERS is part of a complex policy mix and consequently
it is necessary to try to understand the influence of other policies and external drivers. This is the
perennial policy evaluation problem of which baseline to use. Governments must also factor inthe propensity of organisations to ‘game’ the rules (CIE 2019). These considerations are always Mallaburn et al. 330
Buildings and Cities
present in policy development and would, we presume, be part of any country’s regulatory impact DOI: 10.5334/bc.114
assessment.
The data on the wider distributional impact are also mixed. The IPD analysis is dated, and
the academic literature in relation to Australia is limited and contradictory. However, the
sustainability agenda has not gone away and there is a clear perception from Australian
stakeholders that NABERS and the CBD combined have had, and continue to have, a significant
impact on corporate and investor behaviour through a range of multiple benefits, particularly
asset value, reputation, and a conducive and healthy workplace environment. The debate
on energy performance and value is still contentious (Warren-Myers 2018). But perception is
often all it takes to move investment markets. This is clearly an area that would merit further
study.
5.2 DESIGN AND GOVERNANCE
The exemplary nature of NABERS lies in the way it works. The interviews illuminated the importance
of the early history: the idea was developed at time when there was clear imperative to take action;
there was high-level political support when it was most needed, and key parts of the industry were
also supportive. The NSW government also made best use of SEDA, staffing it with experienced
political operators and staff who knew and were trusted by the market. The role of agencies in
delivering complex market transformations is difficult to understate.
This strong and iterative collaboration with industry is a fundamental feature of the success of
the Australian approach. It does not seem to have weakened the policy aims, rather it resulted in
a design seen as fair, accurate and proportionate, and a governance process that enabled good
decisions on policy details, such as the boundaries between different star ratings. This relationship
also, crucially, enabled a measured transition from a voluntary scheme with limited appeal to a
mandatory one reaching beyond the prime office market without too many industry complaints.
Governments thinking of emulating the Australian experience, especially as part of a net zero
policy, such as the UK, need to take careful note of this.
In design terms, the separation of base building and tenants’ energy consumption was not only
a technically good decision, in terms of metrics and energy metering boundaries, it also enabled
data-supported decisions to be made by and between different groups of actors: building owners,
building energy managers and tenants. Enabling building energy managers, the actors most
expert on and engaged with the energy use of the buildings, to engage with this policy was seen
as very important.
More generally the Australian approach is a fine example of operational benchmarking. Focusing on
actual energy and carbon performance data allows developers to advertise their highly performing
buildings, allowing the market to identify and assign value to good performance, taken principally
as reputational benefit for building owners and a conducive working environment for tenants.
The evidence for a distributional impact is less clear, but NABERS has certainly built capacity and
experience particularly in commissioning and facilities management.
Policy governance has changed as the scheme grew in ambition, from state level to federal
government. Given the urgency of reducing energy use and carbon emissions, and the evidence
from NABERS, other international governments would be advised to skip the subnational stage
and start with a national scheme.
6. CONCLUSIONS
This paper set out to determine whether the Australian approach to energy performance
benchmarking policy has been as successful as its promoters suggest, if so, why, and whether this
policy should be of interest to governments internationally.No one metric can prove the ‘success story’ of a policy that operates in a complex surrounding Mallaburn et al. 331
Buildings and Cities
policy environment and within a dynamic market. Nevertheless, by combining quantitative analysis DOI: 10.5334/bc.114
with an extensive set of interviews with a range of stakeholders, there is a ‘learning story’ which
sets out how the Australian policy approach has contributed to the transformation of a section of
the Australian commercial office market.
We think it is clear that that Australian prime office sector is considerably more energy efficient as
a direct result of NABERS. There is also good evidence that the Commercial Buildings Disclosure Act
(CBD) is extending the reach of the policy into smaller ‘mid-tier’ organisations that many countries
find difficult to reach because they do not respond as readily to reputational and other corporate
drivers. However, the key lesson for overseas governments is how policy has shifted focus from
large, committed organisations to smaller companies.
We would single out four interrelated aspects that together characterise the policy ‘choreography’
that makes the Australian experience stand out:
• Resources: a combination of political leadership, money and people, together with an agency
structure with sufficient freedom to engage constructively with industry.
• Policy design: a benchmark that was clear and robust to allow industry to innovate and
aligned with the way both buildings and energy managers operated in the real world.
• Pressure: careful and progressive application of a compliance model that tackled poor
performance without compromising the voluntary ethos of the NABERS scheme.
• Governance: a benchmarking system flexible enough to learn from its mistakes and a
governance model that gave industry effective, but measured and proportionate, influence.
The Australian policy story is complex. However, NABERS provides credible, salient information to
a range of actors who use it to achieve multiple business benefits. By managing to link delivery of
environmental and business benefits, NABERS offers a model of policymaking which could have
wider application.
NOTES
1 I n this paper the term ‘Australian policy approach’ or similar phrase refer to the combination of the CBD,
NABERS and other directly related measures, unless specified otherwise.
2 The NABERS average star rating is assumed to be weighted by floor area.
ACKNOWLEDGEMENTS
The authors are grateful for the help of all those interviewed as part of this research and for the
comments and suggestions of the anonymous reviewers.
AUTHOR AFFILIATIONS
Peter Mallaburn orcid.org/0000-0001-6456-0558
UCL Energy Institute, University College London, London, UK
Rayan Azhari orcid.org/0000-0002-6882-057X
UCL Energy Institute, University College London, London, UK
Tina Fawcett orcid.org/0000-0003-3953-3675
Environmental Change Institute, University of Oxford, Oxford, UK
Marina Topouzi orcid.org/0000-0002-0587-0414
Environmental Change Institute, University of Oxford, Oxford, UK
COMPETING INTERESTS
The authors have no competing interests to declare.FUNDING Mallaburn et al.
Buildings and Cities
332
DOI: 10.5334/bc.114
The work was supported by an Engineering and Physical Sciences Research Council (EPSRC) Impact
Acceleration Award (grant number EP/R511638/1) and by the EPSRC Centre for Research into
Energy Demand Solutions (grant number EP/R035288/1).
REFERENCES
Acil Allen. (2015). Commercial Building Disclosure Program review. Report to the Department of Industry and
Science. http://www.cbd.gov.au/files/CBD%20program%20review%20final%20report.pdf
Australian Government. (2017). Commercial building disclosure. The legal framework. http://cbd.gov.au/
overview-of-the-program/legal-framework
Australian Government. (2020). Government buildings. https://www.energy.gov.au/government-priorities/
energy-productivity-and-energy-efficiency/government-buildings
Bannister, P. (2012). NABERS: Lessons from 12 years of performance-based ratings in Australia. In
Proceedings of the 12th International Conference for Enhanced Building Operations. https://www.
buildingrating.org/document/nabers-lessons-12-years-performance-based-ratings-australia
Bannister, P., Burt, L., & Hinge, A. (2016). Under the hood of Energy Star and NABERS: Comparison of
commercial buildings benchmarking programs and the implications for policymakers. In Proceedings of
the American Council for an Energy Efficient Economy (ACEEE). Summer Study 2016. https://www.aceee.
org/files/proceedings/2016/data/papers/9_480.pdf
BBP. (2019). Design for performance. A new approach to delivering energy efficient offices in the UK. Better
Buildings Partnership (BBP). https://www.betterbuildingspartnership.co.uk/sites/default/files/media/
attachment/BBP_Design%20for%20Performance_A%20new%20approach%20to%20deliver%20
energy%20efficient%20offices.pdf
BEIS. (2019a). Leading on clean growth. The government response to the Committee on Climate Change’s
2019 Progress report to Parliament—Reducing UK emissions. Department for Business, Energy and
Industrial Strategy (BEIS). https://assets.publishing.service.gov.uk/government/uploads/system/uploads/
attachment_data/file/839555/CCS0819884374-001_Government_Response_to_the_CCC_Progress_
Report_2019_Web_Accessible.pdf
BEIS. (2019b). Helping businesses improve the way they use energy. Government response. Department for
Business, Energy and Industrial Strategy (BEIS). https://assets.publishing.service.gov.uk/government/
uploads/system/uploads/attachment_data/file/785850/helping-businesses-improve-way-use-energy-
govt-response.pdf
BEIS. (2021). Introducing a performance-based policy framework in large commercial and industrial buildings.
Department for Business, Energy and Industrial Strategy (BEIS). https://www.gov.uk/government/
consultations/introducing-a-performance-based-policy-framework-in-large-commercial-and-industrial-
buildings
Bleyl, J. W., Bareit, M., Casas, M. A., Chatterjee, S., Coolen, J., Hulshoff, A., Lohse, R., Mitchell, S., Robertson,
M., & Urge-Vorsatz, D. (2019). Office building deep energy retrofit: Life cycle cost benefit analyses using
cash flow analysis and multiple benefits on project level. Energy Efficiency, 12(1), 261–279. DOI: https://
doi.org/10.1007/s12053-018-9707-8
Bordass, B. (2020). Metrics for energy performance in operation: The fallacy of single indicators. Buildings &
Cities, 1(1), 260–276. DOI: https://doi.org/10.5334/bc.35
Bordass, B., Cohen, R., & Bannister, P. (2016). UK commitment agreements: Making measured energy in-use
the objective for new office buildings. https://www.betterbuildingspartnership.co.uk/sites/default/files/
media/attachment/UK%20CAP%20Feasibility%20Study%20Final%20Report%2017May16.pdf
Burt, L., Hinge, A., & Burr, A. (2015). Building energy rating & benchmarking: Understanding the similarities
and differences. In Proceedings of the European Council for an Energy Efficient Economy (ECEEE). Summer
Study 2015. https://www.eceee.org/library/conference_proceedings/eceee_Summer_Studies/2015
Businge, C., Borgarello, M., d’Amore, F., & Mazzoni, E. (2019). High and low energy efficiency
companies: Is there a competitiveness gap? In Proceedings of the European Council for an Energy
Efficient Economy Summer Study 2019. https://www.eceee.org/library/conference_proceedings/
eceee_Summer_Studies/2019/2-whats-next-in-energy-policy/high-and-low-energy-efficiency-
companies-is-there-a-competitiveness-gap-an-empirical-investigation-on-italian-manufacturing-firms/
Cassell, C., & Symon, G. (2004). Essential guide to qualitative methods in organizational research. SAGE. DOI:
https://doi.org/10.4135/9781446280119
CCC. (2018). Reducing UK emissions. 2018 Progress report to Parliament. Committee on Climate Change (CCC).
https://www.theccc.org.uk/wp-content/uploads/2018/06/CCC-2018-Progress-Report-to-Parliament.pdfCIE. (2019). Independent review of the Commercial Building Disclosure Program. Centre for International
Economics (CIE). http://www.cbd.gov.au/files/CBD%20Review%20CIE%20report%20draft.pdf
Cohen, R., Austin, B., Bannister, P., Bordass, B., & Bunn, R. (2017). How the commitment to disclose in-use
performance can transform energy outcomes for new buildings. Building Services Engineering Research
and Technology, 38(6), 711–727. DOI: https://doi.org/10.1177/0143624417711343
Cohen, R., & Bordass, B. (2015). Mandating transparency about building energy performance in use. Building
Research & Information, 43(4), 534–552. DOI: https://doi.org/10.1080/09613218.2015.1017416
DECC. (2012). What are the factors influencing energy behaviours and decision-making in the non-domestic
sector? A rapid evidence assessment. Department of Energy and Climate Change (DECC). https://assets.
publishing.service.gov.uk/government/uploads/system/uploads/attachment_data/file/65601/6925-what-
are-the-factors-influencing-energy-behaviours.pdf
Department of Climate Change and Energy Efficiency. (2012). Baseline energy consumption and
greenhouse gas emissions. In Commercial buildings in Australia. Commonwealth of Australia. https://
www.energy.gov.au/publications/baseline-energy-consumption-and-greenhouse-gas-emissions-
commercial-buildings-australia
Eichholtz, P., Kok, N., & Quigley, J. (2010). Doing well by doing good? Green office buildings. American
Economic Review, 100, 2492–2509. http://urbanpolicy.berkeley.edu/pdf/aer_revised_proof_101910.pdf.
DOI: https://doi.org/10.1257/aer.100.5.2492
Energy Action. (2016). Commitment agreements—UK feasibility review report. https://www.usablebuildings.
co.uk/UsableBuildings/Unprotected/BannisterCommitmentAgreement.pdf
Ernst & Young. (2015). Mid-tier commercial office buildings in Australia. https://www.gbca.org.au/
uploads/97/36449/Mid-Tier%20Commercial%20Office%20Buildings%20Pathway%20report.pdf
Fuerst, F., & McAllister, P. (2010). Green noise or green value? Measuring the effects of environmental
certification on office values. Real Estate Economics, 39(1), 45–69. DOI: https://doi.org/10.1111/j.1540-
6229.2010.00286.x
GABC, IEA & UNEP. (2019). 2019 Global status report for buildings and construction. Global Alliance for
Buildings and Construction (GABC), International Energy Agency (IEA) and United Nations Environment
Programme (UNEP). http://wedocs.unep.org/bitstream/handle/20.500.11822/30950/2019GSR.
pdf?sequence=1&isAllowed=y
Gabe, J., & Rehm, M. (2014). Do tenants pay energy efficiency rent premiums? Journal of Property Investment
& Finance, 32(4), 333–351. DOI: https://doi.org/10.1108/JPIF-09-2013-0058
Government of New South Wales. (1995). Sustainable Energy Development Act 1995 No. 96. https://
legislation.nsw.gov.au/view/pdf/asmade/act-1995-96
Government of New South Wales. (2008). Government sustainability policy. https://webarchive.nla.gov.au/
awa/20080903075240/http://pandora.nla.gov.au/pan/134384/20120530-1437/www.environment.nsw.
gov.au/resources/government/08453SustainabilityPolicy.pdf
GRESB. (2019). 2019 Real estate results. Global Real Estate Sustainability Benchmark (GRESB). https://gresb.
com/2019-real-estate-results/#global
Gunningham, N., & Sinclair, D. (1999). Regulatory pluralism: Designing policy mixes for environmental
protection. Law & Policy, 21, 49–76. DOI: https://doi.org/10.1111/1467-9930.00065
Hong, S.-M., Paterson, G., Burman, E., Steadman, P., & Mumovic, D. (2013). A comparative study of
benchmarking approaches for non-domestic buildings. Part 1: Top-down approach. International Journal
of Sustainable Built Environment, 2, 119–130. DOI: https://doi.org/10.1016/j.ijsbe.2014.04.001
IEA. (2014). Capturing the multiple benefits of energy efficiency. International Energy Agency (IEA). https://
webstore.iea.org/capturing-the-multiple-benefits-of-energy-efficiency
IPD & DOI. (2013). NABERS office energy analysis. Investment Property Databank & Department of
Industry (IPD/DOI). http://www.cbd.gov.au/sites/prod.cbd/files/NABERS-energy-office-market-analysis-
september-2013.pdf
IPEEC. (2014a). Buildings’ energy efficiency. Opportunities for international collaboration. International
Partnership for Energy Efficiency Collaboration (IPEEC). https://ipeec.org/upload/publication_related_
language/pdf/256.pdf
IPEEC. (2014b). Building energy rating schemes. Assessing issues and impacts. International Partnership for
Energy Efficiency Collaboration (IPEEC). https://ipeec.org/upload/publication_related_language/pdf/1056.
pdf
IPEEC. (2017). Existing building energy efficiency renovation. International review of regulatory policies.
International Partnership for Energy Efficiency Collaboration (IPEEC). https://ipeec.org/upload/
publication_related_language/pdf/651.pdf
Janda, K., & Topouzi, M. (2015). Telling tales: Using stories to remake energy policy. Building Research &
Information, 43(4), 516–533. DOI: https://doi.org/10.1080/09613218.2015.1020217Kern, F., Kivimaa, K., Rogge, K., & Rosenow, J. (2018). Policy mixes for sustainable energy transitions: The Mallaburn et al. 334
Buildings and Cities
case of energy efficiency. In K. Jenkins & D. Hopkins (Eds.), Transitions in energy efficiency and demand.
DOI: 10.5334/bc.114
The emergence, diffusion and impact of low-carbon innovation (pp. 215–234). Routledge. DOI: https://doi.
org/10.4324/9781351127264
Liddiard, R., Wright, A., & Marjanovic-Halburd, L. (2008). A review of non-domestic energy benchmarks
and benchmarking methodologies. In Proceedings of the 5th International Conference on Improving
Energy Efficiency in Commercial Buildings, Vol. 1. https://op.europa.eu/en/publication-detail/-/publication/
c7d108ea-ccdd-424e-b37a-435f5d99a134/language-en/format-PDF/source-search
Mallaburn, P. (2018). Principles of successful non-residential energy efficiency policy. In Proceedings of the
European Council for an Energy Efficient Economy (ECEEE). Summer Study 2018 (pp. 15–22). https://
www.eceee.org/library/conference_proceedings/eceee_Industrial_Summer_Study/2018/1-policies-and-
programmes-to-drive-transformation/principles-of-successful-non-residential-energy-efficiency-policy/
Mallaburn, P., & Eyre, N. (2014). Lessons from energy efficiency policy and programmes in the UK from 1973
to 2013. Energy Efficiency, 7, 23–41. DOI: https://doi.org/10.1007/s12053-013-9197-7
Mallaburn. P. S., Oreszczyn, T., Elwell, C., Hamilton, I., Heubner, G., & Lowe, R. (2019). Reducing energy
demand from buildings. In N. Eyre and G. Killip (Eds.), Shifting the focus: Energy demand in a net-zero
carbon UK. Centre for Research into Energy Demand Solutions (pp. 19–32). Oxford.
MHCLG. (2013). Energy performance commitment guidance. Ministry of Housing, Communities and Local
Government (MHCLG). https://www.gov.uk/government/collections/energy-performance-certificates
NABERS. (2016). NABERS annual report 2015/16. Building grade analysis. National Australian Built
Environment Rating System (NABERS). https://nabers.info/annual-report/2015-2016/building-grade-
analysis.html
NABERS. (2020). NABERS annual report 2019/20. National Australian Built Environment Rating System
(NABERS). https://nabers.info/annual-report/2019-2020/
NABERS. (2021). NABERS UK. National Australian Built Environment Rating System (NABERS). https://www.
nabers.gov.au/about/nabers-international/uk
Newell, G., MacFarlane, J., & Kok, N. (2011). Building better returns: A study of the financial performance of
green office buildings in Australia. https://www.buildingrating.org/document/building-better-returns-
study-financial-performance-green-office-buildings-australia
Newell, G., MacFarlane, J., & Walker, R. (2014). Assessing energy rating premiums in the performance of
green office buildings in Australia. Journal of Property Investment & Finance, 32(4), 352–370. DOI: https://
doi.org/10.1108/JPIF-10-2013-0061
Ostwald, C., Stuart, A., Yeung, B., & Pearse, S. (2015). Achieving A-grade office space in the Parramatta CBD.
https://www.cityofparramatta.nsw.gov.au/sites/council/files/inline-files/Appendix_8_Economic_Review_
Achieving_A-Grade_Office_Space_in_the_Parramatta_CBD_2015.pdf
Palmer, K., & Walls, M. (2017). Using information to close the energy efficiency gap: A review of
benchmarking and disclosure ordinances. Energy Efficiency, 10, 673–691. DOI: https://doi.org/10.1007/
s12053-016-9480-5
Pears, A. (1998). Rating energy efficiency of non-residential buildings: A path forward for New South Wales.
Report for the Sustainable Energy Development Authority (SEDA). Provided by the author.
Pears, A., Gilchrist, G., Gordon, A., Isaacs, N., & Bannister, P. (1999). Where angels fear to tread. SEDA’s
office building greenhouse rating scheme. Paper presented at the ANZSES Solar 99 Conference, Deakin
University, Geelong, VIC, Australia. Provided by the author.
RAP. (2020). Filling the policy gap: Minimum energy performance standards for European buildings. Regulatory
Assistance Project (RAP). https://www.raponline.org/knowledge-center/filling-the-policy-gap-minimum-
energy-performance-standards-for-european-buildings/
Rosenow, J., Fawcett, T., Eyre, N., & Oikonomou, V. (2016). Energy efficiency and the policy mix. Building
Research & Information, 44(5–6), 562–574. DOI: https://doi.org/10.1080/09613218.2016.1138803
Ürge-Vorsatz, D., Reith, A., Korytárová, K., Egyed, M., & Dollenstein, J. (2015). Monetary benefits of
ambitious building energy policies. Global Building Performance Network. http://publications.ceu.edu/
sites/default/files/publications/lowcmbabep.pdf
Warren-Myers, G. (2018). Valuing sustainability in commercial property in Australia. In S. Wilkinson, Dixon, T.,
Miller, N., & Sayce, S. (2018). Handbook of sustainable real estate (pp. 95–113). Routledge. DOI: https://
doi.org/10.1201/9781315622750
WGBC. (2018). Doing right by planet and people. The business case for health and wellbeing in green building.
World Green Building Council (WGBC). https://www.worldgbc.org/sites/default/files/WorldGBC%20-%20
Doing%20Right%20by%20Planet%20and%20People%20-%20April%202018_2.pdf
Wiese, C., Larsen, A., & Pade, L.-L. (2018). Interaction effects of energy efficiency policies: A review. Energy
Efficiency, 11, 2137–2156. DOI: https://doi.org/10.1007/s12053-018-9659-zYou can also read