Impact of COVID-19 on the Real Estate Market (Tenth in a Series) April 24, 2020 - Goldman Sachs
←
→
Page content transcription
If your browser does not render page correctly, please read the page content below
Consumer and Investment Management Division

  Impact of COVID-19 on the Real Estate Market
  (Tenth in a Series)

  April 24, 2020

      Investment Strategy Group
This material represents the views of the Investment Strategy Group (“ISG”) in the Consumer and Investment Management Division of Goldman Sachs. It is not a product of
Goldman Sachs Global Investment Research. The views and opinions expressed herein may differ from those expressed by other groups of Goldman Sachs.
Overview of Today’s Call
Update on COVID-19
Performance of Public Real Estate
Impact of COVID-19 on the Real Estate Market
– Alan Kava, Co-Head of the Merchant Banking Division (MBD) Real Estate Group in
the Americas, Goldman Sachs
– Ralph Rosenberg, Global Head of Real Estate at KKR
– Roy March, Chief Executive Officer at Eastdil Secured
Source: Investment Strategy Group. 2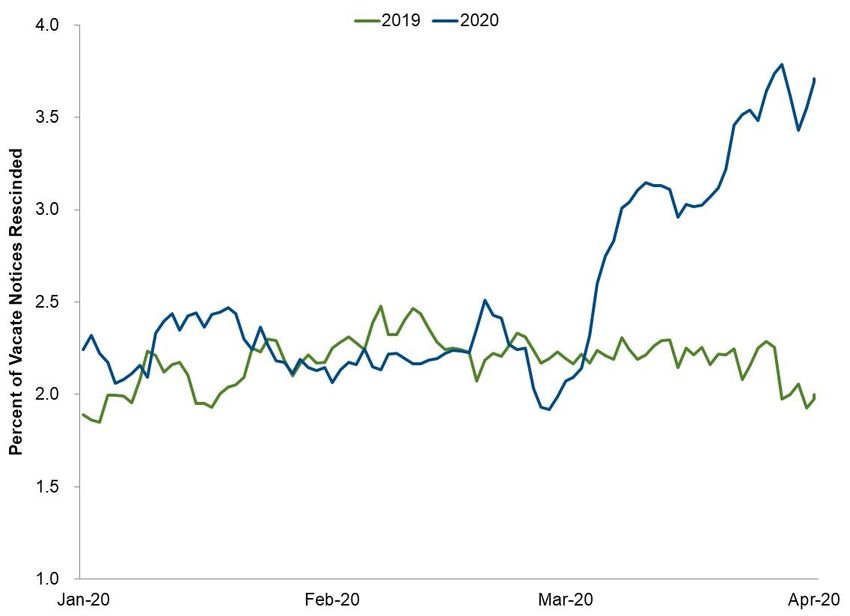
Speaker Introduction: Alan Kava, Goldman Sachs

                    Alan Kava                                                                            Speaker Overview
                                                          o    Co-head of the Merchant Banking Division (MBD) Real Estate Group in the Americas.

                                                          o    Responsible for the design and implementation of MBD’s real estate investment strategy in the Americas.

                                                          o    Member of the MBD Real Estate Investment, Urban Investment Group Investment, Private Real Estate
                                                               Investment and Firmwide Investment Policy Committees.

                                                                                       Goldman Sachs MBD Real Estate Overview

                                                          o    Over 25 years of experience across global markets, property types, risk profiles, capital structures and
                                                               investment cycles. Invested $50bn in real estate equity and debt strategies1 since 2012.

                                                          o    MBD Real Estate Stats: ~$38bn in AUM across real estate equity and credit2, 18 offices in 13 countries, over
                                                               300 dedicated real estate professionals3

                                                          o    Investment Strategies (US, EMEA, and Asia):

                                                          o    Real Estate Private Equity: Core, Income and Value-Oriented, Opportunistic, Development

                                                          o    Real Estate Private Credit: Senior Credit, Mezzanine Loans, Non-Performing Loans

1. MBD Real Estate reflects the integration of the MBD, UIG, GSSG, GSAM PRE, as announced in June 2019 and effective on August 26, 2019. Figures as of December 31, 2019 and
exclude GSAM Japan. 2. As of December 31, 2019, reflects integration of MBD, GSSG, and other business areas.                                                                   3
Source: Investment Strategy Group.
Speaker Introduction: Ralph Rosenberg, KKR

              Ralph Rosenberg                                                       Speaker Overview
                                         o   Global Head of KKR's Real Estate Platform; joined KKR in 2011.

                                         o   Prior to joining KKR, Mr. Rosenberg was a partner at Eton Park Capital Management and also managed his
                                             own firm, R6 Capital Management, which later merged into Eton Park.

                                         o   Partner at Goldman Sachs until 2006.

                                                                                       KKR Overview
                                         o   KKR has been a global provider of equity and debt across real estate investment strategies since 1981

                                         o   Company Stats: (1) $12.7bn in AUM globally ($9.9bn in Americas, $1.5bn in Europe, $1.3bn in Asia), (2) 85
                                             professionals across 11 cities (3) own or lend on $68bn of real estate assets based on asset value and
                                             collateral value.

                                         o   Investment Strategies:

                                             o   Value Add & Opportunistic Equity: US and European Investment Funds

                                             o   Real Estate Credit: Senior Mortgage (Ticker: KREF), Junior Tranche CMBS

Source: Investment Strategy Group, KKR                                                                                                                   4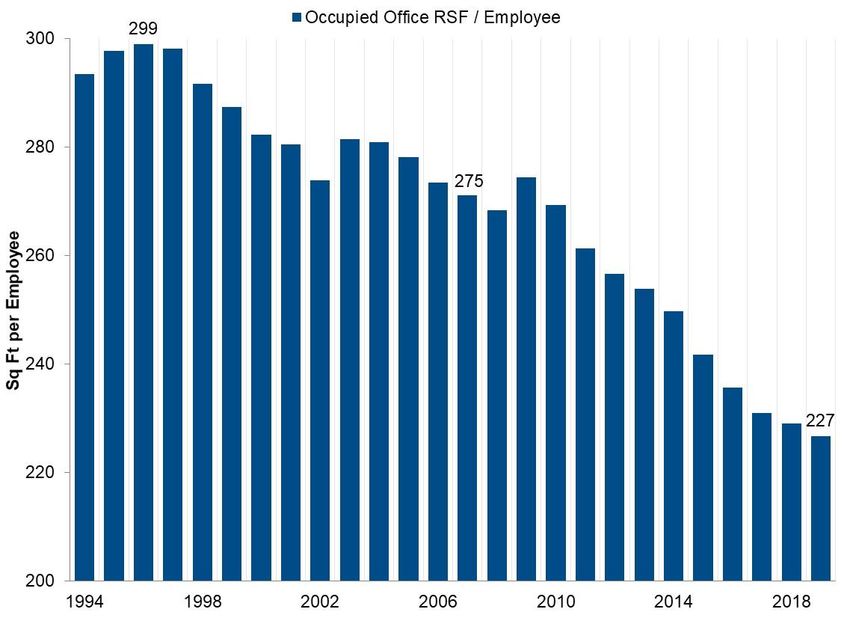
Speaker Introduction: Roy March, CEO Eastdil Secured

                   Roy March                                                                            Speaker Overview
                                                          o   CEO of Eastdil Secured, L.L.C., the leading real estate investment banking company in the United States.

                                                          o   More than 42 years of real estate experience at Eastdil Secured across financing, sales, acquisition, and
                                                              capital markets activities in the United States, Europe, and East Asia.

                                                          o   Founded in 1967, Eastdil was the first real estate investment banking firm in the United States. The New York
                                                              based firm has been involved in over $2.3 trillion in transactions since 2007.

                                                                                                         Eastdil Overview
                                                          o   Eastdil Secured is a leading private real estate investment banking company with the mission to create value
                                                              for our clients, and to be the most relevant and trusted advisor in the commercial real estate capital markets.

                                                          o   In 2019, Eastdil Secured has completed over $170 billion of global capital market transactions, including the
                                                              $18.7 billion industrial portfolio sale for Global Logistics Partners, which is the largest private market sale in
                                                              U.S. history.

Source: Investment Strategy Group, Eastdil Secured LLC.                                                                                                                            5
SARS-CoV-2 Pandemic Timeline

* As of April 22, 2020                                                                                                                          6
Source: Investment Strategy Group, WHO, CDC, National Health Commission of People’s Republic of China, John Hopkins University, Worldometers.

Pandemic Appears to be Slowing Down in the United States

1. United States Daily New Cases                                                    2. New York Daily New Cases

                                                                                  40,000
40,000
                                                                                  35,000
35,000
                                                                                  30,000
30,000
                                                                                  25,000
25,000
                                                                                  20,000
20,000
                                                                                  15,000
15,000
                                                                                  10,000
10,000
                                                                                   5,000
 5,000
                                                                                      0
     0
                                                                                       08-Mar              23-Mar   07-Apr   22-Apr
    21-Jan-20         13-Feb-20         07-Mar-20         30-Mar-20   22-Apr-20

  • While the number of new daily infections remains high in the United States, the pandemic appears to have plateaued
    and may now be on a downward trajectory.

  • In New York state, which accounts for over a third of total US confirmed infections, new cases of infections appear
    to have peaked and are generally decreasing now.

* As of April 22, 2020                                                                                                          7
Source: Investment Strategy Group, Worldometers, Washington Post
Light at the end of a Long Tunnel in Europe
1. Italy New Infections 2. Spain New Infections
9,000 9,000
8,000 8,000
7,000 7,000
6,000 6,000
5,000 5,000
4,000 4,000
3,000 3,000
2,000 2,000
1,000 1,000
0 0
23-Feb-20 23-Mar-20 21-Apr-20 02-Mar-20 27-Mar-20 21-Apr-20
• Italy and Spain, two of the top three nations globally with most cases of reported infections and fatalities, appear to
have contained the outbreak.
• In parts of Europe like Germany, lockdowns and social distancing measures are now gradually being relaxed.
* As of April 22, 2020 8
Source: Investment Strategy Group, Worldometers, WHOPerformance of US and Global Public Real Estate
1. Year-to-Date US REIT Total Returns Versus S&P 500 2. Year-to-Date Performance of International REITs
Wilshire REIT Index S&P 500 US Homebuilders 0%
20%
10% -5%
0% -10%
Year to Date USD Return (%)
Year-to-Date Total Return (%)
-10% -15%
-12.9%
-20% -19%
-20%
-24.1%
-30% -29.9% -25%
-26%
-28% -28%
-40% -30%
-33%
-50% -35%
Dec-19 Jan-20 Feb-20 Mar-20 Asia Ex-Japan Japan Europe Ex-U.K. Overall United Kingdom
US REITs have underperformed the S&P 500 by more than 11% year-to-date; deterioration of the macro backdrop has
translated to slowing demand, potential tenant bankruptcies, and a deteriorating financing environment.
Homebuilders have also underperformed; Goldman Sachs Global Investment Research (GIR) expects a 23% qoq
decline in housing starts in Q2, from an annualized rate of 1.47 million in Q1 to 1.13 million in Q2.
REITs have underperformed equity benchmarks across other developed markets as well; a global REIT benchmark 1 is
down nearly 28.0% (in USD terms) year-to-date, relative to the MSCI World index at -15.7%.
1. FTSE EPRA NAREIT Developed REIT Index. For the US, performance is calculated using the Wilshire REIT index. For international markets, performance is computed using the
regional components of the FTSE EPRA NAREIT Developed REIT Index. Data as of Apr 23, 2020. 9
Source: Investment Strategy Group, Bloomberg, Factset.Sizable Dispersion in Performance Across Sectors
Year-to-Date Performance, US REIT Sectors
30%
21%
20%
13%
10%
0%
Year-to-Date Return (%)
-10% -7%
-20%
-22%
-30% -28%
-40%
-50%
-51%
-54%
-60%
-62%
-70%
Datacenters Towers Industrial Apartment Office Shop. Hotels Malls
Center
Considerable dispersion in sector performance; malls, shopping centers and hotels that were severely affected by
COVID-19 underperformed, as well as companies with higher leverage and shorter lease terms.
Newer non-core REIT sectors such as datacenters and towers have outperformed, along with industrials/warehouses
which benefit from a physical to digital transition.
Performance based on Bloomberg US REIT Sector indices except Datacenters and Towers where a basket of companies was used to calculate year to date returns for the sector.
10
Source: Investment Strategy Group, Bloomberg, Factset. Data as of Apr 23, 2020US REITs Seem Fairly Valued Relative to Equities, but
Cheap vs. Fixed Income
1. Earnings Yield of US REITs Versus S&P 500 Index 2. Spread of Implied Cap Rates1 to Baa Corporate Bond Yields
14% S&P 500 US REITs Cap Rate Spread to Baa Bond Yields Average
3.5%
3.0%
12%
2.8%
2.5%
1-Year Forward Earnings Yield (%)
Cap Rate Spread to Baa Bond Yields
10%
2.0%
1.5%
8%
1.0%
0.8%
6%
5.5% 0.5%
5.2%
4% 0.0%
-0.5%
2%
-1.0%
0% -1.5%
Feb-93 Feb-97 Feb-01 Feb-05 Feb-09 Feb-13 Feb-17 Feb-98 Feb-02 Feb-06 Feb-10 Feb-14 Feb-18
The Adjusted Funds From Operations (“AFFO”) yield to price for REITs, a measure akin to the earnings yield for the
S&P 500, stands at 5.2%, which is inline to the S&P 500 earnings yield of 5.5% measured on a 1-year forward basis.
The spread between the cap rate implied by REIT prices 1 and other measures of yield such as the spreads of Baa
corporate bonds stands at its highest levels relative to history.
1. For implied cap rates, each of the five major sectors is given a 20% weight; weighting within each sector is based on total public market value of assets (i.e., market cap + debt). Other
assets are assumed to experience the same percentage change in value as operating real estate.
11
Source: Investment Strategy Group, Green Street Research. Data as of Apr 20, 2020Elevated CMBS Spreads and Rising Late Payment Rates
Among Commercial Mortgages
1. CMBS Spreads to Swaps, by Rating (bps) 2. Late Payment Rate1 on 2012-2020 Vintage US CMBS (From GIR)
1400 AAA AA A BBB- %Transaction Volume in Capital Markets
1. US Commercial Real Estate Transaction Volume – 2020 Versus Prior Years1 2. GIR Year-to-Date US CMBS Volume, 2020 Versus 20192
2017 2018 2019 2020 2019 YTD 2020 YTD
40 110
36.3 36.1
100
35
90
29.8
US CRE Transaction Volume ($ bn)
30 29.1 28.8
28.4 27.9 28.1 80
26.4
US CMBS Issuance ($ bn)
25 70
22.2 22.7
20.5 60
20
50
15
12.6 40
9.6 30
10
7.6
20
5
1.9 10
0 0
January February March April Jan Feb Mar Apr May Jun Jul Aug Sep Oct Nov Dec
COVID-19 has contributed to a slowdown in private real estate transaction volume. Equity transaction volume has
materially declined since the spread of the virus.
The debt capital markets have also come to a dramatic halt, especially in the CMBS space, and any new loan
issuances have been executed at much wider spreads.
1. Reflects combined retail, industrial, multifamily, and office volume. Data as of April 21, 2020. 2. Data as of April 23, 2020.
Source: Investment Strategy Group, GS MBD, Costar, GS Investment Research 13Cap Rates
US Commercial Real Estate Cap Rates1
Although it is too early to determine the impact of COVID-19 on cap rates, the prior cycle demonstrated that stressed
market environments can result in temporary periods of dislocation where cap rates widen, but then return to historic
downward trajectory in line with a declining interest rate environment.
1. Cap rates are shaded by distance from trailing average to identify trend. Includes industrial assets selling for at least $5 million. Data as of April 6, 2020
Source: Investment Strategy Group, GS MBD, Costar. 14Hospitality Sector
1. US Hotel Occupancy Rates – Last 28 Days Versus 20191 2. US Hotel RevPAR Rates – Last 28 Days Versus 20191
2019 Last 28 Days 2019 Last 28 Days
90% $250
230
80% 77% 78%
75% 74% 75%
Revenue Per Available Room (RevPAR)
69% $200
70% 68%
61% 61%
60%
Occupancy Rate (%)
$150 142 144
50%
-68%
108
40%
35% $100 94 90
30% 77
25% 26%
24%
22% 57 -81%
20% 17% 45
15% $50
12%
9% 20
10% 17 18 18 19 17
14 14 12
0% $0
Luxury Upscale Midscale Economy Urban Suburban Airport Resort Overall US Luxury Upscale MidscaleEconomy Urban Suburban Airport Resort Overall US
Class of Hotel Location of Hotel Class of Hotel Location of Hotel
Most global travel has ground to a halt. Trailing 28-day hotel occupancy across the US has dipped materially to 22%
as of April 22, 2020 from 68% in 2019.
Many hotel owners are choosing to close hotels, with over half of Manhattan hotels currently closed.
1. Data compares occupancy and RevPAR for the last 28 days ending April 22, 2020 relative to the same period in 2019.
15
Source: Investment Strategy Group, GS MBD, STR. Data as of April 22, 2020.Retail Sector
1. Retail Store Closures (mm sq. ft)1 2. Retail Sales Growth Pre and Post-COVID-192
200 40% March (2020) March (2014-2019)
Pace Going Into March
30% 28.0%
180
171
20%
160
9.7% 10.5%
10% 6.0%
3.2% 3.7% 3.5% 1.8%
140
0%
Millions, Square Feet
-1.3% -1.4% -1.1%
YoY (%)
120 -10% -6.2%
100 -20% -15.9%
-18.0%
-22.7% -23.0%
-30% -24.6%
80 155
-40%
60
114
105 -50%
-50.7%
40 83
-60%
Beverage
Online
Gas Stations
Electronics
Book & Music
Clothing
Drinking Places
Total
Furniture, Home
Food &
Food Svcs &
Furnishings
20
Sports,
40
0
2016 2017 2018 2019 2020
Prior to COVID-19, retail was experiencing signs of distress as declining sales have led stores to permanently close.
In fact, before COVID-19, 2020 was expected to have 171mm SF of store closures, more than prior years.
COVID-19 has exacerbated declining retail sales, with the exception of food and beverage (mostly grocery stores) and
online retail, as many retailers are forced to close temporarily.
1. Estimate for 2020 based on announced store closures. Data as of Feb 29, 2020. 2. Note that Food & Beverage is mostly grocery stores. Data as of March 2020. 16
Source: Investment Strategy Group, GS MBD, Costar.Industrial Sector
1. Vacant/Available Square Footage (% of Total) for Logistics Real Estate 1 2. E-Commerce Growth in Industrial Space Pre-COVID2
12% Logistics Availability Rate (%) 5-Year Average Major E-commerce Players
3PL (Couriers/Freight Transport/Warehousing And Storage)
250 Non E-commerce 70%
E-commerce And 3PL Share Of Logistics Absorption
10% 64%
60%
Vacant Available Sq Footage % Total
200
Share of Logistics Absorption
8%
Net Absorption Sq Ft (million)
50%
150 39% 40%
6%
4.7% 34%
30%
100
4%
26%
22% 20%
20%
50
2%
10%
0% - 0%
02 Q1 04 Q1 06 Q1 08 Q1 10 Q1 12 Q1 14 Q1 16 Q1 18 Q1 20 Q1 2014 2015 2016 2017 2018 2019
Although supply chains have been disrupted, industrial real estate has continued to see tight vacancy levels.
Availability rate for the sector stood at 4.8% at the end of Q1 2020, inline with its 5-year average.
In addition, e-commerce prior to COVID-19 had already been benefiting from the continued growth of e-commerce,
with e-commerce representing 64% of logistics absorption in 2019.
1. Data reflects logistics availability rate as of April 23, 2020 2. Data as of Dec 31, 2019. 17
Source: Investment Strategy Group, GS MBD, Cushman & Wakefield, Costar, CBREOffice Sector
1. US Quarterly Office Leasing Activity1 2. Occupied Office SF per Employee in NYC2
90
80
70
60
50
MSF
40
30
20
10
0
2008 Q1 2010 Q1 2012 Q1 2014 Q1 2016 Q1 2018 Q1 2020 Q1
Office leasing in the second half of Q1 2020 has decreased sharply, with total leasing nationally for the quarter at
61mm SF.
Of note, New York City’s total office leasing of 4.5mm SF was the lowest experienced in at least 25 years.
Although it’s too soon to determine how COVID-19 will impact office space use going forward, there has been a trend
towards consolidation this cycle, with office space per employee decreasing over 17% (~50 SF) since 2009 in New
York City, as a proxy.
1. Data as of April 17, 2020. 2. Data as of Year End 2019. 18
Source: Investment Strategy Group, GS MBD, Cushman & Wakefield, JLL, Hodges Ward Elliot, REIS, ny.labor.govMultifamily Sector
1. US April Multifamily Rent Collections1 2. Percentage of Vacate Notices Rescinded2
April 2019 March 2020 April 2020
95%
93% 93%
91%
90%
90% 89%
85% 84%
% of Rent Payments Made
82%
81%
80%
75%
70% 69%
65%
60%
By 5th of Month By 12th of Month By 19th of Month
Multifamily rent collections were expected to be low due to a historic spike in unemployment. However, as of April
19th, 89% of apartment households made a full/partial rent payment, only slightly lower than 2019’s rate of 93%.
As in-person tours are not possible, COVID-19 has contributed a temporary slowdown in leasing activity with 36%
fewer leases in April 2020 compared to 20192.
However, more residents are choosing to renew their leases instead of vacating, helping preserve property occupancy.
1. Data is collected from 11.5 million apartment units. Data are collected weekly, with the first data collection happening the 1st through the 5th, followed by the 6th through the 12th, 13th
through the 19th and so on for the remainder of each month. Data as of April 19, 2020. 2. Data sourced from Realpage and based on US property management database. Reflects
rolling count of renters who decide to renew and rescind their vacate notices. Data as of April 18, 2020. 19
Source: Investment Strategy Group, GS MBD, NMHC, Realpage.State of the Market?
“Alphabet Leads Tech Retreat on Real
Estate Deals”
– The Information, April 21, 2020
“SL Green’s $815 Million Deal to Sell
New York City Office Tower Falls Apart”
– Wall Street Journal, March 24, 2020
“Blackstone Abandons $20 Million
Deposit on Scrapped Office Deal”
– Bloomberg, April 1, 2020
20
Source: Investment Strategy Group.Less Use of Office Space?
21
Source: Investment Strategy Group.Consumer and Investment Management Division Disclosures
Consumer and
                                                                                                                                                                             Investment
    Important Information                                                                                                                                                   Management
                                                                                                                                                                                Division

Thank you for reviewing this presentation. Please review the important information below.
Our Relationship with Clients. Depending on our relationship with you, we may act as an advisor, a broker-dealer, or both. Our role and obligations vary depending on the capacity in which we act.
Where we act as an advisor, our primary role is to give you advice, help you manage your investments or, where applicable, help you hire another advisor to do so. Where we act as a broker, our
primary role is to execute trades for you based on your instructions and any advice we give you is incidental to our brokerage services. How we are compensated by you (and sometimes by issuers or
managers of investments who compensate us based on what you buy) and how your Private Wealth Management (“PWM”) team is compensated may change over time and will vary depending on
various factors including, but not limited to, whether you are classified as a professional or retail client, have an advisory or brokerage account, and on the investments made in your account. Please
ask us questions to make sure you understand your rights and our obligations to you, the difference between advisory and brokerage accounts, and / or how we are compensated based on the
capacity in which we act. We are part of a full-service, integrated investment banking, investment management, and brokerage firm. Other firm businesses may implement investment strategies that
are different from the strategies used or recommended for your portfolio.
Entities Providing Services. Investment advisory services may be provided by Goldman Sachs & Co. LLC (“GS&Co.”), an affiliate, or an external manager under the wrap program sponsored by
GS&Co. Brokerage services are provided by GS&Co., member Financial Industry Regulatory Authority (“FINRA”) / Securities Investor Protection Corporation (“SIPC”). Brokerage services, banking
services (including check-writing, debit cards, direct debit, direct deposit, electronic bill pay, overdraft protection and Bank to Bank Transfers via ACH), custody, margin loans and strategic wealth
advisory services are provided by GS&Co. Financial counseling services are provided by The Ayco Company, L.P. Over-The-Counter (“OTC”) derivatives, foreign exchange forwards and related
financing are offered by GS&Co. Trust services are provided by The Goldman Sachs Trust Company, N.A. or The Goldman Sachs Trust Company of Delaware. All of these affiliated
entities are subsidiaries of The Goldman Sachs Group, Inc. (“Firm” or “GS”). Deposit products, mortgages, and bank loans are offered by Goldman Sachs Bank USA, member Federal
Deposit Insurance Corporation (“FDIC”) and an Equal Housing Lender.
GS&Co. may provide family office services to clients (“Family Office Services”). Some Family Office Services may be provided by GS&Co. and/or its affiliates; other Family Office Services may be
provided by subcontractors, independent service providers, or other third parties (collectively, “Third Party Vendors”), who are not acting as financial or investment advisors. The scope, duration,
deliverables, assigned personnel, referrals to Third Party Vendors, and delivery channels through which Family Office Services are provided will vary among clients, based upon the facts, requested
services, circumstances, personal financial goals, net worth, complexity, and/or needs of each client. Third Party Vendor services are wholly independent of those provided by GS&Co. and additional
terms of service may apply for clients entering into any separate agreements with Third Party Vendors in furtherance of Family Office Services.
Investment Strategy Group (“ISG”). ISG is focused on asset allocation strategy formation and market analysis for PWM. ISG material represents the views of ISG in the Consumer Investment
Management Division (“CIMD”) of GS. It is not financial research or a product of GS Global Investment Research (“GIR”) and may vary significantly from those expressed by individual portfolio
management teams within CIMD, or other groups at Goldman Sachs. It was not prepared in compliance with applicable provisions of law designed to promote the independence of financial analysis
and is not subject to a prohibition on trading following the distribution of financial research. If shown, ISG Model Portfolios are provided for illustrative purposes only. Your actual asset allocation may
look significantly different based on your particular circumstances and risk tolerance. If a model performance calculation is provided, it assumes that (1) each asset class was owned in accordance
with the recommended weight; (2) all tactical tilts were implemented at the time the recommendation was made; and (3) the portfolio was rebalanced every time a tactical tilt change was made and at
the end of every quarter (unless a tactical tilt was made within a month of quarter-end). If model performance is shown, it is calculated using the daily returns (actual or interpolated) of indices that ISG
believes are representative of the asset classes included in the model. Results shown reflect the total return but generally do not take into account any investment management fees, commissions or
other transaction expenses, which would reduce returns. The results shown reflect the reinvestment of dividends and other earnings. All returns are pre-tax and are not adjusted for inflation. Additional
information about the model portfolio performance calculation, including asset class benchmarks used for modeling performance and a history of tactical tilts, is available upon request.
Investment Risks and Information. Risks vary by the type of investment. Additional information regarding investments and risks may be available in applicable product materials. Before transacting
or investing, you should review and understand the terms of a transaction/investment and the nature and extent of the associated risks, and you should be satisfied the investment is appropriate for
you in light of your individual circumstances and financial condition.
•   Alternative Investments. Alternative investments may involve a substantial degree of risk, including the risk of total loss of an investor’s capital and the use of leverage, and may not be
    appropriate for all investors. Private equity, private real estate, hedge funds, and other alternative investments structured as private investment funds are subject to less regulation than other types
    of pooled vehicles and liquidity may be limited. You should review the Offering Memorandum, the Subscription Agreement, and any other applicable offering documents for risks, potential conflicts
    of interest, terms and conditions and other disclosures.
•   Commodities. Commodity investments may be less liquid and more volatile than other investments. The risk of loss in trading commodities can be substantial due, but not limited, to volatile
    political, market and economic conditions. An investor’s returns may change radically at any time since commodities are subject to abrupt changes in price. Commodity prices are volatile because
    they respond to many unpredictable factors including weather, labor strikes, inflation, foreign exchange rates, etc. In a single account, because your position is leveraged, a small move against
    your position may result in a large loss. Losses may be larger than your initial deposit. No representation is made regarding the suitability of commodity investments.
                                                                                                                                                                                                        23
Consumer and
Investment
Important Information Management
Division
• Currencies. Currency exchange rates can be extremely volatile, particularly during times of political or economic uncertainty. There is a risk of loss when an investor has exposure to foreign
currency or holds foreign currency traded investments.
• Over-the-Counter (“OTC”) Derivatives You should carefully review the Master Agreement, including any related schedules, credit support documents, addenda and exhibits. You may be
requested to post margin or collateral at levels consistent with the internal policies of GS to support written OTC derivatives. Prior to entering into an OTC derivative transaction you should be
aware of the below general risks associated with OTC derivative transactions:
- Liquidity Risk: There is no public market for OTC derivative transactions and, therefore, it may be difficult or impossible to liquidate an existing position on favorable terms.
- Risk of Inability to Assign: OTC derivative transactions entered into with one or more affiliates of Goldman Sachs cannot be assigned or otherwise transferred without Goldman Sachs’ prior
written consent and, therefore, it may be impossible for you to transfer any OTC derivative transaction to a third party.
- Counterparty Credit Risk: Because Goldman Sachs may be obligated to make substantial payments to you as a condition of an OTC derivative transaction, you must evaluate the credit risk of
doing business with Goldman Sachs. Depending on the type of transaction, your counterparty may be Goldman Sachs & Co. LLC, a registered U.S. broker-dealer, or other affiliate of The
Goldman Sachs Group, Inc. As a broker dealer regulated by the Securities and Exchange Commission (“SEC”), Goldman Sachs & Co. LLC is subject to net capital, financial responsibility
rules, and other regulatory requirements designed to protect customer assets. Other subsidiaries of The Goldman Sachs Group, Inc. may not be registered as a U.S. broker dealer and
therefore are not be subject to similar SEC regulation.
- Pricing and Valuation: The price of each OTC derivative transaction is individually negotiated between Goldman Sachs and each counterparty and Goldman Sachs does not represent or
warrant that the prices for which it offers OTC derivative transactions are the best prices available. You may therefore have trouble establishing whether the price you have been offered for a
particular OTC derivative transaction is fair. OTC derivatives may trade at a value that is different from the level inferred from interest rates, dividends and the underlyer. The difference may
be due to factors including, but not limited to, expectations of future levels of interest rates and dividends, and the volatility of the underlyer prior to maturity. The market price of the OTC
derivative transaction may be influenced by many unpredictable factors, including economic conditions, the creditworthiness of Goldman Sachs, the value of any underlyers, and certain
actions taken by Goldman Sachs.
- Early Termination Payments: The provisions of an OTC derivative transaction may allow for early termination and, in such cases, either you or Goldman Sachs may be required to make a
potentially significant termination payment depending upon whether the OTC derivative transaction is in-the-money at the time of termination.
- Indexes: Goldman Sachs does not warrant, and takes no responsibility for, the structure, method of computation or publication of any currency exchange rates, interest rates, indexes of such
rates, or credit, equity or other indexes, unless Goldman Sachs specifically advises you otherwise.
• Emerging Markets and Growth Markets. Emerging markets and growth markets investments involve certain considerations, including political and economic conditions, the potential difficulty of
repatriating funds or enforcing contractual or other legal rights, and the small size of the securities markets in such countries coupled with a low volume of trading, resulting in potential lack of
liquidity and price volatility.
• Equity Investments. Equity investments are subject to market risk. The value of the securities may go up or down in respect to the prospects of individual companies, particular industry sectors
and/or general economic conditions. The securities of small and mid-capitalization companies involve greater risks than those associated with larger, more established companies and may be
subject to more abrupt or erratic price movements.
• Fixed Income. Fixed income securities investments are subject to the risks associated with debt securities generally, including credit/default, liquidity and interest rate risk. Any guarantee on an
investment grade bond of a given country applies only if held to maturity.
• Master Limited Partnerships ("MLPs"). MLPs may be generally less liquid than other publicly traded securities and as such can be more volatile and involve higher risk. MLPs may also involve
substantially different tax treatment than other equity-type investments, and such tax treatment could be disadvantageous to certain types of retirement accounts or charitable entities.
• Money Market Funds. Money market fund investments are not insured or guaranteed by the Federal Deposit Insurance Corporation or any other government agency. Although money market
funds seek to preserve the value of your investment at $1.00 per share, it is possible to lose money.
• Non-US Securities. Non-US securities investments involve the risk of loss as a result of more or less non-US government regulation, less public information, less liquidity, and greater volatility in
the countries of domicile of the issuers of the securities and/or the jurisdiction in which these securities are traded. In addition, investors in securities such as ADRs/GDRs, whose values are
influenced by foreign currencies, effectively assume currency risk.
• Options. Options involve risk and are not suitable for all investors. The purchase of options can result in the loss of an entire investment and the risk of uncovered options is potentially unlimited.
You must read and understand the current Options Disclosure Document before entering into any options transactions. The booklet entitled Characteristics and Risk of Standardized Options can
be obtained from your PWM team or at http://www.theocc.com/about/publications/character-risks.jsp. A secondary market may not be available for all options. Transaction costs may be significant
in option strategies that require multiple purchases and sales of options, such as spreads. Supporting documentation for any comparisons, recommendations, statistics, technical data, or other
information will be supplied upon request. 24Consumer and
Investment
Important Information Management
Division
• Real Estate. Real estate investments involve additional risks not typically associated with other asset classes, such as sensitivities to temporary or permanent reductions in property values for the
geographic region(s) represented. Real estate investments (both through public and private markets) are also subject to changes in broader macroeconomic conditions, such as interest rates.
• Structured Investments. Structured investments are complex, involve risk and are not suitable for all investors. Investors in structured investments assume the credit risk of the issuer or
guarantor. If the issuer or guarantor defaults, you may lose your entire investment, even if you hold the product to maturity. Structured investments often perform differently from the asset(s) they
reference. Credit ratings may pertain to the credit rating of the issuer and are not indicative of the market risk associated with the structured investment or the reference asset. Each structured
investment is different, and for each investment you should consider 1) the possibility that at expiration you may be forced to own the reference asset at a depressed price; 2) limits on the ability to
share in upside appreciation; 3) the potential for increased losses if the reference asset declines; and 4) potential inability to sell given the lack of a public trading market.
• Tactical Tilts. Tactical tilts may involve a high degree of risk. No assurance can be made that profits will be achieved or that substantial losses will not be incurred. For various reasons, GS&Co.
and its affiliates may implement a tactical tilt, invest in an affiliated fund that may invest in tactical tilts, or unwind a position for its client advisory accounts or on its own behalf before your advisor
does on behalf of your account, or may implement a tactical tilt that is different from the tactical tilt implemented by advisors on client accounts, which could have an adverse effect on your
account and may result in poorer performance by your account than by Goldman Sachs or other client accounts.
• U.S. Registered Mutual Funds / Exchange Traded Funds (“ETFs”) or Exchange Traded Notes (“ETNs”). You should consider a fund’s investment objectives, risks, charges and expenses,
and read the summary prospectus and/or the Prospectus (which may be obtained from your PWM Team) carefully before investing, as they contain this and other relevant information. You may
obtain documents for ETFs or ETNs for free by 1) visiting EDGAR on the SEC website at http://www.sec.gov/; 2) contacting your PWM team; or 3) calling toll-free at 1-866-471-2526. Unlike
traditional mutual funds, ETFs can trade at a discount or premium to the net asset value and are not directly redeemable by the fund. Leveraged or inverse ETFs, ETNs, or commodities futures-
linked ETFs may experience greater price movements than traditional ETFs and may not be appropriate for all investors. Most leveraged and inverse ETFs or ETNs seek to deliver multiples of the
performance (or the inverse of the performance) of the underlying index or benchmark on a daily basis. Their performance over a longer period of time can vary significantly from the stated daily
performance objectives or the underlying benchmark or index due to the effects of compounding. Performance differences may be magnified in a volatile market. Commodities futures-linked ETFs
may perform differently than the spot price for the commodity itself, including due to the entering into and liquidating of futures or swap contracts on a continuous basis to maintain exposure (i.e.,
“rolling”) and disparities between near term future prices and long term future prices for the underlying commodity. You should not assume that a commodity-futures linked ETF will provide an
effective hedge against other risks in your portfolio.
Security-Specific References. Any reference to a specific company or security is not intended to form the basis for an investment decision and is included solely to provide examples or provide
additional context. This information should not be construed as research or investment advice and should not be relied upon in whole or in part in making an investment decision. GS, or persons
involved in the preparation or issuance of these materials, may from time to time have long or short positions in, buy or sell (on a principal basis or otherwise), and act as market makers in the
securities or options, or serve as a director of any companies mentioned herein. In addition, GS may have served as manager or co-manager of a public offering of securities by any such company
within the past 12 months. Further information on any securities mentioned in this material may be obtained upon request.
Assets Held at a Third Party Custodian. Any information (including valuation) regarding holdings and activity in accounts held by third party custodians is for your convenience and has been
supplied by third parties or by you. GS assumes no responsibility for the accuracy of such information. Information may vary from that reflected by your custodian and is as of the date of the materials
provided to us. As an accommodation to you, we may also reflect certain investments unrelated to services provided by GS, for which GS does not perform any due diligence, verify the accuracy of
information, or provide advice. Unless otherwise agreed in writing, we have not assessed whether those investments fit within your investment objective and the asset classification shown may not be
accurate.
Off-Platform Investments. To the extent you ask us for guidance in connection with investment opportunities not offered by GS, such as investments in private funds, private debt or equity, real
estate or other opportunities you source away from us, any such guidance, views, or other information we may provide is on an accommodation basis only and we will not be acting as your advisor.
We assume no obligation to determine whether the opportunity is suitable for you in connection with such investment decisions and will not assume any liability for such investment decisions. Please
review our Form ADV for information on conflicts of interest we may have in connection with any such requests.
ISG/GIR Forecasts. Economic and market forecasts presented (“forecasts”) reflect either ISG’s or GIR’s views and are subject to change without notice. Forecasts do not take into account specific
investment objectives, restrictions, tax and financial situation or other needs of any specific client. Forecasts are subject to high levels of uncertainty that may affect actual performance and should be
viewed as merely representative of a broad range of possible outcomes. Forecasts and any return expectations are as of the date of this material, and should not be taken as an indication or
projection of returns of any given investment or strategy. Forecasts are estimated, based on capital market assumptions, and are subject to significant revision and may change materially as
economic and market conditions change. Any case studies and examples are for illustrative purposes only. If applicable, a copy of the GIR Report used for GIR forecasts is available upon request.
Forecasts do not reflect advisory fees, transaction costs, and other expenses a client would have paid, which would reduce return.
Client Specific Markets. Investments held in your name with a subcustodian in the local market where traded in order to comply with local law will be indicated on your statements. 25Consumer and
Investment
Important Information Management
Division
Performance / Estimated Income / Estimated Cash Flow. Past performance is not a guide of future results and may include investments no longer owned in current or closed accounts. Current
performance may be lower or higher than the performance data quoted. To request the most current or historical performance data, or asset classification schema information, please contact your
PWM team at the number provided on your monthly statement or toll-free in the U.S. at 1-800-323-5678. Performance reports, where shown, generally present the relevant time weighted
performance, which is a combination of daily returns compounded over a specified time period with the removal of the deposit and withdrawal impacts, and may show internal rate of return
calculations where requested. Aggregate performance may not equal the sum of returns at an investment level. Performance for advisory accounts is currently calculated net of any management fees
and might include investments for which actual market prices are not currently available, and does not include private equity positions. Performance for alternative investments is calculated using the
value of the last available partnership capital statement or NAV. If included, estimated income figures and estimated private equity future cash flows are estimates of future activity, and actual results
may vary substantially. GS&Co. has adjusted performance calculations for certain asset classes or strategies and may do so in the future. Performance of net cash (i.e., cash less margin debit) is
generally included in the total performance calculation but not displayed separately. Option performance is included in the performance of the asset class of the underlier. Margin loans are generally
excluded from advisory performance but included in brokerage performance calculations. Mutual fund and ETF investment returns and the principal value of your investment will fluctuate. As a result,
your shares when redeemed may be worth more or less than their original cost. The performance data for ETFs does not reflect a deduction for commissions that would reduce the displayed
performance. You are not subject to a sales charge for mutual funds purchased through PWM. If a sales charge were applicable, the sales charge would reduce the mutual fund’s performance.
Indices / Benchmarks. Any references to indices, benchmarks, or other measure of relative market performance over a specified period of time are provided for your information only and is not
indicative of future results. In addition to the benchmark assigned to a specific investment strategy, other benchmarks (“Comparative Benchmarks”) may be displayed, including ones displayed at your
request. Managers may not review the performance of your account against the performance of Comparative Benchmarks. There is no guarantee that performance will equal or exceed any
benchmark displayed. Where a benchmark for a strategy has changed, the historical benchmark(s) are available upon request. Inception to date (“ITD”) returns and benchmark / reference portfolio
returns may reflect different periods. ITD returns for accounts or asset classes only reflect performance during periods in which your account(s) held assets and / or were invested in the asset class.
The benchmark or reference portfolio returns shown reflect the benchmark / portfolio performance from the date of inception of your account or your initial investment in the asset class. If displayed,
estimated income figures are estimates of future activity obtained from third party sources.
Indices are unmanaged. The figures for the index reflect the reinvestment of all income or dividends, as applicable, but do not reflect the deduction of any fees or expenses which would reduce
returns. Investors cannot invest directly in indices. Where appropriate, relevant index trademarks or index information has been licensed or sub-licensed for use. Inclusion of index information is not
intended to imply that the relevant index or its affiliated entities sponsor, endorse, sell, or promote the referenced securities, or that they Period Gross Return Net Return Differential
make any representation or warranty regarding either the advisability of investing in securities (generally or specifically) or regarding the
1 year 6.17% 4.61% 1.56%
ability of the index to track market performance. Contact your PWM team for more information.
The following table provides an example of the effect of management and incentive fees on returns. The magnitude of the difference 2 years 12.72% 9.43% 3.29%
between gross-of fee and net-of-fee returns will depend on a variety of factors, and the example has been simplified. 10 years 81.94% 56.89% 25.05%
Pricing and Valuations. Prices do not necessarily reflect realizable values and are based on information considered to be reliable but are not guaranteed for accuracy, currency, or as realizable
values. Certain positions may be provided by third parties or may appear without a price if GS is unable to obtain a price and/or the security is not actively traded for a certain amount of time. Pricing
sources and methods are available upon request and are subject to change.
Fees and Charges. We have two pricing models for advisory relationships: a comprehensive fee model and a product based model. You should consider factors, including, but not limited to, your
financial needs and circumstances, investment objectives, services provided under the model, your preferences, and the size of your account. Certain account fees and expenses may be more or
less expensive depending on the model chosen. Actual fees may differ from estimated fees due to differences in strategies and amounts invested in particular strategies or overall. Charges applied to
your accounts and transactions may include execution charges (including commissions, commission equivalents, mark-ups, mark-downs and dealer spreads), investment advisory fees, and custody
fees. When we act as broker, we are generally compensated by an execution charge on a trade by trade basis. When we act as advisor, we generally earn a fee based on assets under management
and may also be earning execution charges. More information about fees and charges is included in our account agreements, fee schedules and trade confirmations. If estimated fees are shown
herein, we have included a description of our fee calculation methodology.
Where applicable, GS receives fees for certain of the Family Office Services. In the course of providing such Family Office services, GS or its subsidiaries or affiliates may offer additional services
and/or products for which additional fees or commissions are charged. These offerings create a conflict of interest and clients may be asked to acknowledge their understanding of such conflict.
Certain fees associated with Family Office Services are either charged as a single bundled fee while other fees are charged as supplemental fees, which are identified in the Family Office Services
Supplement to clients’ Customer Agreement. GS reserves the right to adjust the Family Office Services fees in the event of extraordinary circumstances.
Consolidated Reporting. Any consolidated report that GS may provide is at your request and is for informational purposes only; it is not your official statement. Information (including valuation)
regarding holdings in third party accounts or other non-GS investments may be included as a courtesy and is based on information provided by you. GS does not perform review or diligence on,
independently verify the accuracy of information regarding, or provide advice on such non-GS investments; GS assumes no responsibility for the accuracy of the source information and such assets
may not be included on GS’s books and records. While we may inform you of how a non-GS investment fits within your overall asset allocation, our classification of the investment may be different 26Consumer and
Investment
Important Information Management
Division
than your custodian or external adviser’s classification. You should review and maintain the original source documents (including third party financial statements) and review them for any notices or
relevant disclosures. Assets held away may not be covered by SIPC. Please contact your PWM Team with any questions regarding the consolidated reporting process, including its limitations.
Tax Information. GS does not provide legal, tax or accounting advice, unless explicitly agreed in writing between you and GS, and does not offer the sale of insurance products. You should obtain
your own independent tax advice based on your particular circumstances. Where clients receive Family Office Services, the Family Office may review with you the general income tax consequences
of your investments, estate planning, philanthropic endeavors, real estate holdings, and certain other activities that may affect your income tax. The information included in this presentation, including,
if shown, in the Tax Summary section, does not constitute tax advice, has not been audited, should not be used for tax reporting, and is not a substitute for the applicable tax documents, including
your Form 1099, Schedule K-1 for private investments, which we will provide to you annually, or your monthly GS account statement(s). The cost basis included in this presentation may differ from
your cost basis for tax purposes. Information regarding your alternative investments and transactions for retirement accounts are not included in the Tax Summary section.
Notice to ERISA / Qualified Retirement Plan / IRA / Coverdell Education Savings Account (collectively, “Retirement Account”) Clients: Information regarding your Retirement Account(s)
included in this presentation is for informational purposes only and is provided solely on the basis that it will not constitute investment or other advice or a recommendation relating to any person’s or
plan’s investment or other decisions, and that none of GS, its affiliates or their employees is a fiduciary or advisor with respect to any person or plan by reason of providing the material or content in
the presentation including under the Employee Retirement Income Security Act of 1974 or Department of Labor Regulations. Unless GS agrees otherwise, any target allocation shown for such
Retirement Account represents decisions you have communicated to GS regarding such asset allocation, without any advice or recommendations from GS, after considering your financial
circumstances, objectives, risk tolerance and goals.
GS Family Office Services. Where GS provides or refers Family Office Services, it will do so based on individual client needs. Not all clients will receive all services and certain activities may fall
beyond the scope of the Family Office Services. Any asset management services provided are governed by a separate investment management agreement (as may be applicable). Personnel
providing Family Office Services do not provide discretionary management over client investments. Where GSFO provides art advisory services, such services are generally limited to education; GS
does not recommend purchasing art or collectibles as an investment strategy, provide formal or informal appraisals of the value of, or opine on the future investment potential of, any specific artwork
or collectible. Upon your request, the Family Office Wealth Advisory Services (“WAS”) team may discuss with you various aspects of financial planning; the scope of such planning services will vary
among clients and may only include episodic and educational consultations that should not be viewed as tax advice. GS assumes no duty to take action pursuant to any recommendations, advice, or
financial planning strategies discussed with you as part of WAS services. It is your responsibility to determine if and how any such recommendations, advice, or financial planning strategies should be
implemented or otherwise followed, and you are encouraged to consult with your own tax advisor and other professionals regarding your specific circumstances. GS is not liable for any services
received from your independent advisors or the results of any incident arising from any such services or advice. Cybersecurity consultations provided by GS&Co. are intended to provide a general
overview of cyber and physical security threats, but are not comprehensive; GS is not liable for any incident following such consultations. GS is not liable for clients’ ultimate selection and utilization of
any Third Party Vendor for any Family Office Services, or the results of any incident arising from any such referral. GS is not responsible for the supervision, monitoring, management, or performance
of such Third Party Vendors and is not liable for any failure of Third Party Vendors to render services or any losses incurred as a result of such services.
Other Services. Any provided financial planning services, including cash flow analyses based on information you provide, are a hypothetical illustration of mathematical principles and are not a
prediction or projection of performance of an investment or investment strategy. Such services may not address every aspect of a client’s financial life; topics that were not discussed with you may still
be relevant to your financial situation. In providing financial services, GS will rely on information provided by, or on behalf of, clients and is not responsible for the accuracy or completeness of any
such information, nor for any consequences related to the use of any inaccurate or incomplete information. Where materials and/or analyses are provided to you, they are based on the assumptions
stated therein, which are likely to vary substantially from the examples shown if they do not prove to be true. These examples are for illustrative purposes only and do not guarantee that any client will
or is likely to achieve the results shown. Assumed growth rates are subject to high levels of uncertainty and do not represent actual trading and may not reflect material economic and market factors
that may have an impact on actual performance. GS has no obligation to provide updates to these rates.
Not a Municipal Advisor. Except in circumstances where GS expressly agrees otherwise, GS is not acting as a municipal advisor and the opinions or views contained in this presentation are not
intended to be, and do not constitute, advice, including within the meaning of Section 15B of the Securities Exchange Act of 1934.
Additional Information for Ayco Clients. References in this presentation to “PWM team” shall include your Ayco team. Ayco may provide tax advice, accounting advice, bill pay, and bookkeeping
services to certain clients. Ayco does not provide brokerage services. As part of its financial counseling services, Ayco may provide you with certain reports where similar information contained herein
is presented differently or in more or less detail. You should view each report independently and raise any questions with your Ayco team.
No Distribution; No Offer or Solicitation. This material may not, without GS’ prior written consent, be (i) copied, photocopied or duplicated in any form, by any means, or (ii) distributed to any person
that is not an employee, officer, director, or authorized agent of the recipient. This material is not an offer or solicitation with respect to the purchase or sale of any security in any jurisdiction in which
such offer or solicitation is not authorized or to any person to whom it would be unlawful to make such offer or solicitation. We have have no obligation to provide any updates or changes to this
material.
27Consumer and
Investment
Important Information Management
Division
This material is for your information only and is not intended to be used by anyone other than you. To the extent this presentation is used by Private Wealth Management, this presentation is intended
only to facilitate your discussions with Goldman Sachs as to the opportunities available to our Private Wealth Management clients. This is not an offer or solicitation with respect to the purchase or
sale of any security. This presentation is intended only to facilitate your discussions with Goldman Sachs International (“GSI”), who are authorised by the Prudential Regulation Authority and regulated
by the Financial Conduct Authority and Prudential Regulation Authority, as to the opportunities available to our retail clients. The presentation is not intended to be used as a general guide to
investing, or as a source of any specific investment recommendations, and makes no implied or express recommendations concerning the manner in which any client’s account should or would be
handled, as finding the appropriate investment strategies for a client will depend upon the client’s investment objectives.
This presentation does not constitute an offer or solicitation to any person in any jurisdiction in which such offer or solicitation is not authorized or to any person to whom it would be unlawful to make
such offer or solicitation. It is the responsibility of any person or persons in possession of this material to inform themselves of and to observe all applicable laws and regulations of any relevant
jurisdiction. Prospective investors should inform themselves and take appropriate advice as to any applicable legal requirements and any applicable taxation and exchange control regulations in the
countries of their citizenship, residence or domicile which might be relevant to the subscription, purchase, holding, exchange, redemption or disposal of any investments.
Information contained herein is believed to be reliable but no warranty is given as to its completeness or accuracy and views and opinions, whilst given in good faith, are subject to change without
notice. GSI, and/or its affiliates (together “Goldman Sachs”) and its officers, directors, and employees, including persons involved in the preparation or issuance of this material, may from time to time
have "long" or "short" positions in, or buy or sell, or otherwise have a material interest in, the investments mentioned herein or in related investments including, without limitation, securities,
commodities, derivatives (including options) or other financial products of companies mentioned herein. In addition, Goldman Sachs may have served as manager or co-manager of a public offering
of securities by any such company within the past 12 months and/or may be the only market maker in relation to investments mentioned herein and/or may be providing significant advice or
investment services in relation to investments mentioned herein or related investments or have provided such advice or services within the previous 12 months.
Past performance is not a guide to future performance and the value of investments and the income derived from them can go down as well as up. Future returns are not guaranteed and a loss of
principal may occur. Changes in exchange rates may cause the value of an investment to increase or decrease. Some investments may be restricted or illiquid, there may be no readily available
market and there may be difficulty in obtaining reliable information about their value and the extent of the risks to which such investments are exposed. Certain investments, including warrants and
similar securities, often involve a high degree of gearing or leverage so that a relatively small movement in price of the underlying security or benchmark may result in a disproportionately large
movement, unfavorable as well as favorable, in the price of the warrant or similar security. In addition, certain investments, including futures, swaps, forwards, certain options and derivatives, whether
on or off exchange, may involve contingent liability resulting in a need for the investor to pay more than the amount originally invested and may possibly result in unquantifiable further loss exceeding
the amount invested. Transactions in over-the-counter derivatives involve additional risks as there is no market on which to close out an open position; it may be impossible to liquidate an existing
position, to assess the value of a position or to assess the exposure to risk. Investors should carefully consider whether such investments are suitable for them in light of their experience,
circumstances and financial resources.
No part of this material may be i) copied, photocopied or duplicated in any form, by any means, or ii) redistributed without the prior written consent of GSI.
Indices are unmanaged, and the figures for the index do not reflect any fees or expenses. We strongly recommend that these factors be taken into consideration before an investment decision is
made. Investors cannot invest directly in indices.
References to market or composite indices, benchmarks or other measures of relative market performance over a specified period of time ("benchmarks") are provided by Goldman Sachs for your
information purposes only. Goldman Sachs does not give any commitment or undertaking that the performance of your account(s) will equal, exceed or track any benchmark.
GS may record telephone conversations and monitor emails between GS and you (and any of your authorised, connected or affiliated persons) for the purpose of evidencing your instructions,
monitoring quality of service, for compliance and security purposes, otherwise for GS's internal records or where required by Applicable Rules.
This material has been approved for issue in the United Kingdom solely for the purposes of Section 21 of the Financial Services and Markets Act 2000 by GSI, Plumtree Court, 25 Shoe Lane,
London, EC4A 4AU, United Kingdom; authorised by the Prudential Regulation Authority; and regulated by the Financial Conduct Authority and the Prudential Regulation Authority. Certain aspects of
the investment strategy described in this presentation may from time to time include commodity interests as defined under applicable law.
For investors based / receiving this document in the United Kingdom: This document may contain references to “non-mainstream pooled investments”, as defined in the UK Financial Conduct
Authority’s Handbook of Rules and Guidance (the “FCA Handbook”). Non-mainstream pooled investments include (without limitation) unregulated collective investment schemes and certain
structured products. Where this document refers to non-mainstream pooled investments, this document and the non-mainstream pooled investments referred to within it has been provided to you on
the basis that you have demonstrated to Goldman Sachs that you fall within an exempt category of person to whom such an investment may lawfully be promoted in accordance with the rules of the
FCA Handbook, including without limitation: (a) Certified High Net Worth Investors; (b) Professional or Eligible Counterparty clients; (c) Certified Sophisticated Investors; (d) Certified Self-
Sophisticated Investors; or (e) by virtue of this document amounting to an Excluded Communication, as such terms are defined in the FCA Handbook.
28You can also read