Business Services Sector in Turkey
←
→
Page content transcription
If your browser does not render page correctly, please read the page content below

Business Services
                               Sector in Turkey

                    November 2013

Investment Support and Promotion Agency of Turkey
Disclaimer

Republic of Turkey Prime Ministry Investment Support and Promotion Agency (ISPAT) submits the information
provided by third parties in good faith. ISPAT has no obligation to check and examine this information and takes no
responsibility for any misstatement or false declaration. ISPAT does not guarantee the accuracy, currency,
reliability, correctness or legality of any information provided by third parties. ISPAT accepts no responsibility for
the content of any information, news or article in the document and cannot be considered as approving any opinion
declared by third parties. ISPAT explicitly states that; it is not liable for any loss, negligence, tort or other damages
caused by actions and agreements based on the information provided by third parties.

Deloitte accepts no liability to any party who is shown or gains access to this document. The opinions expressed in
this report are based on Deloitte Consulting’s judgment and analysis of key factors. However, the actual operation
and results of the analyzed sector may differ from those projected herein. Deloitte does not warrant that actual
results will be the same as the projected results. Neither Deloitte nor any individuals signing or associated with this
report shall be required by reason of this report to give further consultation, to provide testimony or appear in
court or other legal proceedings, unless specific arrangements thereof have been made. All opinions and estimates
included in this report constitute our judgment as of this date and are subject to change without notice and may
become outdated.

       Investment Support and Promotion Agency of Turkey                                                                    2
Table of Contents
Abbreviations                                                                4-5

Executive Summary                                                             6

I.    Macroeconomic Overview of Turkey                                      7-13

       A. Overview of the Turkish Economy and the Macro-economic Outlook     8-9

       B. Global Outlook on Business Services                              10-11

       C. Business Services Development in Turkey                          12-13

II.   Competitive Advantage of Turkey and Ease of Doing Business           14-24

       A. Turkey has Advantageous Geographical Position                    15-18

       B. Access to Real Estate in Turkey                                  19-20

       C. Ease of Doing Business and Labor Costs in Turkey                 21-22

       D. Employment and Education                                         23-24

III. Engineering Services and Incentives in Turkey                         25-33

       A. Turkish Architectural and Engineering Consulting Firms           26-28

       B. Promotion of R&D Centers and Incentives , Major TDZs.            29-32

       C. Some of the major Engineering Consulting Firms                     33

      Investment Support and Promotion Agency of Turkey                            3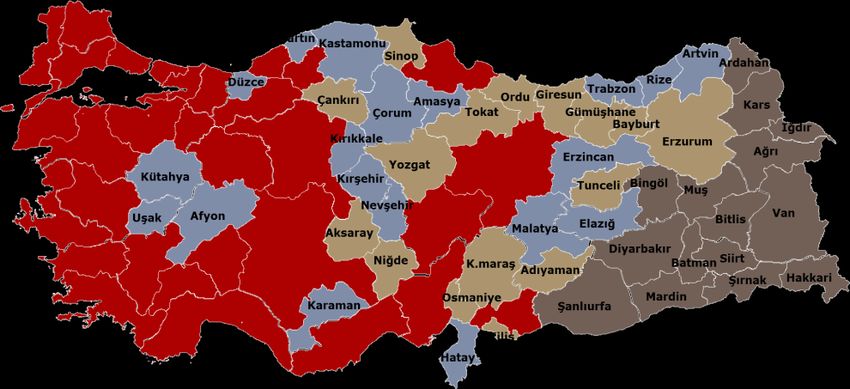
Table of Contents

IV. Testing Services in Turkey                                          34-43

       A. Technical Testing and Analysis Sector in Turkey                 35

       B. Forecast of Technical Testing and Analysis Sector in Turkey     36

       C. Growth of Relevant Industries                                   37

       D. Incentives for Test Centers                                   38-39

       E. Major Players and NGOs                                        40-43

V.   Call Centers                                                       44-50

       A. Global Outlook on Call Centers                                  45

       B. Call Center Market Growth in Turkey                           46-47

       C. Call Center Incentives                                          48

       D. Success Stories                                               49-50

VI. Knowledge Based Services                                            51-67

       A. Accounting and Auditing Services                              52-57

       B. Legal Advisory Services                                       58-61

       C. Consulting and Financial Services                             62-65

       D. Conclusion                                                      66

     Investment Support and Promotion Agency of Turkey                          4
List of Abbreviations
Abbreviations                     Definitions               Abbreviations                Definitions

BDD                Association of Independent Auditing      EIU             Economic Intelligence Unit

BRIC               Brazil, Russia, India, China             EMEA            Europe, the Middle East and Africa

BRSA               Banking Regulation And Supervision       ENR             Engineering News-Record
                   Agency
BUYEM              Bogazici University Lifelong Learning    EU              European Union
                   Center
CAGR               Compound Annual Growth Rate
                                                            FDI             Foreign Direct Investment
Capex              Capital Expenditure
                                                            GDP             Gross Domestic Product
CBRT               Central Bank of the Republic of Turkey
                                                            GYODER          Association of Real Estate Investment
CCBE               Council of Bars and Law Societies of                     Companies
                   Europe
                                                            IAF             International Accreditation Forum
CCC                Competence Call Center

CE                 Conformity Marking                       IASP            International Association of Science
                                                                            Parks
CMB                Capital Markets Board                    IBA             International Bar Association
CMC                Customer Management Center               IBM             International Business Machines
CPA                Certified Public Accountant              ICMCI           International Council of Management
                                                                            Consulting Institutes
CRM                Customer Relationship Management
                                                            ICT             Information & Communications
DDK                The State Supervisory Council                            Technology

EA                 European Cooperation for
                   Accreditation

       Investment Support and Promotion Agency of Turkey                                                            5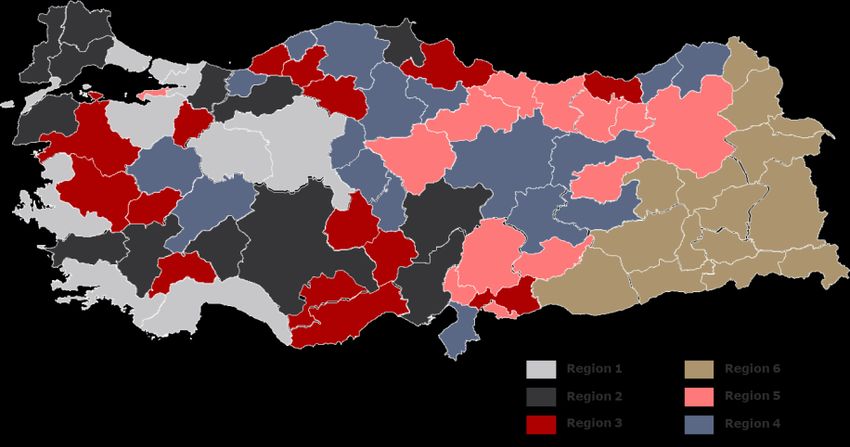
List of Abbreviations
Abbreviations                     Definitions               Abbreviations                  Definitions

ILAC               International Laboratory Accreditation   R&D             Research and Development
                   Cooperation
ISE                Istanbul Stock Exchange                  SAP             Systems Analysis and Program
                                                                            Development
ISO                International Organization for           SD              Sales and Distribution
                   Standardization
ISS                Integrated Service Solutions             sqm             Square meters

IT                 Information Technology                   SMEs            Small and Medium Sized Enterprises

                                                            SPO             Prime Ministry State Planning
ITO                Information Technology Outsourcing
                                                                            Organization
IVR                Interactive Voice Response               TDZ             Technology Development Zone

JICA               Japanese International Co-operation      TL              Turkish Lira
                   Agency
                                                            TMUD            Expert Accountants Association of
M&A                Mergers and Acquisitions
                                                                            Turkey
MENA               Middle East & North Africa               TSE             Turkish Standards Institution

METU               Middle East Technical University         TTGV            Technology Development Foundation
                                                                            of Turkey
MLA                Multilateral Agreement                   TURKAK          Turkish Accreditation Agency

MM                 Material Management                      TurkStat        Turkish Statistical Institute

NGO                Non-Governmental Organization            TURMOB          The Union of Chambers of Certified
                                                                            Public Accountants and Sworn-in
OECD               Organization for Economic Co-                            Certified Public Accountants of Turkey
                   operation and Development

       Investment Support and Promotion Agency of Turkey                                                             6
Executive Summary
• Turkey’s unique geographical position between
                                                         • Testing and technical analysis sector has been
  Europe and Asia, allows the country to create a link
                                                           demonstrating an increasing trend in its turnover
  between three continents with over 1.5 billion and
                                                           and with a positive CAGR of 21% between 2005
  a GDP of 25 trillion.
                                                           and 2011 The technical testing and analysis sector
• According to fDi Markets, an estimated total of USD      is expected to continue its growth and reach TL
  411.81 million capital investment was announced          1,905 million as its related industries such as
  in Turkey’s Business Services between January            manufacturing and chemicals are expected to
  2003 and August 2013. Business services include          develop.
  service lines; management consulting, legal
                                                         • Call centers of Turkey have been developing
  services, business support, and engineering
                                                           significantly in the last couple of years. As of
  services.
                                                           2013, Turkey’s call center market is valued at
• Regarding the distribution of incoming investments       USD 1.4 billion in 2013. Call center sector has a
  in Business Services it was noted that, 26%              potential workforce of 350,000 to be reached by
  belonged to the United States, followed by 18%           2023, compared to 70,200 in 2013.
  from the United Kingdom, and 14% from Germany.
                                                         • Auditing and accounting sector in Turkey had a
• Turkey has significant experience in wide range of       total turnover of TL 7,012 million in 2012 and
  Business Service lines such as;                          increased at a CAGR of 15% between 2005 and
                                                           2012. As new regulations come to pass and
      • Engineering Services and Contracting
                                                           Turkey aspires to have compatible standards with
      • Testing and technical analysis                     the EU, the auditing and accounting sector will
      • Call Centers                                       continue to grow.

      • Auditing and Accounting                          • Legal advisory services, consulting and
                                                           financial services also play a critical role in
      • Law Advisory Services                              Turkey’s economy. For both of these sectors major
      • Consulting and Financial Services                  global firms have their offices in Turkey. According
                                                           to Euromonitor International, legal advisory
• According to the Ministry of Economy, Turkish            services turnover will reach TL 6,522 million
  engineering and contracting services sector              whereas consulting will reach TL 40,460 million by
  has worked on approximately 7,000 projects in 100        2017     due   to   Turkey’s      vibrant   business
  countries meaning a total worth of more than USD         environment.
  242 billion since 1972.

    Investment Support and Promotion Agency of Turkey                                                             7
I. Macro-Economic Overview of Turkey

A. Overview of Turkish Economy and Macro-Economic Outlook

B. Global Outlook on Business Services

C. Business Services Development in Turkey
Turkey’s fast-growing economy is expected to attract
more investment in the future.

• Turkey has undergone a profound economic                Figure 3: GDP Growth Rate (Constant Prices)
  transformation over the last decade and its
  economic foundation is quite solid. It is the 17th       9%
  largest economy in nominal terms and the 16th
  largest economy in purchasing power parity terms
                                                           4%                                                             EIU*
  in the world. Moreover, it is the 6th largest
  economy compared to the EU in 2012 with a
  current GDP of approximately USD 786 billion in         -1%
  2012.
• Having boomed as fast as 9.3% and 8.8% in real
                                                          -6%
  terms in 2010 and 2011, the OECD projects a real
  GDP growth of around 4% in 2014 and 2015, while
  EIU projects an average 5% growth year-to-year
  until 2017.                                             Source: Turkstat, EIU
                                                          f: forecast
• Monetary policy played a vital role in reining in       Figure 4: Inflation
  inflation in recent years. Turkish inflation has
  stayed under 10% since 2004 and the year-end            14%
  inflation rate was 6.2% in 2012. The government’s       12%
  efforts to tame inflation have paid off over the last   10%
  decade and the CBRT projects an inflation rate of        8%
  5% in 2013 and 2014.                                     6%
                                                           4%
                                                           2%
                                                           0%

                                                          Source: Turkstat , CBRT
                                                          f: forecasts of CBRT

    Investment Support and Promotion Agency of Turkey
                                                                           ©2014 Deloitte Turkey. Member of Deloitte Touche Tohmatsu Limited
                                                                                                                                               9
Capitalizing on its economic policies, the investment
environment in Turkey has become increasingly more
welcoming to foreign investors

 Figure 3: The Central Bank of the Republic of                                                       • The overnight lending rates have been steadily
 Turkey O/N Interest Rates                                                                             decreasing over the years and was around 7.5% in
                                                                                                       September 2013, which is a 500 basis point decrease
 60%
                                                                                                       from 2002.
 50%                                                                                                 • Fitch Ratings announced Turkey’s investment grade
 40%                                                                                                   rating as BBB in November 2012 and Standard & Poor
                                                                                                       announced it as BB+ in March 2013. These events
 30%                                                                                                   signal further upgrades and are expected to boost the
                                                                                                       inflow of institutional funding.
 20%
                                                                                                     • Moody's raised Turkish government bond ratings to
 10%                                                                                                   Baa3 and revised its outlook to stable from positive in
                                                                                                       May 2013.
  0%
       2002

               2003

                      2004

                             2005

                                    2006

                                           2007

                                                  2008

                                                          2009

                                                                 2010

                                                                        2011

                                                                               2012

                                                                                      2013
                                                                                                   Table 1: Turkey’s Credit Ratings

                             Borrowing                   Lending                                             Rating            Outlook            Rating           Outlook
                                                                                              Rating
                                                                                                             (Local             (Local           (Foreign          (Foreign
Source: CBRT                                                                                  Agency
                                                                                                            Currency)         Currency)         Currency)          Currency
                                                                                             Standard
                                                                                                                BBB              Stable             BB+             Negative
                                                                                             & Poor’s

                                                                                             Fitch              BBB              Stable             BBB-             Stable

                                                                                             Moody’s            Baa3             Stable             Ba1             Positive

                                                                                             JCR                BBB-             Stable             BBB-             Stable

                                                                                             Source: Moody’s (May 2013), S&P (February 2014), Fitch (December 2013), JCR (May 2013)

      Investment Support and Promotion Agency of Turkey                                                                                                                               10
Global investments on Business Services had a
precipitous increase in the last decade
Figure 4: Capital Investments and Number of Projects in Global Business Services
Sector, 2003-2013
60.000 2.000
CAGR 49.545 1.800
50.000
Number of Projects
25% 1.600
1.400
USD Million
40.000
1.200
30.000 1.000
800
20.000 16.271
12.585 600
12.544
10.000 5.155 6.331 400
13.093 14.619 14.118
9.243 200
0 5.161
2005
2003
2004
2006
2007
2008
2009
2010
2011
2012
2013
Number of Projects Capital Investment
• Global data between January 2003 and September 2013 for capital investments indicate that Business
Services had the second highest share with 16.4%, right after software and IT services.
• Figure 4 demonstrates the development of capital investments and number of projects in business services
sector. A staggering CAGR growth of 25% was observed during this period in capital investments, reaching
a total of USD 158,664 million in total.
• Even though the investments followed a steady pace between 2009 and 2011, there was a precipitous
increase in 2013, reaching USD 49,454 million in investments, with a 251% increase compared to the
previous year.
• Regarding the number of projects, which signifies expansions and co-location investments, increased at a
CAGR of 7% reaching 879 projects in 2013, highest number of projects for Business Services was realized in
2012 with 1,679 projects.
Investment Support and Promotion Agency of Turkey 11A look at where the money goes: Distribution of Global
Business Services Investments, Job Creation and
Number of Companies over the last decade
Western Europe Rest of Europe*
Capex: USD ~ 29,000 m Capex: USD ~ 7,600 m
Asia-Pacific Jobs Created: ~ 160,000 Jobs Created: ~ 70,000 Middle East and Africa
Capex: USD ~ 45,000 m Companies: ~ 2,200 Companies: ~ 700 Capex: USD ~ 19,000 m
Jobs Created: ~ 450,000 Jobs Created: ~ 35,000
Companies: ~ 2,000 Companies: ~ 1,100
North America Latin America & Caribbean
Capex: USD ~ 9,500 m Capex: USD ~ 48,200 m
Jobs Created: ~ 75,000 Jobs Created: ~ 135,000
Companies: ~ 900 Companies: ~ 600
*includes Turkey,
The data given represents the period
between January 2003 and September
2013
Investment Support and Promotion Agency of Turkey 12Turkey has been attracting significant foreign direct
investments in the last decade
Figure 5: FDI Inflows to Turkey, 2003-2012
25
22,05
20,19 19,76
20
16,05
USD Billion
15 12,56
10,03
10 8,66 9,04
5 2,79
1,70
0
2003
2004
2005
2006
2007
2008
2009
2010
2011
2012
Source: World Development Indicators, World Data Bank
• Turkey has become an attractive destination for FDI. Weak FDI inflows after 2002 experienced an
incremental increase, and reached a record level of USD 22 billion in 2007. The decrease in 2009
can be explained due to the global economic crisis, which lowered FDI all around the globe
including Turkey. However, according to the 2011 values, Turkey has recovered satisfactorily from
the global crises.
• In 2012, FDI inflow has risen to USD 12.56 billion, compared to USD 8.66 billion in 2009.
Investment Support and
©2013 Deloitte Türkiye. Member of Deloitte Touche Tohmatsu Limited 13
Promotion Agency of TurkeyWho is already in Turkey ? Turkey attracts prestigious
players in business services
Analysis of foreign investors into Business Services sector in Turkey addresses the dominance of the United States
with 26%, followed by the United Kingdom with 18%, and Germany with 14%. When the capital investment is
analyzed according to business lines, it is observed that Business Support line is leading the way with 36%, valued
at USD 148.6 million followed by engineering services, and management consulting.
Figure 6: Distribution of Business Services Companies Figure 7: CAPEX Distribution of Business
in Turkey according to Countries of Origin Services according to different business lines
Management
Consulting
United States 11% 17%
26% Legal
31% UK
8%
Germany Business Support
28%
France
5% Engineering
18% Ireland
6% Services
14% 36%
Others Other
Figure 8: Selected Foreign investors in Turkey between 2008 and 2013
Management Business Engineering
Legal Services
Consulting Support Services
• A T Kearney • Baker & McKenzie • Arvato Services • WYG Engineering
• Frost &Sullivan • Clifford Chance • Competence Call • Wimberley Allison Tong
• PSD Global • Chadbourne & Parke Center (CCC) & Goo (WATG)
• Bain & Company • Kinstellar • Mellon Group of • PM Group
Companies
Source: fdi markets
Investment Support and
©2013 Deloitte Türkiye. Member of Deloitte Touche Tohmatsu Limited 14
Promotion Agency of TurkeyII. Competitive Advantage of Turkey and
Ease of Doing Business
A. Turkey has an Advantageous Geographical Position
B. Access to Real Estate in Turkey
C. Ease of Doing Business and Labor Costs in Turkey
D. Employment and EducationTurkey’s advantageous geographical position: Europe
meets Asia, within a radius of a 4-hour flight or less
• Turkey is situated between Europe and Asia, allowing the country to create a link between three continents with
over 1.5 billion people and a GDP of USD 25 trillion.
• As major airway hubs in the region, Istanbul and Ankara airports provide a practical route of travel with a
maximum 4 hour direct flight to the capital cities in Europe, Western & Central Asia, the Middle East and Africa.
• Turkey’s geographical location as well as its logistics capabilities, its unique positioning at the intersection of
trade routes and its rapidly progressing investment climate are the major factors contributing to Turkey’s
strategic and regional importance.
Figure 9: Turkey’s geographical position Table 2: Total Foreign Trade Volume by
Regions
Trade Volume
Regions
(USD billion)
Free Zones in Turkey 3.34
Europe (EU) 146.65
Europe (Non-EU) 51.78
North America 21.75
Central & South America 8.11
Middle & Near East 63.86
Africa 19.28
Asia & Pacific 61.53
Others 12.71
Total 389.01
Investment tip: Acceleration in Turkish foreign trade with
neighboring as well as distant countries underlines the
importance of Turkey as a major trade route.
Source: TUIK
Investment Support and Promotion Agency of Turkey 1633% of the members of the International Investment
Association of Turkey use Turkey as a regional hub…
Number of Number of
Companies Companies
managed from managed from
Turkey Turkey
94 30
80 27
80 26
67 22
36 20
30 20,18
30 18,14
Investment Support and Promotion Agency of Turkey 17Istanbul is the favourite destination for incoming
investments in Business Services, with still a lot of room
to grow
Figure 10: Destination Cities of Incoming CAPEX
in Business Services, 2003-2013
5% 1% • Over the years, it has been observed that
70% of the business services investments
were announced in Istanbul, since it is the
22% Ankara financial capital of Turkey offering various
Adana opportunities for foreign investors.
2% Istanbul • Top 4 cities for investing in business services
Izmir between 2003 and 2013 were Istanbul,
Ankara – capital of Turkey, Izmir and Adana.
70% Other
Figure 11: Correlation between Business
Services Cumulative CAPEX and Jobs Created,
2003-2013
450 1.800 • Figure 11 demonstrates the cumulative capital
400 1.600 investments for business services between
350 1.400
USD million
of People 2003 - 2013 and number of qualified jobs it
300 1.200 Number
250 1.000
has been created during this time frame.
200 800 • As of 2013 there are an estimated number of
150 600 1,627 people working in business service
100 400 companies that have been established with
50 200
foreign direct investment.
0 0
2013
2003
2004
2005
2006
2007
2008
2009
2010
2011
2012
CAPEX Jobs Created
Source: fDI Markets
Investment Support and Promotion Agency of Turkey 18Istanbul, the financial capital of Turkey, offers ample
opportunities for Business Services Sector
For Business
Services
From Coca-Cola sector, 70% of Enterprises in
to Microsoft capital Istanbul
several investments accounted for
multinational were realized more than
companies in Istanbul in 65% of
choose Istanbul the last Turkey’s
as their decade. exports and
regional Head 43% of goods
Quarters in 2012
USD 287
Major audit, million capital
management investment
/financial was
consulting and announced in
law firms are Business
located in Istanbul Services in
to serve the the last
vibrant economy decade in
of the city İstanbul
Investment Support and Promotion Agency of Turkey Sources: Turkstat, TRT, BTK 19Access to Real Estate
5% of Turkey’s total GDP is in real estate
• Turkey’s economic stability, strong macroeconomic indicators and attractive long term loans have made the
country a lucrative environment for foreign investors. For instance, in 2010 Turkey was awarded the ‘highest
improvement’ title in the global real estate transparency index. Also, a staggering USD 30.5 billion of FDI in the
real estate sector was realized between 2003 and 2012, demonstrating the high level of interest of foreign
investors. The breakdown of the FDI according to sectors is as follows; USD 24.9 billion from offices and
houses, USD 3.4 billion from construction, and USD 2.2 billion from contracting activities.
• Sales of real estate to foreigners started to increase in the last two quarters of 2012 thanks to the enactment of
the Reciprocity Law. Real estate sales to foreigners increased by 30.9% and reached USD 2.64 billion in 2012.
• According to a report by the Association of Real Estate Investment Companies (GYODER), the most active
commercial real estate market was the office market in 2012. Foreign investors and developers are increasingly
interested in the office market.
• Compared to BRIC countries along with, Hungary, Poland and Croatia, Turkey offers the lowest number of days
to register a property with 6 days whereas for the aforementioned countries the process takes much longer. It
is also important to note that amongst the selected countries Turkey shares highest score for «Overall Quality
of Infrastructure» with Croatia at 5.1 out of 7.
Figure 12: Number of Days to Register a Figure 13: Overall Quality of Infrastructure Score
Property, 2013 (1-7), 2013
Turkey 6 Crotia 5,1
Hungary 17 Turkey 5,1
China 29 Hungary 4,9
Brazil 34 China 4,3
India Poland 4
44
India 3,9
Russia 44
Russia 3,8
Poland 54
Brazil 3,4
Crotia 104
0 1,3 2,6 3,9 5,2
0 20 40 60 80 100 120
Score
Number of Days Source: Global Competitiveness Report 2013
Investment Support and Promotion Agency of Turkey 20Turkey provides prime real estate for foreign invesotrs
Figure 14: Total Office Area for A and B Class Figure 15: Istanbul A Class Office Market
and Average Vacancy Rates (%), Istanbul Average Vacancy Rates Q3 2013
1.200 20 400 Vacant Space
1.000 16,92 21.4% Occupied Space
Thousands sqm
15 300 8.5%
13,42 2.0%
Thousands
800 14.9%
200
600 10 48.2%
6,97 30.2%
6,54
100 7.8%
400 15.6% 5.3%
5 5.3%
0.0% 1.6%
200
0
0 0
Asia A Asia B Europe A Europe B
Source: Colliers International, Propın Investment Consultancy,
Istanbul Offıce Market
• For foreign investors seeking to expand their Source: Colliers International
operations into Turkey and the surrounding regions, • Rents vary largely depending on the location and
Turkey provides prime real estate. quality of the property. In Istanbul’s commercial
business district, for instance, rents for Class A
• Class A offices, referring to those offices located in
office buildings averaged at USD 29.1 per sqm per
the most exclusive areas and decorated with the
month, whereas for Class B offices rents were an
highest quality materials, are mainly concentrated in
averaged of USD 17 per sqm per month in the first
the three largest cities; Istanbul, Ankara and Izmir.
quarter of 2013.
Istanbul has the highest share of Class A offices in
Turkey occupying a total of 2.8 million sqm, followed • Even though commercial business districts’
by Ankara with 400,000 sqm and Izmir with 85,000 occupancy rates are not low, there is still office
sqm. Similarly, Class B offices, which provide more space available in most districts in Istanbul, and
economical options for firms seeking to set up with many new office construction projects in the
offices, are also widely available. pipeline, the availability should improve in the
future.
Investment Support and Promotion Agency of TurkeyStarting a business in Turkey is easier compared to
MENA and BRIC countries
• Foreign Direct Investment Law in Turkey – which • According to Doing Business 2014 report by the
compiles with international standards- came into World Bank, Turkey is ranked 69th among 189
force in 2003. The objective of this Law is to regulate countries on the ease of doing business.
the principles to encourage foreign direct
• Turkey has a higher ranking compared to BRIC
investments; to protect the rights of foreign
countries. The average of the regions close to
investors; to define investment and investor in line
Turkey, Eastern & Central Asia and Middle East &
with international standards; to establish a
North Africa is ranked 73th and 98th respectively,
notification-based system for foreign direct
below the rank of Turkey.
investments rather than screening and approval; and
to increase foreign direct investments through
established policies. This Law establishes the
Figure 16: Ease of Doing Business Analysis
framework and spirit of procedures to be applied to
Ranking, 2013
foreign direct investments.
• With this law, unless stipulated by international Turkey 69
agreements and other special laws: O
Regional Average (Eastern g
1. Foreign investors are free to make direct 73
Europe & Central Asia)
investments in Turkey,
China 96
2. Foreign investors shall be subject to equal
treatment with domestic investors. Regional Average (Middle
98
• Due to new developments in FDI Investment Law and East & North Africa)
Turkey’s increasing reputation in the international
Russian Federation 112
platform resulted in the significant increase in the
number of expats. For example, according to the
Ministry of Labor and Social Security, number of work Brazil 116
permits given to foreigners increased by 86% in 2012
reaching 32,272. Since 2003 a total of 125,697 India 134
permits were provided to foreigners.
0 50 100 150
• It is also crucial to note that the availability free
Source: Doing Business 2013, The World Bank
transfer of funds in Turkey adds positively to its
investment friendly environment.
Investment Support and Promotion Agency of Turkey 22Employment rate in Turkey has been consistently
increasing
Figure 17: Percentage of young people (15-24) in total population in 2012
18%
16%
14%
12%
10%
8%
6%
4%
2%
0%
• In 2012, Turkey’s workforce consisted of approximately 25 million people which demonstrates an increase
at a CAGR of 3% between 2004 and 2012.
• Also, it is noteworthy to mention that global crisis in 2008 did not cut back the jobs in the Turkish Economy
and there was an addition of 83,000 jobs from 2008 to 2009. This number has increased significantly due to
the economic prosperity with an additional of 711,000 jobs from 2011 to 2012.
• Turkey has one of the highest percentage of young people (age between 15 to 24) in the world. The young
population is 42.3% higher than the EU-27 average.
• As education programs continue to expand and as the economy continues to grow, Turkey brings about
exceptionally well educated and highly skilled workforce into its economy to meet the demands of
international industries.
Source: TURKSTAT, United Nations Economic Commission for Europe
Investment Support and Promotion Agency of Turkey 23Turkey offers high skilled labor force with competitive
wages
Figure 18: Minimum Monthly Wage (EUR),
October 2013
France 1.430 • Turkey has a young, dynamic and an educated
population. However, monthly wages are
UK 1.264 relatively lower than the EU or the US. With
regards to minimum wage Eurostat states that
Spain 753 Turkey’s minimum wage was EUR 411 in 2012.
Greece 683
Portugal 566
Turkey 415
0 500 1.000 1.500
EUR
Source: Eurostat Source: Turkstat, Structure of Earnings Survey 2010
Investment tip: Turkey has a
competitive advantage compared
to many European countries with
its highly skilled workforce and low
labor costs.
Investment Support and Promotion Agency of Turkey 24Majority of the Turkish universities offer education in
foreign languages, allowing the young population to be
qualified for international jobs
Marmara Black Sea Figure 19: Distribution of Universities Which
Offer University Education in Foreign Languages
41 5 Universities
Universities 1,15% 3,45% MARMARA-47,13%
1,301 Student 5,75% CENTRAL ANATOLIA-
24,033 Student Quotas
5,75% 21,84%
Quotas AEGEAN-14,94%
Eastern Anatolia MEDITERREAN-5,75%
14,94% 47,13%
BLACK SEA-5,75%
Central Anatolia 1 Universities
21,84% EASTERN ANATOLIA-1,15%
19 Universities 171 Student
Quotas SOUTHEASTERN
11,736 Student ANATOLIA-3,45%
Quotas
Figure 20: Distribution of the Student Quotas ,
Universities that offer Education in Foreign
Languages
0,37% MARMARA-51,72%
3 Universities 2,88%
2,80%
13 Universities CENTRAL ANATOLIA-
5 Universities 1,336 Student 4,74% 25,26%
5,689 Student Quotas AEGEAN-12,24%
Quotas 2,203Student 12,24%
Quotas Southeastern Anatolia 51,72% MEDITERREAN-4,74
Aegean
Mediterranean 25,26% BLACK SEA-2,80%
EASTERN ANATOLIA-
Source: OSYM, Deloitte Analysis
0,37%
SOUTHEASTERN
ANATOLIA-2,88%
• In Turkey, there are a total of 87 universities which offer courses in foreign languages. As it can be
observed from the map, majority of the universities that offer courses in foreign languages are distributed
in the Marmara Region with 47% and Central Anatolia Region with 21%.
• According to research it was also realized that, highest number of quotas for educational openings are also
distributed mainly in Marmara, Central Anatolia, and Aegean Region.
Investment Support and 25
Promotion Agency of TurkeyIII.Engineering Services and Incentives
in Turkey
A. Turkish Architectural and Engineering Services
B. Promotion of R&D Centers and Incentives, Major TDZs.
C. Some of the major engineering consulting firmsTurkish architectural and engineering consulting firms
have the technical capacity and know-how for master
projects
Figure 21: Number of Engineering Students
• According to Euromonitor International, Graduations, 2011-2012 Academic Year
architectural and engineering consulting firms in
Turkey include the following branches and service
lines:
30.000
1. Architectural Services 2.600 24.112
25.000
2. Urban Planning 21.512
Number of
Students
20.000
3. Engineering
15.000
4. Other Consultancy which includes plans and
drawings for engineering and architectural 10.000
firms, environmental services, other
5.000
scientific and technical consulting services
etc. 0
• The achievements of engineering services sector in Undergraduate Graduate Total
Turkey can be explained by the skilled workforce, Source: Ministry of Economy, OSYM
cost effective service compared to international
standards, expertise in diverse markets and project
types.
• In the 2011-2012 academic year, a total of 24,112
students graduated from engineering related
academic fields. Providing employers with highly
skilled employees.
Investment Support and Promotion Agency of Turkey 27Turkey’s architectural and engineering services market
has been developing significantly over the last decade
Figure 22: Turnover of local producers in engineering services sector and forecast, 2005-2017
40.000 80,0%
34.248
35.000 69% 70,0%
30.756
30.000 27.643 60,0%
25.000 23.863 50,0%
22.366
TL million
20.098
20.000 18.004 40,0%
14.798
15.000 13.145 30,0%
10.773 11.235
9.208 22%
10.000 20,0%
5.448 17% 17% 16%
13% 12% 11% 11% 11%10,0%
5.000
7%
4%
0 0% 0,0%
2005 2006 2007 2008 2009 2010 2011 2012 2013f 2014f 2015f 2016f 2017f
Turnover of Local Producers % Growth y-o-y
Source: Euromonitor International
f: forecast
Architectural and engineering services in Turkey have been developing significantly over the last
decade. For instance, between 2005 and 2012 the turnover of local companies grew at a CAGR of 21%
reaching TL 20,098 million TL in 2012.
According to Euromonitor International, turnover of local producers in architectural and engineering
consulting firms will increase to TL 34,248 million which corresponds to a 70% increase compared to
2012.
Investment Support and Promotion Agency of Turkey 28Exports of architectural and engineering consulting
firms increased at a CAGR of 28% between 2005 and
2011
Figure 23: Export values of architectural
and engineering consulting firms, 2005-
2011
• Due to the rapid development of the architectural
500 462
and engineering consulting services in Turkey, their
450 CAGR
exports values increased significantly as well.
400 28%
358
340 • For instance between the years 2005 and 2011
350
export values grew at a CAGR of 28% between
TL Million
300 264 2005 and 2011.
251
250 205 • In 2011 export values of architectural and
200 engineering consulting firms grew by a staggering
150 104 36%
100
50
0
2005 2006 2007 2008 2009 2010 2011
Investment Support and Promotion Agency of Turkey 29Promotion of R&D activities further contribute to
content and quality of Engineering Services
Applications regarding R&D Centers in Turkey are Figure 24: Operational Research &
evaluated and assessed by the General Directorate Development Centers
of Science and Technology under the scope of the
Law no 5746. The aim of this law is to increase the
technological developments in Turkey including R&D
activities, production of goods, standards and
efficiency regarding innovation. 3,5% 13,4%
In order to increase investments, both locally and
internationally, the law offers various incentive 31,0%
mechanisms as follows; 5,6%
• Research and Development Remission
• Income Tax Reduction 6,3%
• Insurance Premium
7,0%
• Exemption from Stamp Tax 9,2%
• Technological Venture Fund
8,5%
Since the enactment of the law, there has been 178 7,8%
applications in order to establish an R&D centeri 153 7,8%
of which were approved by the General Directorate
of Science and Technology. As of September 2013
there are a total of 142 R&D centers that are Automotive Sub-Industry ITC
operational all across Turkey, employing
Automotive Defense
approximately 15,686 engineers. During this five
year frame, R&D expenditure of these enterprises Durable Consumer Goods Electrical and Electronic
was realized as TL 7.3 billion. Figure 19 provides the Chemistry Textile
distribution of operational research and development
Medicine Others
centers. Highest share belongs to Automotive Sub-
Industry with 31% followed by ITC with 9.15% and
Automotive with 7.75%.
Source: ISPAT
Investment Support and Promotion Agency of Turkey 30Technology Development Zones also contribute
significantly to research and development.
Figure 25: Distribution of TDZs across Turkey
Minister of Science, Industry and
Technology Nihat Ergün:
"The goals for the TDZs for 2023
are 5,500 companies, 65,000
employment, and 10 billion
dollars of exports."
One TDZ More than one TDZ Under construction
• TDZs are organized research and business centers
where universities, research institutions, and The Ministry Science, Industry and Technology will
industrial foundations work together to increase meet the fixed costs of the companies that cannot
innovation, technology transfer and productivity so afford their respective costs. Companies do not
as to produce better quality products with lower have to pay income tax until 2023. They can obtain
costs. free access to state-owned intangibles for 5 years
but later have to pay 0.2% of the property tax of
• As of 2013, there are 39 TDZs in operation. Ankara
the intangible.
and İstanbul have the highest numbers of TDZs
with 5 each. Kocaeli and Izmir also have multiple Entrepreneurs operating in this region are exempt
TDZs, 3 and 2 respectively. The rest of the from income tax until 2023 over income made from
provinces labelled above have one TDZ, while the R&D operations and software. Taxes over wages of
13 provinces labelled as under construction all have R&D personnel are exempt until 2023.
one TDZ currently under construction. 50% of the social security premium support for 5
• TDZs are governed by law no. 4691 on Technology years for R&D personnel will be supported under
Development Areas. The incentives provided for the law no. 5746 named R&D Operations Support.
TDZs can be considered under 3 categories: for
companies, for entrepreneurs, and for faculty
members. Source: Ministry of Science, Industry and Technology, Association of
Turkish Technology Parks
Investment Support and Promotion Agency of Turkey 31Some of the major TDZs in Turkey are;
Some TDZs Overview
METUTECH is a TDZ established in Middle East Technical University Campus. METUTECH’s existing company
profile is based on software development and electronics industry. METUTECH, reached a total of 3300
personnel, 2700 of which are the researchers in 240 firms 90% of which are SMEs and including multinationals
such as Cisco, and Siemens
More than 85% of the firms residing in METUTECH are small and medium sized enterprises (SMEs), and 65% of
these firms are specialized in ICT. METUTECH is awarded the highest performing TDZ by Ministry of Science,
Industry and Technology in 2013.
Bilkent Cyberpark is a TDZ established jointly by Bilkent University and its affiliate Bilkent Holding.
Cyberpark has been operating under the Technology Development Zones Legislation and is one of the biggest
TDZs in Turkey in terms of closed area of 100,000 sqm, number of its tenant companies and the business
volume in the zone. Bilkent Cyberpark has incubation center, patent support office R&D start-up capital support
and human resources platform.
İTÜ ARI TDZ, (Advanced Research and Innovation) is in Istanbul Technical University’s Maslak Campus.
According to DDK’s reports, ARI TDZ has a share of 75 percent of the all patents, 37 percent of the all exports,
and 45 percent of R&D budget in Turkey’s TDZs. It has also a share of 85 percent of the budget of TTGV. Arı
TDZ is awarded the highest performing TDZ by Ministry of Science, Industry and Technology in 2013.
Konya TDZ is established in the campus of Selçuk University. It is one of the fastest developing TDZs in Turkey
with its more than 100 tenant companies. Konya TDZ is one of the five TDZs in Turkey that are full members of
IASP, International Association of Science Parks.
There are more than 100 domestic and foreign tenant companies. 20 % of tenant companies are established by
academicians.
Source: Ministry of Science, Industry and Technology
Investment Support and Promotion Agency of Turkey 32Technology development zones allow universities and
the industry to meet and provide low rent costs for
investors
• In addition, investors may take advantage of lower
rents in TDZs. In order to set up an office in a TDZ,
the company in question needs to follow the
application procedure determined by individual
TDZs.
• According to the Law on Technology Development
Zones, each TDZ provides basic amenities,
electricity and internet infrastructure, waste water
treatment facilities and an administrative building
by default. Many TDZs have additional services
including the possibility to take advantage of the
university laboratories, research centers, patent
support centers, start-up capital support centers
and technology transfer centers.
• Besides directly renting an office in a business
Technopark Rent district or renting in a TDZ, investors also have the
opportunity to make use of the services provided
METU Technopark USD 10.3/m2 + VAT*
by specialized office rental firms that not only rent
pre-prepared offices with integrated services such
Antalya Technopark USD 8.4 – 9.4/m2*
as maintanence, internet access and automatic
payment of bills, but also provide the possibility to
Erciyes Technopark USD 3.3-5.2/m2* rent an individual workspace in a shared office
referred to as a Coworking office.
Uludağ Technology USD 13.8 /m2**
Development Zone • Such services not only facilitate and speed up the
process of setting up an office, but also can be
Source: METU Techopark, Antalya Technopark, Erciyes Technopark, Uludağ more economical under certain circumstances.
Technology Development Zone
*Converted using 2013 year-end TL/USD exchange rate of 2.1304
Selected providers of office rentals with integrated
**Converted using 2913 year-end USD/EUR exchange rate of 1.3774 services are provided above.
Investment Support and Promotion Agency of Turkey 33Some of the major Turkish Engineering Consulting Firms Investment Support and 34 Promotion Agency of Turkey
IV. Testing Services in Turkey

A. Technical Testing and Analysis Sector in Turkey

B. Forecast of Technical Testing and Analysis Sector in Turkey

C. Growth of Relevant Industries

D. Incentives for Test Centers

E. Major Players and NGOs
As industrial development in Turkey grows, so does the
Technical Testing and Analysis Sector
             Figure 26: Technical Testing and Analysis Turnover, 2005-2012
             1.200                                                                                                               60%
                                                        52%                                                                      50%
             1.000
                                                                      40%                                                        40%
               800
TL Million

                                                                                                                                 30%
               600                                                                     20%                       21%             20%
                                                                                                        13%                12%   10%
               400
                                                                                                                                 0%
               200
                                          -11%                                                                                   -10%
                  0                                                                                                              -20%
                         2005         2006         2007          2008            2009                2010     2011      2012

                                Composition and Purity Testing                 Technical Inspection of Road Transport
                                Other Testing and Analysis Services            Growth y-o-y %

                         Technical Testing And Analysis
                                                                        • Technical testing and analysis market in Turkey
                                                                          contains variety of business lines such as composition
                                                                          and purity testing, technical inspection and road
                            Composition and Purity                        transport, and other testing and analysis services.
                                  Testing                               • Between 2005 and 2011 the turnover increased at a
                                                                          CAGR of 21% and grew by 20.5% during 2011
                                                                          reaching TL 961 million. The highest share of the
                            Technical Inspection and
                                Road Transport
                                                                          business line belonged to composition and purity
                                                                          testing.

                          Other Testing and Analysis
                                   Services
                                                                 Source: Euromonitor International

             Investment Support and Promotion Agency of Turkey                                                                          36
Technical Testing and Analysis Forecast is a growing
sector
Figure 27: Technical Testing and Analysis Turnover Forecast, 2013-2017
1.200
1.000 959
854
761
TL Million
800
678
604
600
470 476
421 425
378 379
400 305 303 339 339
200
0
2013 2014 2015 2016 2017
Composition and Purity Testing Technical Inspection of Road Transport Other Testing and Analysis Services
Source: Euromonitor International
• Technical testing analysis including the accumulation Investment tip: As industries such as
of its subsectors is expected to increase to TL 1,905 manufacturing, chemicals and ICT
million by 2017. continue to grow in Turkey, the need
• Expectations according to Euromonitor state that the for technical testing and analysis will
fastest developing subsector will be composition and grow.
purity testing reaching TL 959 million, followed by
other testing/analysis services with TL 476 million
and technical inspection of road transport with TL 470
million.
Source: Euromonitor International
Investment Support and Promotion Agency of Turkey 37Continuous growth of manufacturing, and chemicals
industry have positive impact on technical testing and
analysis sector
Manufacturing Industry Chemicals Industry
Size of Manufacturing CAGR Chemicals Production CAGR
Industry, 2009 - 2012 8% in Turkey, 2005-2011 18 %
200 FDI in Chemicals Manufacturing
CAGR, 2010-2012 Industry (USD Million)
Billion
USD
100 17% 932
1000
476
0 500
10% 127
2010 2011 2012
0
Export Import 2010 2011 2012
Overall Economy
GDP Growth (percentage change in real GDP)
15,0 9.3 8.4 9.3
10,0 6.9 4.7 8.8
5,0 0.8
0,0 5.3 2.2
-5,0 -5.2
-10,0
2003
2004
2005
2006
2007
2008
2009
2010
2011
2012
Investment Support and Promotion Agency of Turkey 38Testing Centers are considered as a «Priority Sector»
and are supported through New Investment Incentive
Scheme
• The New Investment Incentives Program in According to Board Decision on Government
Turkey has been effective since 1st of January Incentives Article 17, Test centers are
2012 and offers four different kinds of schemes. considered to be a «Priority Sector» and can
They are categorized as follows; benefit from the Regional Investment Incentive
1. General Investment Incentive Scheme Scheme. Through this program investors are
2. Regional Investment Inventive Scheme exempt from VAT and custom duty. They
receive a certain amount of tax deduction and
3. Large Investment Incentive Scheme land allocation along with social security
4. Strategic Investment Incentive Scheme premium support.
Table 3: Regional Investment Scheme Benefits
VAT Customs Duty Tax Deduction Land Social
Exemption Exemption Allocation Security
Premium
Support
Investment Support and Promotion Agency of Turkey 39Test Centers benefit from regional incentives
Figure 28: Incentive Regions (1-6)
Table 4: Tax Reductions and National Insurance
Contribution According to Regions
Region 1 2 3 4 5 6
• As mentioned previously Test Centers are
Regional Incentive Applications
considered to be a «Priority Sector».
Tax Reduction
Investment 15% 20% 25% 30% 40% 50% According to Article 17 in the Board
Contribution Rate Decision for Government Incentives. Test
Incentive for Large Scale centers can benefit from Region 5
Investments incentives even if they are located in
Tax Reduction Regions 1-4.
Investment 25% 30% 35% 40% 50% 60% • However, if the investment is realized in
Contribution Rate Region 6, it can benefit from this specific
Support for Employer's area’s incentives as it can be seen on the
National Insurance 2 Year 3 Year 5 Year 6 Year 7 Year 10 Year
Contribution (Both)
Table.
Investment Support and Promotion Agency of Turkey 40Achievements of ASELSAN and TAI are examples of local
success stories in defense industry
FEV Festo Intertek Applus IDIADA
• FEV chose Istanbul as • Festo is a leading • Intertek is a global • Applus IDIADA is one
the location of its in world-wide supplier of company with 30,000 of the leading
subsidiary in 2011 automation technology employees and 500 providers of design,
based on both Turkish and the performance laboratories in more testing, engineering
and key international leader in industrial than 100 countries and homologation
players in one of the training and education providing various services for the
booming regions of programs. quality and assurance automative industry
the world. services. worldwide. It is active
• In addition to
• From its Istanbul • Intertek has been in 22 countries and
conducting an
office, FEV will provide active in Turkey since employs 1,600
education program
local support and 1995 and it was the engineers globally.
with Lifelong Learning
project management Center (BUYEM) to first laboratory with • After opening a
for Turkish customers train practice-oriented ISO / IEC 17025 branch office in Turkey
by leveraging its engineers, Festo also Experiment and in 2010, Applus
worldwide expertise in offers 'mechatronics Calibration Laboratory IDIADA signed a
powertrain technology training program' with Accreditation cooperation
and know-how. They collaboration of certificate. agreement with the
are also a major Turkish and German Automotive
supplier of advanced • Intertek offers
expertise in order to services for the Technologies Research
testing and increase the number and Development
instrumentation following business
of qualified employees Company (OTAM) to
products and services. lines; textile, chemical
in mechatronics provide the Passive
analysis, automotive,
industry. food and many more. Security Static Testing
and Certification
Service in 2011.
4
Investment Support and Promotion Agency of Turkey
1Success Stories: Ford Otosan
• Ford Otosan is a publicly traded company that has
been established by Ford Motor Company and Koç “The new engineering center is critical for Ford's 'One
Holding, a Turkish conglomerate, in 1959. Koç Ford' strategy as Turkey is a key manufacturing center
Holding and Ford Motor Company hold equal shares for Ford-branded commercial vehicles marketed in
in Ford Otosan. Europe and elsewhere. […] Ford Otosan has all the
required talent to design, engineer, manufacture, and
• Ford Otosan, which accounts for 55% of Turkey’s test a vehicle from the ground up. This facility is a
commercial vehicle production and 60% of exports, great accomplishment for Turkey's auto industry.”
has the largest automotive R&D facility in Turkey.
The facility employs 1,240 engineers and is not only Vice President, Product Development, Ford of Europe
the largest automotive R&D facility in Turkey, but for Ford Motor Company, Ms. Barb J. Samardzich
also is Ford’s third largest R&D facility globally.
• In addition to its manufacturing facilities, Ford
Otosan also has state of the art automotive testing
facilities and engineering centers. Ford Otosan’s
testing facility was named the Engine Testing
Facility of the Year in 2013 by the Automotive
Testing Technology International Magazine.
• In 2012, Ford Otosan has announced that it will be
launching a new Engineering Center in Sancaktepe “One of the cornerstones that will help Turkey achieve
Engineering Center, in addition to its currently its 2023 vision of becoming one of the top 10 global
operating Engineering Center in Gebze which opened economies is to develop our R&D power. With 2.7
in 2007. The Engineering Center in Sancaktepe, billion TL R&D spending in the last 5 years, our group
expected to start operations in 2014, which will be has the biggest R&D spending in Turkey.”
the largest automotive testing facility in Turkey, will
require an investment of approximately USD 28 Board Chairman of Ford Otosan, Mr. Ali Y. Koç
million*.
Source: Ford Otosan
*Converted using the 2013 year end TL/USD exchange rate of 2.1304
Investment Support and Promotion Agency of Turkey 42Success Stories: SGS
• SGS, an industry leader in inspection, verification, “Through organic growth and acquisitions, our
testing and certification services, has more than revenue in Turkey grew by 50% in 2012 compared to
75,000 employees and operates a network of 1,500 the previous year whereas our employee numbers
offices and laboratories globally. increased by 350. Last year, we have acquired four
companies operating as food laboratories in Mersin,
• Established in 1878, SGS had a global revenue of Antalya and Antakya, and in Ankara a geochemistry
USD 6.1 billion in 2012, an increase of 16.3% when laboratory started operations. With these new
compared to 2011. In addition, in 2012, it had a net facilities, 120 new employees joined SGS, and our
profit of USD 608 million and concluded 18 total number of employees now stands at
acquisitions. approximately 1000. Until the end of this year, we
• SGS operates in Turkey with 7 offices and 8 are planning to establish two laboratories operating in
laboratories most of which conduct analysis and new subjects. ”
certification of food stuffs.
SGS Turkey, General Manager, Mr. Hakan Sebükcebe,
• The target revenue for the Turkish operations in June 2013
2012 was USD 73 million* whereas USD 17 million*
of that amount was expected to be generated by
exports.
• SGS has also announced its intention to move a part
of its European operations into Turkey in order to
take advantage of its more economical and speedy
analysis capabilities. For this reason, SGS has
established the largest non-food laboratory of Europe
in Turkey.
Source: SGS, Dünya Gazetesi
*Converted using the 2012 year end USD/TL exchange rate of 1.7776
** Converted using the 2012 year end USD/CHC exchange rate of 0.9151
Investment Support and Promotion Agency of Turkey 43Accreditation plays a crucial role in Turkish System. A
look at the major institutions for accreditation
TSE TUVTURK TURKAK
• Turkish Standards Institution has
• TUVTURK; is the sole institution • Turkish Accreditation Agency
been established by the law
authorized for periodical vehicle founded in 1999 is a public
dated in 1960 for the purpose of
inspection in Turkey. agency that registers eligibility
preparing standards for items
• Through it's country-wide service criteria of quality and safety of
and products together with
network with 3,500 employees in products and services.
procedures and services.
• The Institute is a public founding 196 test stations, 3 motorcycle • Accreditation is a quality
which is conducted according to and 73 mobile test stations, infrastructure tool which supports
the special rules of law and has a performs yearly 10 million the credibility and value of the
juristic personality. Only the inspection totally. work carried out by conformity
standards that have been • Stations provide the following assessment bodies and thus of
accepted by TSE get the name of services: Periodical Vehicle the corresponding attestations
Turkish Standards. These Inspection, Roadworthiness issued by them (test and
standards are voluntary and can inspection, Inspection after inspection reports, calibration
be made compulsory by the modification, Compulsory certificates, certifications of
approval of the Ministry of Inspection, Exhaust Gas Emission management systems, products
Industry and Trade. Test, Detection. and personnel and other
attestations).
• The services conducted by TSE
include Certification, CE mark, • TURKAK, started to provide
Standard Sales, Test Services, accreditation services in 2001 and
Proficiency Test. became a signatory of MLA with
EA for all the available
accreditation schemes at 2008.
Currently TURKAK is a full
member of EA, IAF and ILAC.
Investment Support and Promotion Agency of Turkey 44V. Call Centers A. Global Outlook on Call Centers B. Call Center Market Growth in Turkey C. Call Center Incentives D. Success Stories
Turkey had the highest growth rate in call centers
compared to some of the major European Countries
Figure 29: Growth Rate in Call Center, 2011-2012 Figure 30: Call Center Average Wages
according to Countries, 2012
18% 16% 2.500
16% 2.032
2.000 1.853
14% 1.758 1.696
12% 1.503
9% 1.410
1.500
10% 7,50% 8%
EUR
8% 950
5% 5,60% 1.000 900
800
6% 4%
3,10% 550
4% 2%
1% 500
2%
0%
0
UK
Italy
France
Spain
Hungary
Turkey
Germany
Greece
Estonia
Belgium
Turkey
Italy
Spain
France
UK
Hungary
Germany
Greece
Estonia
Belgium
Source: European Contract Center Benchmark, 2012 Source: European Contract Center Benchmark, 2012
• Globally the United Kingdom has the largest call center market in
Europe followed by Ireland, Netherlands and Belgium. However Investment tip: Call Center
when the growth rate of the market is considered it can be seen Sector in Turkey is very
that Turkey surpasses majority of the EU member states with 16% promising with its high growth
growth in 2012 compared to the previous year. rate and low average wages
• Also considering the wages for call center employees, Turkey offers
compared to major European
the lowest wages with EUR 550 on average compared to countries Union Member States.
such as Italy, Belgium, Germany, and Spain.
Investment Support and 46
Promotion Agency of TurkeyCall Center Market in Turkey is valued at USD 1.4 billion
• According to Call Centers Association, the market • According to Call Centers Association of Turkey,
value of call centers in Turkey was USD 1.4 billion the call center sector in Turkey offers a
as of October 2013. workforce potential 350,000 by 2023.
• Number of call centers in Turkey accounted for • As it can be observed from Figure 25, the ratio
1,100. Planned investments for the future regarding of in-house activities and outsource activities
call centers are mostly focused on Black Sea and dynamics changed over time. From 2007 until
Central Anatolian Region. 2010 there was a prominence of in-house
activities for call centers whereas in 2011 this
• Call Center Sector in Turkey contributes significantly
ratio started to even out between in-house and
to the workforce by having a total of 70,200
outsource activities, leading to outsource
employees in 2013. This number has increased by
activities eventually surpassing the in-house.
4.7% compared to 2012.
Figure 31: Workforce in Call Centers, Figure 32: Workforce Distribution According
2007-2013 to Cities in Turkey, 2013
80.000
CAGR
16.1%
60.000 Istanbul
of People
Number
39,30% 46,50% Ankara
40.000 Izmir
Other
20.000
0 4,60%
8,60%
2007
2008
2009
2010
2011
2012
2013
Inhouse Outsource
Source: Call Center Association Source: Call Center Association
Investment Support and 47
Promotion Agency of TurkeyNumber of Seats in Call Centers grew at a CAGR of 18%
between 2011 and 2013
Figure 33: Number of Seats in Call Centers in Turkey, 2011-2013
CAGR, 2011-2013
90.000
80.000 59%
Public Sector
CAGR
70.000 18% Automotive 51%
60.000 Health 77%
50.000 Electronics/ICT
48%
40.000 Wholesale/Retail
17%
Logistics
30.000
Finance 18%
20.000
Telecommunication 17%
10.000
Other
15%
0
2011 2012 2013* 8%
• Number of seats in call centers increased significantly in the recent years. Between 2011 and 2012 there
was an increase of 19% from 48,900 to 58,200. In 2013 number of seats reached a total of 67,500, an
increase of 16% compared to the previous year.
• In 2013, health sector demonstrated the highest increase with 158% compared to 2012, allowing it to
have a more prominent position in the call centers sector. Currently, the highest share of call center
belongs to telecommunication sector with 25.3%, followed by finance with 21.2%.
Source: Call Center Association
(*) As of October 2013
Investment Support and 48
Promotion Agency of TurkeyYou can also read