SARS-Coronavirus-2 / COVID-19: An Update on Developments in Europe March 26, 2020 - Goldman Sachs
←
→
Page content transcription
If your browser does not render page correctly, please read the page content below
Consumer and Investment Management Division

   SARS-Coronavirus-2 / COVID-19: An Update on Developments
   in Europe

   March 26, 2020

      Investment Strategy Group
This material represents the views of the Investment Strategy Group (“ISG”) in the Consumer and Investment Management Division of Goldman Sachs. It is not a product of
Goldman Sachs Global Investment Research. The views and opinions expressed herein may differ from those expressed by other groups of Goldman Sachs.
Overview of Today’s Call
• Update on SARS-Coronavirus-2
• Outlook on SARS-Coronavirus-2 David Heymann, MD, Professor of Infectious Disease Epidemiology
at the London School of Hygiene and Tropical Medicine
• Economic Impact Sven Jari Stehn, Managing Director, Goldman Sachs Global
Investment Research
• Monetary and Fiscal Policy Response Silvia Ardagna, Managing Director, Goldman Sachs Investment
Strategy Group
• Market Implications Peter Oppenheimer, Managing Director, Goldman Sachs Global
Investment Research
2
Source: Investment Strategy Group.SARS-CoV-2 Pandemic Timeline
New Cases of Infections (Daily)
50,000
45,000
Total Infected: 466,826
40,000
Total Fatalities: 21,152
WHO declares a global
35,000 pandemic
30,000
Infections in US
China temporarily changes exceed 100
25,000 accounting method
Infections in Iran
WHO declares a exceed 100
20,000 Thailand reports first
public health
international case Infections in Italy
emergency
exceed 100
15,000 China identifies a new
China locks down
coronavirus Infections in Korea
Wuhan
10,000 exceed 100
China informs WHO
First reported
of pneumonia cases First US case
infection
in Wuhan
5,000
0
2-Dec-19 10-Dec-19 18-Dec-19 26-Dec-19 3-Jan-20 11-Jan-20 19-Jan-20 27-Jan-20 4-Feb-20 12-Feb-20 20-Feb-20 28-Feb-20 7-Mar-20 15-Mar-20 23-Mar-20
3 months: 12 days: 3 days: 3 days:
100,000 100,000 100,000 100,000
* As of March 25, 2020 3
Source: Investment Strategy Group, WHO, CDC, National Health Commission of People’s Republic of China, John Hopkins University.Shifting Epicenter of the Pandemic
Share of New Daily Cases of Infection (Population)
100%
Iran
Korea (83.59mm)
90%
(51.51mm)
Mainland China Italy
80%
(1.42bn) (59.13mm)
70%
60%
50%
Rest of Europe
40% (685.69mm)
30%
20% United States
(331.43mm)
10%
Princess Diamond
Others
0% (3,711)
23-Jan 29-Jan 4-Feb 10-Feb 16-Feb 22-Feb 28-Feb 5-Mar 11-Mar 17-Mar 23-Mar
As of March 23, 2020.
Source: Investment Strategy Group; WHO; John Hopkins University; NHC of People’s Republic of China 4Uneven prevalence and consequences around the world
Select Nations, Population Size, Infections, Fatalities, and Date of 1st Infection
Infections per Fatalities per
Population Total Infections Fatalities Date of 1st Infection
million people million people
China 1,420,000,000 81,218 57 3,281 2.3 2 December 2019
South Korea 51,510,000 9,137 177 126 2.4 20 January
Japan 126,500,000 1,307 10 45 0.4 20 January
United States 331,430,000 60,115 181 827 2.5 21 January
France 65,720,000 25,583 389 1,331 20.3 25 January
Germany 82,540,000 37,323 452 206 2.5 28 January
Italy 59,130,000 74,386 1,258 7,503 126.9 31 January
United Kingdom 67,330,000 9,640 143 465 6.9 31 January
Spain 46,460,000 47,610 1,025 3,647 78.5 1 February
Switzerland 8,670,000 10,897 1,257 153 17.6 25 February
The Netherlands 17,180,000 6,438 375 356 20.7 27 February
As of March 24, 2020.
Source: Investment Strategy Group; WHO; John Hopkins University; NHC of People’s Republic of China; UN Population Data 5Healthcare Across Countries
1. Share of Population Over 65, % of Total 2. Global Health Security Index: Health System Score1
Rank2 Country Health System Score
South Korea 14.4
1 United States 73.8
United States 15.8
3 Netherlands 70.2
Norway 17.0
7 Switzerland 62.5
United Kingdom 18.4
8 France 60.9
Switzerland 18.6
11 United Kingdom 59.8
Netherlands 19.2
Spain 19.4
12 Spain 59.6
France 20.0
13 South Korea 58.7
Sweden 20.1 14 Norway 58.5
Germany 21.5 17 Portugal 55.0
Greece 21.7 20 Sweden 49.3
Portugal 22.0 22 Germany 48.2
Italy 22.8 25 Japan 46.6
Japan 27.6 50 Greece 37.6
10 12 14 16 18 20 22 24 26 28 30 54 Italy 36.8
The Health System assessment - part of the Global Health Security index1 by Johns Hopkins - places Italy below
major European countries and the US in terms of overall sufficiency and robustness of the health system in dealing
with a pandemic.
1. Global Health Security Index is a comprehensive assessment of health security capabilities across countries. The health system score assesses whether the health system is sufficient
and robust to treat the sick and protect health workers. 2. Out of 195 countries studied. 6
Source: Investment Strategy Group, OECD, Nuclear Threat Initiative, Johns Hopkins Center for Health Security, The Economist Intelligence Unit.Healthcare Across Countries (cont.)
1. Hospital Beds: Acute Care (per 1,000 Inhabitants) 2. Number of Physicians (per Thousand People)
Japan 7.79 Switzerland 4.2
South Korea 7.14 Germany 4.2
Germany 6.02 Italy 4.1
Switzerland 3.56 Spain 4.1
France 3.09 Netherlands 3.5
Italy 2.62
France 3.2
United States 2.44
United Kingdom 2.8
Spain
United States 2.6
2.43
Japan 2.4
United Kingtom 2.11
South Korea 2.4
Source: Investment Strategy Group; OECD 7Healthcare Across Countries (cont.)
1. Number of Tests Performed (per Million People) 2. Ventilators (per Million People)
South Korea 6,148.0 (March 20) United States 523.9
Italy 5,022.2 (March 24)
Germany 302.9
Australia 4,473.4 (March 20)
South Korea 197.3
Guangdong (PRC) 2,820.4 (Feb 24)
Germany 2,023.3 (March 15) Switzerland 138.4
United Kingdom 1,343.2 (March 24) United Kingdom 118.8
United States 1,083.7 (March 24) Spain 99.6
Spain 645.7 (March 22)
Australia 90.6
France 559.1 (March 15)
France 76.1
Switzerland 461.3 (March 7)
The Netherlands 66.9
Netherlands 349.2 (March 7)
Japan 117.8 (March 19) Italy 50.7
• According to a comprehensive WHO-China study of 55,924 cases in China (through 20 Feb):
o 80% of infection cases were mild to moderate (which included non-pneumonia and pneumonia cases);
o 13.8% were severe (dyspnea, respiratory frequency ≥30/minute, blood oxygen saturation ≤93%, PaO2/FiO2
ratio 50% of the lung field within 24-48 hours); and
o 6.1% were critical (respiratory failure, septic shock, and/or multiple organ dysfunction/failure).
• About a quarter of severe and critical cases required mechanical ventilation while the remaining 75% required
only oxygen supplementation.
Source: Investment Strategy Group; Our World in Data, Covidtracking.com; WHO; Various news outlets 8The Estimated Case Fatality Rate has Increased Since the Initial
Days of the Outbreak, but Varies Considerably by Location and Age
1. Estimated Case Fatality Rate for SARS-CoV-2 Over Time (%) 2. Case Fatality Rate by Location
5.0% Italy 10.09%
4.531%
Iran 7.69%
4.5%
Spain 7.24%
4.0% France 5.21%
Wuhan 5.05%
3.5% 3.106%
United Kingdom 4.82%
3.0% Hubei 4.67%
Worldwide (ex mainland China) 4.65%
2.5%
Worldwide 4.53%
2.0% China (mainland) 4.04%
1.998% 2.148%
Hubei (ex Wuhan) 3.58%
1.5% 1.395% South Korea 1.38%
1.0% United States 1.38%
0.5% China (mainland, ex Hubei) 0.88%
Germany 0.55%
0.0%
20-Jan 24-Jan 28-Jan 1-Feb 5-Feb 9-Feb 13-Feb17-Feb21-Feb25-Feb29-Feb 4-Mar 8-Mar12-Mar16-Mar20-Mar24-Mar
The estimated case fatality rate of SARS-CoV-2 has increased steadily, reaching 4.531% based on current data, but
continues to remain significantly lower than for SARS (10%) or MERS (34%). As the outbreak evolves, the fatality
rate is likely to fluctuate.
Fatality rate varies considerably by location, and it is generally higher among older adults, among males, and those
with pre-existing conditions (cardiovascular disease, diabetes, and chronic respiratory disease).
As of March 24, 2020.
Source: WHO, National Health Commission of the People’s Republic of China; Korea’s CDC; John Hopkins University, Washington Post, Investment Strategy Group 9What are the Trend Lines in Europe?
30 Days of New COVID-19 Cases (Log Scale; T-1= Day When Country Reached 100 Cases Cumulative)
100,000 China Daily Cases Italy Daily Cases USA Daily Cases
Spain Daily Cases Germany Daily Cases Switzerland Daily Cases
France Daily Cases UK Daily Cases The Netherlands Daily Cases
10,000
1,000
100
10
1
T-1 T-3 T-5 T-7 T-9 T-11 T-13 T-15 T-17 T-19 T-21 T-23 T-25 T-27 T-29 T-31
T-1 for mainland China is 23 January when the National Health Commission of the People’s Republic of China and the World Health Organization started publishing
more comprehensive data.
As of March 24, 2020.
Source: Investment Strategy Group; WHO; John Hopkins University; Washington Post; New York Times; NHC of People’s Republic of China 10Second Wave?
Daily New Cases in Hong Kong, Taiwan, and Singapore
90 Hong Kong (daily new cases) Taiwan (daily new cases) Singapore (daily new cases)
80
70
60
50
40
30
20
10
0
21-Jan-20 28-Jan-20 4-Feb-20 11-Feb-20 18-Feb-20 25-Feb-20 3-Mar-20 10-Mar-20 17-Mar-20 24-Mar-20
As of March 24, 2020.
Source: Investment Strategy Group; WHO; John Hopkins University, NHC of People’s Republic of China 11Consumer and
Investment
Economic Impact: Europe is Already in Recession Management
Division
1. Euro Area Purchasing Managers’ Indices 2. UK Purchasing Managers’ Indices
65 Composite PMI Services Manufacturing
65 Composite PMI Services Manufacturing
60 60
55 55
Index (50 + = Expansion)
Index (50+ = Expansion)
50 50
48.0
45 44.8 45
40 38.1 40 40.2
38.1
36.2 37.1
35 35 35.7
33.5 34.5
31.4
30 30
37.1
25 25
2006 2008 2010 2012 2014 2016 2018 2020 2006 2008 2010 2012 2014 2016 2018 2020
Early survey indicators combined with anecdotal evidence of steep declines in activity suggest that the strict
containment measures have already pushed the Euro Area and the UK into a deep recession.
March business surveys signal sharp contraction in activity, particularly in the services sector.
The Purchasing Managers Index (PMI) – closely linked to GDP growth – has recorded the sharpest decline on record
in March, in both the Euro area and the UK. The latest composite PMI levels are below those registered during the
Global Financial Crisis.
Source: Investment Strategy Group, Haver. 12Consumer and
Investment
Economic Outlook: Activity to Drop Sharply in H1 Management
Division
Peak Impact on Euro Area Domestic Activity – GS GIR Projections
Goldman Sachs Global Investment Research (GIR) has downgraded their European growth outlook sharply since the
start of the outbreak.
The growth disruption is expected to be driven by:
- a hit to domestic demand
- a disruption of supply chains
- a hit to foreign demand
Source: Investment Strategy Group, Goldman Sachs Global Investment Research. 13Economic Outlook: Sharp Recession in H1, Recovery Later Consumer and
Investment
in the Year Management
Division
1. Outlook on Euro Area 2020 Growth – GS GIR Projections 2. GS GIR Annual GDP Growth Projections across Countries
2019 2020 2021
Pre-Virus Latest Pre-Virus Latest
Euro Area 1.2 1.0 -9.0 1.3 7.8
Germany 0.6 0.9 -8.9 1.4 8.5
France 1.3 1.1 -7.4 1.4 6.4
Italy 0.2 0.2 -11.6 0.7 7.9
Spain 2.0 1.8 -9.7 1.7 8.5
UK 1.4 1.0 -7.5 2.1 7.3
US 2.3 2.3 -3.8 2.4 5.3
GIR now expects a contraction of Euro area real GDP of 4% in Q1 and 11.4% in Q2, but a recovery thereafter.
The Q2 contraction in Euro area growth would be more than three times bigger than that seen at the depth of the
Global Financial Crisis in 2009Q1. This would push the full-year 2020 growth rate to –9% yoy.
In the UK, GIR also look for sharp declines in Q1 and Q2, resulting in full-year 2020 growth at -7.5%.
Source: Investment Strategy Group, Goldman Sachs Global Investment Research. 14Consumer and
Investment
ECB and BoE Monetary Policy Measures Management
Division
1. European Central Bank: Key Measures Announced 2. Bank of England: Key Measures Announced
€750bn (6.5% of GDP) Pandemic Emergency Asset Policy Rate reduced from 0.75% in February 2020 to
Purchase Program (PEPP) launched: 0.10% currently
- Comprised of government and private sector purchases £200bn (9% of GDP) Asset Purchase Program
- Greek bonds included in PEPP, despite the country’s launched:
sub-investment grade rating
- Comprised of government and corporate purchases
- Increased flexibility in PEPP purchases across time,
asset classes and jurisdictions Covid Corporate Financing Facility
€120bn (1% of GDP) Additional Asset Purchases - Purchases of commercial paper up to one-year maturity
under Existing Asset Purchase Program Lending Facilities:
Corporate purchases expanded to include non-financial - New Term Funding Scheme for banks with additional
Commercial Paper incentives for lending to SMEs
Lending Facilities:
- Additional Long-Term Refinancing Operations for banks
- More attractive terms for the Existing Targeted Long-
Term Refinancing Operations for banks
“The Governing Council will do everything necessary within its “The Bank is coordinating its actions with those of HM Treasury in
mandate. The Governing Council is fully prepared to increase the size order to ensure that our initiatives are complementary and that they
of its asset purchase programmes and adjust their composition, by as will, collectively, have maximum impact, consistent with our
much as necessary and for as long as needed” independent responsibilities”
ECB Policy Statement 18 March 2020 BoE Policy Statement 11 March 2020
Source: Investment Strategy Group, ECB, BoE. 15Consumer and
Investment
Summary of European Fiscal Measures Management
Division
Fiscal Policy Announcements as % of GDP
25%
22%
20% 19%
15%
15%
% of GDP
12%
10%
8%
5%
3.3%
2.0% 1.9% 1.6%
1.4%
0%
Germany France Italy Spain UK
Fiscal Measures (excluding automatic stabilisers) Loan and Debt Guarantees
Sources: Investment Strategy Group, German, French, Italian, Spanish, UK Ministries of Finance. 16Consumer and
Investment
How Do Government Guarantees Work Management
Division
• Guarantee not • Pays interest on
triggered obligation
• Reimburses the loan • Disburses the loan
• Guarantee triggered (bond)
and public debt
permanently rises • Defaults
7 6 5
Government Corporate Commercial ECB
Bank
1 2 3 4
• Provides loan (debt) • Asks for a loan • Grants the loan, which • Provides liquidity at
guarantee to corporates. without the guarantee generous terms
• Issues a bond could not have been
• Reduces the default granted because of the • ECB buys corporate
risks because borrower’s risk profile. bonds as part of QE
government assumes
obligation if corporates • Taps ECB Lending
defaults. Facility
Note: Simplified example of how government loan and debt guarantees work.
Sources: Investment Strategy Group. 17Consumer and
Investment
Detailed Fiscal Measures in Selected Countries Management
Division
Fiscal Measures Guarantees
BN of Local BN of Local
Currency % of GDP Currency % of GDP
France
EUR 45 bn for health spending, work-subsidy scheme for employees and self-employed, tax deferrals or
45 1.9 300 12.4
cancellation for companies
EUR 300bn of loan guarantees
Germany
EUR 50bn as direct transfers to SMEs 70 2.0 750 21.8
EUR 20bn for health spending, transfers to households and work-subsidy scheme
EUR 550bn loan guarantees
EUR 200bn Economic Stabilisation Fund (ESF)
Italy
EUR 25bn for health spending, transfers to households, work-subsidy scheme , tax and utility bill deferrals for
25 1.4 340 19.0
companies
EUR 340bn loan guarantees
Spain
EUR 20bn for health spending, unemployment benefits, work-subsidy scheme, zero social security tax for
small businesses 20 1.6 100 8.0
EUR 100bn loan guarantees
UK
GBP 72bn for health spending, sick-pay leave, unemployment benefits, job retention scheme, tax cancellation
72 3.3 330 14.9
or deferrals for SMEs
GBP 330 loan guarantees
Source: Investment Strategy Group, German, French, Italian, Spanish, UK Ministries of Finance. 18Consumer and
Investment
Detailed EU-Wide Fiscal Measures Management
Division
The scale of EU-wide fiscal measures implemented so far is minimal and the financial burden of the fiscal response
has been left to Member States’ national budgets.
The EU-wide response has been limited to
– relaxing state aid and fiscal rules
– diverting funds (indicated in the table above), previously earmarked for other types of projects, to COVID-19
related spending.
Sources: Investment Strategy Group. 19Consumer and
Investment
Policy Tools Under Discussion in the Euro Area Management
Division
Source: Investment Strategy Group, ESM. 20Market Performance
Country Equity Performance Since February 19, 2020
0.0
-5.0
-10.0
-15.0
-20.0
-25.0 -22.7
-26.7
-30.0
-31.1 -32.0
-35.0 -32.5 -32.6 -33.1 -33.8
-35.1 -35.9 -36.6
-40.0 -38.2 -38.9
Performance from peak (February 19th)
-45.0
Similar to equity markets in other regions, nearly every European equity market has fallen by more than 30% from
their February peak level.
Equity markets of countries with the highest rates of infection, such as Italy, have fared worst.
21
Source: Investment Strategy Group, Bloomberg, Datastream.Market Performance (Cont’d.)
Sector Performance in European vs US Markets, Since Feb 19, 2020
0.0
-10.0
-20.0
-24.0
-24.0 -24.6
-30.0 -27.9 -28.6
-31.1
-31.6 -31.7
-32.9 -33.8 -34.1
-35.6 -36.1 -36.8
-40.0 -37.6
-37.7 -40.9 -41.7
-43.4 -42.9
Europe US
-46.9
-50.0
-55.9
-60.0
Similar to the US, the worst performing sectors in Europe have been energy, financials and industrials, while
defensive sectors (healthcare, consumer staples, and telecom) have declined the least.
22
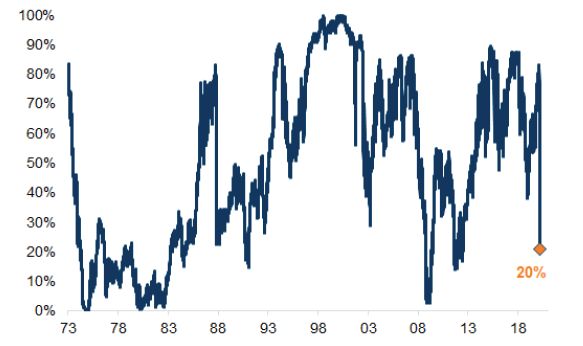
Source: Investment Strategy Group, Bloomberg, Datastream.European Equities Is Valuation on its Own a Catalyst? 1. Europe Valuation Percentile 2. Returns Following Valuation Readings in Each Percentile Range European equity valuations stand in their bottom quintile, which have historically proceeded positive returns. GIR notes that low valuations on their own are not a trigger for a recovery, however. Evidence that containment measures are working, especially in Italy, and confidence in the ability of policy makers to provide an economic stop-gap, especially for smaller companies, are also necessary for a recovery. Source: Investment Strategy Group, Goldman Sachs Global Investment Research. 23
Investment Management Division

Disclosures

Investment Strategy Group
Consumer and
                                                                                                                                                                           Investment
    Important Information                                                                                                                                                 Management
                                                                                                                                                                              Division

Thank you for reviewing this presentation. Please review the important information below.
Our Relationship with Clients. Depending on our relationship with you, we may act as an advisor, a broker-dealer, or both. Our role and obligations vary depending on the capacity in which we act.
Where we act as an advisor, our primary role is to give you advice, help you manage your investments or, where applicable, help you hire another advisor to do so. Where we act as a broker, our
primary role is to execute trades for you based on your instructions and any advice we give you is incidental to our brokerage services. How we are compensated by you (and sometimes by issuers or
managers of investments who compensate us based on what you buy) and how your Private Wealth Management (“PWM”) team is compensated may change over time and will vary depending on
various factors including, but not limited to, whether you are classified as a professional or retail client, have an advisory or brokerage account, and on the investments made in your account. Please
ask us questions to make sure you understand your rights and our obligations to you, the difference between advisory and brokerage accounts, and / or how we are compensated based on the
capacity in which we act. We are part of a full-service, integrated investment banking, investment management, and brokerage firm. Other firm businesses may implement investment strategies that
are different from the strategies used or recommended for your portfolio.
Entities Providing Services. Investment advisory services may be provided by Goldman Sachs & Co. LLC (“GS&Co.”), an affiliate, or an external manager under the wrap program sponsored by
GS&Co. Brokerage services are provided by GS&Co., member Financial Industry Regulatory Authority (“FINRA”) / Securities Investor Protection Corporation (“SIPC”). Brokerage services, banking
services (including check-writing, debit cards, direct debit, direct deposit, electronic bill pay, overdraft protection and Bank to Bank Transfers via ACH), custody, margin loans and strategic wealth
advisory services are provided by GS&Co. Financial counseling services are provided by The Ayco Company, L.P. Over-The-Counter (“OTC”) derivatives, foreign exchange forwards and related
financing are offered by GS&Co. Trust services are provided by The Goldman Sachs Trust Company, N.A. or The Goldman Sachs Trust Company of Delaware. All of these affiliated
entities are subsidiaries of The Goldman Sachs Group, Inc. (“Firm” or “GS”). Deposit products, mortgages, and bank loans are offered by Goldman Sachs Bank USA, member Federal
Deposit Insurance Corporation (“FDIC”) and an Equal Housing Lender.
GS&Co. may provide family office services to clients (“Family Office Services”). Some Family Office Services may be provided by GS&Co. and/or its affiliates; other Family Office Services may be
provided by subcontractors, independent service providers, or other third parties (collectively, “Third Party Vendors”), who are not acting as financial or investment advisors. The scope, duration,
deliverables, assigned personnel, referrals to Third Party Vendors, and delivery channels through which Family Office Services are provided will vary among clients, based upon the facts, requested
services, circumstances, personal financial goals, net worth, complexity, and/or needs of each client. Third Party Vendor services are wholly independent of those provided by GS&Co. and additional
terms of service may apply for clients entering into any separate agreements with Third Party Vendors in furtherance of Family Office Services.
Investment Strategy Group (“ISG”). ISG is focused on asset allocation strategy formation and market analysis for PWM. ISG material represents the views of ISG in the Consumer Investment
Management Division (“CIMD”) of GS. It is not financial research or a product of GS Global Investment Research (“GIR”) and may vary significantly from those expressed by individual portfolio
management teams within CIMD, or other groups at Goldman Sachs. It was not prepared in compliance with applicable provisions of law designed to promote the independence of financial analysis
and is not subject to a prohibition on trading following the distribution of financial research. If shown, ISG Model Portfolios are provided for illustrative purposes only. Your actual asset allocation may
look significantly different based on your particular circumstances and risk tolerance. If a model performance calculation is provided, it assumes that (1) each asset class was owned in accordance
with the recommended weight; (2) all tactical tilts were implemented at the time the recommendation was made; and (3) the portfolio was rebalanced every time a tactical tilt change was made and at
the end of every quarter (unless a tactical tilt was made within a month of quarter-end). If model performance is shown, it is calculated using the daily returns (actual or interpolated) of indices that ISG
believes are representative of the asset classes included in the model. Results shown reflect the total return but generally do not take into account any investment management fees, commissions or
other transaction expenses, which would reduce returns. The results shown reflect the reinvestment of dividends and other earnings. All returns are pre-tax and are not adjusted for inflation. Additional
information about the model portfolio performance calculation, including asset class benchmarks used for modeling performance and a history of tactical tilts, is available upon request.
Investment Risks and Information. Risks vary by the type of investment. Additional information regarding investments and risks may be available in applicable product materials. Before transacting
or investing, you should review and understand the terms of a transaction/investment and the nature and extent of the associated risks, and you should be satisfied the investment is appropriate for
you in light of your individual circumstances and financial condition.
•   Alternative Investments. Alternative investments may involve a substantial degree of risk, including the risk of total loss of an investor’s capital and the use of leverage, and may not be
    appropriate for all investors. Private equity, private real estate, hedge funds, and other alternative investments structured as private investment funds are subject to less regulation than other types
    of pooled vehicles and liquidity may be limited. You should review the Offering Memorandum, the Subscription Agreement, and any other applicable offering documents for risks, potential conflicts
    of interest, terms and conditions and other disclosures.
•   Commodities. Commodity investments may be less liquid and more volatile than other investments. The risk of loss in trading commodities can be substantial due, but not limited, to volatile
    political, market and economic conditions. An investor’s returns may change radically at any time since commodities are subject to abrupt changes in price. Commodity prices are volatile because
    they respond to many unpredictable factors including weather, labor strikes, inflation, foreign exchange rates, etc. In a single account, because your position is leveraged, a small move against
    your position may result in a large loss. Losses may be larger than your initial deposit. No representation is made regarding the suitability of commodity investments.
                                                                                                                                                                                                         25
Consumer and
Investment
Important Information Management
Division
• Currencies. Currency exchange rates can be extremely volatile, particularly during times of political or economic uncertainty. There is a risk of loss when an investor has exposure to foreign
currency or holds foreign currency traded investments.
• Over-the-Counter (“OTC”) Derivatives You should carefully review the Master Agreement, including any related schedules, credit support documents, addenda and exhibits. You may be
requested to post margin or collateral at levels consistent with the internal policies of GS to support written OTC derivatives. Prior to entering into an OTC derivative transaction you should be
aware of the below general risks associated with OTC derivative transactions:
- Liquidity Risk: There is no public market for OTC derivative transactions and, therefore, it may be difficult or impossible to liquidate an existing position on favorable terms.
- Risk of Inability to Assign: OTC derivative transactions entered into with one or more affiliates of Goldman Sachs cannot be assigned or otherwise transferred without Goldman Sachs’ prior
written consent and, therefore, it may be impossible for you to transfer any OTC derivative transaction to a third party.
- Counterparty Credit Risk: Because Goldman Sachs may be obligated to make substantial payments to you as a condition of an OTC derivative transaction, you must evaluate the credit risk of
doing business with Goldman Sachs. Depending on the type of transaction, your counterparty may be Goldman Sachs & Co. LLC, a registered U.S. broker-dealer, or other affiliate of The
Goldman Sachs Group, Inc. As a broker dealer regulated by the Securities and Exchange Commission (“SEC”), Goldman Sachs & Co. LLC is subject to net capital, financial responsibility
rules, and other regulatory requirements designed to protect customer assets. Other subsidiaries of The Goldman Sachs Group, Inc. may not be registered as a U.S. broker dealer and
therefore are not be subject to similar SEC regulation.
- Pricing and Valuation: The price of each OTC derivative transaction is individually negotiated between Goldman Sachs and each counterparty and Goldman Sachs does not represent or
warrant that the prices for which it offers OTC derivative transactions are the best prices available. You may therefore have trouble establishing whether the price you have been offered for a
particular OTC derivative transaction is fair. OTC derivatives may trade at a value that is different from the level inferred from interest rates, dividends and the underlyer. The difference may
be due to factors including, but not limited to, expectations of future levels of interest rates and dividends, and the volatility of the underlyer prior to maturity. The market price of the OTC
derivative transaction may be influenced by many unpredictable factors, including economic conditions, the creditworthiness of Goldman Sachs, the value of any underlyers, and certain
actions taken by Goldman Sachs.
- Early Termination Payments: The provisions of an OTC derivative transaction may allow for early termination and, in such cases, either you or Goldman Sachs may be required to make a
potentially significant termination payment depending upon whether the OTC derivative transaction is in-the-money at the time of termination.
- Indexes: Goldman Sachs does not warrant, and takes no responsibility for, the structure, method of computation or publication of any currency exchange rates, interest rates, indexes of such
rates, or credit, equity or other indexes, unless Goldman Sachs specifically advises you otherwise.
• Emerging Markets and Growth Markets. Emerging markets and growth markets investments involve certain considerations, including political and economic conditions, the potential difficulty of
repatriating funds or enforcing contractual or other legal rights, and the small size of the securities markets in such countries coupled with a low volume of trading, resulting in potential lack of
liquidity and price volatility.
• Equity Investments. Equity investments are subject to market risk. The value of the securities may go up or down in respect to the prospects of individual companies, particular industry sectors
and/or general economic conditions. The securities of small and mid-capitalization companies involve greater risks than those associated with larger, more established companies and may be
subject to more abrupt or erratic price movements.
• Fixed Income. Fixed income securities investments are subject to the risks associated with debt securities generally, including credit/default, liquidity and interest rate risk. Any guarantee on an
investment grade bond of a given country applies only if held to maturity.
• Master Limited Partnerships ("MLPs"). MLPs may be generally less liquid than other publicly traded securities and as such can be more volatile and involve higher risk. MLPs may also involve
substantially different tax treatment than other equity-type investments, and such tax treatment could be disadvantageous to certain types of retirement accounts or charitable entities.
• Money Market Funds. Money market fund investments are not insured or guaranteed by the Federal Deposit Insurance Corporation or any other government agency. Although money market
funds seek to preserve the value of your investment at $1.00 per share, it is possible to lose money.
• Non-US Securities. Non-US securities investments involve the risk of loss as a result of more or less non-US government regulation, less public information, less liquidity, and greater volatility in
the countries of domicile of the issuers of the securities and/or the jurisdiction in which these securities are traded. In addition, investors in securities such as ADRs/GDRs, whose values are
influenced by foreign currencies, effectively assume currency risk.
• Options. Options involve risk and are not suitable for all investors. The purchase of options can result in the loss of an entire investment and the risk of uncovered options is potentially unlimited.
You must read and understand the current Options Disclosure Document before entering into any options transactions. The booklet entitled Characteristics and Risk of Standardized Options can
be obtained from your PWM team or at http://www.theocc.com/about/publications/character-risks.jsp. A secondary market may not be available for all options. Transaction costs may be significant
in option strategies that require multiple purchases and sales of options, such as spreads. Supporting documentation for any comparisons, recommendations, statistics, technical data, or other26
information will be supplied upon request.Consumer and
Investment
Important Information Management
Division
• Real Estate. Real estate investments involve additional risks not typically associated with other asset classes, such as sensitivities to temporary or permanent reductions in property values for the
geographic region(s) represented. Real estate investments (both through public and private markets) are also subject to changes in broader macroeconomic conditions, such as interest rates.
• Structured Investments. Structured investments are complex, involve risk and are not suitable for all investors. Investors in structured investments assume the credit risk of the issuer or
guarantor. If the issuer or guarantor defaults, you may lose your entire investment, even if you hold the product to maturity. Structured investments often perform differently from the asset(s) they
reference. Credit ratings may pertain to the credit rating of the issuer and are not indicative of the market risk associated with the structured investment or the reference asset. Each structured
investment is different, and for each investment you should consider 1) the possibility that at expiration you may be forced to own the reference asset at a depressed price; 2) limits on the ability to
share in upside appreciation; 3) the potential for increased losses if the reference asset declines; and 4) potential inability to sell given the lack of a public trading market.
• Tactical Tilts. Tactical tilts may involve a high degree of risk. No assurance can be made that profits will be achieved or that substantial losses will not be incurred. For various reasons, GS&Co.
and its affiliates may implement a tactical tilt, invest in an affiliated fund that may invest in tactical tilts, or unwind a position for its client advisory accounts or on its own behalf before your advisor
does on behalf of your account, or may implement a tactical tilt that is different from the tactical tilt implemented by advisors on client accounts, which could have an adverse effect on your
account and may result in poorer performance by your account than by Goldman Sachs or other client accounts.
• U.S. Registered Mutual Funds / Exchange Traded Funds (“ETFs”) or Exchange Traded Notes (“ETNs”). You should consider a fund’s investment objectives, risks, charges and expenses,
and read the summary prospectus and/or the Prospectus (which may be obtained from your PWM Team) carefully before investing, as they contain this and other relevant information. You may
obtain documents for ETFs or ETNs for free by 1) visiting EDGAR on the SEC website at http://www.sec.gov/; 2) contacting your PWM team; or 3) calling toll-free at 1-866-471-2526. Unlike
traditional mutual funds, ETFs can trade at a discount or premium to the net asset value and are not directly redeemable by the fund. Leveraged or inverse ETFs, ETNs, or commodities futures-
linked ETFs may experience greater price movements than traditional ETFs and may not be appropriate for all investors. Most leveraged and inverse ETFs or ETNs seek to deliver multiples of the
performance (or the inverse of the performance) of the underlying index or benchmark on a daily basis. Their performance over a longer period of time can vary significantly from the stated daily
performance objectives or the underlying benchmark or index due to the effects of compounding. Performance differences may be magnified in a volatile market. Commodities futures-linked ETFs
may perform differently than the spot price for the commodity itself, including due to the entering into and liquidating of futures or swap contracts on a continuous basis to maintain exposure (i.e.,
“rolling”) and disparities between near term future prices and long term future prices for the underlying commodity. You should not assume that a commodity-futures linked ETF will provide an
effective hedge against other risks in your portfolio.
Security-Specific References. Any reference to a specific company or security is not intended to form the basis for an investment decision and is included solely to provide examples or provide
additional context. This information should not be construed as research or investment advice and should not be relied upon in whole or in part in making an investment decision. GS, or persons
involved in the preparation or issuance of these materials, may from time to time have long or short positions in, buy or sell (on a principal basis or otherwise), and act as market makers in the
securities or options, or serve as a director of any companies mentioned herein. In addition, GS may have served as manager or co-manager of a public offering of securities by any such company
within the past 12 months. Further information on any securities mentioned in this material may be obtained upon request.
Assets Held at a Third Party Custodian. Any information (including valuation) regarding holdings and activity in accounts held by third party custodians is for your convenience and has been
supplied by third parties or by you. GS assumes no responsibility for the accuracy of such information. Information may vary from that reflected by your custodian and is as of the date of the materials
provided to us. As an accommodation to you, we may also reflect certain investments unrelated to services provided by GS, for which GS does not perform any due diligence, verify the accuracy of
information, or provide advice. Unless otherwise agreed in writing, we have not assessed whether those investments fit within your investment objective and the asset classification shown may not be
accurate.
Off-Platform Investments. To the extent you ask us for guidance in connection with investment opportunities not offered by GS, such as investments in private funds, private debt or equity, real
estate or other opportunities you source away from us, any such guidance, views, or other information we may provide is on an accommodation basis only and we will not be acting as your advisor.
We assume no obligation to determine whether the opportunity is suitable for you in connection with such investment decisions and will not assume any liability for such investment decisions. Please
review our Form ADV for information on conflicts of interest we may have in connection with any such requests.
ISG/GIR Forecasts. Economic and market forecasts presented (“forecasts”) reflect either ISG’s or GIR’s views and are subject to change without notice. Forecasts do not take into account specific
investment objectives, restrictions, tax and financial situation or other needs of any specific client. Forecasts are subject to high levels of uncertainty that may affect actual performance and should be
viewed as merely representative of a broad range of possible outcomes. Forecasts and any return expectations are as of the date of this material, and should not be taken as an indication or
projection of returns of any given investment or strategy. Forecasts are estimated, based on capital market assumptions, and are subject to significant revision and may change materially as
economic and market conditions change. Any case studies and examples are for illustrative purposes only. If applicable, a copy of the GIR Report used for GIR forecasts is available upon request.
Forecasts do not reflect advisory fees, transaction costs, and other expenses a client would have paid, which would reduce return.
Client Specific Markets. Investments held in your name with a subcustodian in the local market where traded in order to comply with local law will be indicated on your statements. 27Consumer and
Investment
Important Information Management
Division
Performance / Estimated Income / Estimated Cash Flow. Past performance is not a guide of future results and may include investments no longer owned in current or closed accounts. Current
performance may be lower or higher than the performance data quoted. To request the most current or historical performance data, or asset classification schema information, please contact your
PWM team at the number provided on your monthly statement or toll-free in the U.S. at 1-800-323-5678. Performance reports, where shown, generally present the relevant time weighted
performance, which is a combination of daily returns compounded over a specified time period with the removal of the deposit and withdrawal impacts, and may show internal rate of return
calculations where requested. Aggregate performance may not equal the sum of returns at an investment level. Performance for advisory accounts is currently calculated net of any management fees
and might include investments for which actual market prices are not currently available, and does not include private equity positions. Performance for alternative investments is calculated using the
value of the last available partnership capital statement or NAV. If included, estimated income figures and estimated private equity future cash flows are estimates of future activity, and actual results
may vary substantially. GS&Co. has adjusted performance calculations for certain asset classes or strategies and may do so in the future. Performance of net cash (i.e., cash less margin debit) is
generally included in the total performance calculation but not displayed separately. Option performance is included in the performance of the asset class of the underlier. Margin loans are generally
excluded from advisory performance but included in brokerage performance calculations. Mutual fund and ETF investment returns and the principal value of your investment will fluctuate. As a result,
your shares when redeemed may be worth more or less than their original cost. The performance data for ETFs does not reflect a deduction for commissions that would reduce the displayed
performance. You are not subject to a sales charge for mutual funds purchased through PWM. If a sales charge were applicable, the sales charge would reduce the mutual fund’s performance.
Indices / Benchmarks. Any references to indices, benchmarks, or other measure of relative market performance over a specified period of time are provided for your information only and is not
indicative of future results. In addition to the benchmark assigned to a specific investment strategy, other benchmarks (“Comparative Benchmarks”) may be displayed, including ones displayed at your
request. Managers may not review the performance of your account against the performance of Comparative Benchmarks. There is no guarantee that performance will equal or exceed any
benchmark displayed. Where a benchmark for a strategy has changed, the historical benchmark(s) are available upon request. Inception to date (“ITD”) returns and benchmark / reference portfolio
returns may reflect different periods. ITD returns for accounts or asset classes only reflect performance during periods in which your account(s) held assets and / or were invested in the asset class.
The benchmark or reference portfolio returns shown reflect the benchmark / portfolio performance from the date of inception of your account or your initial investment in the asset class. If displayed,
estimated income figures are estimates of future activity obtained from third party sources.
Indices are unmanaged. The figures for the index reflect the reinvestment of all income or dividends, as applicable, but do not reflect the deduction of any fees or expenses which would reduce
returns. Investors cannot invest directly in indices. Where appropriate, relevant index trademarks or index information has been licensed or sub-licensed for use. Inclusion of index information is not
intended to imply that the relevant index or its affiliated entities sponsor, endorse, sell, or promote the referenced securities, or that they Period Gross Return Net Return Differential
make any representation or warranty regarding either the advisability of investing in securities (generally or specifically) or regarding the
1 year 6.17% 4.61% 1.56%
ability of the index to track market performance. Contact your PWM team for more information.
The following table provides an example of the effect of management and incentive fees on returns. The magnitude of the difference 2 years 12.72% 9.43% 3.29%
between gross-of fee and net-of-fee returns will depend on a variety of factors, and the example has been simplified. 10 years 81.94% 56.89% 25.05%
Pricing and Valuations. Prices do not necessarily reflect realizable values and are based on information considered to be reliable but are not guaranteed for accuracy, currency, or as realizable
values. Certain positions may be provided by third parties or may appear without a price if GS is unable to obtain a price and/or the security is not actively traded for a certain amount of time. Pricing
sources and methods are available upon request and are subject to change.
Fees and Charges. We have two pricing models for advisory relationships: a comprehensive fee model and a product based model. You should consider factors, including, but not limited to, your
financial needs and circumstances, investment objectives, services provided under the model, your preferences, and the size of your account. Certain account fees and expenses may be more or
less expensive depending on the model chosen. Actual fees may differ from estimated fees due to differences in strategies and amounts invested in particular strategies or overall. Charges applied to
your accounts and transactions may include execution charges (including commissions, commission equivalents, mark-ups, mark-downs and dealer spreads), investment advisory fees, and custody
fees. When we act as broker, we are generally compensated by an execution charge on a trade by trade basis. When we act as advisor, we generally earn a fee based on assets under management
and may also be earning execution charges. More information about fees and charges is included in our account agreements, fee schedules and trade confirmations. If estimated fees are shown
herein, we have included a description of our fee calculation methodology.
Where applicable, GS receives fees for certain of the Family Office Services. In the course of providing such Family Office services, GS or its subsidiaries or affiliates may offer additional services
and/or products for which additional fees or commissions are charged. These offerings create a conflict of interest and clients may be asked to acknowledge their understanding of such conflict.
Certain fees associated with Family Office Services are either charged as a single bundled fee while other fees are charged as supplemental fees, which are identified in the Family Office Services
Supplement to clients’ Customer Agreement. GS reserves the right to adjust the Family Office Services fees in the event of extraordinary circumstances.
Consolidated Reporting. Any consolidated report that GS may provide is at your request and is for informational purposes only; it is not your official statement. Information (including valuation)
regarding holdings in third party accounts or other non-GS investments may be included as a courtesy and is based on information provided by you. GS does not perform review or diligence on,
independently verify the accuracy of information regarding, or provide advice on such non-GS investments; GS assumes no responsibility for the accuracy of the source information and such assets 28
may not be included on GS’s books and records. While we may inform you of how a non-GS investment fits within your overall asset allocation, our classification of the investment may be differentConsumer and
Investment
Important Information Management
Division
than your custodian or external adviser’s classification. You should review and maintain the original source documents (including third party financial statements) and review them for any notices or
relevant disclosures. Assets held away may not be covered by SIPC. Please contact your PWM Team with any questions regarding the consolidated reporting process, including its limitations.
Tax Information. GS does not provide legal, tax or accounting advice, unless explicitly agreed in writing between you and GS, and does not offer the sale of insurance products. You should obtain
your own independent tax advice based on your particular circumstances. Where clients receive Family Office Services, the Family Office may review with you the general income tax consequences
of your investments, estate planning, philanthropic endeavors, real estate holdings, and certain other activities that may affect your income tax. The information included in this presentation, including,
if shown, in the Tax Summary section, does not constitute tax advice, has not been audited, should not be used for tax reporting, and is not a substitute for the applicable tax documents, including
your Form 1099, Schedule K-1 for private investments, which we will provide to you annually, or your monthly GS account statement(s). The cost basis included in this presentation may differ from
your cost basis for tax purposes. Information regarding your alternative investments and transactions for retirement accounts are not included in the Tax Summary section.
Notice to ERISA / Qualified Retirement Plan / IRA / Coverdell Education Savings Account (collectively, “Retirement Account”) Clients: Information regarding your Retirement Account(s)
included in this presentation is for informational purposes only and is provided solely on the basis that it will not constitute investment or other advice or a recommendation relating to any person’s or
plan’s investment or other decisions, and that none of GS, its affiliates or their employees is a fiduciary or advisor with respect to any person or plan by reason of providing the material or content in
the presentation including under the Employee Retirement Income Security Act of 1974 or Department of Labor Regulations. Unless GS agrees otherwise, any target allocation shown for such
Retirement Account represents decisions you have communicated to GS regarding such asset allocation, without any advice or recommendations from GS, after considering your financial
circumstances, objectives, risk tolerance and goals.
GS Family Office Services. Where GS provides or refers Family Office Services, it will do so based on individual client needs. Not all clients will receive all services and certain activities may fall
beyond the scope of the Family Office Services. Any asset management services provided are governed by a separate investment management agreement (as may be applicable). Personnel
providing Family Office Services do not provide discretionary management over client investments. Where GSFO provides art advisory services, such services are generally limited to education; GS
does not recommend purchasing art or collectibles as an investment strategy, provide formal or informal appraisals of the value of, or opine on the future investment potential of, any specific artwork
or collectible. Upon your request, the Family Office Wealth Advisory Services (“WAS”) team may discuss with you various aspects of financial planning; the scope of such planning services will vary
among clients and may only include episodic and educational consultations that should not be viewed as tax advice. GS assumes no duty to take action pursuant to any recommendations, advice, or
financial planning strategies discussed with you as part of WAS services. It is your responsibility to determine if and how any such recommendations, advice, or financial planning strategies should be
implemented or otherwise followed, and you are encouraged to consult with your own tax advisor and other professionals regarding your specific circumstances. GS is not liable for any services
received from your independent advisors or the results of any incident arising from any such services or advice. Cybersecurity consultations provided by GS&Co. are intended to provide a general
overview of cyber and physical security threats, but are not comprehensive; GS is not liable for any incident following such consultations. GS is not liable for clients’ ultimate selection and utilization of
any Third Party Vendor for any Family Office Services, or the results of any incident arising from any such referral. GS is not responsible for the supervision, monitoring, management, or performance
of such Third Party Vendors and is not liable for any failure of Third Party Vendors to render services or any losses incurred as a result of such services.
Other Services. Any provided financial planning services, including cash flow analyses based on information you provide, are a hypothetical illustration of mathematical principles and are not a
prediction or projection of performance of an investment or investment strategy. Such services may not address every aspect of a client’s financial life; topics that were not discussed with you may still
be relevant to your financial situation. In providing financial services, GS will rely on information provided by, or on behalf of, clients and is not responsible for the accuracy or completeness of any
such information, nor for any consequences related to the use of any inaccurate or incomplete information. Where materials and/or analyses are provided to you, they are based on the assumptions
stated therein, which are likely to vary substantially from the examples shown if they do not prove to be true. These examples are for illustrative purposes only and do not guarantee that any client will
or is likely to achieve the results shown. Assumed growth rates are subject to high levels of uncertainty and do not represent actual trading and may not reflect material economic and market factors
that may have an impact on actual performance. GS has no obligation to provide updates to these rates.
Not a Municipal Advisor. Except in circumstances where GS expressly agrees otherwise, GS is not acting as a municipal advisor and the opinions or views contained in this presentation are not
intended to be, and do not constitute, advice, including within the meaning of Section 15B of the Securities Exchange Act of 1934.
Additional Information for Ayco Clients. References in this presentation to “PWM team” shall include your Ayco team. Ayco may provide tax advice, accounting advice, bill pay, and bookkeeping
services to certain clients. Ayco does not provide brokerage services. As part of its financial counseling services, Ayco may provide you with certain reports where similar information contained herein
is presented differently or in more or less detail. You should view each report independently and raise any questions with your Ayco team.
No Distribution; No Offer or Solicitation. This material may not, without GS’ prior written consent, be (i) copied, photocopied or duplicated in any form, by any means, or (ii) distributed to any person
that is not an employee, officer, director, or authorized agent of the recipient. This material is not an offer or solicitation with respect to the purchase or sale of any security in any jurisdiction in which
such offer or solicitation is not authorized or to any person to whom it would be unlawful to make such offer or solicitation. We have have no obligation to provide any updates or changes to this
material.
29Consumer and
Investment
Important Information Management
Division
This material is for your information only and is not intended to be used by anyone other than you. To the extent this presentation is used by Private Wealth Management, this presentation is intended
only to facilitate your discussions with Goldman Sachs as to the opportunities available to our Private Wealth Management clients. This is not an offer or solicitation with respect to the purchase or
sale of any security. This presentation is intended only to facilitate your discussions with Goldman Sachs International (“GSI”), who are authorised by the Prudential Regulation Authority and regulated
by the Financial Conduct Authority and Prudential Regulation Authority, as to the opportunities available to our retail clients. The presentation is not intended to be used as a general guide to
investing, or as a source of any specific investment recommendations, and makes no implied or express recommendations concerning the manner in which any client’s account should or would be
handled, as finding the appropriate investment strategies for a client will depend upon the client’s investment objectives.
This presentation does not constitute an offer or solicitation to any person in any jurisdiction in which such offer or solicitation is not authorized or to any person to whom it would be unlawful to make
such offer or solicitation. It is the responsibility of any person or persons in possession of this material to inform themselves of and to observe all applicable laws and regulations of any relevant
jurisdiction. Prospective investors should inform themselves and take appropriate advice as to any applicable legal requirements and any applicable taxation and exchange control regulations in the
countries of their citizenship, residence or domicile which might be relevant to the subscription, purchase, holding, exchange, redemption or disposal of any investments.
Information contained herein is believed to be reliable but no warranty is given as to its completeness or accuracy and views and opinions, whilst given in good faith, are subject to change without
notice. GSI, and/or its affiliates (together “Goldman Sachs”) and its officers, directors, and employees, including persons involved in the preparation or issuance of this material, may from time to time
have "long" or "short" positions in, or buy or sell, or otherwise have a material interest in, the investments mentioned herein or in related investments including, without limitation, securities,
commodities, derivatives (including options) or other financial products of companies mentioned herein. In addition, Goldman Sachs may have served as manager or co-manager of a public offering
of securities by any such company within the past 12 months and/or may be the only market maker in relation to investments mentioned herein and/or may be providing significant advice or
investment services in relation to investments mentioned herein or related investments or have provided such advice or services within the previous 12 months.
Past performance is not a guide to future performance and the value of investments and the income derived from them can go down as well as up. Future returns are not guaranteed and a loss of
principal may occur. Changes in exchange rates may cause the value of an investment to increase or decrease. Some investments may be restricted or illiquid, there may be no readily available
market and there may be difficulty in obtaining reliable information about their value and the extent of the risks to which such investments are exposed. Certain investments, including warrants and
similar securities, often involve a high degree of gearing or leverage so that a relatively small movement in price of the underlying security or benchmark may result in a disproportionately large
movement, unfavorable as well as favorable, in the price of the warrant or similar security. In addition, certain investments, including futures, swaps, forwards, certain options and derivatives, whether
on or off exchange, may involve contingent liability resulting in a need for the investor to pay more than the amount originally invested and may possibly result in unquantifiable further loss exceeding
the amount invested. Transactions in over-the-counter derivatives involve additional risks as there is no market on which to close out an open position; it may be impossible to liquidate an existing
position, to assess the value of a position or to assess the exposure to risk. Investors should carefully consider whether such investments are suitable for them in light of their experience,
circumstances and financial resources.
No part of this material may be i) copied, photocopied or duplicated in any form, by any means, or ii) redistributed without the prior written consent of GSI.
Indices are unmanaged, and the figures for the index do not reflect any fees or expenses. We strongly recommend that these factors be taken into consideration before an investment decision is
made. Investors cannot invest directly in indices.
References to market or composite indices, benchmarks or other measures of relative market performance over a specified period of time ("benchmarks") are provided by Goldman Sachs for your
information purposes only. Goldman Sachs does not give any commitment or undertaking that the performance of your account(s) will equal, exceed or track any benchmark.
GS may record telephone conversations and monitor emails between GS and you (and any of your authorised, connected or affiliated persons) for the purpose of evidencing your instructions,
monitoring quality of service, for compliance and security purposes, otherwise for GS's internal records or where required by Applicable Rules.
This material has been approved for issue in the United Kingdom solely for the purposes of Section 21 of the Financial Services and Markets Act 2000 by GSI, Plumtree Court, 25 Shoe Lane,
London, EC4A 4AU, United Kingdom; authorised by the Prudential Regulation Authority; and regulated by the Financial Conduct Authority and the Prudential Regulation Authority. Certain aspects of
the investment strategy described in this presentation may from time to time include commodity interests as defined under applicable law.
For investors based / receiving this document in the United Kingdom: This document may contain references to “non-mainstream pooled investments”, as defined in the UK Financial Conduct
Authority’s Handbook of Rules and Guidance (the “FCA Handbook”). Non-mainstream pooled investments include (without limitation) unregulated collective investment schemes and certain
structured products. Where this document refers to non-mainstream pooled investments, this document and the non-mainstream pooled investments referred to within it has been provided to you on
the basis that you have demonstrated to Goldman Sachs that you fall within an exempt category of person to whom such an investment may lawfully be promoted in accordance with the rules of the
FCA Handbook, including without limitation: (a) Certified High Net Worth Investors; (b) Professional or Eligible Counterparty clients; (c) Certified Sophisticated Investors; (d) Certified Self-
Sophisticated Investors; or (e) by virtue of this document amounting to an Excluded Communication, as such terms are defined in the FCA Handbook.
30You can also read