A HOLISTIC ANALYSIS OF THE LOCAL ECONOMIC AND SOCIAL IMPACT OF DEFENCE TOWNSVILLE-2016 - ENCLOSURE 1 TO BI1991596 AUG 18 - Department of ...
←
→
Page content transcription
If your browser does not render page correctly, please read the page content below
ENCLOSURE 1 TO
                                                      BI1991596
                                                        AUG 18

A HOLISTIC ANALYSIS OF THE LOCAL ECONOMIC AND
SOCIAL IMPACT OF DEFENCE TOWNSVILLE—2016
Riccardo Welters and Joseph Thomas
College of Business, Law and Governance
April 2018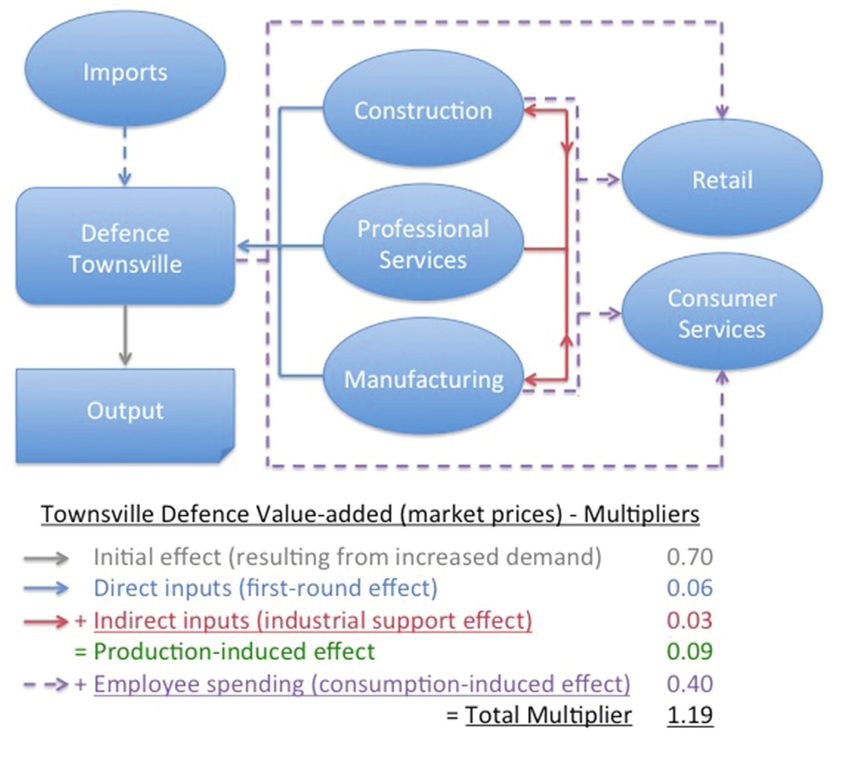
DISCLAIMER

This report has been prepared for a specific purpose in accordance with terms of reference set by the Department of Defence.

The report contains information derived from open sources that are believed to be reliable and accurate at the time of its publication. It
is made freely available to the public in good faith on the basis that readers retain responsibility for making their own assessments of that
information and the matters discussed within the report.

Making use of this report, including any information or analysis contained within it, is entirely at the reader’s own risk. Neither James
Cook University nor the Department of Defence warrant that the information contained in this report is accurate and neither James Cook
University nor the Department of Defence accept any responsibility for erroneous information therein. Specifically, James Cook University
and the Department of Defence expressly disclaim any liability, whether in negligence or otherwise, to any person in respect of any action
or omission by any person in reliance of this report or any information or assessment contained within it.
CO N TEN T S

EXECUTIVE SUMMARY                                                                            2

1   INTRO                                                                                    4

2   DEMARCATING THE IMPACT REGION                                                            5

    2.1 Demarcating the impact region                                                        5

3   TOWNSVILLE’S DEMOGRAPHY AND ECONOMY                                                      6

    3.1 Townsville’s demography                                                              6

    3.2 Townsville’s economy                                                                 7

4   DEFENCE TOWNSVILLE — DIRECT AND INDIRECT LOCAL ECONOMIC IMPACT                          11

    4.1 Direct contribution to Townsville’s Gross Regional Product                          11

    4.2 Defence Townsville’s direct and indirect contribution to the local economy          12

    4.3 Economic impact of Defence veterans                                                 14

    4.4 Australian-Singapore Military Training Initiative (ASMTI)                           16

5   DEFENCE’S SOCIAL IMPACT IN TOWNSVILLE                                                   17

    5.1 Demographic profile of Defence Townsville                                           17

    5.2 Townsville’s housing market                                                         19

    5.3 Labour market for partners of uniformed members                                     21

    5.4 Social infrastructure in Townsville: childcare                                      22

    5.5 Social infrastructure in Townsville: primary and secondary education                24

    5.6 Social infrastructure in Townsville: general practitioner (GP) services             26

6   CONCLUSIONS                                                                             27

7   ACKNOWLEDGEMENTS                                                                        27

8   REFERENCES                                                                              28

                                      A HOLISTIC ANALYSIS OF THE LOCAL ECONOMIC AND SOCIAL IMPACT OF DEFENCE TOWNSVILLE—2016   1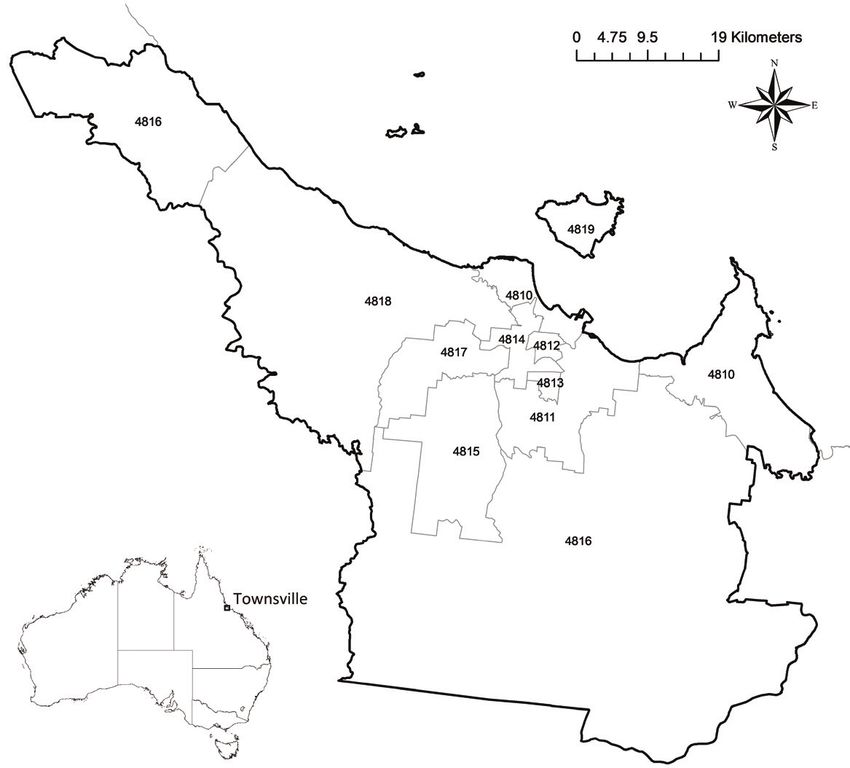
EX EC U T I VE S U M M A RY

    Impact region
    All three branches of the Australian Defence Force, principally the Army, are present in the city of Townsville. As
    a self-contained economic area, the Townsville Statistical Area level 3 (SA3) comprises a logical delineation for
    measuring the socio-economic impact of Defence Townsville in the region. Most of the figures and estimates
    contained in this report are based on 2015 and 2016 data, ensuring consistency and relevance.

    The impact region—henceforth, ‘Townsville’—hosts approximately 187,000 residents. Its economy is worth
    an estimated $12.7 billion (AUD) in gross regional product (GRP), making Townsville Australia’s largest urban
    economy north of the Sunshine Coast.

    Townsville’s demography and economy
    The median age of Townsville residents (34) is below that of Queensland (37) and Australia (38) more broadly,
    which is apparent in the city’s relatively low proportions of married residents and (outright) homeowners.
    Townsville residents also tend to have lower educational attainment and are more likely to have been born in the
    country than residents of Queensland and Australia overall.

    As a lens for analysing the state of the local economy, Townsville’s labour market reveals unfavourable conditions
    in the city vis-à-vis Queensland and Australia. Local unemployment is high (8.9%) and (full-time) pay premiums
    in the city are negative with respect to average wages at the state and national levels.

    23% of the Townsville workforce has completed a bachelor’s degree in Townsville, against 27% and 32% in
    Queensland and Australia, respectively. Townsville’s lower general skill level is reflected in relatively fewer
    high occupational jobs (‘Managers’ and ‘Professionals’) in the city. That is, 29% of the Townsville workforce
    hold roles as ‘Managers’ or ‘Professionals’, compared to 33% in Queensland and 36% in Australia. Against
    underrepresentation among ‘Managers’ and ‘Professionals’ stands the city’s relative overrepresentation among
    ‘Technician and Trades Workers’ and ‘Community and Personal Service Workers’.

    Local overrepresentation of ‘Community and Personal Service Workers’ is caused by above average employment
    shares in three industries in Townsville: ‘Education and Training’, ‘Health Care and Social Assistance’ and ‘Defence’.
    The ‘Defence’ sector employs 6.6% of the Townsville workforce, a share almost nine times as large as its
    nationwide equivalent. Consequently, ‘Defence’ plays an important role in stabilising Townsville’s labour market.

    Defence Townsville’s direct and indirect economic impact
    Townsville’s $12.7 billion economy is built upon a number of key pillars, including ’Construction’ (11.3%),
    ‘Rental, Hiring and Real Estate Services’ (12.0%), ‘Public Administration and Safety’ (17.1%) and ‘Health Care
    & Social Assistance’ (8.8%). The unusually high share of ‘Public Administration and Safety’ is a result of the
    disproportionately high contribution of ‘Defence’, estimated at 11.3% of GRP.

    If all Defence activity in Townsville were to spontaneously cease, the immediate economic consequences would
    entail the loss of up to 19% of GRP. Direct economic impacts would be compounded by indirect ‘knock-on’
    effects, including forgone opportunities for Townsville-based Defence suppliers and, in particular, lost expenditure
    of ‘Defence’ personnel wages for consumption. Estimating Defence Townsville’s direct and indirect economic
    impact serves to highlight the importance of this sector to Townsville’s economy.

2       JAMES COOK UNIVERSITY
The presence of major ‘Defence’ installations in Townsville also augments the number of veterans who reside in
the city and who receive ‘compensation and support’ and ‘subsidised health care’ as a result of their service to
Australia. We estimate that of the city’s 6,600 local veterans, approximately 4,650 choose to reside in Townsville
as a result of local amenities, services and other forms of support provided by Defence Townsville and the
local offices of the Defence Community Organisation. We estimate that veterans’ expenditure of ‘subsidized
health care’ and ‘compensation and support’ payments—in addition to the associated knock-on effects of these
expenditures—contributes up to $92 million and $145 million per annum, respectively, to Townsville’s GRP.
Finally, economic activity in the wider Townsville region attributed to the Australian-Singapore Military Training
Initiative (ASMTI) is expected to add $26 million per annum to Townsville’s GRP in the project’s construction
phase (2019-2025) and $9 million per annum in its operational phase (2026 and beyond).
Defence Townsville’s social impact
Defence Townsville employs over 6,400 uniformed and non-uniformed members in Townsville, accompanied by
an estimated 3,350 partners (not employed by Defence) and 4,200 dependent children. Consequently, the wider
Defence community consists of nearly 14,000 people, or 7.5% of Townsville’s total population.
Uniformed members in Townsville are on average five years younger than the average uniformed member in
Australia. They are also less likely to be female or married and tend to have lower educational qualifications than
their uniformed counterparts nationally.
Townsville’s housing market is less tight than the Australian housing market. This manifests in more favourable
homeownership affordability and less housing stress amongst homeowners. Median rent in Townsville is about
10% below the national average. However, lower household incomes in Townsville imply that housing stress
among renters is slightly higher in Townsville than nationwide. Commuting times of Defence personnel to and
from work tend to be significantly shorter in Townsville than nationwide.
The poor state of Townsville’s labour market also bears consequences for the employment prospects of uniformed
members’ partners, who are more likely to be unemployed, casually employed and/or studying than the partners
of uniformed members throughout Australia.
In terms of social infrastructure, we find that compared to the national average, Townsville offers more affordable
and higher quality child care services. Nonetheless, uniformed members are not entirely satisfied with local child
care provision. Child care affordability and flexibility to accommodate irregular working hours remain common
concerns. We also find that student-to-teaching-staff ratios in Townsville’s primary and secondary schools tend to
mirror the national picture, though there is a higher average level of socio-educational disadvantage in Townsville
than in Queensland and Australia more broadly. Finally, we find a higher ratio of general practitioners-to-patients
in Townsville than in Queensland and Australia as a whole.
A HOLISTIC ANALYSIS OF THE LOCAL ECONOMIC AND SOCIAL IMPACT OF DEFENCE TOWNSVILLE—2016 31. INT RO
In 2017, the Senior Australian Defence Force Officer (SADFO) BRIG Field based in Townsville required an independent, scientifically based
impact study to allow a better understanding of the economic, social and demographic implications of Defence Townsville in the city of
Townsville using the most recent data available.
The present report estimates the social and economic footprint of Defence Townsville in the city. The report is structured as follows.
Section 2 of the report delineates the assessed impact region. Section 3 describes the demography and economy of Townsville,
benchmarked to Queensland and Australia. Section 4 explores the economic impact of Defence in Townsville (looking both at direct
and indirect impacts of Defence economic activity), veterans’ expenditures and anticipated economic flows related to the Australian-
Singapore Military Training Initiative (ASMTI). Section 5 explores social conditions and infrastructure in Townsville, clarifying the size and
demographic makeup of the wider Defence community (including partners and children). Further, it explores the housing and labour
market conditions faced by the partners of Defence Townsville personnel. Section 5 also looks at the current state of affairs with regard to
childcare, primary and secondary-level education, and health care infrastructure in Townsville. Section 6 wraps up the report and provides
concluding remarks.
4 JAMES COOK UNIVERSITY2. D E M A RC AT I NG T H E I M PACT R EG ION
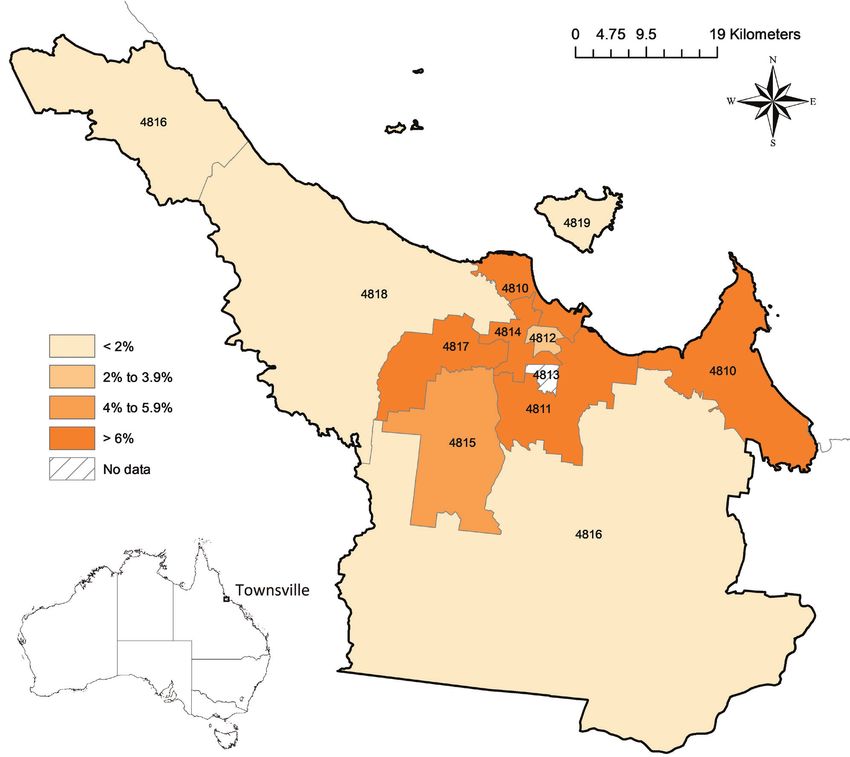
Townsville hosts the Australian Army base at Lavarack Figure 2.1 The study’s impact region: Townsville, by postcode
Barracks (postcode 4813), the Royal Australian Air
Force base at Garbutt (postcode 4814) and a small
establishment of the Royal Australian Navy at the
Port of Townsville (postcode 4810), as well as support
services to the Australian Defence Forces (ADF) in the
city (see Figure 2.1). The impact of that activity—both
economic and social—extends beyond these immediate
locations. Economic linkages between Defence and
other industries, alongside the expenditure of Defence
personnel income, ensure wider economic impacts.
Interaction of Defence personnel and their families
with the broader population of Townsville and its social
infrastructure also entails a range of social impacts.
2.1 Demarcating the impact region
For the purpose of this study, we must demarcate the
boundaries of the area comprising the impact region.
In lieu of the administrative boundaries used by the
Australian Bureau of Statistics (ABS), our demarcation is
informed by the functional economic region framework
(Stimson et al., 2016), which defines regions based on
economic behaviour in the form of commuting flows. In the case of Townsville, however, both frameworks produce similar demarcations.
That is, the economic region of ‘Townsville’ is functionally identical to the ‘Townsville’ Statistical Area level 3 (SA3) (see Figure 2.1).1 All
analyses in this report refer and apply to this region, hereafter, ‘Townsville’, and are based on 2015 or 2016 data (unless stated otherwise).
North of the Sunshine Coast, Townsville is Australia’s most populous city and largest urban economy. Home to approximately 187,000
residents, we estimate the value of Townsville’s gross regional product (GRP) at $12.7 billion (AUD).
Townsville is geographically isolated. Whilst the wider Townsville region (SA4)—which includes Ingham to the north, Charters Towers
to the west and Ayr to the south—has a land area comparable to that of the Republic of Ireland, this additional area only hosts a further
42,000 people generating around $1.5 billion GRP (Townsville Enterprise, 2016). Hence the additional area included in the wider Townsville
region remains outside our analysis.
Townsville’s geographical isolation is evident in its distance from the most proximate large population centres. The city of Cairns (157,000
residents) is approximately 350km to the north; the capital city of Queensland, Brisbane (1,131,000 residents), is approximately 1,340km
to the south.
In the first decade of the 21st century, annual population growth was higher in Townsville and Queensland than nationwide (see Table 2.1).
However, rapid growth has since abated, with population growth in Queensland slowing to the nationwide average and population growth
in Townsville dropping below that of both Queensland and Australia. As demonstrated in Section 3.2, recent developments in the local
labour market may explain much of this slowdown.
Table 2.1 Annualised population growth rates in the 21st century
TIME PERIOD TOWNSVILLE QUEENSLAND AUSTRALIA
2001-2006 1.5% 1.7% 1.1%
2006-2011 2.5% 2.1% 1.6%
2011-2016 1.4% 1.7% 1.7%
Source: ABS Census 2001, 2006, 2011 & 2016.
1 The Townsville SA3 is also similar—though not identical—to the Townsville Local Government Area (LGA). The Townsville SA3 extends slightly further to the south than the
Townsville LGA, encompassing 51 more people in the ABS census 2016.
A HOLISTIC ANALYSIS OF THE LOCAL ECONOMIC AND SOCIAL IMPACT OF DEFENCE TOWNSVILLE—2016 53. TOW NS VI L L E ’ S D E MOG R A PH Y A N D ECON OM Y
3.1 Townsville’s demography
Demographically, Townsville is distinct from Queensland and Australia more broadly in a number of important ways (see Table 3.1 for an
overview): Townsville residents are more likely than their counterparts to have been born in Australia; the local population is equally split
between males and females, as opposed to Queensland and Australia, where there are slightly more females than males; and Townsville
has a higher proportion of Indigenous residents (as a fraction of the Australian-born population) than throughout Queensland and
Australia.
Table 3.1 Demographic makeup of Townsville, benchmarked to Queensland and Australia
DEMOGRAPHICS TOWNSVILLE QUEENSLAND AUSTRALIA
Country of birth
Australia 78.6% 71.1% 66.7%
of whom: Indigenous 8.9% 5.6% 4.2%
Gender
Female 50.0% 50.6% 50.7%
Male 50.0% 49.4% 49.3%
Age groups
0-14 years 20.2% 19.4% 18.7%
15-29 years 23.1% 19.9% 19.9%
30-44 years 20.6% 20.3% 20.7%
45-59 years 19.1% 19.6% 19.5%
60-74 years 12.4% 14.5% 14.4%
75 and over 4.7% 6.3% 6.8%
Median age 34 37 38
Marital status†
Married 43.5% 46.7% 47.7%
De facto married 14.2% 11.9% 10.4%
Not married 42.3% 41.3% 41.9%
Dwelling tenure ‡
Owned outright 23.4% 29.2% 31.8%
Owned with a mortgage 36.1% 34.6% 35.4%
Rented 39.6% 35.1% 31.8%
Other tenure type 0.9% 1.0% 1.0%
Highest educational attainment†
Bachelor’s degree and above 18.2% 21.2% 25.5%
(Advanced) Diploma 9.1% 10.1% 10.3%
Certificate III, IV 23.7% 21.1% 18.3%
Year 10-12 41.1% 39.1% 36.5%
Certificate I, II 0.1% 0.1% 0.1%
Less than year 10 7.8% 8.4% 9.3%
Source: ABS Census 2016.
† Population aged 15 and over; ‡ Occupied dwellings.
6 JAMES COOK UNIVERSITYA further notable difference is age. Townsville has a larger share of young people (below 30 years of age) and lower shares of older people
(above 60 years of age) than Queensland and Australia, culminating in a lower median age in Townsville (34) than in the state (37) and the
nation (38). Townsville’s age profile also plays out with regard to marital status and dwelling tenure. That is, the proportion of residents
in Townsville in non-married, de facto domestic partnerships (i.e., younger people) is higher in Townsville than at the state and national
levels. The share of Townsville residents that own their residential dwelling outright (who tend to be older) is lower in Townsville than the
state and national averages.
We also observe marked differences in terms of highest educational attainment. Townsville residents (15 years of age and older) are
less likely to have completed bachelor’s degrees and (advanced) diplomas than the state and nationwide average. More prevalent are
‘Certificates III or IV’ and ‘Year 10-12’ as residents’ highest educational attainment. A relatively larger cohort of 15 to 29-year-olds in
Townsville—who are typically still in the process of accruing educational credentials—may explain some of this finding.
3.2 Townsville’s economy
We analyse Townsville’s economic structure through the lens of the labour market. Townsville’s labour market has witnessed significant
change in the last decade. At 4.4% unemployment in 2006, Townsville’s unemployment rate was below the Queensland and Australian
averages (see Table 3.2). Subsequently, however, unemployment in Townsville more than doubled—to 8.9% in 2016, well above the
Queensland and Australian averages. Although labour force participation is still higher in Townsville than Queensland and Australia
more broadly (likely a result of the younger age profile in Townsville), an observed decline in the local participation rate has exacerbated
Townsville’s labour market situation and may indicate that prospective workers have been stymied by poor employment prospects.
Table 3.2 Labour market performance
LABOUR MARKET INDICATORS TOWNSVILLE QUEENSLAND AUSTRALIA
Unemployment rate
2006 4.4% 4.7% 5.2%
2011 5.1% 6.1% 5.6%
2016 8.9% 7.6% 6.9%
Participation rate
2006 65.9% 61.8% 60.4%
2011 66.6% 62.8% 61.4%
2016 63.7% 61.0% 60.3%
Source: ABS Census 2006, 2011 & 2016.
The poor performance of the labour market in the 2011—2016 period coincides with the decline of Australia’s ‘mining boom’. Townsville’s
regional location in the relative vicinity of mining activity makes it more susceptible to the ebbs and flows of the mining industry than the
state and nationwide labour markets (which are dominated by capital cities). The mining industry generates employment in Townsville
directly through employment in the city, as well as positions taken by Townsville residents who commute long-distance, and indirectly
through employment opportunities in mining-related industries.
Malaise in the Townsville labour market also affects the pay structure of the city’s economy. Table 3.3 presents estimates of annual personal
income by educational attainment for full-time workers. We observe negative wage premiums in Townsville throughout the workforce
compared to the Australian average (less so compared to the Queensland labour market). Below-par labour market performance—both in
terms of job opportunities and pay—may help to explain the slowdown in local population growth noted in Table 2.1.
A HOLISTIC ANALYSIS OF THE LOCAL ECONOMIC AND SOCIAL IMPACT OF DEFENCE TOWNSVILLE—2016 7Table 3.3 Annual mean personal income of full-time workers by highest educational attainment
EDUCATIONAL LEVEL TOWNSVILLE QUEENSLAND AUSTRALIA
Bachelor’s degree and above -3.0% -1.8% $93,100
(Advanced) Diploma -1.2% -2.7% $76,800
Certificate III, IV 0.0% -0.4% $68,900
Year 10-12 -3.3% -3.0% $61,100
Certificate I, II †
-9.5% 1.7% $52,700
Less than year 10 2.6% 1.4% $54,800
Total -5.7% -4.1% $75,800
Source: ABS Census 2016
† The group of Townsville residents who hold ‘Certificates I or II’ as highest educational attainment is small (see Table 3.1), hence the reported figure in the Townsville column should be interpreted with caution.
The aggregated negative pay premium in Townsville at (-5.7%) is below most of the negative pay premiums for their respective
educational attainment cohorts, suggesting that, on average, the local workforce is less educated than in Queensland and Australia at
large. Table 3.4 illustrates this point. We observe significant differences in terms of the cohort of workers who hold bachelor’s degrees in
Townsville vis-à-vis Queensland, and Australia in particular.
Table 3.4 Highest educational attainment (workforce)
EDUCATIONAL LEVEL TOWNSVILLE QUEENSLAND AUSTRALIA
Bachelor’s degree and above 22.9% 26.5% 32.0%
(Advanced) Diploma 10.3% 11.4% 11.7%
Certificate III, IV 27.0% 24.3% 21.1%
Year 10-12 36.8% 34.6% 31.8%
Certificate I, II 0.1% 0.1% 0.1%
Less than year 10 2.9% 3.1% 3.3%
Source: ABS Census 2016.
An investigation of the occupational structure of the local labour market suggests that there are fewer employment opportunities for high
skilled workers in Townsville, which may explain why there are fewer high-skilled workers in the Townsville workforce. Table 3.5 demonstrates
that ‘Managers’ and ‘Professionals’—occupational categories that require high-level skills—are underrepresented in Townsville compared to
the Queensland and Australian average.2 The Townsville labour market generates relatively more employment for ‘Technicians and Trade
Workers’, ‘Community and Personal Service Workers’ and ‘Machinery Operators and Drivers’.
2 There are two reasons (not shown) for this finding. First, industries with high shares of ‘Managers’ and ‘Professionals’—such as ‘Agriculture, Forestry and Fishing’, ‘Financial and
Insurance Services’ and ‘Professional, Scientific and Technical Services’—are underrepresented in Townsville. Second, with the exception of ‘Health Care and Social Assistance’,
all industries employ ‘Managers’ and ‘Professionals’ less intensively in Townsville than they do throughout Queensland and nationwide.
8 JAMES COOK UNIVERSITYTable 3.5 Employment structure by occupation
OCCUPATIONAL LEVEL TOWNSVILLE QUEENSLAND AUSTRALIA
Managers 9.8% 12.3% 13.2%
Professionals 19.1% 20.2% 22.6%
Technicians and Trade Workers 15.4% 14.5% 13.8%
Community and Personal Service Workers 14.9% 11.5% 11.0%
Clerical and Administrative Workers 13.7% 13.9% 13.8%
Sales Workers 9.8% 9.9% 9.5%
Machinery Operators and Drivers 7.6% 7.0% 6.4%
Labourers 9.7% 10.7% 9.6%
Total 100.0% 100.0% 100.0%
Source: ABS Census 2016.
To understand the importance of ‘Technicians and Trade Workers’, ‘Community and Personal Service Workers’ and ‘Machinery Operators
and Drivers’ in the Townsville economy, we focus on four industries (see Table 3.6). Compared to Townsville’s overall occupational
structure (see Table 3.5), ‘Mining’ generates above-average employment opportunities for ‘Technicians and Trade Workers’ and ‘Machinery
Operators and Drivers’. ‘Defence’ generates above-average employment opportunities for ‘Technicians and Trade Workers’, ‘Community
and Personal Service Workers’ and, to a lesser extent, ‘Machinery Operators and Drivers’. ‘Education and Training’ and ‘Health Care and
Social Assistance’ generate above-average employment opportunities for ‘Community and Personal Service Workers’.
Table 3.6 Townsville occupational structure by related industrial sector
INDUSTRY STRUCTURE MINING DEFENCE EDUCATION AND HEALTH CARE
TRAINING AND SOCIAL
OCCUPATIONAL LEVEL ASSISTANCE
Managers 7.2% 13.9% 6.9% 4.2%
Professionals 9.8% 8.4% 54.8% 42.5%
Technicians and Trade Workers 29.9% 17.2% 3.7% 2.9%
Community and Personal Service Workers 0.8% 42.2% 19.4% 30.4%
Clerical and Administrative Workers 4.6% 8.9% 10.5% 14.7%
Sales Workers 0.3% 0.1% 0.3% 0.8%
Machinery Operators and Drivers 42.3% 9.1% 0.4% 0.7%
Labourers 5.0% 0.3% 4.1% 3.9%
Source: ABS Census 2016.
We highlight these four sectors because they are the key foundations of local economic activity, with above- (Queensland and national)
average employment shares (see Table 3.7). Consequently, these four sectors drive the relative occupational importance of ‘Technicians
and Trade Workers’, ‘Community and Personal Service Workers’ and ‘Machinery Operators and Drivers’ in the Townsville economy.
Sectors that are underrepresented in Townsville include ‘Agriculture, Forestry and Fishing’ (not surprising for an urban economy),
‘Manufacturing’, ‘Financial and Insurance Services’ and ‘Professional, Scientific and Technical Services’. The latter two industries tend to be
important providers of high-skilled occupational employment.
A HOLISTIC ANALYSIS OF THE LOCAL ECONOMIC AND SOCIAL IMPACT OF DEFENCE TOWNSVILLE—2016 9Table 3.7 Employment structure by industry
INDUSTRY STRUCTURE TOWNSVILLE QUEENSLAND AUSTRALIA
Agriculture, Forestry and Fishing 0.7% 3.0% 2.6%
Mining 2.5% 2.4% 1.7%
Manufacturing 4.8% 6.3% 6.7%
Electricity, Gas, Water and Waste Services 1.6% 1.2% 1.1%
Construction 8.5% 9.4% 8.9%
Wholesale Trade 2.2% 2.8% 3.0%
Retail Trade 10.2% 10.4% 10.3%
Accommodation and Food Services 7.9% 7.7% 7.2%
Transport, Postal and Warehousing 4.9% 5.3% 4.9%
Information Media and Telecommunications 1.3% 1.2% 1.8%
Financial and Insurance Services 1.6% 2.7% 3.8%
Rental, Hiring and Real Estate Services 1.7% 2.1% 1.8%
Professional, Scientific and Technical Services 4.5% 6.5% 7.6%
Administrative and Support Services 3.2% 3.7% 3.6%
Public Administration and Safety 14.1% 6.9% 7.0%
- Public Administration and Safety, nfd 0.0% 0.0% 0.0%
- Public Administration 5.1% 4.2% 4.5%
- Defence 6.6% 0.9% 0.7%
- Public Order, Safety and Regulatory Services 2.4% 1.7% 1.8%
Education and Training 9.9% 9.4% 9.1%
Health Care and Social Assistance 15.1% 13.5% 13.2%
Arts and Recreation Services 1.4% 1.6% 1.7%
Other Services 3.9% 4.1% 3.9%
Total 100.0% 100.0% 100.0%
Source: ABS Census 2016.
The remainder of the report focuses on ‘Defence’, the stand-out sector in Townsville’s industrial landscape. It is—in terms of employment—
nearly eight and nine times larger in Townsville than the Queensland and Australian averages, respectively.
10 JAMES COOK UNIVERSITY4 . D EF EN C E TOWNS VI L L E
— D I R E C T A ND I ND I RE CT LOCA L ECON OM IC IM PACT
The previous section detailed the state and structure of the Townsville economy through the lens of its labour market, i.e., with a focus on
employment. This segment of the report describes the Townsville economy in terms of its GRP with emphasis on:
1) Defence Townsville’s direct contribution to the local economy (Section 4.1);
2) Defence Townsville’s indirect contribution to the local economy by means of (a) providing opportunities to Townsville-based firms to
supply goods and services to Defence and (b) wage generation, which spurs consumption in Townsville (Section 4.2);
3) The direct and indirect contributions of Defence veterans who choose to reside in Townsville as a result of Defence Townsville’s local
presence (Section 4.3), and;
4) The anticipated direct and indirect contributions resulting from the Australian-Singapore Military Training Initiative (ASMTI) (Section 4.4).
4.1 Direct contribution to Townsville’s Gross Regional Product
We estimate that GRP for Townsville, i.e., the added-value of the target region’s overall economic output, was just over $12.7 billion (AUD) in
fiscal year 2015-16.3 Table 4.1 provides a breakdown of Townsville’s total GRP by industry. ‘Defence’ contributed approximately $1.348 billion, or
just under 11.3% of GRP. ‘Public Administration and Safety’ comprised the largest sector, with over $2 billion (17.1%) in total local production, of
which ‘Defence’ contributed the lion’s share. Remaining output in this sector was generated by activities in ‘Public Administration’ ($516 million)
and ‘Public Order, Safety and Regulatory Services’ ($183 million). Townsville’s second, third and fourth most productive sectors were ‘Rental,
Hiring and Real Estate Services’ (12.0%), ‘Construction’ (11.3%), and ‘Health Care and Social Services’ (8.8%), respectively.
Table 4.1 Gross Regional Product in Townsville by industry
GRP (IN $MILLION) PERCENTAGE SHARE
Agriculture, Forestry and Fishing $47 0.4%
Mining $224 1.9%
Manufacturing $569 4.8%
Electricity, Gas, Water and Waste Services $627 5.2%
Construction $1,357 11.3%
Wholesale Trade $470 3.9%
Retail Trade $602 5.0%
Accommodation and Food Services $325 2.7%
Transport, Postal and Warehousing $786 6.6%
Information Media and Telecommunications $261 2.2%
Financial and Insurance Services $518 4.3%
Rental, Hiring and Real Estate Services $1,436 12.0%
Professional, Scientific and Technical Services $406 3.4%
Administrative and Support Services $232 1.9%
Public Administration and Safety $2,047 17.1%
- Public Administration and Safety, nfd $- 0.0%
- Public Administration $516 4.3%
- Defence $1,348 11.3%
- Public Order, Safety and Regulatory Services $183 1.5%
Education and Training $716 6.0%
Health Care and Social Assistance $1,052 8.8%
Arts and Recreation Services $64 0.5%
Other Services $239 2.0%
Total $11,980 100.0%
Final uses (taxes - subsidies) $699
Gross Regional Product $12,678
3 The break-down of the Townsville economy and economic multipliers used in subsequent sections are derived from an input-output model of the Townsville SA3 purpose-
built by Prime Research Pty Ltd.
A HOLISTIC ANALYSIS OF THE LOCAL ECONOMIC AND SOCIAL IMPACT OF DEFENCE TOWNSVILLE—2016 114.2 Defence Townsville’s direct and indirect contribution to the local economy
The total economic value of a region’s industrial production and the (direct) contributions to this output by its various industrial sectors
(including ‘Defence’) are important indicators of overall economic activity. Yet economists recognise that changes in output within a single
industry—which may be spurred by business cycles, government policy and changing consumer preferences, among other factors—also
affect demand from additional industries that support this production. A state-sponsored infrastructure repair program, for example,
requires additional output not only from firms in the construction sector, but also from their suppliers in the mining, manufacturing and
professional services industries, among others. Likewise, increased cross-sector demand induces greater employment and subsequent
consumer expenditure, as workers spend their wages on goods and services in the local economy. These relationships can be summarised
by various input-output ‘multipliers’, which provide a broader picture of the inter-industrial mix and production linkages within an
economy. Input-output multipliers are used here to explicate the indirect (and overall) contribution of the ‘Defence’ sector to the
Townsville economy. We discuss three multipliers (value-added, income and employment), covering key production and consumption-
based linkages to ‘Defence’ in the Townsville region.
Before turning to the multipliers, we illustrate the industry linkages between ‘Defence’ and other sectors in Townsville, which—in part—
determine the multipliers. ‘Defence’ sourced just over $236 million in production inputs from a number of Townsville-based industries,
including $146 million in ‘Construction’ (62% of total local expenditure), $22 million in ‘Transport, Postal and Warehousing’ (9.5%), $12
million in ‘Manufacturing’ (5.2%) and $11 million in ‘Professional, Scientific and Technical Services’ (4.6%). Local sources accounted for
approximately 41% of Defence Townsville’s input expenditures, alongside an additional $340 million of imported inputs. Table 4.2 provides
a breakdown of Defence Townsville’s expenditure on locally sourced inputs by industry.
Table 4.2 Defence Townsville local input expenditure by industry
INDUSTRY INPUTS (IN $MILLION) PERCENTAGE SHARE
Agriculture, Forestry and Fishing $0.02 0.0%
Mining $1 0.5%
Manufacturing $12 5.2%
Electricity, Gas, Water and Waste Services $4 1.7%
Construction $146 61.9%
Wholesale Trade $7 2.9%
Retail Trade $9 3.7%
Accommodation and Food Services $2 0.8%
Transport, Postal and Warehousing $22 9.5%
Information Media and Telecommunications $2 0.9%
Financial and Insurance Services $3 1.3%
Rental, Hiring and Real Estate Services $2 0.9%
Professional, Scientific and Technical Services $11 4.6%
Administrative and Support Services $2 0.6%
Public Administration and Safety $3 1.2%
- Public Administration and Safety, nfd $- 0.0%
- Public Administration $2 1.0%
- Defence $0 0.03%
- Public Order, Safety and Regulatory Services $0 0.2%
Education and Training $1 0.4%
Health Care and Social Assistance $3 1.4%
Arts and Recreation Services $1 0.2%
Other Services $5 2.0%
Total $236 100.0%
12 JAMES COOK UNIVERSITYIt is important to note, however, that input-output multipliers and the inter-industrial linkages they represent are not intended for use in
long-term economic forecasting or so-called ‘policy-shock’ modelling. Large-scale changes to a single sector’s output are likely to bear
inflationary pressures that cannot be accounted for in steady-state input-output modelling. Nor can the input-output model utilised for this
study account for potential changes to local demography or inter-industrial linkages that occur over time as a result of major changes to
policy, output and resultant inter-industrial linkages and consumer spending patterns.
Defence Townsville’s value-added multiplier
Value-added multipliers provide an indication of the extra value-added induced in Townsville by a one-dollar increase in local Defence
output. We estimate for Townsville Defence a total value-added multiplier of 1.19. Figure 4.1 shows the composition of this multiplier. For
every extra dollar of output, Defence Townsville generates an additional 70 cents in value-added. To do so, Defence Townsville requires
inputs, which it either imports (from outside Townsville) or sources from local suppliers (in Figure 4.1 represented by ‘Construction’,
‘Professional Services’ and ‘Manufacturing’). In producing requisite Defence inputs, these local suppliers generate 6 cents in value-added
(i.e., the ‘first-round effect’). In turn, local Defence suppliers require their own production inputs. The suppliers of the latter produce a
further 3 cents in value-added (i.e., the ‘industrial support effect’). The sum of the first-round and industrial support effects comprises
the ‘production-induced effect.’ Finally, a further 40 cents of value-added are created as a result of Defence Townsville personnel and
the employees of its suppliers spending additional wages in the Townsville economy (i.e., the consumption-induced effect). Like the
production-induced effect, this additional consumer expenditure can be traced to the initial (one dollar) increase in Defence output.
Figure 4.1 Schematic overview of linkages between Defence Townsville and the wider Townsville economy (value-added).
A one-dollar increase in ‘Defence’ output therefore leads to a 1.19-dollar increase in value-added in the Townsville economy, of which
70 cents are generated at Defence and 49 cents elsewhere in the economy. Put differently, for every dollar of value-added that Defence
Townsville creates as a result of an increase in its own output, 69 cents (49 cents / 70 cents) of value-added are generated elsewhere in the
Townsville economy. It is this relationship that can be used to determine the indirect (and hence overall) local economic impact of Defence
Townsville.
A HOLISTIC ANALYSIS OF THE LOCAL ECONOMIC AND SOCIAL IMPACT OF DEFENCE TOWNSVILLE—2016 13To estimate the direct and indirect economic footprint of the ‘Defence’ sector in Townsville, we consider the hypothetical question: what
would be the immediate impact upon the Townsville economy if all Defence-related economic activity were to spontaneously cease?4 A
one-dollar reduction in ‘Defence’ value-added would result in the loss of an estimated 69 cents of value-added elsewhere in the economy.
With total value-added of $1.348 billion (see Table 4.1), a sudden and complete cessation of Defence activity in Townsville would result
in $1.348 billion in direct losses, as well as a further $934 million in indirect losses (0.69 x $1.348 billion). In such a scenario, we estimate
the Townsville economy would stand to lose around $2.282 billion, or up to 19% of its total GRP. That is up from 12.6% in 2006. The
increased economic footprint of the ‘Defence’ sector in Townsville is a result of two developments. First, the increase in ‘Defence’ activity
in Townsville (due to, inter alia, the relocation of the 3rd Battalion – Royal Australian Regiment (3 RAR) to Townsville in 2011) has increased
the sector’s importance to the Townsville economy in absolute terms. Second, the poor state of the Townsville economy in 2016 compared
to the strong Townsville economy in 2006 has increased the economic importance of the ‘Defence’ sector in relative terms.
Defence Townsville’s income multiplier
As GRP and industrial output shares do not indicate distribution of earnings, they are not sufficient to describe the economic wellbeing
of the local population. Income multipliers indicate the additional wages paid to workers producing the induced output described above
and therefore help to describe the potential benefits of increased ‘Defence’ sector spending in Townsville. We calculate a total income
multiplier of 0.70, meaning that each additional dollar of ‘Defence’ sector output induces 70 cents of additional income for workers in the
local economy. This includes approximately 49 cents of income at Defence Townsville, 3 cents of income among locally based Defence
suppliers, 2 cents of industrial support income from the second-round and subsequent effects of the change induced by the increase to
‘Defence’ output, and 17 cents of income related to increased consumer spending elsewhere throughout the economy. That the ratio of
the sum of the production and consumption-induced effects to the initial effect (i.e., the increased wages required to support an additional
$1 of output from ‘Defence’) is not higher suggests that Defence Townsville sources a large proportion of its supply needs from firms
based outside of the city. Indeed, results from our input-output analysis above confirm that imports comprise around 60% of Defence
Townsville’s total expenditures. In sum, for each additional dollar of income generated as a result of an increase in Defence Townsville’s
output, 43 cents of income are generated elsewhere in the local economy.
Defence Townsville’s employment multiplier
With unemployment in Townsville stubbornly high, the impact of Defence Townsville’s expenditures on local employment is of key
concern. Employment multipliers provide an indication of the additional employment (reported as full-time equivalent jobs (FTE)) induced
in Townsville by a $1 million increase in ‘Defence’ output. We estimate a total employment multiplier of 5.90. That is, each additional $1
million of output by ‘Defence’ generates around 5.9 local FTE jobs. These include approximately 2.76 FTE positions at Defence Townsville
itself, 0.37 FTE jobs among local ‘Defence’ suppliers, 0.25 FTE industrial support jobs stemming from the second-round and subsequent
effects of the change induced by the increase to final demand, and 2.52 FTE jobs related to increased consumer spending throughout the
economy. Put differently, for every FTE job created at Defence Townsville to support an increase in its own output, 1.14 FTE jobs are created
elsewhere in the Townsville economy.
4.3 Economic impact of Defence veterans
Townsville hosts 6,600 Defence veterans, comprising 3.5% of the city’s total population. These veterans receive ‘compensation and
support’ and ‘subsidised health care’ payments—directly attributable to their Defence service—a fraction of which are injected into the
local economy. Table 4.3 shows that the national average proportion of veterans in the broader population is 1.3%—much lower than the
Townsville average. This suggests that the presence of Defence installations in Townsville induces a large number of former members to
stay in Townsville upon completion of their service.
For our analysis, it is important to estimate the number of veterans who would have decided to reside in Townsville even if there had been
no Defence presence in the city. To answer that question, we determine the proportion of veterans in Mackay, a comparable city in the
tropics with no significant Defence installations (see Table 4.3).
The proportion of veterans in the broader population of Mackay is 1.0%. Applying this ratio to Townsville, we obtain an estimate of the
4 We do not attempt to estimate the longer-run consequences of stopping all Defence activity in Townsville. It would be nearly impossible to predict how the Townsville
economy would adapt (if at all) as a result of such a drastic intervention. Likely falls in rental prices and wages might attract business to Townsville, fueling a long-term
recovery. On the other hand, high outmigration and reduced council revenues could render the city unable to sustain amenities at current levels, which would serve to impede
any potential recovery.
14 JAMES COOK UNIVERSITYlikely population of local veterans were it not for Defence Townsville’s significant local presence (1,950). The difference between the
observed and hypothetical populations of veterans in Townsville (4,650) is thereby attributed to Defence Townsville’s presence in the city.
Table 4.3 Local population of veterans attributable to Defence presence in Townsville
LOCATION VETERANS POPULATION PROPORTION INDUSTRY
OF VETERANS SHARE DEFENCE
IN POPULATION
Townsville 6,600 187,000 3.5% 6.6%
Mackay (benchmark) 1,200 115,000 1.0% 0.0%
Australia 299,700 23,402,000 1.3% 0.7%
Estimations:
Townsville (in absence of Defence) 1,950 1.0%
Townsville (attributable to Defence) 4,650 2.5%
Source: DVA (2016a), ABS Census 2016.
Australia has nearly 300,000 veterans. They receive ‘compensation and support’ and ‘subsidised health care’ through three acts:
the Veterans’ Entitlement Act (VEA), the Military Rehabilitation and Compensation Act (MRCA), and the Safety, Rehabilitation and
Compensation Act (SRCA). Table 4.4 details the types of expenditures associated with each act and, importantly for our analysis, the
average annual expenditure per client ($36,450). Assuming this average expenditure is representative of expenditure directed to veterans
residing in Townsville, we estimate that the Department of Veterans’ Affairs transfers approximately $169 million (4,650 x $36,450) per
annum to veterans in Townsville (above and beyond transfers that would occur without a major Defence presence in the city).
Table 4.4 Compensation, support and health care subsidies to Defence veterans
VEA MRCA SRCA DVA (net)
Clients 234,600 23,200 51,600 299,700
Total annual expenditure (millions) $10,380 $375 $169 $10,934
- compensation and support (millions) $5,740 $310 $131 $6,181
- subsidised health care (millions) $4,640 $65 $38 $4,743
Annual expenditure per client $44,240 $16,150 $3,270 $36,450
Source: DVA (2016b).
This $169 million of support comprises ‘subsidised health care’ ($74 million) and ‘compensation and support’ ($96 million) transfers.
Assuming that ‘subsidised health care’ support flows directly to Townsville-based providers in the ‘Health Care and Social Assistance’
sector—and using the appropriate value-added multipliers—we estimate that veterans’ injections into the ‘Health Care and Social
Assistance’ sector comprise up to $92 million of Townsville’s GRP ($50 million in ‘Health Care and Social Assistance’; $42 million
elsewhere in the Townsville economy).
The veteran ‘compensation and support’ package supplies veterans with income. To estimate its indirect contribution to Townsville’s GRP,
we first estimate the proportion of these payments that veterans spend in the local economy. Based upon the mean effective tax rate
(18.3%) and the mean savings rate (16.6%) (ABS, 2017), we estimate that veterans spend approximately 68.1% of ‘compensation and
support’ transfers, or around $65 million. Taking into consideration the proportion of this expenditure ‘lost’ to imports, we estimate that
veterans’ local consumption and the associated knock-on effects contribute approximately $49 million to Townsville’s GRP (value-added).
Consequently, we estimate the direct and indirect contribution of ‘compensation and support’ transfers to Townsville’s GRP at $145
million ($96 million + $49 million).
The estimated economic impact of veterans’ expenditures have not been added to our previous estimate of the overall economic impact
of Defence Townsville, as a sudden cessation of Townsville Defence expenditure in Townsville would not immediately bear upon veterans’
expenditures in the city. Hence we keep the local economic impact attributed to veterans separate from that aspect of our analysis.
A HOLISTIC ANALYSIS OF THE LOCAL ECONOMIC AND SOCIAL IMPACT OF DEFENCE TOWNSVILLE—2016 154.4 Australian-Singapore Military Training Initiative (ASMTI)
As part of the Australia-Singapore Comprehensive Strategic Partnership (CSP) announced by the Prime Minister in 2015, Australia and
Singapore have signed a Memorandum of Understanding outlining a framework for enhanced training of the Singapore Armed Forces
in Australia. Under the Australian-Singapore Military Training Initiative (ASMTI), up to 14,000 Singapore Armed Forces personnel will
conduct unilateral training in Australia for up to 18 weeks per year. The agreement stipulates the upgrading of Australian Defence Force
training facilities in Central and North Queensland for this purpose (Department of Defence, 2018). While Defence officials originally
sought to expand the existing Townsville Field Training Area near Herveys Range, negotiations with landowners have failed to bring about
a satisfactory agreement. Defence has therefore determined not to expand the Townsville Field Training Area under the auspices of the
ASMTI. In November 2017, Defence announced its intention to acquire land from willing landholders near Greenvale, a small mining
settlement approximately 220km northwest of Townsville. Greenvale falls within the Charters Towers SA3, which is part of the greater
Townsville region (SA4). Ravenswood and Pentland, also within the greater Townsville (SA4), are also being explored as alternative sites
should the required Greenvale acquisitions not proceed as planned.
Although the Townsville Field Training Area will not be expanded, the Memorandum of Understanding clarifies that commercial businesses
in the local vicinity of the project sites will be given priority with regards to procurement and support services during the construction and
operational phases of the initiative. With over $1 billion of new investment expected in the greater Townsville region (SA4), Townsville-
based enterprises remain well positioned to benefit from this significant economic stimulus.
In July 2017, the Department of Defence published an assessment of ASMTI’s likely social and economic impacts undertaken by KPMG
(2017). For its analysis, KPMG utilised a Computable General Equilibrium Model, which takes into account price fluctuations and other
dynamic economic effects stemming from policy-induced expenditure. Table 4.5 provides a summary of KPMG’s economic impact
estimates for the Townsville region (SA4). KPMG anticipates that approximately $143 million in direct state expenditure per annum will
stimulate between $24.8 and $26.3 million (average $25.5 million) in additional GRP over the course of ASMTI’s seven-year development
phase (2019 – 2025) and between $7.6 and $10.7 million (average $9.1 million) in the project’s operational phase. Increased economic
productivity—principally in construction, trade and professional services—is expected to be partially offset by an estimated $4.26 – $6.86
million (average $5.6 million) in lost agricultural value-added resulting from changes in land use. KPMG’s estimates of anticipated lost
agricultural output were based on previous expectations that ASMTI would involve the expansion of the Townsville Field Training Area.
Foregone agricultural output resulting from land-use conversion in the Greenvale area may differ. KPMG’s estimates of additional output
and employment in Townsville (SA4) assume constant local supply shares (i.e., that approximately 88% of regional construction inputs
will continue to be locally sourced).
With regard to employment, KPMG estimates between 258 and 264 (average 261) in additional annual FTE in the project’s development
phase and between 61 and 74 (average 71) FTE in its operational phase. The project is also expected to induce an additional annual
consumption expenditure of $31.2 million by Singaporean staff and $5 million by local permanent staff.
Table 4.5 Summary of ASMTI economic impacts in the Townsville region (SA4) (in millions of dollars)
YEAR AGRICULTURE CONSTRUCTION DEFENCE GRP FTE EMPLOYMENT
(REVENUE CHANGE) (EXPENDITURE (EXPENDITURE (CHANGE) (CHANGE)
CHANGE) CHANGE)
2019 – 5.6 + 142.9 0 + 25.5 + 261
2020 – 5.6 + 142.9 0 + 25.5 + 261
2021 – 5.6 + 142.9 0 + 25.5 + 261
2022 – 5.6 + 142.9 0 + 25.5 + 261
2023 – 5.6 + 142.9 0 + 25.5 + 261
2024 – 5.6 + 142.9 0 + 25.5 + 261
2025 – 5.6 + 142.9 0 + 25.5 + 261
2026 – 5.6 0 + 36.2 + 9.1 + 67
2027 – 5.6 0 + 36.2 + 9.1 + 67
Source: KPMG (2017).
16 JAMES COOK UNIVERSITY5. D EF EN C E ’ S S OC I A L I M PACT IN TOWN S VIL L E
Defence Townsville employs a total of 6,418 workers (up 3.9% from 2006), of whom 6,089 are uniformed members (up 6.3% from
2006); the remainder are non-uniformed members (down 2.7% from 2006) (see Table 5.1). The broader Defence community encompasses
partners and dependent children. We estimate there are 3,350 (non-Defence related) partners and 4,200 dependent children living in
Townsville, bringing the total Defence community in Townsville to 13,950—or 7.5% of Townsville’s total population.
Table 5.1 Wider Defence community in Townsville
DEFENCE COMMUNITY UNIFORMED NON-UNIFORMED TOTAL
Defence members 6,089 329 6,418
Partners (non-Defence employees) 3,150 200 3,350
Dependent children† 3,950 250 4,200
Total 13,200 750 13,950
Source: Defence Census 2015, Defence HR system 2017.
† Children living with Defence member(s) (and their families) in Townsville.
Before depicting the demographic characteristics of Defence Townsville, it is important to highlight that Defence Townsville differs in
two respects from Defence Australia (see Table 5.2). First, Defence Townsville employs relatively fewer non-uniformed members than the
Australian average (5% versus 25%). Second, even though Army is the largest of the three uniformed branches nationwide, the importance
of Army in Townsville is far more skewed than is the case nationally.5
Table 5.2 Defence branches and non-uniformed members
DEFENCE PERSONNEL DEFENCE TOWNSVILLE DEFENCE AUSTRALIA
Uniformed members 94.9% 75.3%
- Air force 7.5% 24.4%
- Army 92.4% 51.1%
- Navy 0.1% 24.5%
Non-uniformed members 5.1% 24.7%
Source: Defence HR system 2017.
5.1 Demographic profile of Defence Townsville
Given the size of the Defence population in Townsville, its idiosyncratic demographic profile is likely to have a marked impact on the
overall demographic profile of the city. To facilitate the identification of this impact, we present the demographic profile of Defence
Townsville using the same format—data permitting—as for the Townsville population (compare Table 3.1 to Table 5.3). Table 5.3 also
includes a demographic profile of Defence Australia, which reveals how Defence Townsville’s demography differs from that of Defence
Australia more broadly.
Nine in ten Defence members in Townsville were born in Australia, which contributes to the relatively high share of Australia-born
residents in Townsville (see Table 3.1). The vast majority of uniformed members are male, which contributes to the relatively high share of
males among the Townsville population (see Table 3.1). In Townsville, a slight majority of non-uniformed members are female, whereas the
reverse applies to Defence Australia.
The average age of uniformed members in Townsville is 29, contributing to the relatively low mean age of Townsville residents overall (37)
compared to Queensland and Australia on average. The average uniformed member in Townsville is three years younger than the average
uniformed member Australia-wide; the reverse applies to non-uniformed members. This age difference also helps explain why uniformed
members in Townsville are less likely to be married and more likely to be in de facto domestic partnerships than their counterparts
nationwide. Differences in dwelling tenure between uniformed members in Townsville and the Australian average are small. Uniformed
members are slightly less likely to use Defence accommodation (other tenure type) than the national average.
5 In the remainder of this section, we distinguish between uniformed and non-uniformed personnel where appropriate. We treat uniformed personnel as one group.
A HOLISTIC ANALYSIS OF THE LOCAL ECONOMIC AND SOCIAL IMPACT OF DEFENCE TOWNSVILLE—2016 17Finally, we observe that both uniformed and non-uniformed members in Townsville are much less likely to hold bachelor’s degrees
compared to Defence Australia on average, which contributes to the relatively low (highest) educational attainment observed among
Townsville residents and the local workforce (Tables 3.1 and 3.4 respectively).
Table 5.3 Demographic profile of Defence Townsville and Defence Australia
DEMOGRAPHICS TOWNSVILLE AUSTRALIA
UNIFORMED NON-UNIFORMED UNIFORMED NON-UNIFORMED
Country of birth
Australia 89.5% 89.0% 87.3% 79.4%
of whom: Indigenous 3.6% 4.3% 2.6% 2.3%
Gender
Female 11.4% 54.1% 15.4% 40.6%
Male 88.6% 45.9% 84.6% 59.4%
Indeterminate/Intersex/Unspecified 0.0% 0.0% 0.0% 0.0%
Mean age (years) 29.4 48.9 32.6 45.9
Marital status
Married 33.8% 68.2% 41.0% 62.6%
De facto married 27.4% 10.1% 24.2% 11.5%
Not married 38.8% 21.7% 34.7% 25.8%
Dwelling tenure
Owned outright 1.3% na 1.5% na
Owned with a mortgage 17.5% na 16.2% na
Rented 31.5% na 28.4% na
Other tenure type 49.7% na 53.8% na
Highest educational attainment
Bachelor’s degree and above 11.6% 24.4% 22.5% 47.2%
(Advanced) Diploma 8.3% 26.5% 13.0% 20.9%
Certificate I, II, III, IV 20.5% 11.3% 20.1% 10.5%
Year 10-12 58.6% 35.3% 43.7% 20.6%
Less than year 10 1.0% 2.5% 0.7% 0.9%
Source: Defence Census 2015, Defence HR systems 2017.
Subsequently, we pay attention to selected areas of social impact of Defence Townsville in the city, which are relevant to both Defence
Townsville and the wider community. We focus on the local housing market, the labour market for members’ partners, and the state of
selected social infrastructure in Townsville, including child care, primary and secondary education and GP services.
18 JAMES COOK UNIVERSITYYou can also read