The Impact of the H1N1 Pandemic on Canadian Hospitals
←
→
Page content transcription
If your browser does not render page correctly, please read the page content below
November 2010

The Impact of the
H1N1 Pandemic on
Canadian Hospitals
Introduction
Pandemic planning is a critical function for any health system. These plans
aim to limit serious illness and death from a pandemic; they also ensure
that essential health services are maintained and disruption of other health
services is minimized. Achieving the goals of a pandemic plan requires the
coordination of many agencies and institutions, from public health to acute
care hospitals, and requires the cooperation of sub-national, national and
international partners.

Canada implemented its pandemic response in 2009 to address a new strain
of influenza A/H1N1 virus (hereafter referred to as H1N1). H1N1 first appeared
in North America in April 2009, and spread rapidly around the world. By the
start of 2010, it had caused about 17,000 deaths. In June 2009, when 74
countries had confirmed cases, the World Health Organization (WHO)
declared it a pandemic. Antibodies to seasonal influenza were found not to
protect against the pandemic H1N1, and there was no vaccine available at
the outset. Moreover, the new virus peaked at different times of the year than
seasonal flu and seemed to affect different population groups.1, 2
                                                                                      Federal Identity Program
Canada’s response to H1N1 was based on lessons learned from 2003, when                Production of this report is made possible
                                                                                      by financial contributions from Health Canada
the country was faced with an outbreak of severe acute respiratory syndrome
                                                                                      and provincial and territorial governments.
(SARS). Outside of Asia, Canada was the hardest-hit country, with the                 The views expressed herein do not necessarily
disease killing 44 Canadians, causing illness in a few hundred more and               represent the views of Health Canada or any
                                                                                      provincial or territorial government.
resulting in the quarantine of 25,000 residents in the Greater Toronto Area.3

A post-SARS review identified a number of areas that should be strengthened
to improve Canada’s responsiveness to future health crises. Recommendations
included clear data-sharing protocols among levels of government, development
of surge capacity in the clinical and public health systems, more timely access
to laboratory testing and results, and improved links between public health and
the health care system.

                                                                                 www.cihi.ca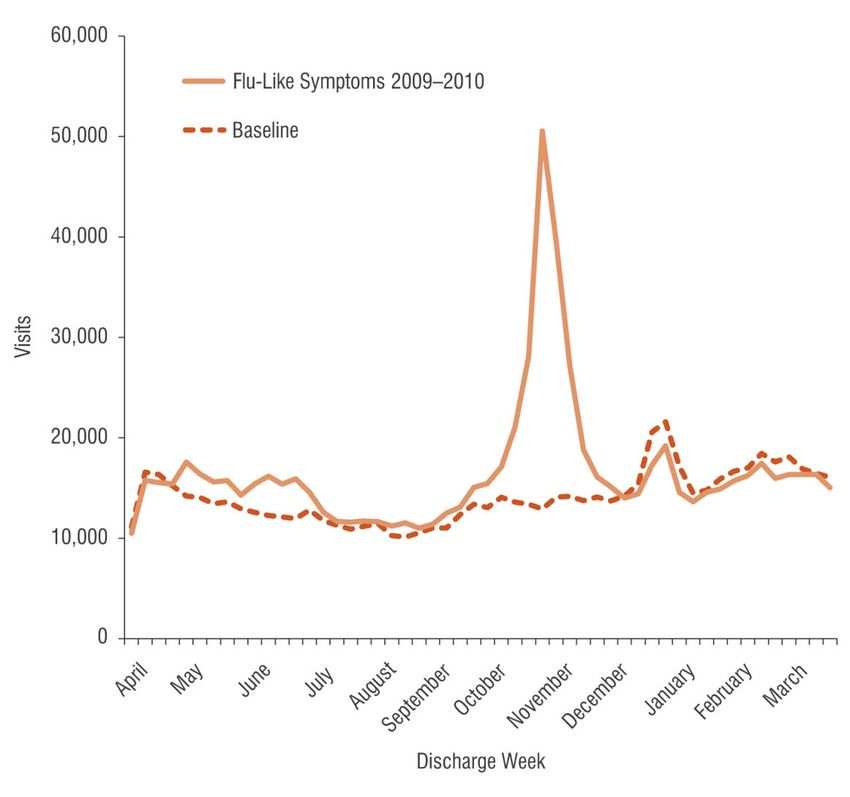
Partly in response to the SARS outbreak, the government established the Public Health Agency of Canada, the Canadian
Public Health Network Council and the Canadian Network for Public Health Intelligence and provided increased funding
for public health and pandemic influenza preparedness efforts.4 These actions were to prepare Canada for the next
pandemic outbreak of infectious disease.

The H1N1 outbreak required the implementation of the pan-Canadian, provincial/territorial and hospital pandemic plans
that were established after the SARS outbreak. One year after the peak of the second wave, H1N1 is in a post-pandemic
phase,5 and it is now important to assess the impact of the pandemic on the health care system and understand whether
the system was able to cope appropriately with the challenges. This analysis focuses specifically on the acute hospital
sector. Key questions addressed and highlights from the analysis are the following:

What was the impact of H1N1 on acute hospitals?
•   Looking at both H1N1 and unspecified influenza hospitalizations combined, the number of pandemic-related
    hospitalizations was larger than initial estimates.
•   H1N1/influenza was one of the leading causes of hospitalization during the peak of the second wave.
•   Patients with flu-like symptoms had a significant impact on Ontario emergency departments in fall 2009.

Were hospitals able to cope with the surge of patients?
•   At the height of hospital activity during the second wave, hospitals accommodated large numbers of H1N1/influenza
    patients by increasing overall numbers of patients admitted, managing hospital bed and intensive care unit (ICU)
    occupancy for patients requiring other types of care and increasing ventilator capacity.

How much did H1N1 cost the acute care system?
•   Costs of caring for hospitalized H1N1/influenza patients were substantial (estimated at close to $200 million
    excluding physician fees), but they were relatively small in the context of overall pandemic spending.

How did H1N1/influenza patients differ from those in a typical flu year?
•   Confirming previous findings, H1N1/influenza patients admitted to hospital were younger than in a baseline flu year.
•   Comorbidity patterns were different. Hospitalized H1N1/influenza patients were more likely to be pregnant or have
    respiratory comorbidities (asthma or other chronic lung disease) than in a baseline year.
•   H1N1/influenza patients were more likely to need ICU care and ventilation than typical flu patients, but the extent of
    the differences was less than earlier studies suggested.

2       The Impact of the H1N1 Pandemic on Canadian Hospitals
Figure 1: The H1N1 Timeline in Canada

Note
Baseline represents a three-year average of pan-Canadian influenza hospitalizations, from 2006–2007 to 2008–2009.

                                                                                      The Impact of the H1N1 Pandemic on Canadian Hospitals   3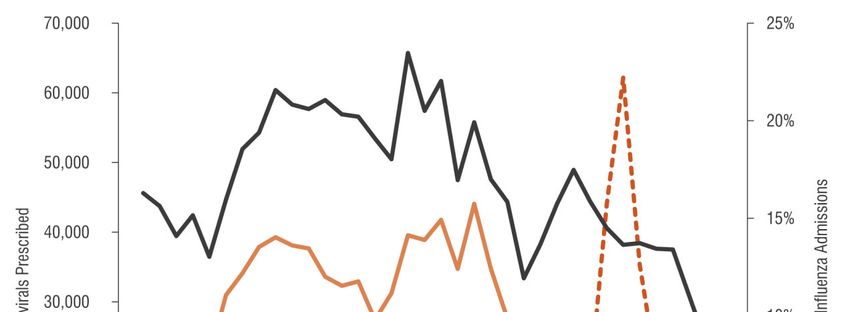
The Fine Print
    The appendix provides information on the data sources and methodology used in this report. A few points
    are highlighted to provide context for the analysis.
    Data Sources
    Most of the information in this report is drawn from acute hospital discharge data. Discharge data is
    collected on a routine basis and contains demographic, clinical and service utilization data on individual
    patients. Data is abstracted from the patient’s chart by health records staff using a standardized
    coding system.
    Complete antiviral information for three provinces (Saskatchewan, Manitoba and New Brunswick)
    was obtained from the National Prescription Drug Utilization Information System (NPDUIS) Database; other
    provinces submitted data directly to CIHI. Information on vaccinations delivered, priority groups for vaccine
    and testing guidelines for hospitalized patients was similarly requested from provincial governments.
    Case Definitions of H1N1
    In May 2009, CIHI advised hospitals to classify any lab-confirmed H1N1 cases to ICD-10-CA code J09.
    Given the time lag to have charts completed and abstracted, this directive would have included cases from
    the beginning of the pandemic period. Based on feedback from hospitals, CIHI modified its guidance in
    November 2009 to also accept cases where a clinical diagnosis of H1N1 had been made in the patient’s
    chart, regardless of whether there was a supporting lab report.
    The Public Health Agency of Canada (PHAC) collected only lab-confirmed cases throughout the pandemic.
    While the surveillance guidelines specified that all admitted H1N1 patients should be reported, at least one
    province did not report information on H1N1 patients admitted for a short period (24 hours or less) for
    observation. CIHI information includes all admitted patients, regardless of length of stay.
    Quebec Data
    A special tabulation of Quebec discharge data was provided to CIHI as of June 2010, before the database
    was officially closed. While the completeness of data from April to September 2009 appears very good
    (at 97% of the previous year’s activity), information from October to December 2009 was less complete
    (at 80% of the previous year’s activity) and varied by region. In some analyses (specifically noted in the
    text), a regional weight was applied to actual case counts for October to December 2009 to compensate
    for missing data.
    Episode Building
    To account for transfers from one acute hospital to another, individual abstracts were combined to build
    episodes of care (or hospitalizations).
    Time Period
    Most of the analysis focuses on patients discharged from acute hospitals between April 1 and
    December 31, 2009, after which point few H1N1 cases were reported. Outside of Quebec, 173 H1N1
    discharges occurred between January and March 2010, of which 103 (60%) were admitted in 2009 or
    earlier. At the time of analysis, Quebec data for January to March 2010 was not available.

4         The Impact of the H1N1 Pandemic on Canadian Hospitals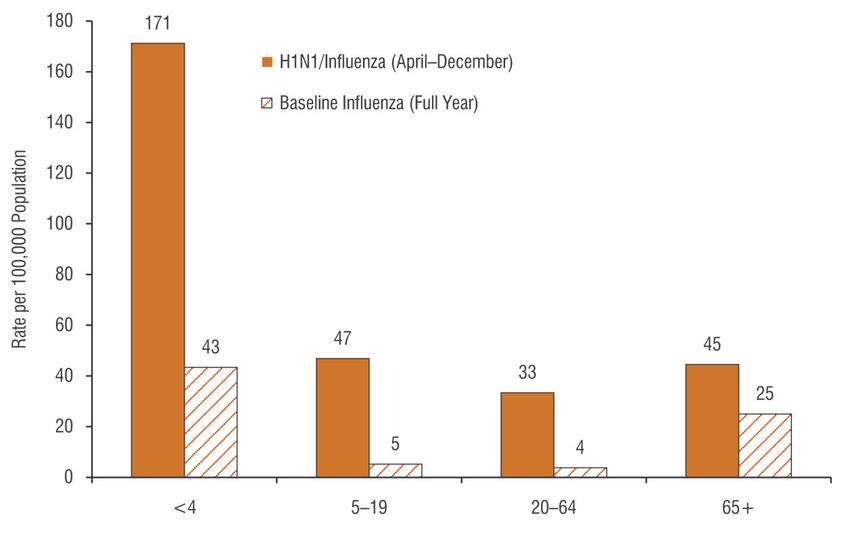
What Was the Impact of H1N1 on Acute Hospitals?
Looking at both H1N1 and unspecified influenza hospitalizations combined, the number of pandemic-related
hospitalizations was larger than initial estimates.
H1N1/influenza was one of the leading causes of hospitalization during the peak of hospital activity in the
second wave.
Patients with flu-like symptoms had a significant impact on Ontario emergency departments in fall 2009.
Hospitalizations during the traditional flu season (January to March) were lower than usual but did not offset the
April to December 2009 increase resulting from H1N1/influenza.

How many hospitalized cases? A simple question, but one without a simple answer. This report looks at two groups to
determine the impact that H1N1 had on hospital systems across the country.

H1N1
Between April and December 2009, 10,406i cases with an H1N1 diagnosis were discharged from Canadian acute care
hospitals. These cases were specifically identified as J09–Influenza due to certain identified influenza virus H1N1, as
either a main or secondary diagnosis. The number of cases reported in the hospital discharge data is somewhat higher
than that recorded by PHAC (8,672) over the corresponding time period, primarily due to differences in case definition
(see The Fine Print).6

H1N1/Influenza
Hospital discharge data also revealed a significant number of patients diagnosed with influenza, but not specifically
with H1N1. In the nine months between April and December 2009, 15,200 patients were diagnosed with either H1N1 or
unspecified influenza. This analysis assumes that the approximately 4,800 unspecified influenza cases were probably
also H1N1, for the following reasons:

•    There were many more influenza cases than the historic average (baseline). In a typical year, only about 1,300
     unspecified influenza cases are reported between April and December, with an average of 562 (43%) discharged in
     April (the traditional end of the flu season). In 2009, there were an estimated 4,794 cases with unspecified influenza,
     with a relatively small number (338) of patients discharged in April.
•    H1N1 displaced other viral illnesses. Lab information from PHAC indicates that almost all influenza circulating
     during 2009 was likely H1N1.7
•    Testing practices may have been affected by timing, specificity and implementation of provincial guidelines.
     Most provincial directives recommended testing all hospitalized patients with influenza-like illnesses. However, the
     timing of these directives played out differently across the country, potentially affecting which cases were tested for
     H1N1. Additionally, given that few other viral illnesses were circulating during periods of highest hospital activity
     related to H1N1,4 individual hospitals may have decided that complete testing would not alter the clinical treatment of
     patients with H1N1-like symptoms.
•    The profile of unspecified influenza cases was similar to that of H1N1 patients. Hospitalized patients with
     unspecified influenza were similar to H1N1 patients in many respects, including median age and average length
     of stay. The admission pattern by week was also reasonably similar between the two groups.

i.   Incorporating estimates for Quebec data for October, November and December 2009.

                                                                                  The Impact of the H1N1 Pandemic on Canadian Hospitals   5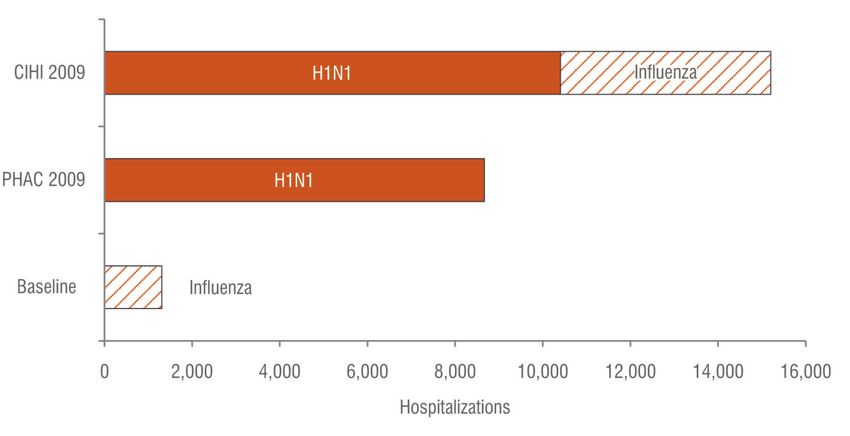
Figure 2: Comparison of H1N1 and Influenza Hospitalizations Between April and December
           2009 and Baseline

Notes
Baseline represents a three-year average of pan-Canadian influenza hospitalizations, from 2006–2007 to 2008–2009.
Quebec data for October to December 2009 was adjusted to account for incomplete data availability at the time of analysis.
Sources
Discharge Abstract Database, 2006–2007 to 2009–2010, Canadian Institute for Health Information; Fichier des hospitalisations MED-ÉCHO, 2006–2007
to 2008–2009, and special tabulation of interim data, 2009–2010, ministère de la Santé et des Services sociaux du Québec.

The combined H1N1/influenza group identified in the hospital discharge data represents about 6,500 more cases
(75% more) than the lab-confirmed cases reported to PHAC. Both the hospital discharge data and surveillance
information are extremely useful sources for understanding the pandemic and its impacts. However, the difference
between the two figures highlights the challenges of identifying influenza patients, even when it comes to the more
serious cases causing hospitalization and death.

Many countries struggled with the best way to capture and report H1N1-related hospitalizations. The approach and case
definitions adopted by PHAC were consistent with those of the WHO.8 However, some countries chose a different path.
The Centre for Disease Control (CDC) in the United States initially reported only lab-confirmed cases but discontinued
that approach in late July 2009 amid concerns that laboratory-confirmed data on hospitalizations and deaths was an
underestimation of the true number. The CDC attributed underestimation to incomplete testing, use of testing methods
that miss many cases and/or diagnoses that attribute hospitalizations and deaths to other causes, such as secondary
complications to influenza.9

Given that our main objective in this report is to understand the impact of the pandemic on the acute hospital system,
looking at the combined H1N1/influenza group is an important aspect of the analysis.

6         The Impact of the H1N1 Pandemic on Canadian Hospitals
A Different Approach for Testing Seniors?
  People older than age 65 in particular may have been under-investigated for H1N1. Some have suggested
  that seniors may have been under-tested, possibly because they were assumed to have built up immunity to
  H1N1 as a result of previous exposure to similar influenza viruses.10 Alternatively, their symptoms may have
  initially been attributed to another cause. Although the reason may not be fully understood, from April to
  December 2009, half (50%) of the H1N1/influenza patients who were 65 or older had a diagnosis of
  unspecified influenza, compared with 29% of hospitalized patients in other age groups.

Pandemics put a particular strain on acute care facilities, particularly when there is a large or prolonged peak in cases.
The 15,200 hospitalized cases of H1N1/influenza were significantly concentrated in two periods, with the first wave
peaking in June and the second wave peaking in November.

 Figure 3: Inpatient Hospitalizations by Week: H1N1/Influenza 2009 and Baseline Influenza

Notes
Baseline represents a three-year average of pan-Canadian influenza hospitalizations, from 2006–2007 to 2008–2009.
Quebec data for October to December 2009 was adjusted to account for incomplete data availability at the time of analysis.
Sources
Discharge Abstract Database, 2006–2007 to 2009–2010, Canadian Institute for Health Information; Fichier des hospitalisations MED-ÉCHO,
2006–2007 to 2008–2009, and special tabulation of interim data, 2009–2010, ministère de la Santé et des Services sociaux du Québec.

  What Happened to Influenza Hospitalizations During the Traditional
  January-to-March Flu Season?
  Initially there was concern that seasonal influenza viruses would also cause illness during 2009–2010.
  During the peak of the pandemic in fall 2009, H1N1 displaced most other viral illness.7 As we moved into late
  winter and spring, this trend continued. PHAC reported that overall influenza activity was low for the entire
  period of January to March 2010, typically the main season for influenza-related hospitalizations.11–13 This
  drop in hospitalizations in January to March (outside of Quebec, 578 fewer cases than the baseline)
  did not offset the increase seen from April to December 2009 (10,304 cases higher than the baseline,
  outside Quebec).

                                                                                     The Impact of the H1N1 Pandemic on Canadian Hospitals   7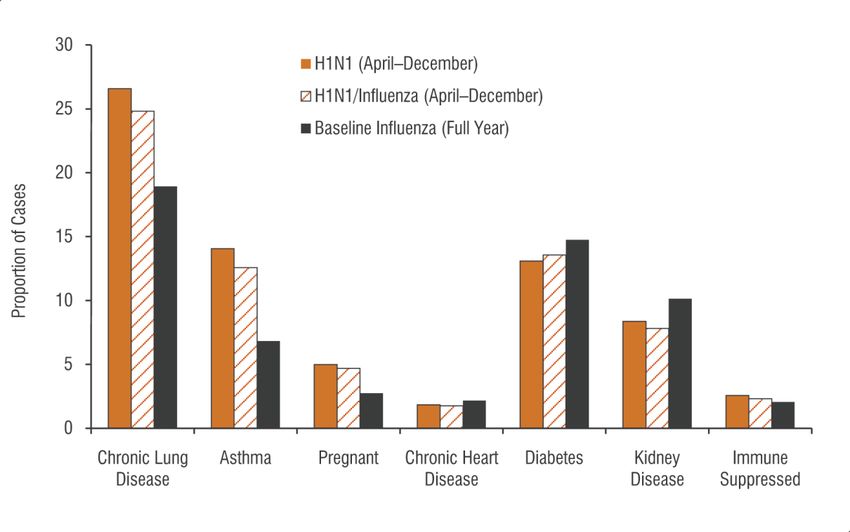
Two-thirds of all hospitalized H1N1/influenza cases occurred during a five-week period in the second wave
(October 25 to November 28, 2009), with more than 1,000 patients being discharged each week. During this time frame,
H1N1/influenza represented just over 3% of all acute discharges. To put this in context, over the five-week period there
were as many H1N1/influenza cases as joint replacement, heart attacks or strokes.

 Table 1: Proportion of Total Acute Hospital Discharges—Selected
          Conditions, October 25 to November 28, 2009
 Reason for Hospitalization                                     Percentage of All Discharges

 Births                                                                       11.8

 H1N1/Influenza                                                                3.4

 Hip/Knee Replacement                                                          3.1

 Heart Attack                                                                  2.5

 Stroke                                                                        1.6

 Bypass Surgery                                                                0.7

Sources
Discharge Abstract Database, 2009–2010, Canadian Institute for Health Information; special tabulation of interim data, 2009–2010, Fichier des hospitalisations
MED-ÉCHO, ministère de la Santé et des Services sociaux du Québec.

Emergency Department Visits—A Focus on Ontario
During pandemics, emergency departments are often the first point of access for acutely ill patients. Emergency
departments may also see a sharp increase in activity from patients who have mild symptoms but cannot quickly access
primary health care services. CIHI has complete emergency department data for Ontario, but not yet for other provinces.
While there were variations among provinces in how front-line flu services were provided (such as use of telephone
hotlines, stand-alone flu assessment clinics and availability of family physicians), it is nevertheless helpful to understand
the Ontario experience during H1N1.

Our analysis looked at patients arriving with flu-like symptomsii to see whether there were more or fewer than in the
baseline years. Symptoms reviewed included any one of cough, shortness of breath, fever, malaise and fatigue, and sore
throat. Emergency data usually focuses on the single most important issue, so it is not possible to look at these patient-
reported symptoms in combination. Overall, between April and December 2009, patients with flu-like symptoms made
about 140,000 more visits to Ontario emergency departments than the baseline for the same time period. Visits for all
other reasons were unchanged from the baseline. The pattern of emergency department visits for flu symptoms mirrors
that of inpatient H1N1/influenza cases, although the increase in emergency department volumes started somewhat
sooner in both the first and second waves.

In October and November 2009, there were approximately 230,000 visits to Ontario emergency departments for
patients reporting flu-like symptoms, representing one out of every four emergency department patients. Overall, visits
for patients with flu-like symptoms were 92% higher than the historical average for October and November. The greatest
proportional increase in emergency department use occurred in those age 5 to 19 (up more than 200%, or almost
43,000 visits). However, only a small percentage of patients in this age group were admitted to hospital (2.3%, compared
with 3.7% in the baseline). Utilization by seniors changed relatively little (up 14%, or 3,600 visits) over the same October–
November time frame. Consistent with baseline data, a high proportion of emergency visits (about 45%) among those
age 65 and older were admitted to hospital.

ii.   Although some patients were diagnosed with H1N1 in the emergency department, not all patients presenting with flu-like symptoms would have been tested
      and given a definitive diagnosis before discharge.

8          The Impact of the H1N1 Pandemic on Canadian Hospitals
Figure 4: Ontario Emergency Department Visits for Patients With
Flu-Like Symptoms
Note
Baseline represents a three-year average of data, from 2006–2007 to 2008–2009.
Source
National Ambulatory Care Reporting System, 2006–2007 to 2009–2010, Canadian Institute for Health Information.
The Impact of the H1N1 Pandemic on Canadian Hospitals 9Were Hospitals Able to Cope With the
Surge of Patients?
At the height of hospital activity during the second wave, hospitals accommodated large numbers of
H1N1/influenza patients by increasing overall numbers of patients admitted, managing hospital bed and ICU
occupancy for patients requiring other types of care and increasing ventilator capacity.
Complete hospitalization data from the pandemic period may provide some clues as to whether H1N1 had an impact on
other parts of the hospital system. For example, did we observe changes—such as fewer cases or shorter lengths of
stay—for other diagnostic groups using hospital beds, ICUs or ventilators? We looked at these questions for hospital
inpatients outside of Quebec.iii
Outside of the peak of hospital activity during the second wave, H1N1/influenza patients did not represent a substantial
component of acute hospital activity. H1N1/influenza patients accounted for only 0.2% of total discharges, 0.4% of ICU
patients and 0.7% of patients requiring invasive mechanical ventilation. During this same time frame, there was little
change in hospital or ICU admissions for patients requiring other types of care, while ventilator use increased by 8%.
However, to really understand how hospitals coped with the surge in volume, we focused our analysis on the period of
highest hospital activity during the second wave, October 25 to November 28, 2009, when at least 1,000 H1N1/influenza
patients were discharged from hospital each week.
Hospitalizations
During this period, H1N1/influenza patients represented 3.4% of all acute care discharges. About half of the
H1N1/influenza patient group were accommodated through doing more—overall hospitalizations were up by 1.7%
compared to historic averages. Data suggests that the other half of H1N1/influenza patients were likely accommodated
by managing occupancy in other areas.
• Emergency department data from Ontario shows that patient visits (other than those for flu-like symptoms) were
consistent with baseline levels. This suggests that fear of contracting H1N1 did not keep patients away from
emergency departments—a situation that was markedly different than that experienced during SARS, where there
was a notable drop in emergency visits.14
• Most of the modest decrease in hospitalizations for patients with other health problems occurred in two areas. There
was a change in the number of patients with pre-booked admissions (down 2.7%, or 1,162 cases), indicating that
some planned surgical procedures may have been deferred. There were also fewer hospitalizations for patients with
angina or chest pain (down 20%, or more than 800 cases). It is possible that these patients would have been given
guidance on managing their symptoms at home and asked to return to emergency if their condition worsened.
iii. Because complete Quebec information was not available for the peak of the second wave (defined in this analysis as patients discharged between
October 25 and November 28, 2009), data from that province was excluded from the analysis.
10 The Impact of the H1N1 Pandemic on Canadian HospitalsTable 2: Percentage Change in Hospital Utilization Compared to Historic Average—Focus on Peak Period of
H1N1-Related Hospital Activity (October 25 to November 28, 2009, Canada Excluding Quebec)
Hospital Discharges ICU Ventilations
Total Patients +1.7% No change +14%
Total Patients Excluding
-1.7% -4.6% +7%
H1N1/Influenza
Source
Discharge Abstract Database, 2006–2007 to 2009–2010, Canadian Institute for Health Information.
Intensive Care
ICUs typically operate at high occupancy levels, leaving limited flexibility to accommodate an unexpected surge in
volume.15–16 During the peak of second-wave hospitalizations, almost 1,000 (970) H1N1/influenza patients outside
Quebec required ICU care. Over this time frame the number of ICU patients remained about the same as in previous
years: more H1N1/influenza patients in the ICU meant fewer admissions (down 4.6%) to ICU for patients with other
health problems.
Pandemic and other disaster plans help hospitals proactively manage ICU capacity when they expect an unusual surge
in activity, as with H1N1.15 For example, some patient groups who would normally be admitted to ICU could also—with
increased monitoring—be cared for in regular wards. The patient groups which experienced reduced ICU use relative to
the baseline appear to be consistent with a managed occupancy approach:
• Normal newborns: Overall, admissions to ICU for full-term babies without documented health issues were down 44%
compared to baseline. ICU use for low birth weight newborns or those with significant health problems remained
about the same.
• Cardiology: There was a 14% decrease in ICU admissions for cardiology patients with conditions such as chest pain,
angina and arrhythmia when compared to baseline.
• Cardiac surgery: The number of cardiac surgery patients remained about the same as baseline, indicating no
widespread cancellation of cardiac procedures. However, during this time frame the proportion of cardiac surgery
patients admitted to ICU declined by 2% over previous years. While the percentage change is small, cardiac surgery
patients are one of the largest groups using ICU care.
Together, these three patients groups represented 85% of the decline in ICU usage (compared to baseline) during the
peak period of hospitalization during the pandemic.
Ventilation
At the height of hospital activity during the second wave, the number of patients requiring invasive mechanical ventilation
increased by 14% over baseline. Half of the increase was accounted for by H1N1/influenza patients needing ventilation,
while the other half of the increase was for patients with a diverse range of health problems, including valve surgery,
respiratory ailments (such as chronic obstructive pulmonary disease, pneumonia and respiratory failure), septicemia,
poisoning/toxic effects of drugs and palliative care.
The ability to accommodate H1N1/influenza patients and increase ventilation services for patients with other health
problems may point to an increase in ventilation capacity in Canada. While approximately 1,400 patients with any
health problem received invasive ventilation during the busiest week of the pandemic, even more patients (about 1,500
discharged during the week of March 7, 2010) received ventilation care a few months later. One factor contributing to the
increased ventilator capacity may have been concerns raised by critical care physicians after the first wave of H1N1.17
The Impact of the H1N1 Pandemic on Canadian Hospitals 11Many jurisdictions expanded ventilator capacity through the purchase of additional ventilator equipment as well as increased staff training in use of the machines. In addition, provinces could draw on emergency resources through the National Emergency Stockpile System if they struggled to cope with the strain of severely ill H1N1/influenza patients. In July 2009, PHAC announced plans to purchase 370 additional ventilators to bring the total to 500 in the National Emergency Stockpile System.18 How Much Did H1N1/Influenza Cost the Acute Hospital System? Costs of caring for hospitalized H1N1/influenza patients were substantial (estimated at close to $200 million excluding physician fees), but they were relatively small in the context of overall pandemic spending. It is possible to estimate the cost of H1N1/influenza patients to the acute hospital system. The cost estimates presented here include the costs incurred by hospitals in providing services but exclude physician fees, since physicians are normally paid directly by the jurisdiction and not by the hospital. Resource Intensity Weights Costs are estimated based on Resource Intensity Weight (RIW), a value that represents the relative resources used compared to an average patient. The average patient across all diagnostic categories seen in an acute hospital would have an RIW of 1. Resources used by H1N1 patients were somewhat higher than the average patient. The average RIW for H1N1 was 2.0; for H1N1/influenza it was 1.7. As is the case for many disease groups, the RIW for H1N1/influenza patients increased with age, with a low of 1.3 for pre–school age children and a high of 2.1 for those 65 and older. Using costs per weighted case for 2008–2009, and looking across all age groups, an H1N1 patient had an average cost of about $11,000 per admission, while the average cost for the combined H1N1/influenza group was $9,600. Between April and December 2009, the estimated total inpatient cost of H1N1/influenza was $146 million ($114 million if looking only at cases with H1N1 specifically identified). This estimate assumed that costs in Quebec (which does not use the RIW system) were similar to those in the rest of the country. During the pandemic, acute hospitals also incurred costs related to increased emergency department activity. In Ontario, about 140,000 more patients with flu-like symptoms visited emergency departments than in a baseline year. Again using cost per weighted case, the additional emergency visits in Ontario are estimated to have cost $19.6 million. Data is not available on emergency department activity in other provinces. Even if information was available it might not be directly comparable, as some jurisdictions had different models, such as flu assessment clinics, for treating H1N1 patients. However, if all provinces experienced a per capita emergency department shift similar to that seen in Ontario, additional emergency department costs across the country were likely in the range of $50 million. How does the cost of hospitalizations for H1N1 compare with other costs incurred in responding to the pandemic? A comprehensive analysis of the costs of responding to H1N1 had not yet been released at the time of this analysis. Media reports have estimated total costs, provincial and federal, of greater than $2 billion. Costs include such items as the purchase and administration of vaccinations; antiviral purchase and dispensing; enhanced emergency responsiveness, including surveillance and outbreak management and rapid research; public education and self-care information; as well as physician visits and hospitalizations. Overall, pan-Canadian hospitalization costs appear to be a small proportion of estimated totals. 12 The Impact of the H1N1 Pandemic on Canadian Hospitals
How Were H1N1/Influenza Patients Different From
Those in a Typical Flu Year?
Confirming previous findings, H1N1/influenza patients admitted to hospital were younger than in a
typical flu year.

Comorbidity patterns were different. Hospitalized H1N1/influenza patients were more likely to be pregnant or
have respiratory comorbidities (asthma or other chronic lung disease) than in a typical flu year.

H1N1/influenza patients were more likely to need ICU care and ventilation than typical flu patients, but the extent
of the difference was less than earlier studies suggested.

Age
Effective pandemic preparation requires hospitals to make assumptions about the number and timing of admissions and
also about the profile of patients requiring care. For example, children may require different care arrangements (care by
parent) and staffing resources than other age groups.

H1N1/influenza had a broad impact. Across all age groups, rates of hospitalization for H1N1/influenza between April and
December 2009 were higher than for seasonal influenza. Caution must be used when interpreting the magnitude of the
difference from baseline, as there are known issues with under-investigation and under-documentation of seasonal
influenza in the discharge data.19

                                                                   The Impact of the H1N1 Pandemic on Canadian Hospitals   13
Figure 5: Rate of Hospital Admission by Age Group: H1N1/Influenza
and Baseline Influenza
Percentage Distribution of Cases by Age Group
H1N1/Influenza 21 19 47 14
Baseline
26 11 26 37
Influenza
Notes
Baseline represents a three-year average of pan-Canadian influenza hospitalizations, from 2006–2007 to 2008–2009.
Quebec data for October to December 2009 was adjusted to account for incomplete data availability at the time of analysis.
Sources
Discharge Abstract Database, 2006–2007 to 2009–2010, Canadian Institute for Health Information; Fichier des hospitalisations MED-ÉCHO, 2006–2007
to 2008–2009, and special tabulation of interim data, 2009–2010, ministère de la Santé et des Services sociaux du Québec; data derived from the census and
administrative sources on births, deaths and migration, Demography Division, Statistics Canada.
In a typical flu year, young children and the elderly have the highest rates of hospitalization.20 H1N1/influenza patients
showed a different pattern in two distinct ways:
• Young children were hospitalized at a significantly higher rate than any other age group.
• A higher hospitalization rate among those age 20 to 64 (the widest age group) means that the greatest number of
hospital patients (47%) were between age 20 and 64.
Comorbidities
Planning assumptions regarding the proportion of patients who are medically complex also have an impact on hospital
care and staffing levels required. Initial fears about H1N1/influenza centred on the fact that the virus was attacking
younger and seemingly healthy patients.21 PHAC identified that pregnant women and children younger than five (and
particularly younger than two) were at heightened risk of developing complications from H1N1, as were persons with
chronic heart disease, kidney disease, diabetes, asthma, chronic lung disease, suppressed immune systems and obesity
and current smokers.7
14 The Impact of the H1N1 Pandemic on Canadian HospitalsMany (but not all) of these conditions can be explored in the hospital discharge data. H1N1/influenza patients admitted
to hospital were more likely to have certain respiratory health issues (chronic lung disease or asthma) or be pregnant
when compared with those hospitalized with influenza in baseline years. On the other hand, patients with chronic heart
conditions, diabetes or kidney disease were somewhat less likely to be found in the H1N1/influenza group than in
baseline influenza cases. The discharge data does not contain comprehensive information on obesity or smoking status.
It is not clear why these variations in comorbidity patterns exist. Some of the difference from baseline may be attributed
to more comprehensive testing during the pandemic period (where guidelines indicated that all patients with influenza-
like illness should be tested), whereas seasonal influenza testing may be more focused on those with chronic conditions.
Figure 6: Comorbidity Profile of Hospital Patients: H1N1/Influenza and Baseline
Note
Baseline represents a three-year average of pan-Canadian influenza hospitalizations, from 2006–2007 to 2008–2009.
Sources
Discharge Abstract Database, 2006–2007 to 2009–2010, Canadian Institute for Health Information; Fichier des hospitalisations MED-ÉCHO, 2006–2007 to
2008–2009, and special tabulation of interim data, 2009–2010, ministère de la Santé et des Services sociaux du Québec.
ICU and Ventilation
Some studies have suggested that pandemic planning has focused mainly on public health, with the impact on inpatient
hospital care—and particularly on specialized inpatient services—sometimes overlooked.15 We know that the distribution
of H1N1/influenza patients, in terms of length of hospital stay, was not too different from baseline seasonal flu patients.
A typical H1N1/influenza patient stayed in hospital for three days, although there was considerable variation in
experience. A large proportion (40%) of patients were hospitalized for only a day or two, while a significant number (25%)
were in hospital for a week or more. It is the latter group, with its higher utilization of ICU care and invasive mechanical
ventilation, which is of greatest concern for pandemic planning. Most Canadian intensive care units operate at near full
capacity, so even a small increase in patients can have a major impact on the system.15, 16
The Impact of the H1N1 Pandemic on Canadian Hospitals 15Early studies suggested that 25% to 35% of H1N1 patients required ICU care.21–25 The Canadian hospital data
reveals that an estimated 2,165 patients needed ICU care, representing 15% of hospitalized H1N1/influenza cases
(versus 11% in baseline years). An estimated 1,130 H1N1/influenza patients were treated with invasive mechanical
ventilation (8% in 2009 versus 5% in baseline years). While the ICU and invasive ventilation needs were higher for
H1N1/influenza patients than in baseline years, the extent of this difference is much smaller than initial estimates,
if both H1N1 and influenza groups are considered. The proportion of patients who were seriously ill was somewhat
higher among those with an H1N1 diagnosis than among those in the combined H1N1 and influenza group.
Figure 7: Proportion of Hospital Patients Requiring Intensive Care or Invasive
Mechanical Ventilation
Notes
Baseline represents a three-year average of pan-Canadian influenza hospitalizations, from 2006–2007 to 2008–2009.
Quebec data for October to December 2009 was adjusted to account for incomplete data availability at the time of analysis.
Sources
Discharge Abstract Database, 2006–2007 to 2009–2010, Canadian Institute for Health Information; Fichier des hospitalisations MED-ÉCHO, 2006–2007
to 2008–2009, and special tabulation of interim data, 2009–2010, ministère de la Santé et des Services sociaux du Québec.
The impact of the pandemic on ICU resources was affected not only by the number of patients, but also by how long
these patients required ICU services. Outside of Quebec, H1N1 and influenza patients spent a median of 93 hours
(3.9 days) in ICU. Median ICU stays were longest among those age 20 to 64 (103 hours/4.3 days) and shortest among
those age 4 and younger (median 56 hours/2.3 days) and 5 to 19 (median 58 hours/2.4 days). Quebec captures ICU
stays in days rather than hours. Within Quebec, the median ICU length of stay was 3 days.
Because many patients had protracted ICU stays, the average ICU stay, at 170 hours (7.1 days), was longer than the
median (3.9). The average ICU stay for H1N1/influenza patients was somewhat lower than the 10-day figure used in
some hospital pandemic planning models.15
Equipment and staffing needs within the ICU are also affected by a patient’s age. Patients age 4 and younger had the
highest rates of hospitalization for H1N1/influenza, but once admitted they were least likely to require ICU care or
ventilation. Conversely, patients age 20 to 64 were least likely to be admitted to hospital, but once there they were more
likely to need ICU care or ventilation.
16 The Impact of the H1N1 Pandemic on Canadian HospitalsDid Antiviral Medication or Vaccination Programs Have
an Impact on the Use of Hospital Services?
Antiviral medication was an important part of treatment in the second wave and occurred at the same time as the
proportion of patients needing ICU and ventilators declined.
The vaccination campaign began as the second wave of H1N1 was ramping up. More study is required to
understand its impact on hospitalizations and ICU use.
The duration and severity of the pandemic peak has a major impact on how extensively hospitals are affected. Many
factors play a role. For instance, the peak of H1N1 activity was affected by the transmission and spread of influenza,
influenced by the level of immunity acquired in communities during the first wave, weather/humidity conditions and the
prevalence of competing viruses.26 Other factors were more within the control of the health system, including the
effectiveness of public education campaigns to mitigate transmission, such as staying home from school or work if sick,
coughing etiquette and hand-washing campaigns. While this report does not address these issues, it does provide some
information on two other health system activities which may have influenced the spread and severity of H1N1: delivery of
vaccinations and administration of antivirals.
Antivirals
Antiviral drugs, such as Tamiflu, can be used to treat people who are identified early in their illness. There is evidence
that antivirals are effective in reducing the duration and severity of illness from influenza when administered within an
appropriate time frame of the onset of symptoms.27 Antivirals can also be used to prevent influenza in an individual
before or after he or she is exposed to an infected person, although prophylactic use during the pandemic was
not recommended. Information on antiviral medication is available for nine provinces: British Columbia, Alberta,
Saskatchewan, Manitoba, Ontario, New Brunswick, Prince Edward Island, Nova Scotia and Newfoundland and Labrador.
Across these nine provinces, more than 362,000 prescriptions were filled between April and December 2009. This is
likely an underestimate, as data from some provinces does not provide information on antivirals prescribed in hospital
or to certain populations (see the appendix for more information).
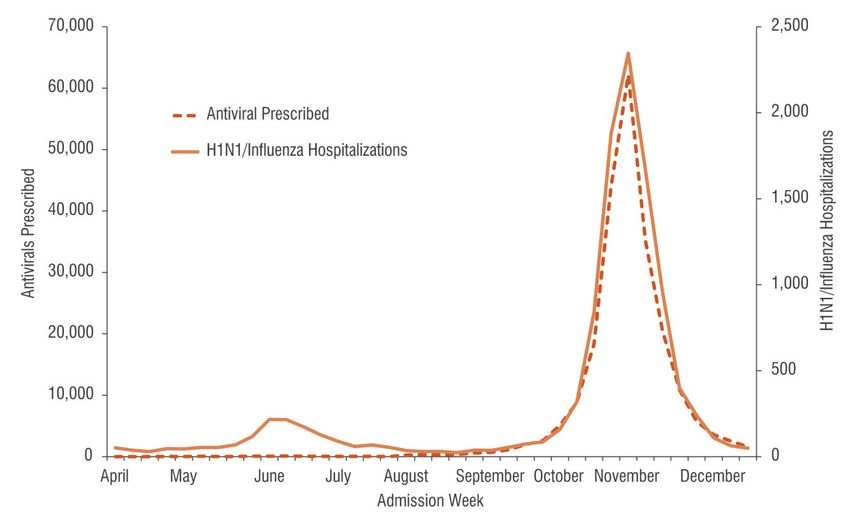
There was very little use of antiviral medication before September 2009. Lessons learned from early H1N1 experience
may have contributed to increased use of antivirals to reduce morbidity and mortality in later cases. Before the second
wave, significant awareness campaigns were directed at primary care providers regarding guidelines for treating patients
(particularly those at high risk of complication, including pregnant women) with antiviral medication at an early stage of
respiratory infection.28 During the week of November 1, 2009, alone, more than 96,000 prescriptions were filled across
nine provinces.
The Impact of the H1N1 Pandemic on Canadian Hospitals 17Figure 8: Antivirals Prescribed Compared to H1N1/Influenza Hospitalizations
(by Admit Date), April to December 2009
Sources
Discharge Abstract Database, 2009–2010, and National Prescription Drug Utilization Information System Database, April 1, 2009, to December 31, 2009, for
New Brunswick, Manitoba and Saskatchewan, Canadian Institute for Health Information; special tabulations of antiviral data, British Columbia Ministry of Health
Services, Alberta Health and Wellness, Ontario Ministry of Health and Long-Term Care, Nova Scotia Department of Health, Prince Edward Island Department of
Health and Wellness and Newfoundland and Labrador Department of Health and Community Services.
High antiviral use in October and November was observed at the same time as lower proportions of hospitalized patients
requiring ICU care and invasive mechanical ventilation.iv We don’t know whether this situation is due specifically to the
antiviral medication or whether there was a change in the hospitalized patient profile (such as a greater number of less
acutely ill patients being admitted) during this period. However, there was no observed relationship between increased
use of antivirals and an increase in the proportion of short-stay (one or two days) H1N1/influenza cases.
iv. Because antivirals for hospitalized patients would typically be administered at the beginning of a stay, the hospitalization information in this section focuses
on admission date. Analysis elsewhere in this report outlines hospital data according to discharge date.
18 The Impact of the H1N1 Pandemic on Canadian HospitalsFigure 9: Antivirals Prescribed Compared to ICU and Ventilation Admissions
(by Admit Date), April to December 2009
Note
ICU and ventilation admission lines were smoothed with a three-week moving average technique.
Sources
Discharge Abstract Database, 2009–2010, and National Prescription Drug Utilization Information System Database, April 1, 2009, to December 31, 2009, for New
Brunswick, Manitoba and Saskatchewan, Canadian Institute for Health Information; special tabulations of antiviral data, British Columbia Ministry of Health
Services, Alberta Health and Wellness, Ontario Ministry of Health and Long-Term Care, Nova Scotia Department of Health, Prince Edward Island Department of
Health and Wellness and Newfoundland and Labrador Department of Health and Community Services.
Vaccinations
Since pandemic H1N1 was a new virus, few had previous immunity against it, except for the elderly. The H1N1 vaccine
triggers the immune system to produce antibodies against the virus and to fight pandemic infection within 10 to 14 days
of vaccination.28 Health Canada approved a vaccine for H1N1 in mid-October 2010, and shortly afterwards provinces and
territories rolled out mass vaccination campaigns.29
Vaccination information by week is available for six provinces: Newfoundland and Labrador, P.E.I., Quebec, Manitoba,
Saskatchewan and Alberta. More than 7 million vaccinations were delivered across these six jurisdictions between late
October and December 2009. Another 7.2 million vaccinations were delivered in New Brunswick, Ontario and British
Columbia, where data was reported differently.
Children from 6 months to 4 years were a priority for vaccination across the country, including the five provinces for
which we have detailed information. The data suggests that this strategy was implemented successfully, with children
age 4 and younger being vaccinated before other age groups. However, one limitation of the data is it identified
vaccines administered as opposed to the number of unique recipients. Initial guidelines were for children younger than
age 9 to receive two half doses 21 days apart. On November 20, 2009, the guideline was revised to a single dose only
for healthy children age 3 to 9. Guidelines for children age 6 months to 2 years, or those with chronic health conditions,
remained unchanged.30
The Impact of the H1N1 Pandemic on Canadian Hospitals 19Figure 10: Cumulative Vaccination Rate by Age Group, Compared to
H1N1/Influenza Hospitalizations
Notes
Quebec data for October to December 2009 was adjusted to account for incomplete data availability at the time of analysis.
Saskatchewan data was unavailable by age for First Nations (8.8% of submitted vaccines) and could not be included.
Sources
Discharge Abstract Database, 2009–2010, Canadian Institute for Health Information; special tabulation of interim data, 2009–2010, Fichier des
hospitalisations MED-ÉCHO, ministère de la Santé et des Services sociaux du Québec; data derived from the census and administrative sources on births,
deaths and migration, Demography Division, Statistics Canada; data on vaccinations by week for specified age groups, April 1, 2009, to December 31, 2009,
governments of Alberta, Manitoba, Prince Edward Island, Newfoundland Labrador and Institut national de santé publique du Québec.
Did vaccination have an impact on reducing hospitalizations from H1N1? Several factors make this difficult to address.
The timing of the vaccine distribution coincided with the ramp-up of the second wave. Given that the vaccine required
about 10 to 14 days to confer immunity, it is unlikely that the vaccine had a significant impact on the height of the second
wave’s peak. However, H1N1 was a novel virus and different from traditional flu, so the vaccine may have been important
in preventing or reducing the impact of a potential third wave.
Research studies related to the H1N1 vaccine are just now being completed. Statistics Canada reported that 41% of
Canadians got the vaccination, which translates to about 11.6 million people, exceeding the coverage typically seen
for seasonal flu.29 Other important studies examining vaccine program implementation and evaluation have been
coordinated by the PHAC–CIHR Influenza Research Network.31 The results of these research studies may shed more
light on the impact of the vaccination campaign on the number of H1N1/influenza patients who required hospital care.
20 The Impact of the H1N1 Pandemic on Canadian HospitalsSummary
More than 15,000 patients across Canada were hospitalized with H1N1/influenza, two-thirds of whom needed care within
a few-week period in fall 2009. Overall, the hospital system was able to manage these patients and the specialized
services they needed. While few anticipate that H1N1 will be a major factor in the 2010–2011 flu season, there will
undoubtedly be new strains of influenza (or other viruses) to test our health care system. Good understanding of the
H1N1 pandemic in acute care hospitals will be critical as health systems review and revise their pandemic plans. H1N1
occurred at a different time of year and affected a different demographic than seasonal flu, and a higher proportion of
inpatients required specialized and scarce hospital services such as ICU and ventilation. Hospital pandemic plans are
designed to develop and match surge capacity to needs and rely on multiple assumptions about the nature of a
pandemic. Good information from the 2009 pandemic should provide strong inputs to the models used and help
hospitals improve their preparedness.
For More Information
Copies of this report are available free of charge in both official languages on the CIHI website at www.cihi.ca.
You can also find
• Presentation slides with highlights from this analysis that you can use to share the results with others; and
• Information on other CIHI activities related to H1N1, including guidance regarding the collection of H1N1 data for
health information professionals.
Acknowledgements
CIHI would like to acknowledge and thank the many individuals who contributed to the development of this analysis.
Foremost, we would like to recognize provincial officials who provided information on testing directives, antiviral use and
vaccine delivery. We know that this data could not be available without the dedication and commitment of public health
partners across the country. Several public health officials made time to assist with the conceptualization of this paper
and review of selected findings:
• Dr. Gaston De Serres, Institut national de santé publique du Québec
• Dr. Cordell Neudorf, Saskatoon Health Region
• Dr. Louise Pelletier, Public Health Agency of Canada
• Dr. Brian Schwartz, Ontario Agency for Health Protection and Promotion
Finally, appreciation goes to the CIHI staff involved, including Jennifer Frood, Tracy Johnson, Jenny Lineker,
Janet Manuel, Kathleen Morris, Jessica Ramirez-Mendoza and Simon Tavasoli.
The Impact of the H1N1 Pandemic on Canadian Hospitals 21Appendix: Technical Notes H1N1 Laboratory Testing Across the country provincial public health organizations provided formal guidance on testing for H1N1. Nasal swabs were the preferred specimens for laboratory testing. Provincial directives recommended testing all hospitalized patients with influenza-like illnesses or specific respiratory conditions such as asthma and chronic obstructive pulmonary disease. The timing of these directives played out slightly differently across the country, with some jurisdictions providing guidance as early as April and May, while others started as late as September. As well, the specificity of the directives differed across jurisdictions. For more detailed information see Testing Directive Summary at www.cihi.ca. Inpatients With H1N1/Influenza and Baseline Influenza Data Sources CIHI maintains the Discharge Abstract Database (DAD), which contains demographic, administrative and clinical data on all acute hospital discharges across Canada, excluding Quebec. For this analysis, hospitalization information for all provinces and territories (except Quebec) came from the DAD. Data is abstracted from the patient chart in each hospital using a standardized coding system. Information about specific medications or processes of care is not part of the data set. A special tabulation of Quebec data came from the Fichier des hospitalisations MED-ÉCHO (Maintenance et exploitation des données pour l’étude de la clientèle hospitalière). Quebec discharge data was provided to CIHI in July 2010 for data up to December 31, 2009. While the completeness of data from April to September 2009 is very good (at 97% of the previous year’s activity), information from October to December 2009 was less complete (at 80% of the previous year’s activity) and varied by region. A weight was created for each health region based on estimated missing records—the difference between the number of records in 2009 relative to the same time period in the previous year. This weight was then applied to actual case counts for October to December to compensate for missing data. Baseline data for 2006– 2007 to 2007–2008 was obtained from MED-ÉCHO. A special tabulation of H1N1 data was provided by PHAC. For case definitions refer to PHAC’s website at http://origin.phac-aspc.gc.ca/fluwatch/. National population estimates were produced by the Demography Division at Statistics Canada. Data was derived from the latest census and administrative sources on births, deaths and migration, adjusted for net under-coverage. Population growth for health regions in Alberta and British Columbia was supplied by Alberta Health and Wellness and BC Stats, respectively. H1N1/influenza rates used population estimates based on 2009–2010; baseline influenza rates were based on 2007–2008. Unit of Analysis The unit of analysis for this project was the episode of care. To account for patient transfers from one acute hospital to another, individual abstracts were combined to build episodes of care (or hospitalizations). A transfer was defined as a scenario when a patient was discharged from one acute facility and admitted to another within 24 hours. Linkage was done by combining the data elements Health Card Number, Gender and Province Issuing Health Card Number to create a unique identifier for each patient and identifying all relevant acute care admissions. Linking all admissions together into a single episode of care allows us to see the entire acute portion of the pathway of care. 22 The Impact of the H1N1 Pandemic on Canadian Hospitals
H1N1 Case Selection and Baseline
Selection Definitions
H1N1 cases: Abstracts with an ICD-10-CA code of J09– in any diagnostic position. Note that code J09 was previously
used for avian influenza, but the WHO re-purposed it to collect H1N1 information as of April 2009. Patients with a
diagnosis of H1N1 may or may not have had lab confirmation of the diagnosis. In May 2009, CIHI advised hospitals to
classify any lab-confirmed H1N1 cases to ICD-10-CA code J09 (given the time lag to have charts completed and
abstracted, this directive would have included captured cases from the beginning of the pandemic period in April 2009).
However, based on feedback from hospitals CIHI modified its guidance in November 2009 to also accept cases where a
clinical diagnosis of H1N1 had been made in the patient’s chart, regardless of whether there was a supporting lab report.

H1N1 and unspecified influenza cases: Abstracts with an ICD-10-CA code of J09– Influenza due to identified Avian
influenza virus, J10– Influenza due to other identified influenza virus or J11– Influenza, virus not identified in any
diagnostic position.

Baseline influenza: Abstracts representing an average of three years (2006–2007, 2007–2008 and 2008–2009) with a
diagnosis of J10– or J11– in any diagnostic position.

While not the focus of our study, it is worth understanding that seasonal influenza (baseline) is typically under-captured
in administrative databases. Few Canadians are hospitalized for influenza alone. Most are hospitalized only when a
complication of influenza develops—usually from lung infections, such as pneumonia. Once hospitalized, treatment is
focused on the pneumonia, and information on the organism that triggered the infection is not usually available. For this
reason some caution should be used when comparing to baseline, as it is likely an underestimate of actual cases.

Other Health Conditions
PHAC identified that certain patients were at heightened risk of developing complications from H1N1. This study
examined persons with the following health conditions:

 Health Condition            ICD-10-CA code (in any diagnostic position)

 Pregnancy                   O^ (excluding those with a sixth digit of 4), Z32.1, Z33^, Z34^, Z35^, Z36^

 Chronic Heart Disease       I11, I13, I20.8^, I27^, I31^, I34^, I38, I42^

 Kidney Disease              N0^, N1^, N20^, N21^, N22^, N23^, N25^, N26^, N27^, N28^

 Diabetes                    E10^, E11^, E13^, E14^

 Asthma                      J45^
 Chronic Lung Disease        J40^, J41^, J42^, J43^, J44^, J45^, J47^, J60^, J61^, J62^, J63^,
                             J64^ J66^, J67^, J70.1, J70. 3, J95.3, J96.1, J98.9
 Immune Suppressed           B24, D80, T86, Z94

PHAC also identified obesity and smoking status as risk factors for H1N1. These were not explored as the data elements
are not routinely collected.

                                                                             The Impact of the H1N1 Pandemic on Canadian Hospitals   23
You can also read