Industry and trade report - MLA

Page created by Carmen Hall
 
CONTINUE READING
Industry and trade report - MLA
Global beef
           GLOBAL MARKETS
           STRATEGIES
           CONSULTATION #1

               industry and trade report
This report offers a comprehensive overview of the global beef industry
and Australia’s trade relationship with the world.

Summary
The long-term outlook for global beef consumption is largely positive, underpinned by growth in populations and household wealth
in emerging markets, particularly throughout Asia. Australia produces only 4% of global beef but accounts for around 17% of world
trade, and has consistently been one of the top three global exporters for several decades. While 2020 was a particularly challenging
year, characterised by the far-reaching impact of COVID-19 and tight levels of Australian livestock supply, many opportunities for
targeted growth remain.

  Global opportunities for Australian beef                                                                   Global challenges for Australian beef
  • African Swine Fever (ASF) has had a significant impact on                                                • Australian beef production is expected to remain tight in
    the global meat market, particularly in growing China’s                                                    2021, as the nation enters a herd rebuild phase following
    import demand across all proteins, including beef.                                                         a period of elevated drought-induced turn-off in 2018
  • Growing household incomes within emerging markets                                                          and 2019.
    are providing many consumers with the ability to                                                         • COVID-19 has created a multitude of challenges that will
    increase the volume of their protein consumption, while                                                    likely have flow-on effects in the coming years. Key
    those shifting into the middle-upper income brackets are                                                   issues through 2020 were disruptions to foodservice
    typically improving the quality of meat they consume.                                                      channels and supply shocks created by logistical and
  • In developed markets, consumers are seeking                                                                processing barriers, with few countries exempt from the
    differentiated segments across the beef category, such                                                     impacts of reduced tourism, higher unemployment levels
    as certified breeds like Angus or Wagyu, and are                                                           and constrained consumer spending.
    exploring both grassfed and grainfed beef.                                                               • Rising production and export volumes from key
  • Expansion and modernisation of foodservice industries                                                      competitors, such as the US and Brazil, will continue to
    within developing markets.                                                                                 intensify competition in coming years, particularly within
                                                                                                               Asian markets.
  • Growing consumer interest and awareness of
    provenance, sustainability, animal welfare, food safety                                                  • The high price of beef compared to competitor proteins,
    and traceability provide messaging opportunities for                                                       such as chicken and fish, will weigh on category growth
    Australian brands and underpin ambitious, industry-wide                                                    in economically-constrained markets.
    programs for Australia to further differentiate.                                                         • There is growing consumer interest in alternative
                                                                                                               proteins, with a number of meat substitutes becoming
                                                                                                               more embedded in the mainstream marketplace and
                                                                                                               competing for market share with beef, albeit off a
                                                                                                               low base.

 Global population                                                    Households earning* >US$35k/year                                     Australia’s share of global exports
                                                                                                                                                                         Brazil – 22%
                                                                                                                                                                         Australia – 17%

    7.790                              8.104                              311.4                             396.1                                                        US – 12%
                                                                                                                                                                         India – 12%
                                                                                                                                                                         Argentina – 8%
         billion                           billion                            million                           million                                                  NZ – 6%
        in 2020                           in 2024                            in 2020                           in 2024                                                   EU – 6%
                                                                                                                                                                         Canada – 5%
                                                                                                                                                                         Rest of world – 13%

 Source: Fitch Solutions, 2020 estimate, 2024 forecast                Source: Fitch Solutions, 2020 estimate, 2024 forecast                Source: IHS Markit, 2019-20
 *includes: EU, Egypt, Bahrain, Iran, Jordan, Kuwait, Qatar, Saudi Arabia, UAE, US, Canada, Mexico, Japan, Korea, China, Australia, ASEAN, Taiwan and Hong Kong.
 Disposable income = earnings after taxes and social security charges.

         MLA Global beef industry and trade report                                                                                                                        February 2021       1
Industry and trade report - MLA
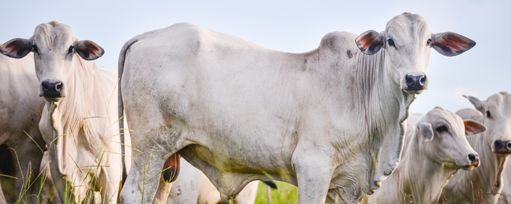
Australian beef exports – volume                         Australian beef exports – value                                                                                                             Australian beef exports – cuts
                                                                                                                                                                                                                                                                                   Manufacturing – 34%
                                                                                                                                                                                                                                                                                   Brisket – 10%
                                   Chilled grain – 14%                                                                                                                                                                                                                             Blade – 7%
                                   Frozen grain – 13%                                                                     Frozen – 62%                                                                                                                                             Chuck roll – 6%
                                   Chilled grass – 13%                                                                    Chilled – 38%                                                                                                                                            Silverside/outside – 6%
                                   Frozen grass – 61%                                                                                                                                                                                                                              Shin/shank – 4%
                                                                                                                                                                                                                                                                                   Topside/inside – 4%
                                                                                                                                                                                                                                                                                   Other – 30%
 Total 1.2 million tonnes swt                             Total A$11.26 billion
 Source: DAWE 2019-20 tonnes swt                          Source: IHS Markit, 2019-20                                                                                                                 Source: DAWE 2019–20

 Share of global beef production                          Global meat consumption – million tonnes
                                    US – 20%                                                                                                  131                   137
                                    Brazil – 15%                                      120
                                                                         106
                                    EU – 12%
                                    China – 11%                                                                                                                                                                   71                 73
                                    Argentina – 5%
                                    India – 4%
                                    Australia – 4%                                                                                                                                                                                                                                   16                         16
                                    Mexico – 3%
                                    Rest of world – 26%
                                                                               Pork                                                                  Poultry                                                              Beef                                                           Sheepmeat
                                                                                                                                                                            2020                      2024
 Source: OECD-FAO Agricultural Outlook 2020 estimate      Source: OECD-FAO Agricultural Outlook 2020 estimate

Major impacts of COVID-19                                                                   Economic impacts
                                                                                            COVID-19 has profoundly disrupted global economic growth,
The impact of COVID-19 has been multi-faceted and far-
                                                                                            with few countries immune to the impacts of reduced tourism,
reaching, requiring swift adaptation and flexibility to navigate
                                                                                            higher unemployment levels and constrained consumer
the multitude of challenges. While the majority of global
                                                                                            spending. While the majority of Australia’s top beef markets fell
industries have grappled with the effect of COVID-19, the
                                                                                            into recession in 2020, all of the top 15 markets are forecast for
agriculture sector has adapted and performed well, highlighting
                                                                                            GDP growth in 2021, according to the International Money Fund.
the resilience of the sector.
                                                                                            Global economic growth projections
Trade and logistics
COVID-19 has greatly impacted beef supply chains, with                                                                                   10
                                                                                             GDP % change (relative to previous year)

                                                                                                                                          8
logistical barriers challenging operations across the world.
                                                                                                                                          6
A combination of spreading COVID-19 cases and social                                                                                      4
distancing measures have impacted the processing industry,                                                                                2
with operational disruptions on production volumes for many                                                                               0
suppliers. Trade has been impaired as disruptions have led to                                                                            -2
port bottlenecks and congestion, slowing the turnaround of                                                                               -4
refrigerated shipping containers. Air freight has also been                                                                              -6
impacted, with disruptions to typical flight paths constricting this                                                                     -8
                                                                                                                                        -10
form of transport and creating additional costs.
                                                                                                                                              Australia
                                                                                                                                                          Canada
                                                                                                                                                                   China
                                                                                                                                                                           Hong Kong
                                                                                                                                                                                       Indonesia
                                                                                                                                                                                                   Iran
                                                                                                                                                                                                          Japan
                                                                                                                                                                                                                  Korea
                                                                                                                                                                                                                          Kuwait
                                                                                                                                                                                                                                   Malaysia
                                                                                                                                                                                                                                              Philippines
                                                                                                                                                                                                                                                            PNG
                                                                                                                                                                                                                                                                  Qatar
                                                                                                                                                                                                                                                                          Saudi Arabia
                                                                                                                                                                                                                                                                                         Singapore
                                                                                                                                                                                                                                                                                                     Taiwan
                                                                                                                                                                                                                                                                                                              Thailand
                                                                                                                                                                                                                                                                                                                         UAE
                                                                                                                                                                                                                                                                                                                               UK
                                                                                                                                                                                                                                                                                                                                    US
Foodservice and tourism
The multi-layered impact of COVID-19 has prompted some
significant shifts in consumer purchasing behaviour. The                                                       2020                                         2021
foodservice sector has been one of the most impacted
                                                                                            Source: IMF, World Economic Outlook Update, October 2020
industries, with wide-scale shutdowns and operating restrictions
across most markets. Operators in the foodservice sector that                               While global markets continue to face uncertainty from COVID-
pivoted to takeaway or delivery models were able to weather                                 19’s economic impacts, international demand for Australian red
the COVID-19 storm more successfully. With the reduction in                                 meat remains buoyant. The global ‘mega-trends’ of growth in
international travel, this has also contributed to the slowdown of                          population and disposable incomes, combined with the
the foodservice industry worldwide.                                                         continuing impact of ASF on global pork supply and demand,
                                                                                            underpin a strong opportunity for Australian beef. However,
Retail
                                                                                            there is potential for a long-term rise in protectionism (an
Retail meat sales have performed well off the back of the                                   economic policy of restricting imports from other countries)
decline in foodservice activity, with consumers spending more                               which could result in a renewed emphasis on food security and
time cooking at home. There has been a growing consumer                                     a focus on increasing local food production.
interest in country of origin, driven by a preference for food
choices promoting nutrition, immunity and overall health.

         MLA Global beef industry and trade report                                                                                                                                                                                                                                            February 2021                             2
GLOBAL CONSUMPTION
Global beef consumption is currently forecast to grow at an                                    Household income growth within developing countries is
average annual rate of 0.6% through to 2024 (OECD-FAO 2020),                                   expected to drive further demand for meat, as increasing
supported by population and income growth, primarily in Asia.                                  disposable incomes open up a range of retail and dining choices
This growth is expected to equate to an additional 1.8 million                                 for consumers. Starting from a lower per capita base,
tonnes of beef being consumed across the globe by 2024.                                        developing countries are forecast to account for 77% of
However, beef’s share of global meat consumption is expected                                   additional world consumption growth over the next five years,
to decline slightly over that period to 21% (down 0.9% relative to                             largely due to population growth, urbanisation and increasing
2020), particularly due to the rebound of global pork production                               incomes.
as ASF steadies, the gradual uptake of alternative proteins and
shifting consumer perceptions towards health and sustainability.                               Number of households earning over US$35,000
Beef consumption levels vary across the world but are often                                                          120
determined by a combination of factors, including:                                                                         5%
                                                                                                                     100
• economic growth and consumer purchasing power

                                                                                                million households
                                                                                                                     800
• population growth and demographics
• consumer dietary preferences associated with culture and                                                           600
                                                                                                                                106%
  religion                                                                                                           400                27% 19%
• a history of local meat production and consumer familiarity                                                                                        22%
                                                                                                                     200                                     9%
• competition from other proteins and relative prices                                                                                                                    23% 192% 46% 26% 82% 139%
                                                                                                                      0
• trade policies and market access

                                                                                                                           US

                                                                                                                                China

                                                                                                                                        Japan

                                                                                                                                                UK

                                                                                                                                                     Korea

                                                                                                                                                             Australia

                                                                                                                                                                         Taiwan

                                                                                                                                                                                  Indonesia

                                                                                                                                                                                                                     Saudi Arabia

                                                                                                                                                                                                                                                                                     UAE

                                                                                                                                                                                                                                                                                                                                         Philippines

                                                                                                                                                                                                                                                                                                                                                                                             Vietnam
• resilience of supply chains
• urbanisation and cold chain development.
Increasingly, consumption in developed markets is also guided                                              2020             2024f
by health perceptions, environmental considerations and animal
                                                                                               Source: Fitch Solutions
welfare claims. These consumer trends have supported the rise                                  Data labels show percentage growth of 2024 relative to 2020
of the alternative protein industry, which will play a growing role                            * Disposable income = earnings after taxes and social security charges.

in the protein landscape in the years to come.
                                                                                               Global consumer trends
Beef consumption forecasts                                                                     Beef has a long history of consumption in many markets around
                                                                                               the world and constitutes a major dietary component in some
                       30
                            Mostly developing markets              Mostly developed markets    countries. Beef encompasses a wide range of products, from
                       25                                                                      low value offal and manufacturing product through to highly
  million tonnes cwe

                                                                                               marbled premium Wagyu, all of which play a unique role
                       20
                                                                                               depending on the country and consumer segment.
                       15                                                                      In many western countries, beef is considered the ‘prime’ meat,
                       10                                                                      viewed as the most superior and delicious, and often
                                                                                               considered a family favourite. However, the role of beef differs in
                        5                                                                      many Asian and Middle Eastern countries, where proteins such
                       0                                                                       as pork (in Asia), seafood, chicken and sheepmeat (in the Middle
                            Africa   Latin America   Asia   North America Europe     Oceania
                                                                                               East) play a larger role in consumer diets.
   2020                     2023       2026 forecast        2029 forecast                      A number of trends around the world that favour both grassfed
Source: OECD-FAO 2020 Agricultural Outlook                                                     and grainfed beef – as well as other points of difference such as
Middle East and North Africa (MENA) split across Africa and Asia
                                                                                               breed and raising claims – provide Australia’s broad production
                                                                                               system with numerous opportunities to target growing
Global beef prices have been growing at a faster rate than both
                                                                                               segments.
chicken and pork. Relative to an index of 2002-2004 prices,
global beef prices have more than doubled, while poultry and
pork increased just 51% and 19% respectively (FAO meat price                                                  For a detailed of overview of                                                   MARKET SNAPSHOT l BEEF & SHEEPMEAT

index). This consistent divergence in price, underpinned by                                                   Australia’s primary beef markets, visit:                                                                                       Japan
                                                                                                                                                                                                                                                                     Japan is geographically a small country, with less than one tenth
                                                                                                                                                                                                                                                                     of the population in China. Yet the market has a high number of
                                                                                                                                                                                                                                                                     comparatively affluent households and sophisticated supply chain
                                                                                                                                                                                                                                                                     infrastructure. A balanced diet based on variety, quality and good
                                                                                                                                                                                                                                                                     flavour is highly important for Japanese consumers, and coupled
                                                                                                                                                                                              with the country’s low food sufficiency rate, Japan is a major importer of various food products from global suppliers, including beef.

substantial efficiency gains in the poultry and, to a lesser extent,                                          mla.com.au/market-snapshots
                                                                                                                                                                                              While the country’s economic growth is subdued compared with many neighbouring markets in Asia, Japanese consumers have a
                                                                                                                                                                                              strong interest in healthy living, and will continue to demand high volumes of quality imported proteins, such as Australian red meat.

                                                                                                                                                                                                                                                                                                                                                                 Meat consumption
                                                                                                                                                                                                     Population1                                              Household number by disposable income2                                                                per capita3
                                                                                                                                                                                                                                                                       US$35,000+                                      US$75,000+
                                                                                                                                                                                                                                              1,444

                                                                                                                                                                                                                                                            24.4                                                                                                            19%

pork industries, has contributed to the share of consumption
                                                                                                                                                                                                                                                                                                                                                                                      0.1%
                                                                                                                                                                                                                                                             million                                24.2                                                       42%
                                                                                                                                                                                                                                                                                                                                                                     55
                                                                                                                                                                                                                                                                                                                                                                      kg
                                                                                                                                                                                                                                                                                                                                                                             39%

                                                                                                                                                                                                    126
                                                                                                                                                                                                                                   674
                                                                                                                                                                                                                                                                        10.6
                                                                                                                                                                                                                                                                                                               3.8
                                                                                                                                                                                                    million
                                                                                                                                                                                                                                                                                          5.1                  million                                               Grocery spend4

shifting away from beef towards cheaper proteins.
                                                                                                                                                                                                                                                                                                               Japan
                                                                                                                                                                                                                                                                                          ASEAN

                                                                                                                                                                                                                                                                                                                                               3.3
                                                                                                                                                                                                    Japan

                                                                                                                                                                                                                 26                                                                                                                  1.4
                                                                                                                                                                                                                                                                                                                                                                                      A$
                                                                                                                                                                                                                                                                                                                         5.9
                                                                                                                                                                                                                                                                                                                                               China
                                                                                                                                                                                                                                                              Japan
                                                                                                                                                                                                                 Australia

                                                                                                                                                                                                                                                                                                                                     ASEAN
                                                                                                                                                                                                                                                                        Australia

                                                                                                                                                                                                                                                                                                                         Australia

                                                                                                                                                                                                                                                                                                                                                                               5,851
                                                                                                                                                                                                                                   ASEAN

                                                                                                                                                                                                                                               China

                                                                                                                                                                                                                                                                                                     China

                                                                                                                                                                                                                                                                                                                                                                               per person/year
                                                                                                                                                                                                    124 million by 2024                                       44% of total households                          7% of total households
                                                                                                                                                                                                    (-1% from 2021)                                           (52% by 2021)                                    (9% by 2021)

                                                                                                                                                                                                                      Japan is one of the largest export destinations for Australian beef, alongside the US and China. It is also the
                                                                                                                                                                                                                      largest market for grainfed beef, taking close to half of total grainfed exports.

Depending on the stage of economic development of the
                                                                                                                                                                                                        Australian beef                                            Australian beef                               Australia’s share of                                Australian beef
                                                                                                                                                                                                       exports – volume5                                           exports – value6                                beef imports7                                      offal exports6

                                                                                                                                                                                                     16%      11%
                                                                                                                                                                                                                                           Chilled grass
                                                                                                                                                                                                                                                                                                                                             Australia
                                                                                                                                                                                                                                                                                                                                                           A$283 million
                                                                                                                                                                                                                                           Chilled grain    43%                                   Chilled
                                                                                                                                                                                                                             33%
                                                                                                                                                                                                                                           Frozen grass                             57%           Frozen           46%                       Other
                                                                                                                                                                                                                                                                                                                                             countries
                                                                                                                                                                                                                                                                                                                                                           Key outlet:
                                                                                                                                                                                                                                           Frozen grain

country in question, the challenges and opportunities across
                                                                                                                                                                                                    40%
                                                                                                                                                                                                                                                                                                                                                           (table-top BBQ)

                                                                                                                                                                                                     Total 284,023 tonnes swt                                      Total A$2.42 billion

                                                                                                                                                                                                                      Japan is a consistent buyer of Australian sheepmeat and is the largest chilled lamb customer in Asia. In 2019–20,
                                                                                                                                                                                                                      total sheepmeat fell 3% on year-ago levels, largely due to a decrease in supply.

                                                                                                                                                                                                    Australian sheepmeat                                     Australian sheepmeat                                 Australia’s share of                     Major outlet of Australian

consumer profiles differ. For instance, demand in many mature
                                                                                                                                                                                                     exports – volume5                                         exports – value6                                  sheepmeat imports7                              sheepmeat 8

                                                                                                                                                                                                                       42%                 Chilled lamb      28%                                                                                          (Sheepmeat BBQ)
                                                                                                                                                                                                                                                                                                                                             Australia
                                                                                                                                                                                                                                                                                                                   64%
                                                                                                                                                                                                 29%                                       Frozen lamb                                            Lamb
                                                                                                                                                                                                                                           Chilled mutton                                         Mutton                                     Other
                                                                                                                                                                                                                                                                                                                                             countries
                                                                                                                                                                                                                                                                                                                                                          in Hokkaido
                                                                                                                                                                                                                                           Frozen mutton                                                                                                  (Northern island
                                                                                                                                                                                                                                                                            72%                                                                           of Japan)
                                                                                                                                                                                               1%          28%

markets is shifting focus from quantity to quality, as many
                                                                                                                                                                                                       Total 13,793 tonnes swt                                     Total A$164 million
                                                                                                                                                                                                                              1                                                                                                                            2
                                                                                                                                                                                              Data source for charts: Fitch Solutions 2021, ASEAN = Brunei, Cambodia, Indonesia, Laos, Malaysia, Myanmar, Philippines, Singapore, Thailand and Vietnam, Fitch Solutions 2021 (disposable income =
                                                                                                                                                                                                                                                                                                                                                         3
                                                                                                                                                                                              earnings after taxes and social security charges), ASEAN = Cambodia, Indonesia, Laos, Malaysia, Myanmar, Philippines, Singapore, Thailand and Vietnam, Fitch Solutions, GIRA (per person per year in
                                                                                                                                                                                                                                           4
                                                                                                                                                                                              cwt excluding fish/seafood) 2020 and 2021, IGD 2021 (defined as the total annual grocery retail market turnover in a given year, divided by the population for the same year. Grocery retail market data
                                                                                                                                                                                                                       5                     6                            7                                                             8
                                                                                                                                                                                              excludes VAT/sales tax), DAWE (FY 2019–20), ABS/IHS Markit (FY 2019–20), IHS Markit (most recent 12 months due to data availability), MLA

                                                                                                                                                                                                              MLA MARKET SNAPSHOT                           BEEF AND SHEEPMEAT                         JAPAN                                                               September 2020            1

high-income countries are reaching saturation levels of per
capita meat consumption and consumer preferences leading to
a diversification of protein sources. Differentiation is a key factor
which will become increasingly important for consumers in
developed markets, as they seek flavour and experience over
volume.

                        MLA Global beef industry and trade report                                                                                                                                                                                     February 2021                                                                                                                                     3
World meat price indices                                                                                                                            Global meat consumption: developed economies

                       300                                                                                                                                                250

                       250                                                                                                                                                200
 index (2002–04=100)

                                                                                                                                                     million tonnes cwe
                       200                                                                                                                                                150

                       150                                                                                                                                                100

                       100                                                                                                                                                 50

                        50                                                                                                                                                 0

                                                                                                                                                                                2000
                                                                                                                                                                                 2001
                                                                                                                                                                                2002
                                                                                                                                                                                2003
                                                                                                                                                                                2004
                                                                                                                                                                                2005
                                                                                                                                                                                2006
                                                                                                                                                                                2007
                                                                                                                                                                                2008
                                                                                                                                                                                2009
                                                                                                                                                                                 2010
                                                                                                                                                                                  2011
                                                                                                                                                                                 2012
                                                                                                                                                                                 2013
                                                                                                                                                                                 2014
                                                                                                                                                                                 2015
                                                                                                                                                                                 2016
                                                                                                                                                                                 2017
                                                                                                                                                                                 2018
                                                                                                                                                                                 2019
                                                                                                                                                                                2020
                                                                                                                                                                                 2021
                                                                                                                                                                                2022
                                                                                                                                                                                2023
                                                                                                                                                                                2024
                                                                                                                                                                                2025
                                                                                                                                                                                2026
                                                                                                                                                                                2027
                                                                                                                                                                                2028
                             2004
                                    2005
                                           2006
                                                  2007
                                                         2008
                                                                2009
                                                                       2010
                                                                              2011
                                                                                     2012
                                                                                            2013
                                                                                                   2014
                                                                                                          2015
                                                                                                                 2016
                                                                                                                        2017
                                                                                                                               2018
                                                                                                                                      2019
                                                                                                                                             2020
                                                                                                                                                             Beef               Pork   Poultry   Sheepmeat
         Beef                  Sheepmeat                        Pork            Poultry
                                                                                                                                                    Source: OECD-FAO 2020 Agricultural Outlook
Source: FAO

There are several broad trends affecting beef consumption                                                                                           Global meat consumption: developing economies
globally in both foodservice and retail channels, with growth in
                                                                                                                                                                          250
consumer demand for:
• fresher and less processed offerings                                                                                                                                    200

                                                                                                                                                     million tonnes cwe
• more customised meals
                                                                                                                                                                          150
• more international cuisines
• messaging relating to provenance and health (e.g. ‘grassfed’,                                                                                                           100
  ‘free from’, ‘natural’)
                                                                                                                                                                           50
• growth of e-commerce and different delivery methods
• more convenient, on-the-go offerings                                                                                                                                     0
                                                                                                                                                                                2000
                                                                                                                                                                                 2001
                                                                                                                                                                                2002
                                                                                                                                                                                2003
                                                                                                                                                                                2004
                                                                                                                                                                                2005
                                                                                                                                                                                2006
                                                                                                                                                                                2007
                                                                                                                                                                                2008
                                                                                                                                                                                2009
                                                                                                                                                                                 2010
                                                                                                                                                                                  2011
                                                                                                                                                                                 2012
                                                                                                                                                                                 2013
                                                                                                                                                                                 2014
                                                                                                                                                                                 2015
                                                                                                                                                                                 2016
                                                                                                                                                                                 2017
                                                                                                                                                                                 2018
                                                                                                                                                                                 2019
                                                                                                                                                                                2020
                                                                                                                                                                                 2021
                                                                                                                                                                                2022
                                                                                                                                                                                2023
                                                                                                                                                                                2024
                                                                                                                                                                                2025
                                                                                                                                                                                2026
                                                                                                                                                                                2027
                                                                                                                                                                                2028
• smaller but higher quality premium portions.
Consumer perceptions of beef and competing proteins can also                                                                                                 Beef               Pork   Poultry   Sheepmeat
vary significantly from market to market. For instance, the
                                                                                                                                                    Source: OECD-FAO 2020 Agricultural Outlook
economic development of a country influences typical
consumer purchasing drivers, with developing countries
focusing more on freshness and safety, while developed                                                                                              Major global markets
markets focus on value and points of difference. Given the
diversity of Australian beef, understanding consumer needs and                                                                                      United States
what drives purchasing decisions in each market is essential.
                                                                                                                                                    Globally, the US has the highest number of households earning
Key motivators to purchase beef                                                                                                                     disposable incomes over US$35,000 and US$75,000 per year.
                                                                                                                                                    This affluent consumer base, combined with high per capita
Japan                                                    Safety                       Freshness                                Value                beef consumption, means the country remains highly attractive
                                                                                                                                                    and influential in the global protein trade landscape.
Korea                                                    Safety                             Natural                       Freshness                 Opportunities exist for Australian red meat to enhance its profile
Saudi Arabia                                             Halal                              Safety                             Natural              in the US thanks to growing demand from consumers for natural,
                                                                                                                                                    healthy and environmentally sustainable products.
China                                                    Safety                             Natural                       Freshness
                                                                                                                                                    The US is one of the largest global consumers of animal
United States                                      Freshness                                Natural                            Value                proteins, with the level of meat consumption near maturity.
                                                                                                                                                    Going forward, the opportunity for growth within the beef
Indonesia                                                Halal                        Freshness                                Safety               category will be to increase export value through premium
Malaysia                                                 Halal                              Safety                        Freshness                 products like chilled grassfed beef, rather than through
                                                                                                                                                    increased volume of conventional beef exports.
Source: MLA Global Consumer Tracker

                                                                                                                                                    China
The popularity of meat alternatives is growing and research                                                                                         China has transformed from being a minor import market in
indicates that as protein demand evolves in the future,                                                                                             2010 to the world’s largest imported beef market in 2020, with
traditional growth drivers may become more contemporary,                                                                                            growth accelerated by the spread of ASF and the subsequent
such as dietary shifts for health and ethical reasons, government                                                                                   decline in pork production. However, China’s beef import
regulations, environmental constraints and technological                                                                                            expansion was underway well before the onset of ASF. It is
advances. While traditional meat will dominate the protein mix                                                                                      expected that population and income growth across the country
for decades ahead, a growing proportion of the global protein                                                                                       will continue to drive importation growth in the long‑term.
shortfall is expected to be offset by emerging plant-based
                                                                                                                                                    Chinese consumers consider beef a superior protein, making it
alternatives, lab grown proteins and expanding aquaculture
                                                                                                                                                    a family favourite due to its high nutritional value and great
production.
                                                                                                                                                    taste. Barriers to more frequent consumption, apart from price,
                                                                                                                                                    are driven by perceptions that beef is more difficult to prepare,
                                                                                                                                                    less fresh and less tender compared to other proteins. In urban
                                                                                                                                                    upper middle-class households, there is increasing exposure to
                                                                                                                                                    western-style steaks, sausages, pasta dishes and burgers, both
                                                                                                                                                    at home and via foodservice.

                         MLA Global beef industry and trade report                                                                                                                                          February 2021   4
Annual beef consumption per capita                                                                                                                              developed in the world in size and sophistication, with a diverse
                                                                                                                                                                range of global cuisines and price points available to
                             30
                                                                                                                                                                consumers.
                             25
 kg/person (retail weight)

                                                                                                                                                                South-East Asia
                             20
                                                                                                                                                                This dynamic and fast-growing region is diverse in population
                             15                                                                                                                                 size, economic status and cultural/ethnic background. Improving
                                                                                                                                                                household incomes and changing consumer tastes in the region
                             10
                                                                                                                                                                are driving a rapid rise in red meat consumption, particularly in
                              5                                                                                                                                 urban cities. South-East Asian consumers associate beef with
                                                                                                                                                                superiority and good taste, which typically drive them to pay a
                             0
                                                                                                                                                                premium for it. Consumers also have positive perceptions of
                                  US

                                        Australia

                                                    Canada

                                                             Korea

                                                                     UK

                                                                          EU

                                                                               Vietnam

                                                                                          Japan

                                                                                                  Malaysia

                                                                                                             China

                                                                                                                     Saudi Arabia

                                                                                                                                    Philippines

                                                                                                                                                  Indonesia
                                                                                                                                                                imported beef products, with ‘premium quality’ and ‘better taste’
                                                                                                                                                                being commonly perceived benefits.

                                                                                                                                                                MENA (Middle East and North Africa)
Source: OECD-FAO 2020
                                                                                                                                                                MENA is a large, complex region with many varied consumer
                                                                                                                                                                markets. MENA consumers have traditionally preferred leaner
Japan                                                                                                                                                           meat. However, consumption and spending on beef is forecast
                                                                                                                                                                to increase across almost all MENA markets in the next several
A balanced diet based on variety, quality and good flavour is
                                                                                                                                                                years as more affluent consumers come to appreciate the
very important for Japanese consumers, and coupled with the
                                                                                                                                                                benefits of premium quality beef, combined with ongoing
country’s low food sufficiency rate, Japan is a major importer of
                                                                                                                                                                urbanisation and westernisation. The region has a comparatively
various food products from global suppliers, including beef.                                                                                                    young population – all MENA-10 countries, except Kuwait, have
While the country’s economic growth is subdued compared with                                                                                                    over half of their population aged under 35 years.
many neighbouring markets in Asia, Japanese consumers have
a strong interest in healthy living, and will continue to demand
high volumes of quality imported proteins. Despite flat
population growth, beef consumption is projected to increase in                                                                                                    For the latest outlook on Australian
Japan due to growing per capita consumption.                                                                                                                       export markets, visit: mla.com.au/
                                                                                                                                                                   prices-markets/overseas-markets/
Beef is considered the most premium protein with good taste,
underpinned by a strong emotional connection and a unique
flavour experience. Japan’s restaurant sector is one of the most

GLOBAL SUPPLY
Global beef production was estimated to have fallen by 2% in 2020, largely due to the contraction of Australian beef supplies and the
impact of COVID-19 on the Indian meat processing industry. In 2021, the United States Department of Agriculture (USDA) has forecast
global production volumes to lift to 61.5 million tonnes carcase weight equivalent (cwe), an increase of 2% on 2020 levels. Economic
recovery across the globe is expected to support the growth of beef production, particularly for those nations that have suffered
from disruptions caused by COVID-19.
Global beef production

            0–499                      500–999                   1,000–1,499             1,500–1,999                  2,000–2,499                             2,500–2,999   3,000–3,499    3,500–3,999    4,000+
Source: USDA, 2020 volumes, thousand tonnes cwe

The types of production systems and supply chains vary greatly around the world. Beef production in NZ, the EU and India is mainly
a by-product of large dairy industries. However, at one extreme, New Zealand is almost entirely export focused, while the EU is
domestically oriented.

                              MLA Global beef industry and trade report                                                                                                                                        February 2021   5
Production mix
                             100                                                                                                                                                 Australia
                                       China                                  Argentina                                                                                                                                  Uruguay

                             80                     US   Mexico                      Canada
 Beef cattle % of cow herd

                             60                                     Brazil

                             40
                                           EU

                             20
                                           Russia
                                                                                                                                                                                                                                          New Zealand
                                                                             India
                              0
                                   0                         20                               40                                                            60                                                         80                                         100
                                                                                              Export % share of production

Source: USDA
Bubble size reflects 2020 production

Meanwhile, most producers in North and South America rely on                                                  of cattle went through this system in 2019–20, comprising 46%
beef cattle genetics for production, but the former primarily                                                 of the national kill. The MSA system takes into account all
finishes Bos taurus cattle on grain and the latter a mix of Bos                                               factors that affect eating quality from paddock to plate, and is
taurus and Bos indicus cattle predominantly on grass. Uruguay’s                                               recognised as a world-leading eating quality program.
beef industry is similar to Australia’s, with Bos taurus genetics,
traceability systems and an export focus, however, it remains a
much smaller competitor in global markets and produces                                                                                  For the latest outlook on Australian
predominantly grassfed beef.                                                                                                            beef supply, visit:
                                                                                                                                        mla.com.au/cattleprojections
Australia
Following on from a sustained period of drought from 2018–19,
notable levels of rainfall in 2020 have resulted in increased
pasture availability, predominantly across the eastern states.
After several years of high cattle turn-off and the cattle herd
sitting at historically low levels, this has created the opportunity
for producers to rebuild numbers. Driven by the ongoing dry
conditions, the Australian cattle herd dipped to a 20-year low in
2020, sitting below 25 million head. Beef production is                                                       United States
expected to tighten in 2021, as producers across the country                                                  The US is the world leader in beef production, utilising extensive
look to rebuild herd numbers, assuming seasonal conditions                                                    grain feeding systems that enable quick weight gain and
continue to support a rebuild phase.                                                                          efficient outputs. US cattle are among some of the heaviest in
The Australian feedlot sector continues to grow in an effort to                                               the world, and impressive economies of scale allow the US to
mitigate periods of climate variation and enable a consistent                                                 compete strongly with other global producers where land,
supply of beef, regardless of conditions. This ensures Australia                                              labour and cattle are substantially cheaper.
can continue to produce high volumes of quality beef year-
                                                                                                              Global carcase weights
round and a steady supply of product to both domestic and
international markets.                                                                                                                            400
                                                                                                               Average carcase weight (kg/head)

The quality and safety of Australian beef is guaranteed through                                                                                   350
an assortment of traceability systems, underpinning Australia’s                                                                                   300
competitive edge. The main systems underpinning Australian                                                                                        250
beef are the:
                                                                                                                                                  200
                                                                                                                                                                                          European Union

• National Livestock Identification System (NLIS)
                                                                                                                                                                 United States

                                                                                                                                                  150
• Livestock Production Assurance (LPA)
                                                                                                                                                                                                                                           Argentina

                                                                                                                                                  100
                                                                                                                                                                                                           Australia

                                                                                                                                                                                                                       Uruguay
                                                                                                                                                        Canada

                                                                                                                                                                                 Mexico

                                                                                                                                                                                                                                                       China

• National Vendor Declaration (NVD)
                                                                                                                                                                                                                                 Brazil

                                                                                                                                                                                                                                                               India

                                                                                                                                                   50
                                                                                                                                                   0
                       For the latest outlook on Australian traceability systems                              Source: USDA
                       visit: integritysystems.com.au
                                                                                                              The US remains a major competitor for Australia and has a
Through these systems, Australia is able to protect the disease-                                              strong presence within some of Australia’s largest markets,
free status of Australian red meat, as well as maintain Australia’s                                           Japan and Korea, while also expanding slowly into China
image as a clean, safe and natural producer and exporter of                                                   following the US-China trade agreement signed in early 2020.
red meat.                                                                                                     The US can produce high quality beef, with grainfed cattle of
The consistent eating quality of grass and grainfed beef is                                                   Bos taurus genetics making up the majority of production, while
guaranteed through the Meat Standards Australia (MSA) grading                                                 developed cold chain infrastructure and modern slaughter
program, which has been developed to improve the supply of                                                    facilities provide the capability to export chilled product.
consistently high quality beef to the consumer. A record number

                                   MLA Global beef industry and trade report                                                                                                                                                              February 2021               6
US beef production/herd size

                      13.0                                                                 105
                      12.5
                                                                                           100
                      12.0
 million tonnes cwe

                      11.5                                                                 95

                                                                                                 million head
                      11.0
                      10.5                                                                 90

                      10.0
                                                                                                                               Brazilian Bos indicus Nelore cattle
                                                                                           85
                      9.5
                                                                                                                Brazil’s grain feeding capabilities are building. In 2019, about 6
                      9.0                                                                  80
                                                                                                                million cattle were finished on grain – almost doubling from a
                               1990
                                1991
                               1992
                               1993
                               1994
                               1995
                               1996
                               1997
                               1998
                               1999
                              2000
                               2001
                              2002
                              2003
                              2004
                              2005
                              2006
                              2007
                              2008
                              2009
                               2010
                                2011
                               2012
                               2013
                               2014
                               2015
                               2016
                               2017
                               2018
                               2019
                             2020e
                              2021f
                                                                                                                decade prior, but dwarfed by the 40 million processed overall.
                                                                                                                While feedlots currently only account for approximately 10% of
        Beef production (LHS)                      Herd size January (RHS)
                                                                                                                Brazil’s meat production, this is expected to double over the
Source: USDA                                                                                                    next five years. This shift in production focus could soon see
                                                                                                                Brazil challenge Australia and the US in grainfed beef export
The US cattle herd follows a fairly consistent cyclical pattern,                                                markets.
and with the peak now likely to be reached in 2021, a
contraction is expected in the coming years, underpinned by                                                     Beef production and export forecasts 2021
reduced cow-calf profitability, increased female slaughter and
an eventual smaller calf crop. US beef production is forecast to                                                                                                  20
                                                                                                                                                                                                               India
increase in 2021, as a result of a greater availability of cattle and

                                                                                                                Percentage export growth
                                                                                                                                                                      15
heavier slaughter weights, due in part to COVID-19’s impact on                                                                                                                     Canada
processing capacity. This increase in production will likely result                                                                                                   10
in US export volumes lifting, increasing competition for market                                                                                                       5
                                                                                                                                                                           US          Brazil
share across international markets.                                                                                                                              EU
                                                                                                                                                                                Australia
                                                                                                                                                                      0
                                                                                                                                           -6     -4        -2          0 New Zealand
                                                                                                                                                                               2          4       6        8           10
Regional beef production growth (2009–2029f)
                                                                                                                                                                      -5
                                                                                                                                                Argentina
                      25                                                                                                                                          -10
                                                                                                                                                                                         Percentage production growth
                                                                          Latin America
 million tonnes cwt

                      20                                                                                        Source: USDA Foreign Agriculture Service, MLA estimates (Australia)
                                                                                                                Note: Bubble size shows expected 2020 export volume. Percentage growth shows 2021 forecast
                           North America                                                  Asia                  relative to 2020 levels.
                      15
                                      f2029
                      10 2009                                    Africa                                         Argentina
                                          Europe
                               2019                                                                             Argentina produces a mix of commodity and high-quality beef,
                       5
                                                                                                                with the herd made up of predominantly Bos taurus genetics.
                       0
                                                      Oceania                                                   Grainfed cattle account for close to a third of Argentinian cattle
                                                                                                                turn-off. Argentinian beef exports in 2021 are expected to
Source: FAO-OECD 2020 Outlook                                                                                   contract slightly as production volumes are forecast to tighten
                                                                                                                after a period of elevated slaughter through 2020 on the back of
Brazil                                                                                                          dry conditions across the country.
Brazilian beef production is expected to continue growing in                                                    Argentina’s beef export situation improved substantially in 2015
coming years, underpinned by a slowly expanding herd, the                                                       following the removal of a 15% export tariff, export restrictions
opening of new land for grazing, greater availability of slaughter                                              and currency controls overvaluing the peso. However, recent
cattle and strong international demand. Brazil lacks the                                                        years have seen a surge in inflation and a collapse of the
efficiency of Australia in producing beef, but has been catching                                                Argentinian peso. The combination of these factors has lent
up in recent years as it adopts new practices and technologies.                                                 support to the commercial viability of exporting beef rather than
                                                                                                                selling it locally, resulting in the proportion of Argentinian beef
Compared to Australia and the US, the Brazilian herd is less
                                                                                                                which is exported lifting from 7% in 2015 to 25% in 2020.
productive, giving it greater ability to lift future production from
efficiency gains rather than from greater resource use. Both                                                    Argentinian beef has become very competitive in the global
investment and modernisation have improved production                                                           market. China became a major destination for Argentinian beef
efficiency, with Brazil increasing beef production by 3.7 million                                               in 2020, with shipments doubling relative to 2019 and the
tonnes (or 55%) carcase weight (cwt) since the beginning of the                                                 market accounting for almost three quarters of exports. The
millennium.                                                                                                     price of cattle in Argentina is substantially lower than prices in
                                                                                                                other countries, such as the US and Australia, which creates a
Brazil has been a key contributor to global production growth in
                                                                                                                significant competitive advantage for its product.
recent years, a trend that is set to continue in 2021. Beef
production in Brazil is expected to benefit from an improving                                                   European Union (EU)
domestic market and enduring demand from China, MENA, and
                                                                                                                The EU is a significant producer of beef, but most production is
emerging demand from South-East Asia.
                                                                                                                derived from a dairy-based herd and consumed domestically.
The Brazilian herd is predominantly comprised of Bos indicus                                                    After an increase from 2013–19 due to a restructuring of the dairy
breeds finished on pasture and destined for the commodity beef                                                  sector, EU beef production began to decline in 2020, and is
trade. However, Brazilian livestock operations are increasingly                                                 expected to continue falling long-term until 2030. Nevertheless,
using an ‘industrial cross’ of local Bos indicus Nelore cattle with                                             in 2020, beef production was estimated at 7.8 million tonnes cwe
US/Argentine Angus genetics. This industrial cross combines                                                     – almost four times that of Australia. France holds the position as
the feed efficiency and meat quality benefits derived from                                                      the largest beef producer in the region, accounting for 17% of EU
Angus cattle with the heat and tick tolerance found in the                                                      production in 2019, followed by Germany (13%) and the UK (11%).
Nelore breed.                                                                                                   In 2020, domestic beef production was estimated to account for
                                                                                                                95% of total EU beef consumption.
                           MLA Global beef industry and trade report                                                                                                                            February 2021         7
The region is a high-cost producer of beef, remaining heavily                                                    developing the agriculture sector due to its importance to
protected from the global market while being subsidised                                                          economic growth.
through the EU Common Agricultural Policy. Regardless of the
expected decline in production, beef exports are predicted to                                                    Australian cost of production
increase by 8% in 2020, with newly obtained access into China                                                    While one of the most efficient countries to breed and grow out
for some member states combined with increasing demand from                                                      calves – largely due to high levels of broadacre labour efficiency
existing partners in the Philippines, Bosnia and Israel, and                                                     and economies of scale – Australia is less competitive in
sluggish domestic demand. Irish beef exports, currently                                                          finishing cattle relative to other major producers (the result of
dominated by the UK market, remain sensitive to the Brexit                                                       high costs of store cattle, land, labour, regulatory requirements
outcome, and may be directed into new markets in coming                                                          and feed). High on-farm costs are compounded by additional
years. The majority of beef production in the EU is traded                                                       expenses in the supply chain, particularly in processing cattle,
internally through Europe, with much of the remainder destined                                                   where Australia’s costs are twice that of Brazil’s and 24% more
for the UK.                                                                                                      than the US’s (AMPC). With a high reliance on exports, Australia
China                                                                                                            also faces greater freight and supply chain costs, as well as
                                                                                                                 tariffs in some markets, compared with other major producers
China is the world’s third largest beef producer. By global                                                      servicing similar domestic markets.
standards, China’s production system is characterised by
smaller-scale producers and abattoirs. An inability for local                                                    Prior to 2015, cattle prices in Australia closely tracked with
production to keep up with increasing demand has led to a                                                        South American prices on a currency-adjusted basis, but the
surge in imports in recent years. China’s domestic beef                                                          separation in markets following the 2014–15 Australian drought
production shortfall is expected to continue expanding over the                                                  has not reversed, partly due to relatively tight supplies of
next five years, with short-term fluctuations in local production                                                finished cattle in Australia and the Brazilian real and Argentine
– which still accounts for over 70% of consumption – likely                                                      peso coming under significant downward pressure in recent
having a significant impact on import requirements.                                                              years, with both dropping dramatically in 2019.
                                                                                                                 While elevated prices are positive for Australian producers, high
India                                                                                                            slaughter and supply chain costs mean that Australia must
Indian buffalo meat (IBM) is a commodity product that sets the                                                   continue to focus on improving efficiency and increasing the
world price floor. IBM is a by-product of the large Indian dairy                                                 value proposition for consumers in order to remain competitive.
industry, made up of many smallholders. India does not have
FMD-free status, restricting access to many countries.                                                           Global cattle prices
Therefore, it predominantly exports to developing and price
                                                                                                                                    400
sensitive markets in South-East Asia and the Middle East.
IBM production expanded rapidly throughout the 2000s as the                                                                         350
dairy sector grew and buffalos began being utilised for meat,
however, it has slowed recently. While a massive industry, IBM
                                                                                                               US¢/kg live weight

                                                                                                                                    300
production remains sensitive to domestic politics, with some
Hindu groups emboldened by the Modi government calling for
its outright ban. Approximately 40% of IBM production is                                                                            250

consumed domestically, predominantly by India’s Christian and
Muslim populations.                                                                                                                 200

India’s agriculture industry was hit particularly hard by the
consequences of COVID-19. Contractions in processing capacity                                                                       150

and logistical complications across the industry meant that
exports of IBM collapsed in the first half of 2020. While India’s                                                                   100
                                                                                                                                           2012   2013      2014   2015   2016    2017     2018      2019      2020
agricultural infrastructure isn’t as developed as that of some
other beef producing nations, the underlying potential of the                                                                  US         Australia      Brazil    Argentina     Uruguay         Paraguay
country means the Indian government has prioritised                                                              Source: IPCVA (Argentina); MLA’s NLRS (Australia); Esalq/Cepea (Brazil); USDA/Steiner Consulting
                                                                                                                 Group (US). Finished cattle (steer) specifications vary between indicators.

Cattle slaughter costs*                                                            On-farm cost of finishing cattle**
                                                                                                                                                                     For more information on
                                                                                                                                                                     Australia’s comparative cost of
           400                                                         1.4                500                                                                        production, visit:
           350                                                         1.2
                                                                                                                                                                     ampc.com.au/2018/10/Analysis-
           300                                                                            400
                                                                       1.0                                                                                           of-Regulatory-and-Related-
           250                                                                                                                                                       Costs-in-Red-Meat-Processing
                                                                       0.8
 A$/head

                                                                                 US¢/kg

       200                                                                                300                                                                        mla.com.au/prices-markets/
                                                                       0.6
           150                                                                                                                                                       Trends-analysis/agribenchmark
                                                                       0.4
           100                                                                            200

           50                                                          0.2

            0                                                          0.0                100
                  Australia    US         Argentina         Brazil                              Canada Australia                    US     Argentina   Brazil

    Labour Utilities              Certification         Other                              Maximum        Average                         Minimum
    A$/kg cwt (RHS)
Source: *AMPC (Analysis of regulatory and related costs in red meat processing) 2015-16 typical operating slaughter costs and excludes cost of cattle.
**agri benchmark 2018 typical farm/feedlot cost of finishing cattle, includes the cost of store cattle.

                 MLA Global beef industry and trade report                                                                                                                                  February 2021          8
GLOBAL TRADE AND DEMAND					
The bulk of beef consumption growth over the past decade has                                                                                                       Australian beef exports (2000–2020)
been in the developing world, particularly Asia, with forecasts
                                                                                                                                                                                      450
for the next decade indicating a similar trend. However, surplus                                                                                                                                Japan 2000         2015
                                                                                                                                                                                      400
production remains centred in North and South America and                                                                                                                                                 US
                                                                                                                                                                                      350

                                                                                                                                                                   ‘000 tonnes cwt
Australasia. These production and consumption imbalances                                                                                                                                                                  China
                                                                                                                                                                                      300
drive global trade. Additionally, reduced tariffs and sea freight
                                                                                                                                                                                      250
costs, improved cold chains and the development of governing                                                                                                                                                       2020           Korea
                                                                                                                                                                                     200                                                            Indonesia         Other
institutions have supported the growth of the global beef trade
                                                                                                                                                                                          150
over the past two decades. In 2020, 17% of beef production was                                                                                                                                            2011                             SEA
                                                                                                                                                                                          100                                         (exc. Indonesia)         MENA
traded internationally – higher than poultry, pork and
                                                                                                                                                                                          50
sheepmeat.
                                                                                                                                                                                           0

Top beef exporters and importers                                                                                                                                   Source: DAWE

               12
                                         Top exporters                                                         Top importers                                       Competitive landscape
               10
                                                                                                                                                                   The competitive landscape for the global beef market has
               8                                                                                                                                                   evolved over the decades. While export volumes are ten-fold
 US$ billion

               6                                                                                                                                                   what they were in the 1960s, Australia has consistently
                                                                                                                                                                   maintained an important role within the global marketplace, and
               4                                                                                                                                                   remains one of the three largest beef exporters.
               2
                                                                                                                                                                   Competition in Australia’s major markets
               0
                                                                                                                                                                                                                 More premium                            More commodity
                    Australia
                                Brazil
                                         US
                                              Argentina
                                                          India
                                                                  NZ
                                                                       EU*
                                                                             Canada
                                                                                      Taiwan
                                                                                               Russia
                                                                                                        UK*
                                                                                                              Hong Kong
                                                                                                                          EU*
                                                                                                                                South Korea
                                                                                                                                              Japan
                                                                                                                                                      US
                                                                                                                                                           China

                                                                                                                                                                                          100

                                                                                                                                                                                           80
Source: IHS Markit, FY2019–20
                                                                                                                                                                       market share (%)

*EU only includes external trade but UK includes trade within and outside the EU                                                                                                           60

Australia exports approximately 75% of beef production –                                                                                                                                   40
far more than most but comparable to New Zealand and
Uruguay – and as such, is heavily exposed to currency                                                                                                                                      20
fluctuations, the health of the global economy and market
access changes. Australia is a major player when it comes to                                                                                                                                0

                                                                                                                                                                                                                                                     ia

                                                                                                                                                                                                                                                     A
                                                                                                                                                                                                n

                                                                                                                                                                                                     US

                                                                                                                                                                                                                 a

                                                                                                                                                                                                                da

                                                                                                                                                                                                                an

                                                                                                                                                                                                                                   EU

                                                                                                                                                                                                                                                   ina

                                                                                                                                                                                                                                                   sia

                                                                                                                                                                                                                                                      s
exports, particularly in providing high value product backed by

                                                                                                                                                                                                                                                  ne
                                                                                                                                                                                                               re
                                                                                                                                                                                              pa

                                                                                                                                                                                                                                                 EN
                                                                                                                                                                                                                                                 ys
                                                                                                                                                                                                             iw
                                                                                                                                                                                                             na

                                                                                                                                                                                                                                                ne
                                                                                                                                                                                                                                               Ch
                                                                                                                                                                                                            Ko

                                                                                                                                                                                                                                               pi
                                                                                                                                                                                            Ja

                                                                                                                                                                                                                                              ala

                                                                                                                                                                                                                                              M
                                                                                                                                                                                                           Ta
                                                                                                                                                                                                          Ca

                                                                                                                                                                                                                                           do
integrity and quality assurance systems. For FY2019–20,
                                                                                                                                                                                                                                           ilip

                                                                                                                                                                                                                                          M
                                                                                                                                                                                                                                         In

Australia was the beneficiary of a soft Australian dollar that                                                                                                                                                                          Ph
                                                                                                                                                                                                                           Imported beef market
contributed towards making it the most valuable year for beef                                                                                                      Supplier: Australia                             Argentina    Brazil   Uruguay                 US
exports on record.                                                                                                                                                   Canada    Mexico                               India    NZ    Other
The Australian outlook is for tight supplies in 2021, with beef                                                                                                    Source: IHS, data is for FY2019-20
exports forecast at approximately one million tonnes shipped
weight (swt). Diminished supply will intensify competition for                                                                                                     The US is Australia’s single largest export competitor due to its
market share across export markets. Forecast growth in beef                                                                                                        access to high value markets, large scale and exportable
production from the US will place pressure on Australia’s high                                                                                                     surplus, and ability to supply large volumes of high quality
value export markets, while production growth in Brazil and                                                                                                        chilled product. The US exports significant volumes of beef to
India will lead to further competition for Australian manufacturing                                                                                                Japan and Korea and maintains a minor presence within the
beef and live cattle exports to China, South-East Asia and the                                                                                                     Greater China and South-East Asian markets. Competitive
Middle East and North Africa region. Strategically targeting high                                                                                                  pressure from the US is set to increase due to an expanding
value markets will continue to be a priority for Australia at a time                                                                                               production base and market access improvements. Some of
when domestic supplies are expected to tighten.                                                                                                                    these access improvements include:
While production trends paint part of the picture, market access                                                                                                   • In 2019, the US came to an agreement with the EU to ‘ring-
changes, such as the increasing number of South American                                                                                                             fence’ a portion of the EU High Quality Beef (HQB) grainfed
plants gaining export approval for China, could have a far                                                                                                           quota (shared with Uruguay, Argentina and Australia), which
greater competitive impact on Australian beef in some markets.                                                                                                       provides the US with exclusive access to 18,500 tonnes swt of
                                                                                                                                                                     the quota, which will increase incrementally to 35,000 tonnes
                                                                                                                                                                     swt over a seven-year phase-in period.
                                                                                                                                                                   • At the start of 2020, the US reached an agreement with Japan
                                                                                                                                                                     to bring tariffs on US beef in line with signatories to the
                                                                                                                                                                     Comprehensive and Progressive Trans-Pacific Partnership,
                                                                                                                                                                     but it will operate within its own smaller safeguard.
                                                                                                                                                                   • The US-China Phase One trade agreement also entered into
                                                                                                                                                                     force in January 2020, but little trade is yet to materialise.

                    MLA Global beef industry and trade report                                                                                                                                                                                              February 2021     9
South American suppliers Brazil and Argentina have emerged                                               plants for exports. Almost half of all the beef exported from
as major trade competitors in the past decade. They both have                                            Brazil in 2020 was sent to China, representing a remarkable shift
large production bases to draw exports from, and in recent                                               in focus from last year when China accounted for 24% of
years favourable shifts in exchange rates and the poor                                                   Brazilian beef exports. Currency movements have also had a
performance of their domestic markets have promoted the                                                  profound impact on the affordability of South American exports.
appeal of exporting meat.                                                                                The Brazilian real depreciated from 2018 through 2020, finishing
                                                                                                         2020 near an all-time low of US$0.19, making Brazilian beef
Global top three imported beef markets                                                                   more affordable on the global market.
                                                                                                         South American suppliers may soon benefit from the EU-
                      2,500
                                  Taiwan                                                                 Mercosur trade agreement and the ear-marked 99,000 tonnes
                                 Hong Kong                                                               of access provided to the EU market, however, this agreement is
                      2,000
                                                                                                         yet to be ratified and political appetite may be waning on both
‘000 tonnes swt

                      1,500                                                                              sides to finalise the deal. Additionally, in 2019 Brazil was
                                                                                                         permitted 50,000 tonnes of access into Indonesia, which will
                       1000                                                                              potentially impact Australian cattle and beef shipments if fully
                                    China                                                                realised. However in 2020, only 4,000 tonnes swt was sent.
                       500
                                                                                                         Other exporters, such as New Zealand and Canada, compete in
                            0
                                                                                                         similar markets and segments to Australia, but opportunities to
                                Greater China     US         Japan      South Korea      Russia          expand exports remain limited by supply. New Zealand is
                                                                                                         heavily reliant on trade to the US and China, with smaller trade
Source: IHS, data is for FY2019-20                                                                       volumes flowing into a variety of other destinations. Canada is
                                                                                                         the leading supplier of beef to the US and also supplies sizeable
With South American trade ramping up in recent years, China                                              volumes to Japan. While India is an exporting powerhouse,
has been a key target market for expansion. After the sudden                                             it purely supplies IBM to South-East Asia and the Middle East.
emergence of the ASF-induced pork deficit in China in 2019,
trade flows between these nations advanced rapidly, with
Chinese officials promptly approving dozens of South American

Evolution of China beef imports
                  250

                  200
                                                                                                                   ASF discovered in China,
                                                                                                                         August 2018
                      150
 million tonnes cwe

                      100

                      50

                       0
                             2012               2013          2014               2015             2016           2017            2018         2019         2020

          Brazil                 Argentina       NZ     Uruguay      Australia          US    Other
Source: IHS, China Customs

Beef trade growth over time
                       12

                       10

                                                                                                             Creation of WTO
                       8
 million tonnes cwe

                       6

                       4

                      20

                       0
                              1960
                               1961
                              1962
                              1963
                              1964
                              1965
                              1966
                              1967
                              1968
                              1969
                              1970
                                1971
                              1972
                              1973
                              1974
                              1975
                              1976
                               1977
                              1978
                              1979
                              1980
                               1981
                              1982
                              1983
                              1984
                              1985
                              1986
                              1987
                              1988
                              1989
                              1990
                               1991
                              1992
                              1993
                              1994
                              1995
                              1996
                              1997
                              1998
                              1999
                             2000
                              2001
                             2002
                             2003
                             2004
                             2005
                             2006
                             2007
                             2008
                             2009
                              2010
                               2011
                              2012
                              2013
                              2014
                              2015
                              2016
                              2017
                              2018
                              2019
                             2020

          Brazil                 Australia      India   US      Other
Source: USDA

                            MLA Global beef industry and trade report                                                                                  February 2021   10
The influence of African Swine Fever                                  Chinese beef consumption

ASF has quickly spread throughout Asia’s largely informal and                                     ASF discovered in China, August 2018

                                                                                                                                                  Imported beef % of beef consumption
fragmented pork industry. The disease is transmittable when                                 10                                              30
pigs come into direct contact with infected animals, indirect                                                                               25
                                                                                             8
contact with contaminated objects or are fed contaminated pork

                                                                       million tonnes cwe
products. The disease has a near 100% mortality rate and once                                                                               20
                                                                                             6
it makes its way into a pig herd, culling the pig population within                                                                         15
the immediate area is currently the best method of defence. The                              4
transmission of the disease has been accelerated by wild pig                                                                                10
populations carrying the disease across country borders.                                     2                                              5
Vietnam, Cambodia, Laos, Myanmar, Mongolia, Indonesia, East
                                                                                            0                                               0
Timor, Korea and the Philippines have all reported cases of ASF

                                                                                                 2000
                                                                                                  2001
                                                                                                 2002
                                                                                                 2003
                                                                                                 2004
                                                                                                 2005
                                                                                                 2006
                                                                                                  2007
                                                                                                 2008
                                                                                                 2009
                                                                                                  2010
                                                                                                   2011
                                                                                                  2012
                                                                                                  2013
                                                                                                  2014
                                                                                                  2015
                                                                                                  2016
                                                                                                   2017
                                                                                                  2018
                                                                                                  2019
                                                                                                 2020f
                                                                                                  2021f
since the onset of the outbreak in China in 2018.
                                                                              Domestic production (LHS)   Import volume (LHS)
Distribution of ASF                                                           Import percentage (RHS)
                                                                      Source: USDA

                                                                      Chinese pork consumption
                                                                                                  ASF discovered in China, August 2018

                                                                                                                                                  Imported pork % of pork consumption
                                                                                            60                                              12

                                                                                            50                                              10

                                                                       million tonnes cwe
                                                                                            40                                              8

                                                                                            30                                              6

   Current unresolved disease event                                                         20                                              4
Source: World Organisation for Animal Health
                                                                                            10                                              2

ASF continues to have a large influence on global markets, with                             0                                               0
world pork production in 2020 estimated to be down 18% on
                                                                                                 2000
                                                                                                  2001
                                                                                                 2002
                                                                                                 2003
                                                                                                 2004
                                                                                                 2005
                                                                                                 2006
                                                                                                  2007
                                                                                                 2008
                                                                                                 2009
                                                                                                  2010
                                                                                                   2011
                                                                                                  2012
                                                                                                  2013
                                                                                                  2014
                                                                                                  2015
                                                                                                  2016
                                                                                                   2017
                                                                                                  2018
                                                                                                  2019
                                                                                                 2020f
                                                                                                  2021f
2018 levels (prior to the spread through Asia). While pork
exports from the US, Canada and Brazil lifted substantially in                Domestic production (LHS)   Pork imports (LHS)
response to the supply shortage, this wasn’t enough to cover                  Import percentage (RHS)
the deficit. In China, price inflation across meat categories         Source: USDA

occurred as demand hugely outstripped available supply.
However, prices have eased in the latter part of 2020 as pork         Australia’s market access
production begins to recover. In November, the China retail pork
price was up by 141% year-on-year, while chicken, beef and            Trade is central to the ongoing viability of the Australian beef
sheepmeat were up 28%, 24% and 22%, respectively. While               industry, and pursuing unrestrained entry to global customers
ASF-affected countries have sought to prevent further                 remains critical. Australia’s access to export markets has
outbreaks by utilising biosecurity measures to contain the virus,     generally improved over the past three decades, led initially by
its highly infectious nature makes all containment challenging.       multilateral negotiations through the World Trade Organization,
                                                                      and more recently through a series of bilateral and regional free
In 2020, Chinese pork production was estimated to be down
                                                                      trade agreements. Reductions in non-tariff barriers have also
30% on 2017 levels, with the breeding herd down approximately
                                                                      been advantageous, however, many remain and have a
50% for the same period. Based on these figures, the Chinese
                                                                      noticeable impact on the cost of doing business.
pork contraction has equated to approximately 17 million metric
tonnes. There has not been sufficient meat traded globally, let       Australia has some of the best beef access globally due to trade
alone out of Australia, to fully cover the immediate deficits in      reform initiatives and Australia’s reputation as a safe and reliable
China, hence the rapid surge in demand. The bulk of major beef        supplier, underpinned by a suite of industry integrity and animal
exporters all recorded unprecedented beef trade with China in         health status systems. Australia now has free trade agreements
2020, while Australia was hampered by supply constraints.             with most major beef import markets including the US, Japan,
                                                                      Korea, China and Indonesia, which represented 84% of
In response to the production deficit in China, pork export
                                                                      Australian beef and veal export value in 2019–20. The EU and
volumes from Spain, the US, Germany, Canada and Brazil all
                                                                      Russia remain exceptions.
lifted sharply upwards to respond to the spike in demand.
However, Germany, accounting for 17% of China’s imported pork         The Comprehensive and Progressive Trans-Pacific Partnership
in 2019, has since reported outbreaks of ASF. China                   (CPTPP) has been ratified, providing improved access to Japan,
subsequently paused all trade with Germany. This contraction in       Canada and Mexico. The Regional Comprehensive Economic
pork supply may provide further support for demand of other           Partnership (RCEP) – a multilateral agreement between ASEAN
proteins, such as beef.                                               nations and China, India, Australia, New Zealand and Korea –
                                                                      came into force in November 2020. Additionally, new trade
In 2021, pork production in China is expected to grow for the
                                                                      agreements with Indonesia, Hong Kong and Peru will facilitate
first time since 2017, and as the Chinese swine herd recovers,
                                                                      trade and foster new opportunities.
this will likely curb the expansion phase of Chinese beef
imports. Regardless, beef import volumes should remain at             Australian trade negotiations with the EU commenced in June
historical highs, given that Chinese pork production still remains    2018, while negotiations with the UK began more recently in
well back on the typical pre-2020 volumes.                            June 2020. While existing EU quotas will be split between the
                                                                      EU and UK as a result of Brexit, these negotiations represent the
                                                                      first opportunity in over 40 years to significantly reshape
                                                                      Australia’s red meat market access and provide opportunities to
                                                                      modernise the existing trade regime.

          MLA Global beef industry and trade report                                                                              February 2021               11
Recent political shifts have resulted in trade liberalisation        Major live export trade flows also exist across North America,
becoming increasingly challenging. The increase in                   primarily comprised of feeder cattle from Mexico and Canada
protectionism, led by the US’s approach to trade, does pose          destined for US feedlots, as well as finished cattle from Canada
some risk, but Australian beef exports have largely avoided any      and the US crossing the border to be killed in either country.
blowback from the US-China trade war. However, trade tensions        While Mexico has traditionally exported over one million cattle a
between Australia and China rose through 2020, which has             year to the US, the synergies and sea freight infrastructure are
resulted in China restricting imports of certain Australian          not in place to ship large quantities to South-East Asia.
agricultural products, including beef from certain plants.           Brazil, another major exporter of cattle, previously focused
Australia’s favourable access to global markets is underpinned       shipments within South America, however, its attention has
by strong animal health credentials, world-leading animal            since shifted to the Middle East, particularly Turkey. While
traceability and food safety systems and the fact it has never       Brazil’s FMD status is a barrier for exporting cattle to Indonesia,
had a case of foot-and-mouth disease (FMD) or bovine                 FMD is already an endemic disease in Vietnam (Australia’s
spongiform encephalopathy (BSE). While Australia’s track record      second largest market) and Brazil is expected to be granted
has sheltered the industry from competition, sanitary and            access in the near future, following sanitary agreements
phytosanitary measures imposed on other exporters due to             between the two countries in 2019. The EU also ships
various diseases continue to be wound back, and Australia is         considerable volumes of cattle to markets across the Middle
being increasingly exposed to a widening line-up of competitors      East, but no trade exists to South-East Asia.
across markets.

Live exports                                                         Value of exports for major live cattle suppliers

Australia is a leading long-haul exporter of live cattle globally,                  1,500
                                                                                              Trade to
with trade links to supply chains in South-East Asia and the                                SEA & MENA
                                                                                    1,200
Middle East. Trade dynamics allow Australia to be the leading,                                                     Trade within                     Trade to
                                                                                                                  North America                      MENA
if not sole, supplier of cattle to many countries, however, the

                                                                     US$ millions
                                                                                     900
high cost of Australian cattle presents a significant challenge in
price-sensitive markets.                                                             600
Indonesia is the leading destination for Australian feeder cattle.
                                                                                     300
Broadacre pastoral production in northern Australia is very
suited to raising calves but less so to finishing cattle, while
                                                                                       0
efficient Indonesian feedlots can utilise by-products from palm                              Australia   Canada       US          Mexico    EU-28    Brazil
oil and other crops as low-cost feed options. A lack of cold chain
                                                                     Source: UN Comtrade, 2019-20 exports
infrastructure and the dominance of wet markets also supports
the customer preference for freshly slaughtered cattle.
Australian exports to Vietnam are based on similar
fundamentals, however, the trade is predominantly made up of
slaughter cattle, underpinned by constrained feedlot capacity
and the market’s preference. Vietnam’s feedlot industry is an
exception to this, with expected development in the
coming years.

      MLA Global beef industry and trade report                                                                                           February 2021      12
SUMMARY TABLE

                                                                                                                                      Argentina
                                           Australia

                                                                                                                                                      Uruguay
                                                                                                        Canada
                                                                                         Mexico

                                                                                                                                                                                                   EU-27
                                                                                                                                                                                    China
                                                                                                                       Brazil

                                                                                                                                                                     India
                                                          NZ

                                                                         US
   Cattle head (million                   24.6           10.2           94.4            16.9           11.2          244.1           54.5            11.5          303.1           91.4            77.1
          head)*

  Dairy % of cow herd**                    8%            82%            23%             31%            22%            43%             8%              7%           100%            20%            65%

      Cattle and calf
     slaughter (million                    7.4            4.4           33.3            6.4             3.5           39.9            14.1             2            34.8           48.5           24.0
          head)*

 Cattle exports (million
                                            1.1          0.12           0.29             1.5           0.64           0.29               -           0.12             -            0.02           0.96
         head)*

     Beef and veal
                                         2,072            675          12,374         2,090           1,310          10,100          3,180           510          3,650           6,780          6,880
 production ('000 cwt)*

      Total domestic
    consumption ('000                     567              79          12,610          1,870          1,048          7,600          2,385            160          2,600           9,515          6,570
       tonnes cwt)*

    Domestic share of
                                          27%            10%            89%             83%            62%            75%            75%            22%             71%           100%            95%
      production

   Per capita domestic
    consumption (kg/                      22.0            16.7          38.0            13.0           25.5           35.4           53.5           56.3             0.8            6.1           14.9
     person cwe)***

    Beef exports ('000
                                          1,214          460             931            255            363           1,658           602             295            914               -           454
      tonnes swt)†

     Chilled % share of
                                          25%             7%            45%             87%            81%             11%            14%            10%             1%               -           60%
          exports†

  Average export price
                                          5.86           5.26           7.06            5.71           5.85           4.45            5.19          5.56           2.85               -           4.82
       ($US/kg)††

                                                                                                                                                                                                  UK,
                                                                      Japan,           US,                                                        China,
                                        China,          China,                                        US,           China,          China,                Vietnam,                              B&H†††,
     Top three export                                                 South           South                                                         US,
                                        Japan,           US,                                         Japan,          HK,            Chile,                Malaysia,                   -          Switz-
        markets†                                                      Korea,          Korea,                                                       Neth-
                                          US            Japan                                          HK           Egypt           Israel                 Egypt                                erland
                                                                      Mexico          Japan                                                       erlands

Source: *USDA, MLA (Aust.) 2020 estimate; **USDA 2020 estimate; *** MLA (Aust.), FAO-OECD 2020 estimate converted to carcase weight equivalent, USDA 2020 estimate; †IHS, DAWE (Aust.) 2019-20 actual,
††IHS 2019-20 actual. †††Bosnia & Herzegovina

          MLA Global beef industry and trade report                                                                                                                              February 2021            13
You can also read