Well positioned for ongoing value creation - H2 and full year 2020 results & strategic update - New to Vault?
←
→
Page content transcription
If your browser does not render page correctly, please read the page content below
Well positioned for
ongoing value creation

     H2 and full year 2020 results
             & strategic update

                      18 February 2021
Disclaimer

The information in this announcement may contain forward-looking statements within the meaning of the “safe harbour” provisions of the United States Private Securities Litigation
Reform Act of 1995. These forward-looking statements, including, among others, those relating to Sibanye Stillwater Limited’s (“Sibanye-Stillwater” or the “Group”) financial
positions, business strategies, plans and objectives of management for future operations, are necessarily estimates reflecting the best judgment of the senior management and
directors of Sibanye-Stillwater.
All statements other than statements of historical facts included in this announcement may be forward-looking statements. Forward-looking statements also often use words such
as “will”, “forecast”, “potential”, “estimate”, “expect” and words of similar meaning. By their nature, forward-looking statements involve risk and uncertainty because they relate to
future events and circumstances and should be considered in light of various important factors, including those set forth in this disclaimer. Readers are cautioned not to place
undue reliance on such statements.
The important factors that could cause Sibanye-Stillwater’s actual results, performance or achievements to differ materially from those in the forward-looking statements include,
among others, our future business prospects; financial positions; debt position and our ability to reduce debt leverage; business, political and social conditions in the United States,
South Africa, Zimbabwe and elsewhere; plans and objectives of management for future operations; our ability to obtain the benefits of any streaming arrangements or pipeline
financing; our ability to service our bond instruments; changes in assumptions underlying Sibanye-Stillwater’s estimation of their current mineral reserves and resources; the ability to
achieve anticipated efficiencies and other cost savings in connection with past, ongoing and future acquisitions, as well as at existing operations; our ability to achieve steady
state production at the Blitz project; the success of Sibanye-Stillwater’s business strategy; exploration and development activities; the ability of Sibanye-Stillwater to comply with
requirements that they operate in a sustainable manner; changes in the market price of gold, PGMs and/or uranium; the occurrence of hazards associated with underground and
surface gold, PGMs and uranium mining; the occurrence of labour disruptions and industrial action; the availability, terms and deployment of capital or credit; changes in relevant
government regulations, particularly environmental, tax, health and safety regulations and new legislation affecting water, mining, mineral rights and business ownership, including
any interpretations thereof which may be subject to dispute; the outcome and consequence of any potential or pending litigation or regulatory proceedings or other
environmental, health and safety issues; power disruptions, constraints and cost increases; supply chain shortages and increases in the price of production inputs; fluctuations in
exchange rates, currency devaluations, inflation and other macro-economic monetary policies; the occurrence of temporary stoppages of mines for safety incidents and
unplanned maintenance; the ability to hire and retain senior management or sufficient technically skilled employees, as well as their ability to achieve sufficient representation of
historically disadvantaged South Africans in management positions; failure of information technology and communications systems; the adequacy of insurance coverage;
any social unrest, sickness or natural or man-made disaster at informal settlements in the vicinity of some of Sibanye-Stillwater’s operations; and the impact of HIV, tuberculosis
and the spread of other contagious diseases, such as coronavirus (“COVID-19”). Further details of potential risks and uncertainties affecting Sibanye-Stillwater are described in
Sibanye-Stillwater’s filings with the Johannesburg Stock Exchange and the United States Securities and Exchange Commission, including the Integrated Annual Report and the
Annual Report on Form 20-F.
These forward-looking statements speak only as of the date of the content. Sibanye-Stillwater expressly disclaims any obligation or undertaking to update or revise any forward-
looking statement (except to the extent legally required).

                                                                                                                                                                                       2
Key strategic highlights

         ESG excellence & beneficiary          • Making a difference, one PGM ounce at a time with significant social, economic and
         of the Hydrogen economy                 environmental impact and exposure to the Hydrogen economy

                                               • Organisational structure transition to include Holacracy, Stratified Systems Theory and global
         Inclusive, values-based culture         competence

                                               • Excellent operational performance despite COVID-19 disruptions – proven ability to rapidly assess
         Stellar operational delivery            and respond to challenges

         Record financial performance          • Record adjusted Free cash flow (FCF) of R20bn (US$1.2bn)

         Return to industry leading dividend   • Total dividends declared for 2020 of R10.7bn (US$729m)*

                                               • 40% increase in SA PGM reserves with significant extension of mine lives and ensuring sustainable
         Investing in sustainable value          value for all stakeholders

                                               • Poised for growth following detailed two year study which confirms positive fundamentals and has
         Tech metal strategy advanced            identified targets

         From deleveraging to strategic
                                               • Deleveraging achieved with a net cash position of R3.1 billion (US$210 million) at year end
         capital allocation
*   Converted using R/US$14.69                                                                                                                       3
ESG excellence
     - the way
 we do business
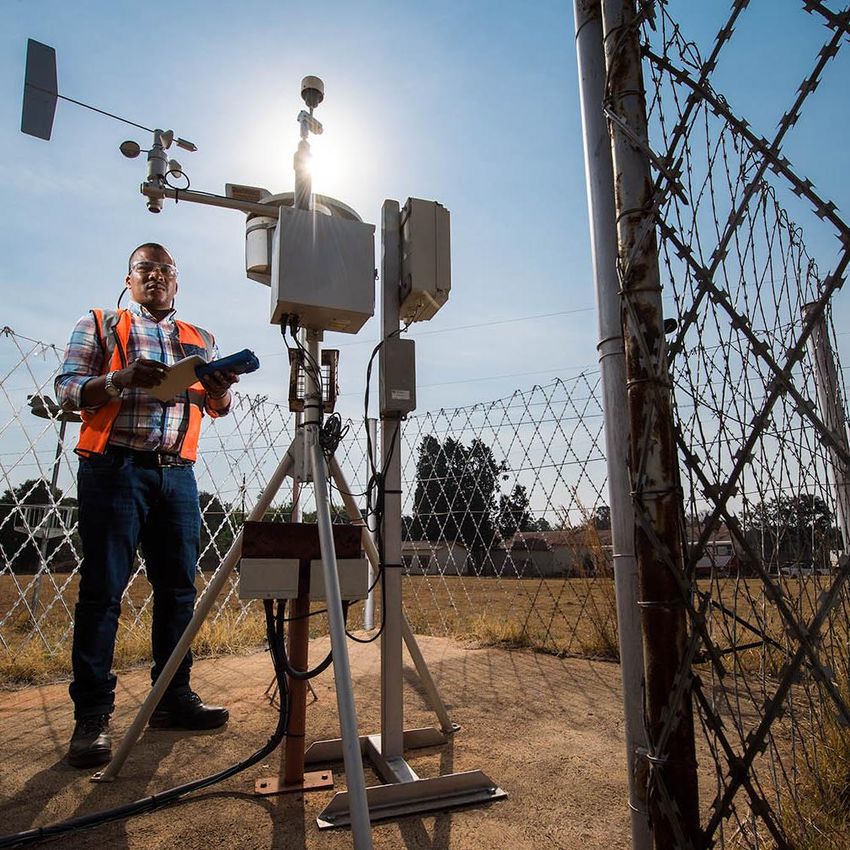
Living and working with COVID-19

 • COVID-19 protocols rapidly developed and implemented at all operations
 • Most vulnerable employees identified and managed to reduce risk
 • SA mining industry COVID-19 death rate is a third of the national rate
 • Montana’s severe first wave impacted labour availability at the US PGM operations in Q4 2020

Source: https://91-divoc.com/pages/covid-visualization/ and Minerals Council of SA                5
Making a real difference for stakeholders

    Established 2,196              Support to local                        Contributions                  • Significant COVID-19 support to stakeholders continues
    bed quarantine                 small businesses                    to the SA relief funds             • Willing to contribute R200m towards roll out of vaccines
      and isolation
                                                                                                            under specific conditions
          units*                      (R14.5 million)                       (R23.1 million)
                                                                                                          • Capacity to assist with vaccine distribution
     Provided PPE,                                                                                             - 44 Health sites to administer vaccines
                             Social relief food parcels,                 Financial support
     oxygen tanks,
                               water tanks, blankets                      for non-working                      - Capacity to vaccinate >18,000 people per day
      sanitisation,
                                  and mattresses                            employees                          - Vaccinate employees and extend to dependents
        tracking
                                       (R5.5 million)                        (R1.5 billion)
      and tracing                                                                                                 and doorstep communities ~ 256,000 people
     (R57.7 million)
                                                                                                          • Significant impact through social investment in
                               Schools and education                   Employee donations
                                                                                                               - R6.8 bn capital investment in growth projects approved
                                  sanitisation and                        matched by
                               catch-up programmes                       the company                           - Social and labour plans, CSI and other ESG initiatives
                                       (R3.0 million)                     (up to R2.0 million)                 - Supplier and SMME support and development
                                                                                                          • SARS tax receipts for 2020 R300bn versus R200bn budget
                                    COVID-19                            Counselling and                     for 2020
                                 communication                       psychological support                     - Sibanye-Stillwater royalties and taxes of R7.1bn for 2020 vs
                             Education and awareness                extended to employees
                                                                                                                 R2.3bn in 2019 (+213%)
                                       (R4.0 million)                    and families

*    Mine accommodation and hospital have been converted into isolation and quarantine facilities in line with COVID-19 guidelines                                              6
Marikana renewal and restitution – a new, better future

• Marikana operations – economic viability restored and long term future secured
• An opportunity to build a new legacy together with stakeholders
• Fostering healing and closure by
   -   providing ongoing counselling and emotional support for the affected employees, the widows and their families
   -   seven houses delivered to widows - balance of nine houses will be completed and handed over in 2021
   -   pursuing justice and restitution for those affected
   -   ensuring educational support for the 141 beneficiaries of the 1608 Trust
   -   honouring Lonmin’s outstanding legacy SLP obligations while delivering on the SLP III commitments

Structured strategy to achieve renewal and restitution:
                           Marikana renewal programme – towards 2022                                                       District Development Model
                                      LETSEMA ENGAGEMENT PROCESS                                                      STAKEHOLDER COLLABORATIVE PROCESS

                             Bapo Ba Mogale                                                                                                    Cross sector
  Widows restoration                                   Social restoration           Koppie project             Economic restoration
                                 justice                                                                                                      collaboration

• Houses                  • Forensic Audits        • Social infrastructure     • Healing and reconciliation   • Agriculture              • District Development
• Justice for 10 widows   • Capacity Building      • Gender Equality Project   • Koppie Memorial              • Industrialization          Model projects
• Education enhancement                            • Health (Covid -19)                                       • Footprint reduction      • Courageous
                                                   • Green Project                                            • Enterprise Development     Conversations project

                                                                                                                                                                   7
Leading producer and recycler of green metals

                                                       Future hydrogen economy

PGMs transform             Technologies
noxious exhaust gasses -   • Green hydrogen made in electrolysers via renewable energy (solar, wind) - key to decarbonizing heavy industry & everyday
hydrocarbons (HC),           activities
nitrogen oxide (NOx) and   • PGM-based PEM (proton exchange membrane) technology well-suited to using intermittent renewable energy feed
carbon monoxide (CO) –     • Hydrogen fuel cells – efficient & environmentally friendly alternative for delivering power
into more benign
components
                           Metals
(water (H2O),              • Platinum – effective catalyst for PEM electrolysers and fuel cells
carbon dioxide (CO2)       • Iridium – key to hydrogen economy, in PEM electrolysers with platinum to produce hydrogen
and nitrogen gas (N2))     • Ruthenium - effective in PEM fuel cells with platinum, scalable from small devices to heavy duty transport

                                                                                                                                                 8
Columbus recycling business

 • One of the largest global recyclers of spent auto catalysts which
   recycled 840koz of 3E (palladium, platinum and rhodium) in 2020
 • Environmentally friendly production of PGMs
    - Recycling emits 6x less tons of CO2
    - Uses 63x less water
    - Generates 90x less rock waste than the mining operations
 • PGM recycling business has “green” credentials providing access to
   lower yield funding and tax exempt bonds

Recycling enables green output of critical platinum group metals
                                                                        9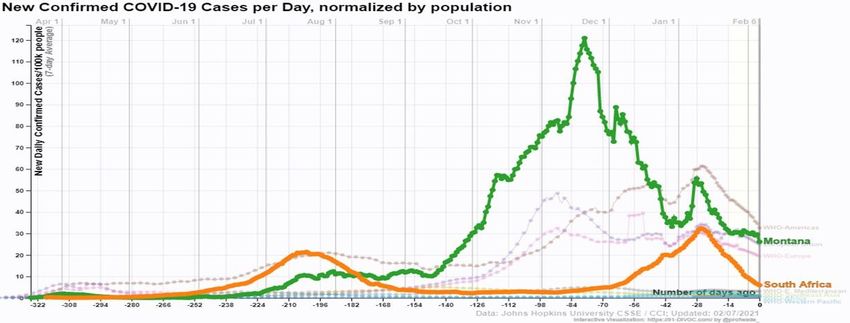
Targeting carbon neutrality by 2040

                                        In support of the Paris Agreement and the United Nations            Our goal is underpinned by our Energy and Decarbonisation
                                        Sustainable Development Goals, we have set a goal to achieve        strategy and implementation plan:
                                   8    net-zero emissions by 2040
                                                                                                            • Advocating for future decarbonisation of electricity supply
Scope 1 and 2 emissions forecast

                                   7                                                                          in SA through
                                                                         88% our operational                     - Energy Intensive Users Group, BUSA electricity policy task team,
        (million tCO2e)

                                   6                                     emissions stem from                       and other sectoral forums
                                                                          electricity/power
                                                                                                            • Decarbonisation targets built into the LTI framework
                                   5
                                                                                                            • Continuous energy efficiency improvement strategy
                                   4                                                                             - Targeted 2-3% YoY improvements minimum
                                                                                                                 - 165,260t CO2e of emissions avoided in 2020
                                   3
                                                                                                            • Increasing renewables in energy mix
                                   2                                                                             - 50MW solar PV plant in development
                                                                                                                 - 200MW of additional solar PV, storage and wind projects under
                                   1                                                                               investigation
                                                                                                                 - 20% renewable penetration by 2030
                                   0
                                       2020             2025          2030               2035    2040
                                          Emissions forecast range*   Net-zero emissions 2040

A full update on our decarbonisation strategy** will be provided in the latter part of 2021

* Scope 1 and 2 emissions based on current assets and LOM. Baselines will be adjusted for any material acquisitions and divestments. Carbon offsets maybe used to offset hard-to-abate emissions
** Including Scope 3 mitigation initiatives                                                                                                                                                        10
Enhancing our established ESG credentials
• Admitted as ICMM member in Feb 2020 • LPPM certifies Sibanye-Stillwater’s responsible platinum
- rigorous evaluation process and palladium sourcing
• Sibanye-Stillwater subscribes to Global industry standard • Member of the World Gold Council and subscribe
on tailings management (GISTM) to the Responsible gold mining principles (RGMP)
• Participant of the United Nations Global Compact
• CDP carbon and climate change disclosure
(UNGC)
- ‘A-’ rating – Amongst top 11% of category & achieved
‘Leadership’ level for six continues years • In 2020, the Good Neighbor Agreement at the US PGM
operations marked 20 years of environmental and
community collaboration
• Inclusion in the Bloomberg 2021 Gender-Equality Index
(GEI)
- one of 380 companies globally and one of only seven
South African companies over 11 sectors
• Re-included in the FTSE Russell ESG index of the JSE
• Annual Rand Water awards
- recognised as most ‘Collaborative’ and ‘water saving’
company in the South African mining industry
Embracing the journey to operate responsibly in the way we do business
11Building a
values-based
cultureCommitted to gender equality
• Group CEO championing “Woman in Mining” at Minerals Council
• Sibanye-Stillwater gender equality journey
› Targeting 30% females in the workforce by 2025 and increased
representation and development of women at all levels
• Progressing with intent
› 30% SA female bursars in 2020
› 30% of SA promotions approved in 2020 were women
› 31% of new recruits in 2020 in SA were female
› 31% of directors currently female
• Worked with Women in Mining US to create first corporate membership
& established a WIM chapter for the US PGM operations
Journey towards gender equality, where high performance, opportunities and contribution are valued without any bias
13Values based culture growth accelerated through the COVID-19
Used COVID-19 opportunity
to accelerate organisational change
• SOHO (small office home office)
- Remote working where possible
- Health, safety and productivity benefits
- Lifestyle benefits
- Access to global labour pool
• Expanded inclusivity through virtual connect
sessions
• Virtual training and development are
accessible and efficient
• Enhanced engagement and alignment
across Group
New agile work arrangements to proactively manage future challenges
14New leadership architecture for further strategic delivery
• Strategic leadership configured in line
Board of Directors
Governance with stratified systems theory
and oversight • Embracing holacracy
CEO CFO
+ - autonomy, agility and purpose
Strategic
CCO Advisory CHRO alignment
Strategic Office
- evolving, learning and leading C-suite
leadership
CTO
Internal Legal CSRO organisation Networked
Counsel leadership
- geared to respond to volatility
and uncertainties
COO
- role clarity aligned to business
Translate requirements
EVP
strategy EVP EVP EVP • COO to drive strategic implementation
Battery
into SA Gold SA PGM US PGM
Metals in the operating segments
operations
• Scalable for different jurisdictions and Operations
commodities Empowered
leadership
Evolution from a management structure to a leadership system
Legend: CTO Chief Technical Officer, CCO Chief Commercial Officer, CHRO Chief Human Resources Officer, CSRO Chief Social Responsibility Officer 15Focusing on safe production and operational excellence
Safe production: adapting to COVID-19

 • Group safety performance impacted by COVID-19                               Journey towards zero harm
      - Lockdowns and safe production build-up in SA, complex and disruptive
                                                                               • Enabling environment
 • Safe production milestones
                                                                                  -   Real risk reduction initiatives ongoing
      -   16 million(m) FFS SA PGM processing facilities (8 Dec)
                                                                                  -   Infrastructure improvement
      -   13m FFS SA gold (4 Aug)
                                                                                  -   Rock mass management
      -   5m FFS SA PGM operations (15 Nov)
                                                                                  -   Engineering safety
      -   3m FFS US PGM operations (11Feb) fatal free since Oct 2011
                                                                               • Empowered people
 • Regrettably nine colleagues lost their lives in 2020
                                                                                  -   Safe culture and behavioural focus
                                                                                  -   Values based decision making
                                                                                  -   S23 withdrawals
                                                                                  -   Appropriate Incentive systems
                                                                               • Enabling systems
                                                                                  - Risk management process
                                                                                  - Operationalisation of learnings from high potential incident
                                                                                    and fatal reviews
                                                                                  - Best practice and formal certification

Disclaimer: Photo utilised was taken pre-COVID-19                                                                                           17
Targeting world class safety performance
Total Injury Frequency rate (TIFR) - 5 year improvement trajectory • Responsible for the wellbeing of more than 80,000
employees
TIFR Rate per million hours
Blue 2019 Source ICMM (2020 data not available as at 2/21) • Do not accept our operating environment (deep
Green 2020 Source Sibanye-Stillwater (SSW)
5 Year trajectory underground and labour intensive) as an inhibitor for
world class safety performance
• Reducing risk by closing operations will have significant
MMG
Codelco
Glencore
Hydro
Gold corp
Average
ORANO
BHP
Lonmin
Rio Tinto
Teck
Minera San Cristobal
Polyus
Freeport McMoRan
SSW Gold ops
Gold Fields
Sumitomo
Minsur
Newmont
Barrick
Newcrest
Vale
South32
Mitsubishi Materials
ARM
Anglo American
JX Nippon
Antofagasta Minerals
AngloGold Ashanti
unintended consequences on stakeholder livelihoods
SS US PGM Ops
SSW SA PGM
• Divesting assets for safety reasons does not solve the
safety related risks
• To realize our purpose of Improving Lives Sibanye-
Understanding the agencies to realise change Stillwater will ensure that our operations are comparable
to international peers
• Our safe production strategy specifically addresses
behaviour related issues and real risk reduction
Struck by
Caught Against
Truck & Tram
FOG
Struck against
Protruding Object
Slip & Fall
Caught Between
Sprain / Overexerted
Foreign Body
Transportation
Cut / Punctured By
Material Handling
Winches & Rigging
Sibanye-Stillwater has a workforce of about 80,000 people of which 33,500
employees are associated with deep(2,250-3,500m underground) to ultra deep
Q1 Q2 Q3 Q4 (>3,500m underground) level mining.
18Growing the reserve base*
Mineral Reserves Mineral Resources
• 40% increase in SA PGM 5.1
Mineral Reserves 2.8 2020: 2020:
8.4 54.3
86.0
• 7% increase in US PGM 82.0moz 3.8 477.9moz
19.7
Mineral Resources and 2.3 4.3
47.7
8.7 86.8
stable Reserves 46.5
28.2 2019: 4.5 2019:
year on year 39.5
70.6 493.0
81.1 86.9
moz moz
• Stable SA gold Mineral 9.7
26.9 218.0
Reserves
26.9 8.3
217.6
-
DRDGOLD SA gold operations Gold projects
US PGM operations Americas projects (PGM&Au) SA PGM operations
SA PGM projects
Long life assets – extensive, high quality, resources offer significant organic growth potential
Source: Company information
* Mineral Reserves and Mineral Resources are declared as at 31 December 2020, based on three year trailing price averages and currently a significant discount to spot prices 19Long-life assets
SA GOLD OPERATIONS SA PGM OPERATIONS US PGM OPERATIONS
Current life of mine (LOM) Current LOM Current LOM
(at 31 Dec 2020) (at 31 Dec 2020) (at 31 Dec 2020)
• Beatrix 5 years • Kroondal 12 years • Stillwater West 25 years
• Driefontein 10 years • Mimosa 12 years • Stillwater East (Blitz) 25 years
• Kloof 13 years • Marikana (excl K4) 16 years • East Boulder 39 years
• Burnstone 20 years • Rustenburg 32 years
• Surface sources 2-3 years • K4 project 51 years
• DRDGOLD Limited (50.1% interest) • Surface sources - Rustenburg 7 years
+20 years - Marikana 5 years
20Larger, diversified production base underpins record earnings & cash flow
Profitability (adjusted EBITDA 1) and gearing • Record financial performance
- Accrued the benefits of an enlarged
2,500 3
2.6 SA PGM production base
Net debt: adjusted EBITDA ratio
US$ million
2.4 2.5 2.4
2.3
2,000 - Increased gold production to
21% 2
1.3 normalised level
1,500
- Consistent US PGM production
1,000
0.6
60% 1 despite Covid-19 impact
0.55
0.4
- Higher precious metals prices
500
99% 19%
0 • Record R19.9bn (US$1.2bn) adjusted FCF
0
(0.06x) • Adjusted EBITDA of R49 billion (US$3bn)
net cash
(500) (1) (+230%)
H1 H2 H1 H2 H1 H2* H1* H2 H1 H2
2016 2017 2018 2019 2020 • Deleveraging achieved – net cash
position
SA gold SA PGM US PGM Net debt (cash): adjusted EBITDA (rhs)
From single commodity to multicommodity with 86% of current earnings being generated from recent acquisitions
Source: Company results information
1. The Group reports adjusted earnings before interest, taxes, depreciation and amortisation (EBITDA) based on the formula included in the facility agreements for compliance with the debt covenant formula.
For a reconciliation of profit/loss before royalties and tax to adjusted EBITDA, see note 8.1 of the condensed consolidated interim financial statements in the H1 2020 results booklet
• H2 2018 and H1 2019 at the SA gold operations have been impacted by the five month gold strike from Nov 2018 to April 2019 with subsequent gradual build up to new normalised levels 21SA PGM operations – contributing 60% of Group adjusted EBITDA
SA PGM operations – Underground and surface production and AISC • H2 2020 production 40% higher than
H1 2020
1,200 50,000
R/4E oz
4E PGM koz
• Normalised production rate
40,000 achieved in Nov 2020
900
• Successful integration of Marikana
30,000
- annual synergies of ~R1.83bn –
600
2.5x the initial R730m estimate
20,000
• Adjusted FCF of R11.7bn (US$714m) -
300
10,000
2019: R2.7bn/US$186
• 60% adjusted EBITDA margin for H2
0 0 2020
H1 2018 H2 2018 H1 2019 H2 2019 H1 2020 H2 2020
Underground (UG) production (4E) Surface production (4E)
R/4E oz average basket price (rhs) All-in sustaining cost (rhs)
Consistent operational performance ensuring leverage to higher rand 4E PGM basket price
Source: Company results information
1. The Group reports adjusted earnings before interest, taxes, depreciation and amortisation (EBITDA) based on the formula included in the facility agreements for compliance with the debt covenant formula.
For a reconciliation of profit/loss before royalties and tax to adjusted EBITDA, see note 8.1 of the condensed consolidated interim financial statements in the H2 2020 results booklet.
Adjusted EBITDA margin is calculated by dividing adjusted EBITDA by revenue 22SA PGM basket revenue drivers per metal
Illustrative revenue distribution of market prices based on the SA PGM H2 2020 metal prill split
Revenue % Metals
contribution Prill split
100%
8% 8%
6% 10% 15% 18% 19%
• Rhodium a significant
27%
80% 39%
revenue driver
46%
51% 51%
• Iridium (1% of production)
56% 49% 45% 36%
60% 40%
32% and ruthenium (5% of
24% production) collectively
2% 21%
40%
2%
2% 2% 2% 2% 2%
1%
2% contribute about 1.1% of
1%
18%
21%
24% 23% 25% 30% 29% 25% revenue
20% 29% 25%
17% 19% 14% 16% 15% 15%
13% 11% 7% 7%
0%
H2 2016* H1 2017* H2 2017* H1 2018* H2 2018* H1 2019* H2 2019* H1 2020* H2 2020 H2 2020
Revenue % Metal prill
per metal split
Other Metals Palladium Gold Platinum Rhodium
Optimal mix of metals with platinum expected to generate more revenue going forward
* Data represented from periods prior to H2 2020 have been calculated using average market prices per metals in that period based on the H2 2020 prill split for illustrative periods
to demonstrate the trend, and does therefore not represent the actual prill split of the Group for those periods 23Cash Cost (R/oz)
2,000
4,000
6,000
8,000
10,000
12,000
14,000
16,000
18,000
20,000
-
0
Sylvania Dumps (SLP)
Stillwater (SWC)
Platinum Mile (SGL)
Source: Nedbank
Two Rivers (ARM/IMP)
Boulder (SWC)
Mogalakwena (AMS)
Zimplats (IMP)
Mototolo (GLEN/AMS)
BRPM (RBP)
Booysendal (NHM)
Kroondal (SGL/AMS)
Bokoni (ATL)
Marula (IMP)
Modikwa (ARM/AMS)
Amandelbult (AMS)
Marikana (LMI)
Cumulative Annual Production (Koz.)
2016 - Cash cost
Mimosa (IMP/SGL)
Pandora (LMI/AMS)
Global PGM Cash Cost Curve (CY16 - At Spot)
Impala Mine (IMP)
Unki (AMS)
Zondereinde (NHM)
Union (AMS)
Rustenburg (SGL)
500 1000 1500 2000 2500 3000 3500 4000 4500 5000 5500 6000 6500 7000 7500 8000 8500
Maseve (PTM)
0
2,500
7,500
5,000
10,000
12,500
15,000
17,500
20,000
Cash Cost (R/oz)
10,000
15,000
20,000
25,000
30,000
5,000
-
0
Mogalakwena (AMS)
SA PGM operations moving down the cost curve
Zimplats (IMP)
Mimosa (IMP/SSW)
Unki (AMS)
Kroondal (SSW/AMS)
Sylvania Dumps (SLP)
Two Rivers (ARM/IMP)
Booysendal (NHM)
Mototolo (AMS)
Marula (IMP)
Successful integration of acquisitions have moved Marikana and Rustenburg down the cost curve
LDI (IMP)
Stillwater (SSW)
BRPM (RBP)
Tharisa (THA)
Union (SIY)
Modikwa (ARM/AMS)
Styldrift (RBP)
Rustenburg (SSW)
Cumulative Annual Production (4E Koz.)
2020E - Cash cost
Amandelbult (AMS)
Global PGM Cash Cost Curve (CY20E- At Spot)
Marikana (SSW)
Zondereinde (NHM)
500 1,000 1,500 2,000 2,500 3,000 3,500 4,000 4,500 5,000 5,500 6,000 6,500 7,000 7,500
Impala Mine (IMP)
0
5,000
24
10,000
15,000
20,000
25,000
30,000SA PGM four year outlook
SA PGM operations – Production and AISC (R/oz)*
2.0 25,000
4E PGM Production
R/oz AISC
20,000
1.5
15,000
1.0
10,000
0.5
5,000
0.0 0
2020 2021 (FC) 2022 (FC) 2023 (FC) 2024 (FC)
Production (4Emoz) excl projects AISC (R/oz) (rhs)
SA PGM operations – Capital (Rm and US$m)*
4,000 300
US$m
Rm
250
3,000
200
2,000 150
100
1,000
50
0 0
2020 2021 (FC) 2022 (FC) 2023 (FC) 2024 (FC)
Capital (Rm) Capital (US$m) (rhs)
* All costs are in 2021 terms. Exchange rate of R/US$15.00 was used for relevant conversions from year 2021 – 2024. SA PGM profiles exclude production and costs from the K4 and Klipfontein projects 25US PGM operations – contributing 21% of Group adjusted EBITDA
US PGM operations – Mined production, recycling and AISC • H2 2020 production 3% higher than H1 2020
• 2% increase in AISC in H2 2020, due to 7%
800 2,500
US$/2E oz
2E/3E PGM koz production
increase in taxes & royalties
2,000 • 63% adjusted EBITDA high margin
600
underground operations
1,500 • US$53.4m adjusted EBITDA from recycling
400 operations (2019: US$38.2m)
1,000
• Fill the Mill project delivered on time
200 and at budget
500
- Annual run rate of 40koz (2E) from 2021
onwards
0 0
H1 2018 H2 2018 H1 2019 H2 2019 H1 2020 H2 2020 - Project NPV exceeding US$400m at spot
PGM prices
Mined production (2E) Recycling production (3E)
US$/2E oz average price (rhs) All-in sustaining costs (rhs)
High grade, low cost operations with downstream smelting, refining and largest recycling business in stable jurisdiction
Source: Company results information
1. The Group reports adjusted earnings before interest, taxes, depreciation and amortisation (EBITDA) based on the formula included in the facility agreements for compliance with the debt covenant formula.
For a reconciliation of profit/loss before royalties and tax to adjusted EBITDA, see note 8.1 of the condensed consolidated interim financial statements in the H2 2020 results booklet.
Adjusted EBITDA margin is calculated by dividing adjusted EBITDA by revenue 26Long life assets with increasing output
US PGM operations - Production and AISC* US PGM operations - Capital*
2,000 1,000 350
US$/oz AISC
US$m
2E/3E koz PGM Production
300
1,500
800 • Underground production
250
600 200 building up to ~850koz 2E
1,000
400 150 by 2024 and
500 100
200
50 • Recycling of ~850koz 3E
0 0 0
2020 2021 (FC) 2022 (FC) 2023 (FC) 2024 (FC) 2020 2021 (FC) 2022 (FC) 2023 (FC) 2024 (FC) • AISC to stabilise at ~
Recycling (3Ekoz) Capital - ORD and sustaining (US$m) US$750/oz (in 2021 terms)
Mine production (2Ekoz) Capital - project (US$m)
• Lower East Boulder and
AISC (US$/oz) (rhs) (excl recycling)
lower Blitz projects offer
additional growth potential
12.2km
• 12.2 kilometres of
undeveloped, mineralised
section between Stillwater
(Stillwater East) and East Boulder
* Cost and capital are in 2021 terms. Royalties and taxes included in AISC have been assumed based on a US$1,680/oz 2E price for year 2021 and US$1,440/oz for 2022 to 2024
Royalties and taxes increase by approximately US$5/oz for every US$100 increase in the PGM basket (2E) 27Stillwater East (Blitz)
US PGM production build-up and costs
• The Stillwater East (Blitz) production building-up to steady state
900 1,200
run-rate of ~300koz 2E oz in 2024
2E mine production
1,000
• Project capital forecast of US$375m over next three years 600 800
US$/2Eoz
• US PGM operations steady state AISC forecast to reduce to 600
~US$750/oz* from 2024 300 400
200
- -
AISC* breakdown (2E)
2021 (FC) 2022 (FC) 2023 (FC) 2024 (FC)
1 000
East Boulder Stillwater West 2E oz Stillwater East 2E oz
US$/oz
AISC (US$/oz) AIC (US$/oz)
800
600
400
200
-
2021 (FC) 2022(FC) 2023 (FC) 2024 (FC)
Working costs Royalties and taxes Other SIB
Ramp-up at Stillwater East is expected to almost double production from the Stillwater Complex
* Cost and capital are in 2021 terms. Royalties and taxes included in AISC have been assumed
based on a US$1,680/oz 2E price for year 2021 and US$1,440/oz for 2022 to 2024. Royalties and taxes
increase by approximately US$5/oz for every US$100 increase in the PGM basket (2E) 28SA gold operations – contributing 19% of Group adjusted EBITDA
SA gold2 – Underground & surface production with AISC & gold price
• H2 2020 production 43% higher than H1 2020
- Successful ramp-up post SA COVID-19 lockdown
700 1,000,000
- Normalised production rates achieved mid-Nov
Gold koz
AISC R/kg
600 2020
800,000
500 • 12% reduction in AISC in H2 2020 due to higher
volumes
600,000
400
• DRDGOLD production 25% higher (96koz vs 77koz
300 in H1 2020) at an AISC R604,125/kg
400,000
200
• 36% adjusted EBITDA margin1 for H2 2020
200,000 • Adjusted EBITDA1 of R7.8bn (US$472m) for 2020
100
from loss of R969m (US$67m) for 2019
0 0 • Adjusted FCF of R6.4bn (US$386m) for the 2020
H1 2018 H2 2018 H1 2019 H2 2019 H1 2020 H2 2020 year (2019: adj FCF loss - R5.5 bn/US$382m)
Underground(UG) production Surface production
R/kg average gold price (rhs) All-in sustaining cost (rhs)
SA gold operations safe production build up after H1 2019 strike interrupted by COVID-19
Source: Company results information
1. The Group reports adjusted earnings before interest, taxes, depreciation and amortisation (EBITDA) based on the formula included in the facility agreements for compliance with the debt covenant
formula. For a reconciliation of profit/loss before royalties and tax to adjusted EBITDA, see note 8.1 of the condensed consolidated interim financial statements in the H2 2020 results booklet.
Adjusted EBITDA margin is calculated by dividing adjusted EBITDA by revenue
2. Includes production and AISC of DRDGOLD 294 year outlook
SA gold operations – Production and AISC* (R/kg) • AISC to decrease due to Kloof infrastructure project which
35,000 900,000 will reduce infrastructure footprint
• Elevated capital for 2021 due to carryover from 2020
Production (kg)
R/kg AISC
30,000
25,000
600,000
20,000
15,000
300,000
10,000
5,000
0 0
2020 2021 (FC) 2022 (FC) 2023 (FC) 2024 (FC)
Production (kg) excl Burnstone AISC (R/kg) (rhs) excl Burnstone
SA gold operations – Capital* (Rm and US$m)
5,000 300
US$m
Rm
4,000 250
200
3,000
150
2,000
100
1,000 50
0 0
2020 2021 (FC) 2022 (FC) 2023 (FC) 2024 (FC)
Capital (Rm) excl Burnstone Capital (US$m) (rhs) excl Burnstone
* All costs are in 2021 terms. Outlook numbers exclude DRDGOLD. Exchange rate of R/US$15.00 was used for relevant conversions from year 2021 - 2024 30Precious metals markets
Platinum’s fortunes set to turn

               Platinum market balance

      1,000                                                                                                         1,400
koz

                                                                                                                                     • Primary platinum supply expected to fall

                                                                                                                            US$/oz
                                                                                                                                       by ~ 225koz by 2025 – SA underinvestment
                                                                                                                    1,200
        500
                                                                                                                                     • Recycling to grow by ~23% over
                                                                                                                                       the period – higher loaded catalysts
                                                                                                                    1,000
           0                                                                                                                         • Increased gross autocatalyst demand
                                                                                                                    800
                                                                                                                                       from 2.7moz in 2019 to 4.5moz in 2025,
       (500)
                                                                                                                                       largely due to substitution in gasoline
                                                                                                                                       autocatalysts
                                                                                                                    600
                                                                                                                                     • Net jewellery demand growth
      (1000)
                                                                                                                    400
                                                                                                                                       of ~4% per annum from 2021-2025
                                                                                                                                     • Platinum to move into deficit from 2024
      (1500)
                                                                                                                    200              • Longer term potential demand from
                                                                                                                                       green economy
      (2000)                                                                                                        0
                2015A    2016A     2017A     2018A     2019A     2020E      2021E   2022E   2023E   2024E   2025E

                   Platinum market balance                Excl. investment           Platinum price (rhs)

Outlook for platinum positive – driven by substitution
 Note: 2021 price is the average LPPM price, 1-16 Feb 2021 of US$1,177/oz
                                                                                                                                                                                 32
Palladium – near term solid fundamentals
Palladium market balance
500 2,500
US$/oz
koz
• Deficit to widen again in 2021 as demand
recovers
2,000 • +500koz primary supply between
0 2021-2025, primarily North American
and Russian expansions
1,500 • +1Moz recycling over the period,
( 500)
increased palladium loadings and more
gasoline catalysts coming back
1,000
• Increased substitution in gasoline catalyst
over period
(1 000)
- ~ 1.5moz/year of Pd removed and Pt
500
added in 2025
• Opportunity to partially substitute rhodium
(1 500) 0 with palladium in autocatalysts
2015A 2016A 2017A 2018A 2019A 2020E 2021E 2022E 2023E 2024E 2025E
Palladium market balance Excl. investment Palladium price (rhs)
Palladium well supported for next three years, but expected to move into surplus by 2025
Note: 2021 price is the average LPPM price, 1-16 Feb 2021 of US$2,326/oz
33Rhodium’s fundamental deficit continues
Rhodium market balance
200
• Auto demand anticipated to grow ~19%
koz
US$/oz
20,000 (2021-2025)
100 - tightening emissions regulations
16,000
= increased loadings
• 13% decline (2021-2025) in primary
0 supply - South African industry
12,000
undercapitalised
• Recycling volumes to grow by ~140koz
( 100)
8,000 over the same period as higher loaded
catalysts are scrapped
( 200)
• Substitution of rhodium with platinum
4,000
in the glass industry removes 20koz
of industrial demand, further cementing
( 300) 0 rhodium as an auto metal
2015A 2016A 2017A 2018A 2019A 2020E 2021E 2022E 2023E 2024E 2025E (~90% of demand)
Rhodium market balance Rhodium price (rhs)
The most precious metal of them all – solid outlook
Note: 2021 price is the average Johnson Matthey base price, 1-16 Feb 2021 of US$21,408/oz
34Growth in PGM loadings makes up for slower auto demand growth
Gross PGM auto demand vs vehicle demand
16,000 120
millions
koz
% CAGR 2019-2025
110
12,000
100
2.7%
8,000 90
80 1.6%
4,000
70
-0.3%
0 60
2015 2016 2017 2018 2019 2020 2021 2022 2023 2024 2025
9.2%
Platinum Palladium Rhodium Passenger cars(PCs) and Light commercial vehicles(LCVs)
35Gold market review and outlook 2021 Outlook - Economic recovery & low interest rates set tone • Expected support for gold investment from low interest rates and lingering economic risks • Forecast recovery in gold consumer demand, largely from emerging markets economic recovery • Moderate net purchases from central banks • Mine production recovery to historical levels with COVID-19 disruptions behind us • Longer term question marks about sustainability of current production levels See Gold Outlook 2021 for more details Source: 36
Financial results &
        optimising
capital allocation
Income statement for the year ended 31 Dec 2020
Rm 2020 (Rm) 2019 (Rm) % variance 2020 (US$m) 2019 (US$m)
75% increase in revenue Revenue 127,392 72,925 75% 7,739 5,043
Cost of sales, before amort & depreciation (75,776) (56,100) 35% (4,604) (3,880)
SA PGM - SA gold Net other cash costs1 (2,231) (1,869) 19% (135) (129)
US PGM Adjusted EBITDA2 49,385 14,956 230% 3,000 1,034
Marikana Rand
US$/2Eoz Amortisation and depreciation (7,592) (7,214) 5% (461) (499)
included and gold price
up 55% Net finance expense (2,086) (2,742) -24% (127) (190)
R/4Eoz up 83% up 43% Loss on financial instruments (2,450) (6,015) -59% (149) (416)
(Loss)/gain on foreign exchange differences (255) 326 178% (16) 23
Cost of sales up 35% including Marikana,
Share of equity-accounted investees after tax 1,700 721 136% 103 50
recycling costs and US royalties Loss on settlement of US$ Convertible bond (1,507) - 100% (92) -
Reversal of impairments/(Impairments) 121 (86) 241% 7 (6)
US$ Convertible bond settlement Gain on acquisition - 1,103 -100% - 76
Restructuring costs (436) (1,252) -65% (27) (87)
Net other 370 (653) 157% 25 (44)
Earnings per share increased 536x Profit/(loss) before royalties, carbon tax& tax 37,250 (856) 4457% 2,263 (59)
Royalties (1,765) (431) 310% (107) (30)
Increase in tax & royalties - higher Carbon tax (5) (13) -62% - (1)
Mining and income tax (4,858) 1,733 380% (295) 120
profitability
Profit for the period 30,622 433 6956% 1,861 30
Total Dividend of R3.71/share³ Normalised earnings³ 30,607 2,360 1197% 1,859 163
Earnings per share (cents) 1,074 2 53600% 65 -
declared 35% of normalised³ earnings
HEPS (cents) 1,068 (40) 2770% 65 (3)
1. Lease payments are included in net other cash costs (added back in net other) to conform with the adjusted EBITDA reconciliation disclosed in note 11.2
2. The Group reports adjusted earnings before interest, taxes, depreciation and amortisation (EBITDA) based on the formula included in the facility agreements for compliance with the debt covenant formula.
For a reconciliation of profit/loss before royalties and tax to adjusted EBITDA, see note 11.2 of the relevant notes in the condensed consolidated interim financial statements
3. Normalised earnings is a pro forma performance measure and is not a measure of performance under IFRS, may not be comparable to similarly titled measures of other companies, and should not be considered
in isolation or as alternatives to profit before tax, profit for the year, cash from operating activities or any other measure of financial performance presented in accordance with IFRS
(see note 9 of the notes in the condensed consolidated provisional financial statements). Final dividend declaration by the Board – in line with the good results and reduced uncertainty surrounding COVID-19 and declared
based on a 35% of normalised earnings less the interim dividend payment 38Deleveraging achieved - Net cash position
Borrowings and cash2 – 31 Dec 2019 vs 31 Dec 2020 • Cash of R20bn (US$1.4bn) at 31 Dec 2020
• Gross debt2 of R17.1bn (US$1.2bn)
2,000 US$1,897
- Corporate bonds mature in June 2022 and
US$ million
339 2025
1,500
- RCF’s temporarily drawn by 49%, primarily
623 US$1,165 inventory advance funding at US PGM
1,000 340 operations
348 • Interest expenses expected to be reduced
350 1,375
500 179
by ~R350 million per annum, and the
loss/gains on financial derivatives to be
408 399 475
eliminated as the convertible bond have
0 now been settled
31 Dec 2019 31 Dec 2019 31 Dec 2020 31 Dec 2020
- Gross debt - Cash - Gross debt - Cash • Potential of consolidation of term debt in
US$600m USD RCF R5.5bn ZAR RCF US$354m 6.125% 2022 bonds
2021 at better interest rates - ~US$500
US$384m 1.875% 2023 CB US$347m 7.125% 2025 bonds Other Debt million in refinanced bonds
Cash
Net cash position with low gross debt
1. Graph shows current book values of scheduled capital maturities
2. Maturities above are borrowings that have recourse to Sibanye-Stillwater and exclude the Burnstone debt (and cash) whilst including the derivative financial instrument as detailed in note 11.2 of the
notes to the financial statements 39Capital allocation for 2020
Capital Allocation during 2020
R50,000
Earned • Cash generated post Capex, interest
ZAR million
Applied
R6,967
R40,000 royalties and tax was predominately
R666 R6,525
R30,000
allocated (56%) towards strengthening
R11,073 the balance sheet during 2020
R45,186
R20,000 R2,649
R31,028 • Strong allocation towards
R10,000 R17,306 shareholders during 2020 (36%)
R0 • With the balance sheet strengthened
Cash SIB Capex * Net Interest Royalties & Cash Shareholders Growth * Balance and shareholder dividends reinstated
generated by paid Taxes paid generated # Sheet
operations post Capex, the group’s focus turns towards
int, royalties &
taxes improving growth prospects
Cash generated by operations SIB Capex * Net Interest paid
Royalties & Taxes paid Shareholders # Growth *
Balance Sheet
Strong cash flow generation to support strong dividend payments
# Includes both interim and final 2020 dividends, and includes dividends paid to minorities
* Growth projects as per the segmental reporting. SIB capex net of proceeds on disposal of asset 40Return to shareholders of R10.7bn/US$729m dividends for the year
• Dividend policy of 25-35% of normalised earnings Normalised earnings/(loss) and dividend payments2
• 35% declaration to shareholders on 2020 full year earnings
25,000 10,000
9,375
Dividend payment (Rm)
Normalised earnings (loss) Rm
• 2020 total dividends (R10.7bn) more than double the 9,000
cumulative dividends paid from 2013 – 2017 (R4.1bn) 20,000
8,000
7,000
Total/2020 Final/ Interim/ 15,000
6,000
full year H2 2020 H1 2020
10,000 5,000
Normalised Rm R30,607 R21,762 R8,845
earnings US$m US$1,859 US$1,328 US$531 4,000
5,000
Dividends 3,000
Rm R10,713 R9,375 R1,338
declared/paid US$m US$729 US$649 US$80 2,000
1,2,3 0 1,338
825 787
555 450 567 560 1,000
Dividends SA cent per ord. share 371 321 50 272 91
per share US$ cent converted 25.15 22.21 2.94 (5,000) 0
Dec
Dec
Dec
Dec
Dec
Dec
Dec
Jun*
Jun
Jun
Jun
Jun
Jun
Jun
Jun
US$ cents per ADR (4:1) 100.62 88.83 11.79
2013 2014 2015 2016 2017 2018 2019 2020
Dividend paid (rhs)
Normalised Earnings (lhs)
Industry leading dividend to be maintained, supported by solid financial outlook
• June 2020 interim dividend has been declared at 50 SA cents per share and paid on 21 September 2020
1. Illustrative Final dividend converted at US$/R14.4551 exchange rate at 15 Feb 2021 with rate obtained from IRESS and Interim dividend converted at a rate of US$/16.9689 on 24 Aug 2020 and actual
interim dividend paid on 21 September 2020 converted using a rate of R16.7779/US$
2. Excludes minority dividends payments by DRDGOLD due to the consolidation as recorded in the financial statements 41
3. US$ amounts based on illustrated values as Final dividend rate not available as yet. US$729m in heading was converted using exchange rate of R/US$14.69Strategic capital allocation
1 Project Capital Pipeline ~R6.2 billion
High ◼ K4 – R3.9 billion (8 years)
Project Capital R6.2 billion
◼ Klipfontein – R66 million (1 year)
US$1.1bn ◼ Burnstone – R2.3 billion (14 years)
◼ Total capital (Project, ORD & SIB) ~R27.5 billion
2
Cash set aside for:
Cash Reserves R20 billion 1
◼ Liquidity buffer – R5 billion ( of R15 billion)
3
◼ Debt buffer – US$1 billion (R15 billion)
◼ Improved credit metrics
3
~R9 billion – Industry leading dividend:
Dividends R10 billion ◼ 2020 dividend – R10.7 billion (8.7% yield)
p.a
◼ Repeatability and predictability
Priority
◼ ~R9 billion to R10 billion - target 2% to 4% yield (based on 20% to 40% equity rerating)
4
Debt ~R3 billion ◼ Refinance - US$500 million 7/8 year (~Mid 2021)
management ◼ 2022 bond callable at 100% (US$350 million) - June 2021
◼ 2025 bond callable at 103.6% (US$350 million) – June 2021
5 ~R1 billion ◼ Cash-settled Long Term Incentive Plan - 3% to 5% dilution in a 5-year cycle
Share p.a ◼ Odd lot shareholders buy-out – R84 million (0.5% of shares in issue)
buyback
?
6 Overflow
Low ◼ Increased dividend
Other
Creating superior value for all stakeholders whilst ensuring sustainable operations
42Prospering in South Africa’s investment climate
Prospering in South-Africa’s investment climate

    • Fragile state of SA economy exacerbated by ongoing
      COVID-19 pandemic                                                             SA Project pipeline
    • Economic recovery necessary to alleviate poverty &
      inequality
    • Current policies and ideologies inhibiting investment
    • Critical need to address these investment barriers to
      drive economic recovery
    • Positive commodity outlook offers opportunity to
      significantly contribute to economic growth
    • Minerals Council estimates R20bn of potential investment
      opportunities in a supportive environment
    • Uncertain regulatory policy and risks related to power
      reliability with rapidly rising power costs increasing
      investment hurdle rates
    • Only the best projects (low capital intensity, short lead
      time and quick payback) currently meet investment
      hurdle rates resulting in lost opportunity?

Urgent economic reforms and stakeholder alignment necessary to enable South Africa to deliver on its potential
*    Note: Refer to full project pipeline slide in the appendix                                                  44
K4 project – unrivalled tier 1 PGM project
Key statistics (2021 terms) 1,400
LoM capital expenditure profile (R million)
• Project capex* of ~R3.9bn over 8 years - 1,200
majority during first 3 years 1,000
800
• Steady state (2030 – 2063)
600
~250koz per annum 400
• Average operating cost ~ R16,051/4Eoz 200
(R16,000/oz at steady state) -
Year 11
Year 13
Year 15
Year 17
Year 19
Year 21
Year 23
Year 25
Year 27
Year 29
Year 31
Year 33
Year 35
Year 37
Year 39
Year 41
Year 43
Year 45
Year 47
Year 49
Year 51
Year 1
Year 3
Year 5
Year 7
Year 9
• Six years payback (four years at spot
prices)
Infrastructure TSF SIB ORD
• ~11.5m 4Eoz produced over 50 year life
Commodity price and exchange rate assumptions
of mine
Current
• NPV (15% real discount rate) – R3bn at Metal price Unit 2021 Thereafter spot prices
assumed project prices, (R21bn at spot) Platinum US$/oz 900 880 1,117
Palladium US$/oz 1,900 1,600 2,328
• IRR 33% at assumed prices, (80% at spot)
Rhodium US$/oz 8,500 5,650 21,800
Gold US$/oz 1,605 1,500 1,806
ZAR/USD ZAR/US$ 15.50 15.00 15.03
Low capital intensity, short lead time, superior return on investment
* Inclusive of TSF, excluding ORD and SIB capex 45K4 project – unrivalled PGM brownfields project
• Mining both Merensky and UG2 reefs to a depth of 1,287m K4 project - expected 4Eoz production
300,000
• Sunk capital of R4.4 billion invested by Lonmin
Ounces (oz)
250,000
- Functional 130,000 tpm concentrator 200,000
- Equipped and functional vertical shaft to a depth of 1,332m 150,000
- Equipped and functional ventilation shaft to a depth of 1,078m 100,000
50,000
- Existing surface infrastructure such as offices, change houses,
-
refrigeration plants, grout plants, etc. Year Year Year Year Year Year Year Year Year Year Year
- Stations and station crosscuts 1 6 11 16 21 26 31 36 41 46 51
4Eoz (UG2) 4Eoz (Merensky)
Regional social and economic benefits
• Ensures sustainability of Marikana operations over 50 years
• Significant investment in local economy
• Provides ~4,380 jobs at steady state
• Meaningful opportunities for local procurement,
SMME development and skills transfer
46Burnstone project – key information
Key statistics (2021 terms) Capital expenditure (R million)
• Project capex* of ~R2.3bn over 14 years 800
• Average steady state production ~138,000oz per annum
600
• Average operating cost of ~R415,866/kg
(R380,000/kg at steady state)
• ~2moz produced over 21 year period 400
• NPV (15% real) ~R1.4bn at assumed prices (~R3.8bn at spot)
200
• IRR 24% at assumed prices (39% at spot)
• Seven years payback (six years at spot)
-
Year 10
Year 11
Year 12
Year 13
Year 14
Year 15
Year 16
Year 17
Year 18
Year 19
Year 20
Year 1
Year 2
Year 3
Year 4
Year 5
Year 6
Year 7
Year 8
Year 9
Project SIB ORD
Price and commodity assumptions
Current
Metal price Unit 2021 Thereafter spot prices
Gold US$/oz 1,605 1,500 1,840
ZAR/USD ZAR/US$ 15.50 15.00 14.80
Shallow green fields growth with quick investment payback
* Excluding ORD and SIB capex 47Burnstone project
• Acquired with the Wits Gold acquisition in 2015 Burnstone - expected gold production
150
• Mining Kimberly reef to an average depth of 550m
Au (koz)
(deepest 1.05km)
• Existing infrastructure 100
- Functional metallurgical facility
- Established TSF 50
- Equipped and functional vertical shaft and trackless decline
- Surface infrastructure such as offices, workshops,
-
compressors etc.
10
11
12
13
14
15
16
17
18
19
20
21
1
2
3
4
5
6
7
8
9
- Extensive underground development and infrastructure
Regional social and economic benefits
• Balfour community - severe socio-economic challenges
- Unemployment > 30%; Youth unemployment ~44%
• Enhance regional socio-economic stability by
- Creating 2,500 long term jobs
- Meaningful opportunities for local procurement,
SMME development and skills transfer
48Pursuing value-accretive
growth based on a
strengthened equity ratingTrack record of delivering superior returns through acquisitions
Total investment of R43bn (US$3bn)1 – equivalent to 2020 adjusted EBITDA alone
350
Relative price performance (%)
300
Aquarius and Stillwater DRDGOLD Lonmin
Rustenburg transaction transaction transaction
250
transactions announced - announced - announced –
announced - US$/2E basket R/kg gold R/4E basket
200
R/4E basket price up 160% price up 50% price up 240%
price up 286%
150
100
50
0
(50)
Sep 15 Jan 16 May 16 Sep 16 Jan 17 May 17 Sep 17 Jan 18 May 18 Sep 18 Jan 19 May 19 Sep 19 Jan 20 May 20 Sep 20 Jan 21
Gold US$/oz Gold R/kg PGM basket (R/4Eoz) PGM basket (US$/4Eoz) PGM basket (US$/2Eoz)
Source: IRESS
Successfully established a leading global PGM business through well priced and timed transactions
1. Exchange rate applied to acquisition prices: Aquarius at US$/R14.87 on 12 April 2016, Rustenburg at US$/R13.60 on 1 Nov 2016, Stillwater at US$/R13.64 on 4 May 2017 and Lonmin at US$/R14.83 on 10 June 2019
2. US$269m1 (R4.0bn) for Aquarius in Apr 2016; US$331m1 (R4.5bn4) for Rustenburg in Nov 2016; US$2.2bn (R30bn1) for Stillwater in May 2017; US$290m1 (R4.3bn³) for Lonmin in June 2019
3. Estimate purchase price (not accounting value) of the Lonmin transaction based on Lonmin share capital figure of 290,394,531 shares in fixed ratio of 1:1 resulting in 290,394,531 new Sibanye- Stillwater shares.
Considerations estimate based on spot Sibanye-Stillwater closing share price on the JSE of R14.83 per share on 7 June 2019
4. Minimum payment of R4.5 billion (R1.5bn upfront payment made). Balance settled from 35% of free cash flows from the Rustenburg operations 50Positioning for tomorrow’s green technologies
• Battery and “tech metal”
Growth
Hydrogen
strategy complementary economy exposure
5
to PGM investment case Establish base to participate
in appropriate drive train and 4
• Tech metals and PGMs essential battery metal growth
future components of the global
auto market and a green future International
precious metals
• Key metals with robust 2017
fundamentals identified Stillwater
US PGMs
- Value accretive opportunities 2016
2016
Rustenburg
3
Aquarius 2019
being pursued Lonmin
2 SA PGMs
• Positioning Sibanye-Stillwater as
provider of strategic metals for 2013
2013 2018 2020
1 Wits DRDGOLD
tomorrow’s green technologies Cooke DRDGOLD
Gold
SA Gold
2013 2017 2020 Time
Tech metal strategy complimentary to PGM investment case
51Conclusion
Sibanye-Stillwater continues to outperform peers….
                               500
Share price (rebased to 100)

                                                                                                                                                                                             +369.3%
                                                                                                                                                                                             +347.4% (ADR)
                               400

                               300

                               200

                               100

                                 0
                               February/13     November/13    September/14        June/15         March/16   January/17        October/17   July/18         May/19     February/20   November/20
                                                                                                                                                                                     February/21

                                         Sibanye-Stillwater                  Sibanye-Stillwater ADR          Barrick                         Newcrest
                                         Newmont                             Kinross                         AgnicoEagle                     AngloGold
                                         Gold Fields                         Harmony                         Implats                         AngloPlats
                                         Norilsk Nickel                      FTSE / JSE ALSI                 Gold Miners GDX                 Gold Junior Miners GDXJ

Since listing in February 2013, Sibanye-Stillwater has significantly outperformed key peers and indices
Source: FactSet market data as of February 12, 2021. All data in USD                                                                                                                               53
…but still offering clear relative value on most metrics
Market consensus analysis
EV / EBITDA (2021e / 2022e) P / CFPS (2021e / 2022e) Net debt / 2021e EBITDA EV & market cap (USDm)
6.7x 8.0x 34,270
Intermediate
Senior Gold¹ Senior Gold¹ (0.1x) Senior PGM³
Gold²
6.7x 8.0x 32,327
5.3x 6.4x 33,224
Intermediate Intermediate
Senior Gold¹ (0.1x) Senior Gold¹
Gold² Gold²
4.9x 5.8x 29,842
4.7x 5.7x 12,934
Sibanye-
Senior PGM³ Senior PGM³ Senior PGM³ (0.3x)
Stillwater
5.2x 6.6x 13,022
2.7x 3.8x 11,192
Sibanye- Sibanye- Sibanye- Intermediate
(0.5x)
Stillwater Stillwater Stillwater Gold²
3.7x 4.8x 10,469
Sources: FactSet market data as of February 12, 2021
1. Senior Gold consists of Newmont, Barrick, Newcrest, Agnico Eagle
2. Intermediate Gold (excluding Sibanye – Stillwater) consists of Kirkland, AngloGold, Kinross, Gold Fields, Evolution, Northern Star (incl. Saracen), Polymetal, Polyus, Harmony
3. Senior PGM (excluding Sibanye – Stillwater) consists of Anglo American Platinum, Norilsk and Impala Platinum 54Conclusion – Building tomorrow’s successes, today
✓ Solid, consistent strategic delivery
✓ Leading position in global precious metals
✓ Positioned for green future
✓ Committed to ESG excellence
✓ Strong balance sheet & financial flexibility
✓ Investing in value accretive operational
sustainability
✓ Unrivalled projects unlock value to all stakeholders
✓ Tech metals strategy to diversify and deliver future
value
✓ Offering substantial relative value
Creating superior value to all our stakeholders through unwavering delivery of our strategy
55Questions?
Contacts
James Wellsted/ Henrika Ninham/ Chris Law
ir@sibanyestillwater.com
Tel: +27(0)83 453 4014/ +27(0)72 448 5910/ +44 (0)7923126200
Website: www.sibanyestillwater.co.za
Tickers: JSE: SSW and NYSE: SBSWAppendix Disclaimer: Photo utilised was taken pre-COVID-19
2021 Annual guidance³

2021                                     Production          All-in sustaining costs                     Total capital

                                                                                                US$300 - 320m (incl
US PGM operations
                                       670 - 690 koz               US$840 - 860/oz4            US$175-185m project
(2E mined)
                                                                                                            capex)

US Recycling (3E)                      790 - 810 koz                               n/a                              n/a

SA PGM operations²                                           R18,500 - 20,500/4Eoz                            R3,800m
                                    1.75 -1.85 moz²
(4E PGMs)                                                  (US$1,233 -1,367/4Eoz)¹                         (US$253m)¹

                                 27,500 - 29,500kg         R760,000 - R815,000/kg             R4,025m (incl R425m
SA gold operations
                                                                                                   project capex)
(excluding DRDGOLD)              (884koz - 948koz)            (US$1,576 - 1,690/oz)        (US$268m incl US$28m)1

Source: Company forecasts
1. Estimates are converted at an exchange rate of R15.00/US$
2. SA PGM operations’ production guidance include 50% of the attributable Mimosa production, although AISC and capital exclude Mimosa due it being equity accounted.
   SA PGM exclude production and costs from the K4 and Klipfontein projects
3. Guidance does not take into account the impact of unplanned events (including unplanned COVID-19 related disruptions)
4. US PGM AISC are impacted by tax and royalties paid based on PGM prices, current guidance was based on spot 2E PGM prices of US$1,680/oz                             58
Extensive SA project pipeline – unrealised potential?
PGM and gold projects Reserve Est (Moz) Project status
1 Marikana K4 (Both) 13,30
2 Marikana E3D (UG2) 2,75 Feasibility complete
3 KDL Klipfontein (UG2) 0,18
Pre-feasibility phase
4 Siphumelele 2 (Both) 2.76
5 Siphumelele 1 (UG2) 12.99 Concept phase
6 Marikana E4 (UG2) 6,03 19
7 Boschfontein (Both) 0,95 17
13 23 21 21
3
8 Kroondal 5# (UG2) 2,16 5
11 20 8
9 MK2 Decline (Both) 5,26 16 1
10
10 Newman (MER) 1,44
9 14 22 2
11 Saffy Deeps (UG2) 12,89
24
6
12 Pandora Deeps (UG2) 7,69
15 4 7
13 TURK (Both) 7,41 12 18
14 Thembelani extension (Both) 13,39
15 Bathopele Opencast 0,08 (30%)
16 KDL Tailings (3 dams) 2,37
17 Baobab 5,04
18 Akanani 27,6
19 Blue Ridge 1,8
20 Marikana Tailings 0,75
21 Kloof 4 Decline 0.34 >10 years 5-10 years 2-5 years To complete 2021 Completed 2020
22 Burnstone 2.18
23 De Bron Merriespruit 2.10
24 Bloemhoek 0.70 INCREASING CONFIDENCE / LESS RISK
Notes: Circles illustrate the size of the price (potential ounces), colour of the circles indicate the current status of the project (based on the Project Status legend top right hand corner); the grouping of
the years is when the projects are envisioned to be taken to the next level from a project status point of view such as feasibility level or even to the Investment Committee for approval. Some of these
projects might be coming in a bit later but the amount of work required determines where they fit into the timeline grouping. 59You can also read