Loughborough University Access and participation plan 2020-21 to 2024-25
←
→
Page content transcription
If your browser does not render page correctly, please read the page content below
Loughborough University
Access and participation plan 2020-21 to 2024-25
Executive Summary
This Access and Participation Plan has been prepared in the light of significantly revised guidelines from the
Office for Students (OfS), and therefore reflects an ambitious plan to address equality of opportunity across the
four stages of the student lifecycle: Access, Continuation, Attainment and Progression.

Loughborough University is proud of its student experience, recognised as outstanding on multiple success
measures, nevertheless it is not complacent. Hence, the strategic aims set out in this plan are derived from a
thorough analysis of performance in relation to gaps between under-represented groups in higher education
and their peers and the progress as a function of time in closing the gaps identified. The strategic aims and
associated targets identified support the OfS Key Performance Measures (KPM), particularly those for Access
(KPM2) and Attainment (KPM4).

For context, Loughborough University is a medium-sized, high tariff, research-intensive university in the East
Midlands, with an outstanding reputation for sport. The majority of students are engaged in STEM subjects. At
present, the student body is primarily drawn from the home counties around London and Leicestershire,
excluding Leicester city. Loughborough itself is a small market town in which the University is now the major
employer, and the university cities of Nottingham, Leicester and Derby are all within 20 miles.

This plan has been the subject of extensive consultation across the University, including with student groups,
and is wholeheartedly supported by the institution’s entire senior leadership. The eight key strategic aims and
associated objectives, with relevant targets, identified for the period of this plan for Loughborough University
are:

Access: Increase intake of students from areas of low HE participation/low socio-economic groups (KPM2)
• Reduce the difference in entry rates for students from POLAR4 quintiles 3,4 & 5 compared to quintiles 1 &
  2 to a ratio of 3.5:1 in 4 years
• Reduce the difference in entry rates for students from POLAR4 quintile 5 compared to quintile 1 to a ratio of
  4.5:1 in 5 years
• Increase the proportion of Realising Opportunities students who are tracked into HE who will access a
  research-intensive university within two years of becoming ‘HE ready’ and completing their post-16 studies
  to 54% in 5 years

Attainment: Understand and explain the different attainment rates observed by ethnicity/socio-economic
group, and reduce the gaps identified (KPM4)
• Reduce the % difference between White and Black students undertaking a placement year during their
   degree to be within 4% in 5 years
• Reduce the difference in degree attainment (1st and 2:1) between White and Black students to 10% points
   in 5 years
• Reduce the difference in degree attainment (1st and 2:1) between White and Asian students to 7% points in
   5 years
• Reduce the difference in degree attainment (1st and 2:1) between students from IMD quintiles 3,4 & 5
   compared to IMD quintiles 1 & 2 to 7% points in 5 years

Student Success: Understand and reduce any inequalities for students with a disability in terms of student
success; these gaps are not statistically significant at Loughborough
• Use our unique reputation for sport to engage young people with a known sensory, medical or physical
   disability and promote their progression to and success in HE, with a target to increase the number of new
   entrants from this group by 75% over 5 years

Continuation: This is a current area of strength for Loughborough, nevertheless, understanding the need to
monitor any emerging gaps, as well as our role contributing to performance nationally, we will continue to:
• Monitor student continuation across all groups and act where any issues are identified

Progression: This is a current area of strength for Loughborough, nevertheless, understanding the need to
monitor any emerging gaps, as well as our role contributing to performance nationally, we will continue to:
• Monitor progression into employment across all student groups and act where any issues are identified

                                                                                                               1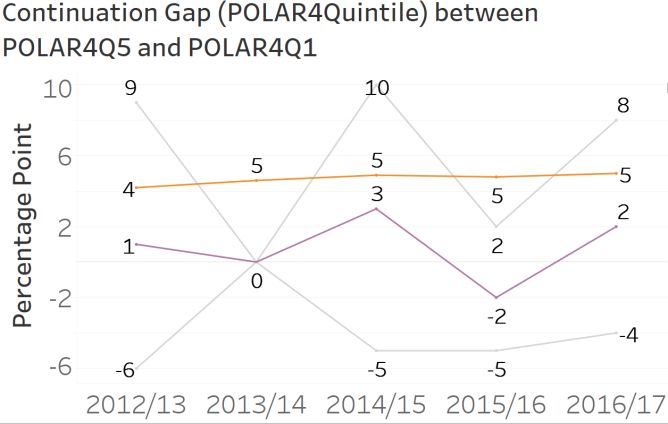
1. Assessment of performance
1.1 Higher education participation, household income, or socioeconomic status

i) Access
In 2017-18 Loughborough’s intake of students from POLAR4 quintile 1 was 7.3% (HESA PI). This is the
University’s highest intake of students from low participation neighbourhoods (LPNs) over the last 10 years.
Whilst remaining below our previous benchmark, we note that the gap between our intake and benchmark has
reduced from 3.0% to 0.8%.

Considering OfS’ second Key Performance Measure (KPM2), in 2017-18 there was a 19.8% point gap between
the participation of students in the population who are between 18 and 30 years old from the most and least
represented groups at higher tariff providers using POLAR4. Loughborough University has seen a gradual
growth in the number of students from quintile 1 over time which can be seen in the graph below (Figure 1a),
with a slight acceleration in progress in the last year of the dataset. However, it remains the case that students
from quintile 5 are significantly more represented in the student population at Loughborough than those from
quintile 1, Figure 1b.

Figure 1: a) Proportion of quintile 1 18 year olds in the population compared with those at Loughborough University and b) Entry
rate per 10,000 in the population across POLAR4 quintiles 1 to 5 at Loughborough University.

At Loughborough the gap between the proportion of the least represented 18 year olds (POLAR4 Q1) and their
distribution in the population is 10.4% points, which is the mode for higher tariff providers (see Figure 2). Whilst
the gap at Loughborough has reduced (from 13% points) with time as shown in Figure 1, we fully accept this is
an area where further progress should be made.

Figure 2: Gaps in proportions of the least represented (POLAR4 Q1) 18 year olds in 2017-18, provider compared with population.
For Loughborough the gap is 10.4 % pointsi.

                                                                                                                              2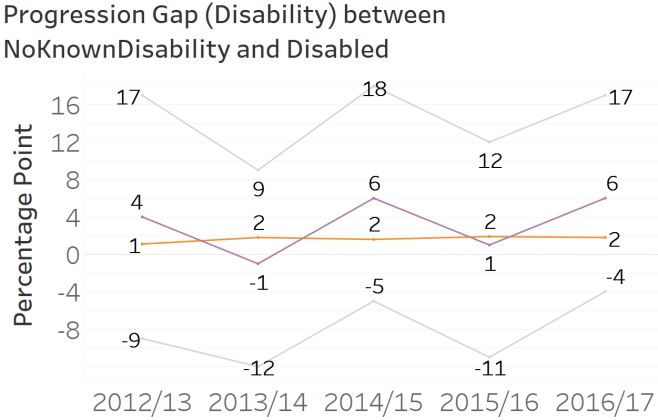
As well as a statistically significant1 gap for POLAR4 quintile 1 students when compared to the population
as a whole for each of the last five years, a statistically significant gap is also seen for POLAR4 quintile 2
students. This has remained ~constant over the five-year period, as indicated in Figure 3b. No statistically
significant gaps have been identified for quintiles 3, 4 or 5.

Figure 3: The difference between the proportion of 18 year olds in the population (yellow) and at Loughborough (purple) in a)
POLAR4 quintile 1 and b) POLAR4 quintile 2.

Similar analysis of Loughborough’s intake by the measure Index of Multiple Deprivation (IMD) demonstrates,
with statistical significance, that students from quintiles 1 and 2 are less likely to study at Loughborough and
those from quintiles 4 and 5 are more likely to join the University when compared with the proportion of students
in the population. The trends with time are similar to those described above in respect of the POLAR4 measure.

In order to better understand the University’s performance, we can draw on the UCAS equality report data for
Loughborough. This shows no statistically significant variation between our offer rate and that which would be
expected for applicants from POLAR4 quintiles 1 and 2, and as such indicates that the gaps identified above
are due to lack of applicants from these groups rather than bias in the admissions process.

Through the services provided to us by EMWPREP, we have begun to track the progression into HE of those
who have participated in our recruitment and widening participation initiatives. The most recent analysis has
shown that 46.1% of students from quintiles 1 or 2 (POLAR3) who participated in our access/recruitment
activities between 2006/07 and 2015/16 have entered HE aged 18 or 19, compared with 62.1% of students
from quintiles 3-5.

There is therefore a consistent picture from all data sources that students from POLAR4 quintiles 1/2 and
IMD quintiles 1/2 are less likely to apply to Loughborough than students from other areas/socio-
economic groups. There is no identifiable bias in the admissions process and therefore it is important
to work on attracting more applicants to Loughborough from these groups.

ii) Success: Non-continuation
Loughborough has a strong record in terms of student retention, with Continuation having a high absolute value
(i.e. in the top 10% of absolute performance for all providers) in the TEF Year 4 metrics at Provider level. The
continuation metric for Loughborough is at 97.4% in the TEF Year 4 metrics, against a benchmark of 95.5%.
Furthermore, the split metrics for students in quintiles 1 and 2 of both the POLAR4 and IMD categories are 97.2
and 96.7% respectively, which are significantly above the benchmark for these groups of students and are
positively flagged. It is noteworthy that when compared with the benchmark, Continuation for students in
quintiles 3-5 although high in absolute terms, is not flagged. This suggests that there is very good support
available for students in quintiles 1 and 2 to continue with their studies, although we continue to work to ensure
that the continuation of these groups is exactly on a par with those from quintiles 3-5.

We have undertaken an analysis of the non-continuation rates by different POLAR quintile groups using the
OfS dataset. As the gaps observed are small, variable (-2 to 3% points) over the five year period, and below
those seen by the sector, we can conclude that our students from LPNs are not more likely to withdraw from
their studies than other students, as illustrated in Figure 4. This is supported by our TEF Year 4 metrics
described above.

1 We have used the OfS definition of statistically significant throughout this document when referring to data taken
from the OfS Access and Participation Dashboard.
                                                                                                                           3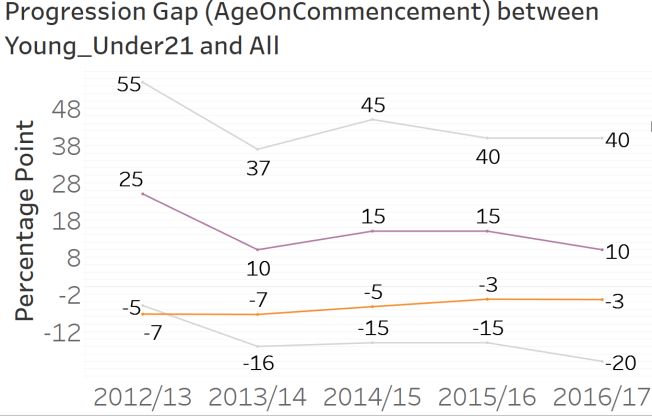
Therefore, Loughborough performs well against OfS’ third Key Performance Measure, KPM3. In 2016-17 there
was a 4.4% point difference between the non-continuation rates of the most and least represented groups
nationally. At Loughborough the equivalent gap is 2% and is not statistically significant nor changing with time.

From detailed consideration of our HESA PI, the OfS dataset, TEF Year 4 data and our own internal data, we
have concluded that there are no significant inequalities in terms of the non-continuation of students
from the most/least areas of HE participation at Loughborough, which we continue to monitor.

 Figure 4: The gap in continuation at Loughborough (purple)    Figure 5: The difference in attainment at Loughborough
 between students from the least and most represented groups   (purple) compared with the gap at sector level (yellow)
 in HE (POLAR4 quintile 1 and quintile 5) compared with that   between students from the most and least represented groups
 for the sector (yellow).                                      in HE.

iii) Success: Attainment
Analysis of the OfS dataset shows that students from the most represented areas (based on POLAR4 data)
are slightly more likely (4% points) to achieve a 1st/2:1 compared with those students from the least represented
areas, however, the gap at a sector level is more than double this at 10% points. At Loughborough the
‘attainment gap’ has remained constant since 2014-15, as can be seen in Figure 5.

A small number of statistically significant gaps have been identified when reviewing degree success by IMD (in
2013-14 and 2017-18 for ‘All other quintiles except 5 compared with 5’; in 2017-18 only for quintile 5 compared
with quintile 1 and in 2014-15 and 2017-18 for quintile 3-5 compared with quintile 1-2). As these gaps are
present in only one or two of the last five years they do not indicate a consistent attainment gap. However, , it
is important to also considered the absolute value of the gap. When doing so we note that the absolute value
of the gap in IMD attainment for quintile 3-5 compared with quintile 1-2 across the sector is ~12% points,
whereas the absolute value of the gap at Loughborough is lower, being 7, 7 and 10% points respectively in the
last 3 years of the dataset. While this gap is relatively large, it is variable with time in both absolute magnitude
and in terms of statistical significance. We believe that there is a link with the profile, discipline and number of
students admitted to Loughborough in the appropriate years compared to the graduation years and will further
explore this and the underlying reasons behind the gap in more detail. We anticipate the measures we are
putting in place to address a larger absolute gap for Black attainment will also impact positively on the gap for
IMD attainment. However, we will undertake a piece of research to understand what other initiatives should
then be implemented to reduce the IMD gap observed. We have therefore set a specific target to reduce the
gap in IMD attainment between students from IMD Q1 and Q2 compared with those from Q3-Q5 to no more
than 7% points over the next 5 years, with a view to implementing research-informed initiatives which will close
this gap over time.

The University has been monitoring attainment by student group for many years and has developed a statistical
regression analysis model with the aim of determining which factors, if any, impact on student success when
other variables are controlled for. The model includes ethnicity, academic school (discipline), gender, POLAR,
disability status, parental education, whether a student has taken a placement year, tariff on entry, and school
type. The analysis now includes students graduating between 2012/13-2016/17 and our findings support the
conclusion that there is no significant link between degree outcomes and participation neighbourhood (POLAR)
or parental education. The regression analysis will continue to be undertaken annually and updated to include
new indicators as they become available, with the position monitored closely as our student population changes.
We have therefore concluded that at Loughborough there are limited inequalities in terms of the
attainment of students from the most/least areas of HE participation in comparison with the sector as
a whole, nevertheless, in view of our commitment to eliminating any gap where they arise, we have set
a specific target for the attainment of students from IMD Q1 and Q2.

                                                                                                                             4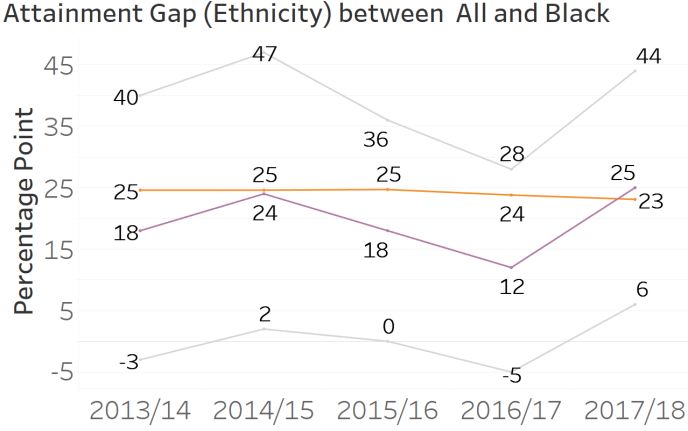
iv) Progression to employment or further study
Loughborough graduates have an excellent employment record with 94% moving into employment or further
study within 6 months of graduation (HESA, 2016-17). Indeed in our TEF4 metrics, Highly Skilled Employment
receives a double positive flag for all split metrics (with the exception of Mature students, which is neutral and
of whom we have very small numbers) and therefore we have no difference in the ability to progress into highly
skilled employment across the POLAR4, IMD, Gender, Disabled or Ethnicity groupings.

A detailed interrogation of the progression information within the OfS dataset reveals that there are no
statistically significant gaps between students from across the POLAR quintiles. In 2016-17 there was a 2%
point difference between students from quintiles 1 and 5. Looking at the trend over time, shown in Figure 6, we
see the gap has increased slightly over the last two years although it should be noted that the gap observed is
consistently small, variable and below that of the sector.

This conclusion is supported by the TEF Year 4 data which show very little difference in the professional
employment rates between students from POLAR quintiles 1 and 2 (82.2%) and quintiles 3-5 (83.4%) and IMD
quintiles 1/2 (80.5%) compared with IMD quintiles 3/5 (83.6%). This is significantly better than a recent HEFCE2
analysis for the sector which showed a difference of 7.7% between students from POLAR3 quintiles 1 and 5
across their early careers and is indicative of positive outcomes for all our students.

Figure 6: The gap in progression into employment between students from POLAR4 quintile 5 and quintile 1 at Loughborough
(purple) compared with the sector (yellow).

As a whole, 49% of Loughborough’s students currently undertake a full placement year during their degree,
which we believe is very significant in determining both degree outcome and progression into employment.
From our internal monitoring of students undertaking a placement year (Part I) we know that students with
household incomes below £25,000 are 9.5% less likely to progress from Part B to Part I. This gap has remained
at a similar level overall throughout the last three years, although is very variable according to discipline. The
gap is something we have been specifically trying to address through the introduction of a bursary for students
who have secured an unpaid placement and have a household income of £25k or less. This scheme is in its
third year of operation and has so far supported 83 students to complete Part I. We intend to continue targeted
support for placements as described in our Strategic Aims. Following our review of financial support, we are
introducing a placement start-up grant for all students that have a household income of less than £25k.

A statistical regression analysis of our student Destination of Leavers from Higher Education (DLHE) data has
identified that the predominant factors in determining positive graduate outcomes are degree classification,
undertaking a placement year, followed by academic School (discipline) at the University, and school
background prior to university. LPN, gender and disability are not found to be statistically significant, consistent
with the above TEF4 data.

As a result of the analysis outlined above, we have concluded that there are no significant inequalities
in terms of the progression of students into employment from areas of most/least HE participation at
Loughborough, although we continue to monitor to ensure that gaps do not develop.

1.2 Black, Asian, Minority Ethnic and Other students

i) Access
Using the OfS dataset, it can be seen that the proportion of students of Asian, Black, and Mixed ethnicities at
Loughborough is higher than their respective proportions in the population and has been growing over the five-
year period analysed, however, this is not therefore the case for White students and the very small numbers of
students who have identified themselves in the Other category.

                                                                                                                     5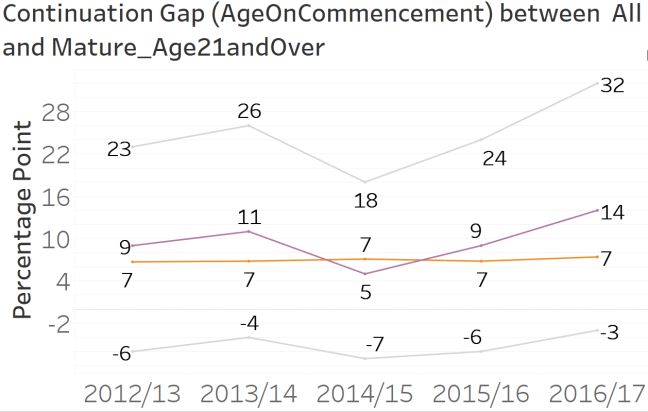
In order to better understand the position, offer making by ethnicity has been explored using UCAS’ equality
reports. These show our offer rates for White students were slightly higher (0.8% points) than expected for
2016, 2017, and 2018. Meanwhile offer rates were lower than expected for Asian students in 2016 (-2.7%
points) and 2018 (-1.5% points), and for Black students in all years since 2014 (average -4.5% points). However,
with the latter it is important to consider the underlying population. When doing so the chance of Black students
applying and becoming placed at Loughborough is higher than for White students. We believe that the lower
incidence of offers is linked to the programmes Black students are applying for and the specifics of their entry
qualifications, and the fact that the latter is not accounted for in the UCAS data.

We have considered the intersections between ethnicity, gender and HE participation. Table 1 below shows
that White students from POLAR4 quintile 1 are consistently less represented in our entrants than BAME
students from POLAR4 quintile 1 across the last five years. It is also apparent that gender is not as significant
as ethnicity at this intersection. This is likely to be influenced by the University subject profile and overall gender
balance, which is 62% male and 38% female in the student population.

Table 1: The entry rate for students from POLAR4 quintile 1 to Loughborough over a 5 year period by gender and ethnicity.

 POLAR4        Gender        Ethnicity      2013-14       2014-15       2015-16       2016-17       2017-18       Average
 quintile
                               White          6.4%          5.6%          6.7%          6.6%          5.9%          6.3%
                 Female
                               BAME           7.5%          8.7%         10.5%          9.2%         11.1%          9.5%
      1
                               White          6.2%          6.0%          6.3%          6.4%          6.6%          6.3%
                  Male
                               BAME           7.4%         10.7%          7.3%          7.5%         10.2%          8.6%

Considering these intersections between deprivation quintile and gender further using the OfS dataset, it can
be seen (Figure 7a) that there is a small gap between female and male students from quintiles 1 and 2 and a
larger gap between female and male students from quintile 3-5 which is consistent with the overall student
population. A similar analysis of the intersection between deprivation quintile and ethnicity, illustrates that the
largest component of the student population at Loughborough are White males from quintile 3-5, and that there
is no statistically significant gap in entry rates from students from quintile 1 and 2 as a function of ethnicity over
the last five years, as illustrated in Figure 7b. The above analysis demonstrates that access to
Loughborough for students of Asian, Black, and Mixed ethnicities is not an issue in comparison to their
proportion in the population overall. We will continue to monitor the participation of students from different
ethnic groups, particularly White and Other, and set targets to address them should the need arise in the future.

Figure 7: The proportion of students entering Loughborough University as a function of the intersection between gender and
deprivation quintile (a), and as a function of the intersection between ethnicity and deprivation quintile (b).

ii) Success: Non-continuation
Analysis of the non-continuation rates by ethnicity using the OfS dataset has been undertaken. We can
conclude from this that students from BAME backgrounds are not more likely to withdraw from their studies
than other students as the gaps observed for this group over the last five years are small, variable (-1 to 1%
points), and below those seen by the sector. The non-continuation gap for Asian and Mixed ethnicities is
comparable with the BAME group as a whole. However, a slightly different trend is observed for Black students
in the last 3 years of the dataset. Continuation has dropped from 97% to 96% to 93% respectively and there is
now a 4% point difference between non-continuation of White and Black students which will be monitored
closely. The absolute value of the gap in continuation rates between White and Black students across the sector

                                                                                                                            6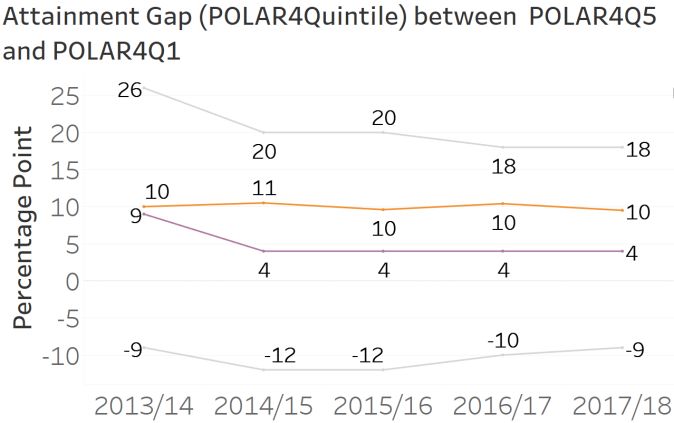
is 5-6% points across the last 3 years of the dataset, whereas the absolute value of the gap at Loughborough
is lower, being 0, 2 and 4% points respectively. However, as a potential issue has been identified, over the
course of the next 12 months we intend to investigate in more detail the gap that is emerging and develop
strategies to mitigate against the different outcomes as appropriate. If the trend continues as the data for the
following year become available, we will set a specific target in order to address this emerging gap such that
Continuation for all students returns to its previous high level.

Examination of the TEF Year 4 data indicates that whilst continuation overall has a high absolute value at 97.4%
against a benchmark of 95.5%, it is not flagged for either White or BME students. The metric for White students
is 97.5%, however, the corresponding value for BME students is suppressed from a data protection perspective
although it can be inferred from these data that the value must be very similar to that for White students and
therefore is consistent with the conclusions drawn from the OfS dataset above.
We have therefore concluded that there are no significant inequalities at the current time in terms of the
non-continuation of students from different ethnic groups at Loughborough, although we are
committed to monitoring this aspect of the student lifecycle extremely closely.

iii) Success: Attainment
A thorough analysis of the attainment gap between different ethnic groups (Black, Asian and Minority Ethnic)
has been undertaken. Across the University students from a BAME background are consistently less likely to
receive a 1st/2:1 degree compared to White students. The gap between these two groups is variable over the
time period considered, ranges from 9 to 15% points, and is statistically significant. Examination of the degree
attainment by academic School shows no systematic difference in the gap as a function of discipline – for
example, from social sciences to engineering, suggesting that this gap cannot be explained by issues directly
connected with the content of the curriculum.

 Figure 8: The observed gap in continuation as a function of   Figure 9: The observed gap in attainment as a function of
 ethnicity for students at Loughborough (purple) compared to   ethnicity for students at Loughborough (purple) compared to
 that of the sector (yellow) as a whole.                       that of the sector (yellow) as a whole.

Further consideration of the breakdown by ethnic group demonstrates that no consistent statistically significant
gaps have been identified when considering the attainment of Asian and Mixed Ethnicity students. Comparison
of the attainment of Asian and White students shows a statistically significant gap in one of the last five years
of data, 2017-18, only See Footnote 2. The absolute value of this gap across the sector is fairly consistent at ~11%
points, whereas the absolute value of the attainment gap between Asian and White students at Loughborough
is much more variable, ranging from 6 to 12% points across the period. We will investigate both the variability
and the reasons behind the gaps observed in more detail over the course of the next 12 months. As part of this,
we will explore what additional initiatives should be implemented to reduce the Asian attainment gap. In the
light of the absolute magnitude of the gap for Asian attainment, we have set a specific target to reduce the
Asian attainment gap to no more than 7% points over the next 5 years, with a view to eliminating this gap in the
future.

When we consider the gap between White and Black students, OfS’ fourth Key Performance Measure (KPM4),
we see a larger and statistically significant difference of 25% points (compared to a sector gap of 23% points)
in 2017-18 as shown in Figure 9. A number of measures are being implemented to address this Black attainment
gap, and we believe that these will also impact positively on the Asian attainment gap identified.

As referred to above, the University has developed a statistical regression analysis model with the aim of
determining which factors, if any, impact on student success when other variables are controlled for. This
research corroborates the above analysis, with BAME students found to be less likely to receive a good degree

                                                                                                                             7
when controlling for other characteristics, including tariff on entry, and this is significant for Black, Indian and
Chinese UK domiciled students.
We therefore conclude that there is a statistically significant gap in attainment between White and Black
(not BAME) students (consistent with that across the sector) and for Asian students, which will both be
the subject of further work consistent with the OfS aspirations and to meet the targets which we have
set.

iv) Progression to employment or further study
Analysis of the TEF4 metric for Highly Skilled Employment receives a double positive flag for all split metrics
(with the exception of Mature students, which is neutral and of whom we have very small numbers) and
therefore we see no statistically significant difference in the ability to progress into highly skilled employment
across the POLAR4, IMD, Gender, Disabled or Ethnicity groupings. The TEF4 metric for sustained employment
or further study is above the benchmark, including for all split metrics associated with POLAR, IMD, Gender,
Mature, Disabled (for which it is also positively flagged) and Ethnicity, and we will continue to monitor available
long-term data.

Detailed analysis of our TEF Year 4 data in respect of the breakdown of the BME groups compared to the
national benchmarks, as outlined in Table 2, shows that there is a positive flag for progression into employment
for Black students, which is not flagged for all other student groups. This is indicative of positive outcomes for
Black students at Loughborough, with an indicator of 93.9% compared to the benchmark of 91.2%, which is
only slightly less than the indicator of 94.3% for all students progressing into employment.

Table 2: Progression into employment and highly skilled employment for BAME student groups broken down from TEF Year 4
metrics.
                              Black                            Asian                              Other
                   L’boro    Benchmark     Diff      L’boro    Benchmark     Diff      L’boro     Benchmark     Diff
 Employment         93.9        91.2       +2.7       88.0         89.5      -1.5       94.2         91.6       +2.6
 Highly skilled     80.9        71.3       +9.6       78.4         73.1      +5.3       82.2         74.3       +7.9
 employment

Our internal analysis of the DLHE data indicates that in 2016-17, 94.5% of White students were in employment
or further study six months after graduation, compared to 91.1% of BAME students. However, the
corresponding average starting salary of BAME students was £550 higher than that for White students.

Despite these positive outcomes overall for students as a function of ethnicity, we have been active in closely
monitoring engagement by students from under-represented groups. This includes specifically monitoring the
number of students taking up a placement year. The placement year at Loughborough is significant, and indeed
in the most recent 2017-18 data we had the largest number of students on a year-long placement of any UK
university. Through active monitoring of our diversity data, it was noted in 2014 that there was a significant gap
between the proportion of BAME students undertaking a placement compared to White students of ~4% points.
We therefore put in place specific interventions to support BAME students to take up a placement year, which
have been successful in increasing the percentage of students from this group who go on placement from 38
to 42%. Over the same time period, however, the proportion of White students undertaking a placement year
has also increased from 42 to 49% and therefore the gap has in fact widened. Given the data-informed influence
of the placement year on overall attainment, we will continue to actively support equality of opportunity for
students to undertake a year-long placement.

From the above analysis, there are no statistically significant gaps for students from different ethnic
groups progressing into both employment and highly skilled employment, nevertheless, this is an area
which we continue to monitor closely.

1.3 Mature students

i) Access
Mature students currently make up 3% of the total undergraduate population at Loughborough. Analysis of our
admissions data shows that the proportion of applications received from mature students has been falling
exponentially over the last three cycles – 3.1% in 2017, 2.9% in 2018 and 2.2% in 2019. This decline has been
compounded by both a fall in the mature student offer rate this cycle to 38% (compared to 74% of all UK/EU
applicants) and fewer mature applicants deciding to make Loughborough their firm choice.

Loughborough’s undergraduate portfolio is comprised of entirely full-time programmes, mainly of a non-
vocational nature. In addition, the fact that we are not located in a city means the University is not particularly

                                                                                                                       8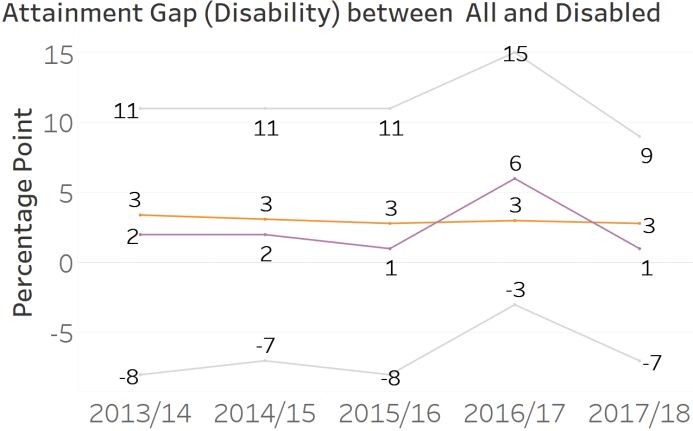
attractive to mature students who can travel less distance to their local city university. The University does not
intend to make any significant changes to our overall subject mix or mode of delivery, and therefore we do not
anticipate the number of mature learners at Loughborough increasing in the short to medium term.
ii) Success: Non-continuation
For mature students, our non-continuation rate is variable due to the small numbers involved, ranging from
5.4% to 15.8% (HESA PI) (compared to our most recent benchmark of 12.3%). We have been monitoring this
aspect of student retention for some time and note that mature non-continuation continues to be higher than
that seen for young students (comparable young non-continuation rate is 3.0%).
The difference between the non-continuation of young and mature learners is available through the OfS dataset
and shows that the non-continuation gap between these groups has increased over the last five years from 9%
points in 2012-13 to 14% points in 2016-17. Although not statistically significant due to the small numbers of
mature students we note that this gap is comparable to the sector gap which is itself statistically significant.
Detailed analysis of the split metrics in the TEF Year 4 data for Loughborough for continuation confirms the
difference between young (97.6%) and mature (90.3%) students, however, when compared to our benchmarks
for these groups of 95.7% and 88.4% respectively, it is seen that the gap in both cases is 1.9%.
Figure 10: The gap in continuation between young and Figure 11: The gap in attainment between young and
mature students at Loughborough (purple) compared with the mature students at Loughborough (purple) compared with
sector (yellow). the sector (yellow).
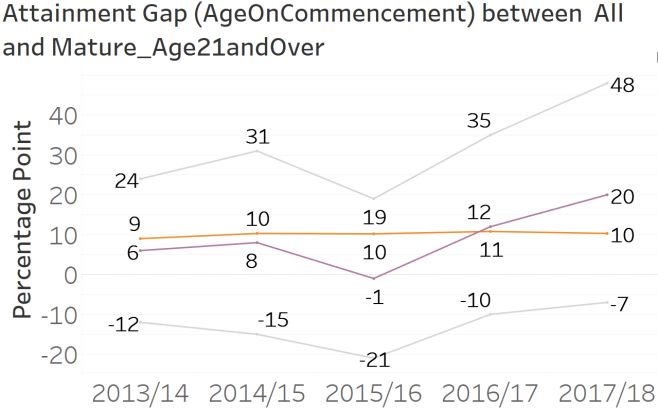
iii) Success: Attainment
Exploration of the attainment data through the OfS dataset shows that mature students are less likely to achieve
a good degree compared with young students both at Loughborough and across the sector. At Loughborough
we see the difference in attainment varying over time given the small numbers of mature learners at the
University, with a significant growth in the gap over the last three years from -1% points in 2015-16 to 20%
points in 2017-18. As with non-continuation, the gap observed is not statistically significant but is again similar
to the national gap which is statistically significant.
iv) Progression to employment or further study
Analysis of the graduate outcomes data reveals that those joining Loughborough aged 21 and over are less
likely to progress to employment/further study than those under 21. In 2016-17, 75% of mature students were
in employment or further study six months after graduation compared to 84% of young entrants. This is the
opposite to the sector as a whole, where there is a higher proportion of mature students in employment or
further study. We also know from internal data that a smaller proportion of mature students undertake a
placement year compared to young students. Further analysis using the OfS dataset indicates that the mature
student ‘progression gap’ at Loughborough has narrowed over the last five years, falling from 25% points in
2012-13 to 10% points in 2016-17, although the rate at which the gap is closing has slowed.
9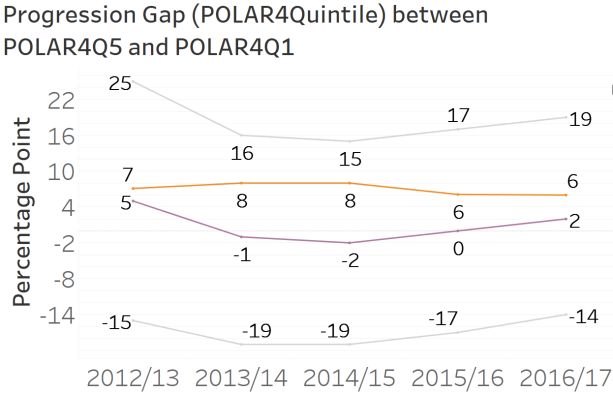
Figure 12: The gap in progression between young and mature students at Loughborough (purple) compared with the sector
(yellow).

This analysis is confirmed by consideration of our TEF Year 4 data, in which progression into highly skilled
employment for young students has a double positive flag and is significantly above the benchmark (83.3%
compared to 75.6%) whereas for mature students there are no flags, indicating that progression into
employment is in line with the benchmark (75.0% compared to 72.1%).

Given the small numbers of mature students at Loughborough, explained in the context of subject mix,
delivery mode and demographic, we note that any gaps are not statistically significant, nevertheless
we continue to monitor all aspects of the student lifecycle for mature students in order to ensure
equality of opportunity.

1.4 Disabled students

i) Access
In 2015-16, 13.3% of full-time undergraduate entrants to the University indicated that they had a disability. In
2017-18, this proportion has risen to 14.4% of all entrants (545 students). As can be seen in Figure 13 below,
just over half (51.4%) of these students have a specific learning difficulty.

Figure 13: Full-time undergraduate entrants with a known disability 2017-18 broken down by type of disability.

Loughborough is therefore attractive to students with a disability, with 9% of UK/EU applicants to Loughborough
declaring a disability. Furthermore 79% of UK/EU applicants who declared a disability have received an offer
in the current cycle compared to 74% of all UK/EU applicants. Our relevant HESA PI also corroborates this,
with 8.3% of full-time first-degree students being in receipt of Disabled Student Allowances (DSAs) in 2017-18
(compared to a benchmark of 5.8%).

ii) Success: Non-continuation
The difference between the non-continuation of students with and without a known disability is consistently
small (average ~1% point) over the last five years, as shown in Figure 14 below. This is also consistent with
the Year 4 TEF metrics which have a difference in the indicators of 1.6%, with both indicators being ~2% above
the benchmark. Considering non-continuation by type of disability we see the following trends:
• There is no discernible non-continuation gap for students with a cognitive and learning disability (ranging
    from 0% points to -2% points)
• The non-continuation gap for students with a mental health condition has increased (from 0% point to 4%
    points)

                                                                                                                  10
• There is no discernible non-continuation gap for students with a sensory, medical or physical disability
(except for in 2014-15)
• The non-continuation gap for students with multiple impairments has increased (from 2% points to 7% points)
The small numbers of students, especially when looking in depth at the nature of the disability, mean that none
of the gaps identified above are statistically significant. However, we note that a similar non-continuation gap
is seen nationally for students with a known disability and students with multiple impairments.
Figure 14: The gap in non-continuation between students Figure 15: The gap in attainment between students
with and without a disability for Loughborough (purple) in with/without a disability for Loughborough (purple) compared
comparison to the sector (yellow). to the sector (yellow).
iii) Success: Attainment
The OfS dataset reveals a 1% point difference in the number of disabled students achieving a 1 st or 2.1
compared with students with no known disability in 2016-17. Over the last five years the gap has consistently
been 1-2% points, except for in 2015-16 where there was a spike in the data. Looking at attainment by type of
disability we see the following trends since 2012-13:
• The attainment gap for students with a cognitive and learning disability has fallen (5% points to -1% points)
• The attainment gap for student with a mental health condition has increased (from 1% point to 8% points)
• There is no discernible attainment gap for students with a sensory, medical or physical disability
• Since 2014-15 there has been an attainment gap for students with multiple impairments, although this has
almost halved by 2016-17
Once again, none of the gaps observed are statistically significant or changing significantly as a function of time
although the gap between students with and without a known disability at Loughborough is comparable to the
gap across the sector which is statistically significant.
We note that OfS’ fifth Key Performance Measure (KPM5) relates to the difference in the proportion of disabled
and non-disabled students getting a 1st or 2:1. At Loughborough the gap is 1% point compared to 3% points
nationally.
iv) Progression to employment or further study
Internal analysis of our DLHE data indicates that 94.1% of Loughborough students with a known disability were
in any level of employment or further study six months after graduation in 2016-17, compared to 93.9% of
students with no known disability. Similarly, as shown in the graph below, the gaps observed for progression
into highly skilled employment or further study for students with a disability over the last five years are not
statistically significant, small, variable (both positive and negative) and broadly in line with the sector. Our
internal analysis also shows that there is no significant difference between the number of students with a
disability undertaking a placement compared to our student population as a whole.
11Figure 16: The gap in progression into highly skilled employment or further study between students with and without a disability
for Loughborough (purple) in comparison to the sector (yellow).
Using the OfS dataset we have explored the progression gap into highly skilled employment or further study for
students with different types of disability and note that:
• Whilst there is variation by year, the gap for students with a sensory, medical or physical disability is
consistently lower than for other types of disability (ranging from -5% points to 2% points)
• There is no discernible gap for students with a cognitive and learning disability (-2% points to 6% points)
• Students with a mental health condition or multiple impairments have the greatest progression gaps (average
gaps over the five year period are 5% points and 4% points respectively).
In summary, for student success and progression, relatively small numbers mean that the gaps
observed are not statistically significant. However, the gaps for students with a known disability/mental
health condition at Loughborough are comparable to the gaps across the sector, which are statistically
significant. We will continue to monitor trends in gaps, both in time and with respect to absolute values,
across the student lifecycle for students with a disability and will take action to set appropriate targets
in the future should we believe they are required to ensure equality of opportunity.
1.5 Care leavers
i) Access
We currently have less than 20 undergraduate students at Loughborough who have indicated to us that they
are care leavers. This is perhaps not surprising given that we only receive approximately 100 applications each
year from this student group, representing 0.4% of all UK/EU applications. Analysis of our admissions data
shows that care leavers are slightly less likely to receive an offer than other UK/EU applicants. The three-year
average offer rate for care leavers is 70%, whereas the equivalent offer rate for all UK/EU applicants is 74%.
ii) Success: Non-continuation / Attainment / Progression to employment or further study
Unfortunately, robust analysis of this group’s continuation, degree success or rate of progression is not possible
due to the small number of care leavers registered at the University. We continue to seek ways to assess our
performance in this area, which includes qualitative research such as structured interviews to explore the
experience of care leavers at Loughborough.
1.6 Intersections of disadvantage
As outlined in the relevant sections above, we have reviewed the intersections of potential disadvantage at
each stage of the lifecycle as part of our assessment of performance. Using internal data sources, a correlation
matrix in terms of access to Loughborough for different student characteristics has been developed as shown
in Figure 17 below.
Meanwhile the key intersections for attainment identified from the OfS dashboard are:
• Ethnicity/deprivation: White and IMD quintiles 3-5 compared with other ethnicities and IMD quintiles 1 or 2
• Ethnicity/POLAR4: For POLAR4 quintiles 3-5 white compared with all other ethnicities
• Gender/deprivation: For IMD quintiles 3-5, male compared with female
• Gender/POLAR4: For POLAR4 quintiles 3-5, male compared with female
12Figure 17: Correlation matrix showing intersections of disadvantage at the access stage of the student lifecycle.
1.7 Other groups who experience barriers in higher education
We do not have consistent and robust data on the number of students at Loughborough who are young carers
or estranged learners. We intend to look more closely at these groups once this information is available via the
UCAS application process from 2021 entry and will incorporate such measures into our review of contextual
admissions.
Loughborough University does not currently offer part-time undergraduate degrees. Those who are recorded
as studying part-time with us (2%) are completing their studies over a longer period due to disability or health-
related conditions, elite sporting commitments or are undertaking reassessment. The experiences of part-time
students are considered as part of our data analysis and monitoring in order to ensure that the specific needs
of this group are met.
We understand that commuter students – those students living at home and travelling to the University for their
studies – may face additional challenges. Analysis shows that approximately 10% of our students are in this
position. Whilst there has been no increase in the number within this category over the last three years, we
recognise the need to monitor this student group closely.
The University recruits approximately 70 students onto Initial Teacher Training (ITT) programmes each year,
which have recently been rated as Outstanding in every respect by Ofsted. Taking a three-year average, 17%
of entrants are from BAME backgrounds and 20% have a known disability (compared to 21% and 14%
respectively for the undergraduate population as a whole). Our analysis of ITT completion data indicates that
there are no significant differences by ethnicity or disability.
1.8 Summary from Assessment of Performance
This detailed Assessment of Performance has provided a clear insight into the gaps identified for each aspect
of the student lifecycle. These gaps are summarised in Table 3 below and inform the strategic aims and
objectives in the following section.
Table 3: Summary of the gaps identified across the student lifecycle.
Access Gaps for POLAR4, IMD and Ethnicity compared with the population
Continuation No statistically significant gaps
Attainment Gaps for Ethnicity, Gender (as well as the intersections of some measures) 2
Progression No statistically significant gaps
2On the basis of statistically significant gaps being consistently present over the five year period, typically in 3 or
more of the 5 years under consideration.
132. Strategic aims and objectives
2.1 Target groups
The assessment of performance has informed where we should be focussing our access and participation
activity. Table 4 below details the under-represented groups that will be targeted, and at which stage of the
student lifecycle.
Table 4: Target groups across the student lifecycle.
Access Continuation Attainment Progression
Low HE representation and
low socio-economic groups Black, Asian and low socio-
economic groups
Disabled students
The approach adopted – focussing on the recruitment of students from areas of low HE representation (KPM2)
and the Black attainment gap (KPM4) – reflects where we have identified statistically significant gaps in equality
of opportunity, and areas that we believe are the most important for the University to address.
While students with a disability are well represented at Loughborough, the small numbers mean the success
and progression gaps identified, although small, are not statistically significant. We acknowledge that the
differences observed are comparable with those identified nationally and therefore we have identified this as a
further target group.
Our student retention and progression rates do not vary significantly across all student groups. However, this
is an area where we are not complacent. We recognise the need to continue to monitor performance in this
area and act on any gaps that arise as our student population changes.
2.2 Aims and objectives
Based on these target groups, a series of strategic aims and associated objectives have been developed. The
University has set challenging targets, and the level of ambition is clear when these are considered in the
context of our current performance outlined above. The targets we have set for Access are consistent with the
OfS KPM2 and recognise the fact that the distribution of students across the five POLAR4 quintiles nationally
is not quite even, with ~18% of students in quintile 1 and 23% of students in quintile 5.
Access: Increase intake of students from areas of low HE participation/low socio-economic groups (KPM2)
• Reduce the difference in entry rates for students from POLAR4 quintiles 3,4 & 5 compared to quintiles 1 &
2 to a ratio of 3.5:1 in 4 years3
• Reduce the difference in entry rates for students from POLAR4 quintile 5 compared to quintile 1 to a ratio of
4.5:1 in 5 years
• Increase the proportion of Realising Opportunities students who are tracked into HE who will access a
research-intensive university within two years of becoming ‘HE ready’ and completing their post-16 studies
to 54% in 5 years
Attainment: Understand and explain the different attainment rates observed by ethnicity/socio-economic
group, and reduce the gaps identified (KPM4)
• Reduce the % difference between White and Black students undertaking a placement year during their
degree to be within 4% in 5 years
• Reduce the difference in degree attainment (1st and 2:1) between White and Black students to 10% points
in 5 years
• Reduce the difference in degree attainment (1st and 2:1) between White and Asian students to 7% points in
5 years
3 The inclusion of this target should not be seen as diminishing our commitment to recruiting more students from
POLAR4 quintile 1. Rather it acts as a means of monitoring progress towards achieving our quintile 5:1 target and
is in response to the statistically significant gap identified for quintile 2 students.
14• Reduce the difference in degree attainment (1st and 2:1) between students from IMD quintiles 3,4 & 5
compared to IMD quintiles 1 & 2 to 7% points in 5 years
Student Success: Understand and reduce any inequalities for students with a disability in terms of student
success; these gaps are not statistically significant at Loughborough
• Use our unique reputation for sport to engage young people with a known sensory, medical or physical
disability and promote their progression to and success in HE, with a target to increase the proportion of
new entrants from this group by 75% over 5 years
Continuation: This is a current area of strength for Loughborough, nevertheless, understanding the need to
monitor any emerging gaps, as well as our role contributing to performance nationally, we will continue to:
• Monitor student continuation across all groups and act where any issues are identified
Progression: This is a current area of strength for Loughborough, nevertheless, understanding the need to
monitor any emerging gaps, as well as our role contributing to performance nationally, we will continue to:
• Monitor progression into employment across all student groups and act where any issues are identified
3. Strategic measures
3.1 Whole provider strategic approach
Overview
Loughborough University’s strategy, Building Excellence, sets out a vision around four strategic drivers:
Investing in our staff; Educating for success; Growing capacity and influence; and Raising standards and
aspirations. Fully embedded into this strategy is a desire to identify and attract the most able students,
regardless of their background, and provide them with an outstanding academic and student experience.
Institutional commitment and increased awareness about the inequalities that exist at Loughborough across
the student lifecycle have enabled the University to progress from having ‘individual champions’ to ‘pockets of
excellence’. Plans to further raise the profile of access and participation work and create a truly ‘inclusive
institution’ are being developed using the insights gained through Liz Thomas’ research into the whole provider
approach to widening participationii.
Many of our strategic measures outlined below are under-pinned by an overarching theory of changeiii. There
are however some areas where there is a need to evaluate and/or undertake further research to establish the
most effective and appropriate way to drive forward change and evidence each of the steps comprising the
appropriate logic chain. The strategic measures which we are proposing to take have also been informed by a
peer analysis using the OfS dataset of other providers with a similar demographic and discipline mix.
Alignment with other strategies
i) Equality, diversity and inclusion (EDI): The University’s EDI Strategy is focussed on the provision of a
working, learning, social and living environment in which all members of our community can achieve their
potential, are valued, recognised, supported and celebrated. We see a shared vision and overlapping
relationship with our Access and Participation Plan in understanding and improving the experience of students
from under-represented groups and groups with protected characteristics. This can be demonstrated by the
priorities set out in the 2019-20 EDI Action Plan which include addressing the Black student attainment gap as
well as closely monitoring the potential attainment gap for students with a disability.
Through the strategy the principles of equality will be embedded in all ways of working, studying and living at
Loughborough. As part of this commitment the University has recently introduced mandatory unconscious bias
training for all staff and the monitoring of data by protected characteristic features in the University’s governance
arrangements. We will also improve our practices and policies through actively working towards national awards
on EDI such as Athena SWAN, Race Equality Charter and Disability Confident.
ii) Learning, teaching and assessment: Under the strategic theme of ‘Educating for Success’, the University
has stated that it will develop students as individuals, enhancing their capabilities as creative, confident and
adaptable 21st Century citizens who will make a significant contribution to global society. Student engagement
is a fundamental element of academic life at Loughborough. We have a framework for student opportunities
within and beyond the curriculum that recognises students as partners in learning; skilled assessors of their
15academic experience; valued and informed advisors of educational developments; and critical appraisers of
innovative approaches to learning and teaching.
Supporting and retaining students from all backgrounds is integral to our approach to learning, teaching and
assessment. Reporting to the University’s Learning and Teaching Committee, an Equality and Diversity
Working Group designs targeted interventions in order to address specific inequalities identified as a result of
quantitative data analysis and qualitative evidence gathering. This enables the University to take a strategic
and data-driven approach to improving student success and progression from a variety of backgrounds.
We are committed to providing an educational environment in which students are inspired by their university
experience, are clear about the skills and attributes they have developed within and beyond the curriculum, and
can articulate them with confidence. The success of our strategic approach was confirmed by the Gold rating
in TEF Year 2, awarded in June 2017.
iii) Sport: There is also alignment between our access and participation work and our Sport Strategy with a
focus and investment on supporting disabled students to engage with and excel in sport. Disabled athletes are
often required to make a choice between their sport and higher education, as the challenges of combining the
two are greater than those for non-disabled athletes. We will use our reputation and facilities to remove this
dilemma for these students by providing opportunities and an appropriate environment for them to succeed in
both. In addition, we continue to use our unique position for sport to engage young people, develop their skills
and promote higher education as part of outreach activities.
Strategic measures
Given the extent of the gaps identified in our assessment of performance we intend to rigorously evaluate all
current activity in line with our stated aims and objectives, as well as invest in targeted new initiatives to enable
the achievement of the targets set. A summary of the strategic measures that the University is currently
employing and intends to initiate across the lifecycle are outlined in Table 4 and more detail is provided below.
Table 4: Summary of strategic measures linked to our strategic aims and objectives.
Access Continuation Attainment Progression
SportMAD Review of induction and Personal tutors and peer Placement support
REACH Partnership student communication assisted learning Micro internships
Subject-focussed Reassessment bootcamp Inclusive teaching
masterclasses / residentials Well-being advisers Mathematics learning
Subject in a Box support
Mathscard Anonymised marking
Mentoring Black and Asian student
engagement
Young carer support
Learning analytics
Contextual admissions and
applicant support
Realising Opportunities
Personal Best
Foundation courses
Teacher CPD (eg LUMEN)
Para sport initiatives
Adjustments for students with a disability
i) Pre-application and admissions routes
For many years, Loughborough has engaged in a wide range of initiatives that support the progression of
students from under-represented groups into higher education. Central to this work is the adoption of a theory
of change model focussed on enrichment of the curriculum and/or attainment-raising leading to improved GCSE
and A Level attainment as outlined in Figure 18. Initiatives include subject-specific resources and experience
days on campus (ie Subject in a Box, mathscard), and student mentoring directed toward Year 11 students
ahead of their GCSE examinations. Furthermore, the University is engaged in Continuous Professional
Development programmes for teachers, including the development of a new network for mathematics teachers.
16You can also read