KFW SME PANEL 2019 AFTER A RECORD YEAR, DARK CLOUDS ARE GATHERING - SMES BETWEEN ALL-TIME HIGHS AND RECESSION FEARS - KFW RESEARCH

Page created by Judith Hamilton
 
CONTINUE READING
KFW SME PANEL 2019 AFTER A RECORD YEAR, DARK CLOUDS ARE GATHERING - SMES BETWEEN ALL-TIME HIGHS AND RECESSION FEARS - KFW RESEARCH
KfW Research

     KfW SME Panel 2019
After a record year, dark clouds
are gathering – SMEs between
all-time highs and recession
fears
Annual analysis of the structure and
development of SMEs in Germany

Imprint
Publisher
KfW Group
Economics Department
Palmengartenstrasse 5-9
60325 Frankfurt/Main
Phone +49 69 7431-0, Fax +49 69 7431-2944
www.kfw.de

Editor
KfW Bankengruppe
Economics Department
research@kfw.de

Dr Michael Schwartz
Phone +49 69 7431-8695

Copyright cover image
Source: Getty Images / Photographer: YouraPechkin

Frankfurt/Main, October 2019
After a record year, dark clouds are gathering
– SMEs between all-time highs and recession fears

Abstract                                                   the momentum is slowing down noticeably as the
Germany’s SMEs have broken one record after an-            long-running upturn appears to be gradually coming
other. The strong domestic economy allowed small           to an end. Moreover, trade conflicts harbour consid-
and medium-sized enterprises (SMEs) to grow at             erable downward risks to the business cycle and un-
record pace again last year. The year 2018 saw their       certainty is currently high.
strongest turnover growth in seven years, another
employment record and persistently high levels of          Along with the significant cyclical slowdown in Ger-
investment. They continued to make an outstanding          many, that forebodes the end of the record years for
impression overall.                                        the SME sector, even if on a very high level for now.
                                                           Nevertheless, the dark clouds on the horizon are
Specifically, the KfW SME Panel 2019 has shown             now difficult to overlook.
that the services sector is the mainstay of persistent
job growth, steadily growing in importance for the la-    Jobs in the SME sector: another record high
bour market. SMEs’ overall turnover has continued         Employment in the SME sector has grown from
to expand. The construction industry has posted par-      strength to strength in the past years. This record-
ticularly strong gains, while manufacturing is show-      breaking run also continued in 2018. Small and medi-
ing signs of weakness.                                    um-sized enterprises (SMEs) broke the employment
                                                          record they set in the previous year and further ex-
Profitability remains steady on a high level. However,    panded their relevance as employers for the overall
large enterprises continue to have problems earning       economy. At the end of 2018, 31.7 million people were
profits while micro-businesses are becoming more          employed by small and medium-sized enterprises in
profitable. The equity ratio remains on a high level.     Germany. That was an increase of 391,000 workers or
The signs are growing that the long-running build-up      1.3% on the previous year (Figure 1).
of companies’ equity ratio could come to an end.
                                                          In the aggregate economy, the workforce has now
Investment growth is continuing. New investment in-       been growing for the past twelve years. At the end of
creased for the fifth year running. The number of         2018 a total of 45.1 million people were gainfully em-
SMEs undertaking investments is clearly growing.          ployed in Germany. That was 604,000 gainfully em-
Capacity expansions continue on an above-average          ployed persons more than in the previous year, a 1.4%
level. The average size of investment projects also       increase.1 At the heart of this ongoing employment
remains on a high level and investment activity is        growth of the past years were, without a doubt, small
heavily shaped by service providers.                      and medium-sized enterprises, which recorded 5.5 mil-
                                                          lion more employees since 2006.
Last year, the financing environment was reflected in
investment finance activity more clearly than ever.       This strong dynamic has made SMEs increasingly im-
Borrowing surged to an all-time high, driven by long-     portant for the labour market in Germany. Their share
term bank loans. The number of borrowers remained         in aggregate employment has grown gradually and is
constant, however, meaning the ticket size jumped         now at a very high 70.3% (Figure 1, right). The side-
accordingly. This was helped by an historically low       ways movement over the past years is unsurprising
application denial rate, as loan negotiations were        given the high level already achieved.
highly successful. Micro-businesses are gaining
strength. As borrowing increased, SMES have been          Employment growth will not cease in 2019 either
using fewer of their own resources and retaining re-      SMEs will continue to hire workers for the remainder of
serves they built up in the past.                         this year as well and fulfil their role of job engine, as in-
                                                          dicated by the employment expectations they have
A look at the past year once again reveals all-time       formulated: Around 17% of SMEs want to increase
highs. It is true that SMEs will continue on the growth   their workforce this year, as opposed to some 10% of
path they embarked on in 2019 as well. Employ-            SMEs planning redundancies. The balance is similar to
ment, turnover and investment will continue to ex-        that of previous years.
pand amid continuing good financing conditions. But
KfW Research

Figure 1: Employment in SMEs
Persons employed in the SME sector (left) / share of SME sector in aggregate employment in Germany in per cent (right)

                                                                         31.7 million                                                                70.4 70.3

                                                                                                                      68.5                 68.7
                                                                        31.3 million                                         68.5   68.3
                                                                                               67.9   68.0
                                                                                        67.6
                                                         29.5 million
                                                                                                             66.6

                                                       28.6 million
                                               28.1 million
     26.5 million                   27.2 million

                            26.2 million

Source: KfW SME Panel 2002–2019.

Aggregate employment growth in Germany was 0.8%                                         already been strong previous years (Figure 4).
year-on-year at the end of July 2019.2 That was a work-
force of around 45.1 million people and lower growth                                    One factor that contributed substantially to the stronger
from the same time in the previous year (July 2018:                                     momentum last year was the 2.4% growth in full-time
44.7 million / +1.3% year-on-year). In other words: The                                 employment in the SME sector. By contrast, part-time
pace at which new jobs are being created is slowing                                     employment in SMEs decreased by 1.6%. This is re-
down. Realistically, around 250,000 new jobs (net) can                                  markable because part-time employment recently grew
be expected in the SME sector in 2019. In all probabil-                                 strongly several times, by 5% and 6% in the preceding
ity, the mark of 32 million workers will not be reached.                                years. The latest development is most likely just a
                                                                                        snapshot.
Services are the linchpin of the most recent jobs
boom                                                                                    In a more long-term perspective, however, it is clear
Services were the cornerstone of employment growth                                      that part-time employment has grown in importance in
in SMEs in 2018 (Figure 2). Both providers of                                           general (Figure 3, left). Between 2006 and 2018 – the
knowledge-intensive services3 (4.3%) and other ser-                                     period of the current employment boom – the number
vices4 (4.2%) achieved their highest employment                                         of part-time jobs increased by 52%. The number of full-
growth in more than ten years in 2018. This drives the                                  time jobs grew by a mere 15% during the same period.
development in the entire SME sector. The full-time                                     This development is a reflection of a general trend in
equivalent (FTE) employment growth rate5 was 3.3%                                       Germany. The number of hours worked has been de-
on average across the SME sector. That means the                                        creasing in the long term (Figure 3, right) despite
momentum has picked up once again from what have

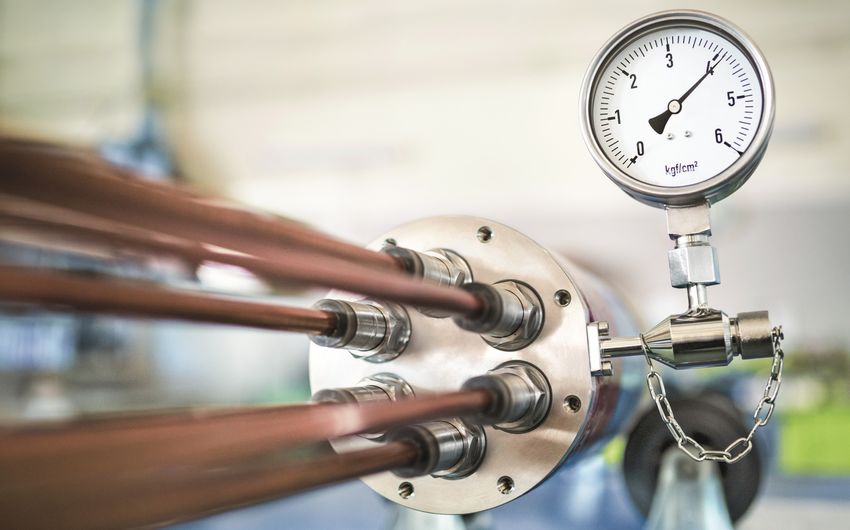
Figure 2: Annual employment growth in SMEs by sector since 2010
7%

6%

5%

4%

3%

2%

1%

0%

      R&D-intensive manufacturing          Other manufacturing                 Construction       Knowledge-intensive services      Other services

Source: KfW SME Panel 2011–2019.

Page 2
KfW SME Panel 2019

Figure 3: Significance of employment arrangements and working hours
Left: Ratio of full-time equivalent jobs to part-time equivalent jobs in SMEs / right: Hours worked each year per worker in Germany

       2.84                                                                                                       1,600
                                                                                                                          1,565

                                                                                           2.15                   1,500

                                                                                                                  1,400
                                                                                                                                                                  1,362

                                                                                                                  1,300

Sources: KfW SME Panel 2007–2019; national accounts.

simultaneous employment growth. This is mainly due to                                                                growth rates in these two segments exceeded the cor-
the growing significance of flexible working time mod-                                                               responding multi-year mean6 by far and, at 6.1 and
els, which SMEs are also embracing.                                                                                  8.0% respectively, were the highest of the past
                                                                                                                     14 years (for details see the related Volume of tables7 –
SMEs’ turnovers are on a high level and still                                                                        for an overview see Figure 5). The fast pace of growth
climbing.                                                                                                            of micro-businesses in particular is driving the overall
The strong domestic economy of the year 2018 has                                                                     development, as 81% of all SMEs make up this seg-
again helped the generally domestically oriented SMEs                                                                ment alone. Given the persistent boom in residential
to accelerate the pace of turnover growth. Consump-                                                                  construction, the high growth rate of construction SMEs
tion and residential construction were the main pillars                                                              is hardly surprising.
of economic growth in the past year. SMEs’ turnover
grew by an average 4.9% year-on-year. That was the                                                                   Enterprises from the two sub-segments of the manu-
highest growth rate of the past seven years (Figure 4).                                                              facturing sector, on the other hand, are showing mod-
At the same time, the overall picture also shows that                                                                erate signs of weakness. Turnover growth rates remain
none of the SME segments has returned to pre-crisis                                                                  positive but significantly below the previous year’s lev-
growth rates. Aggregate domestic turnover is currently                                                               els (see also Volume of tables). R&D-intensive manu-
at around EUR 4,100 billion.                                                                                         facturing SMEs in particular saw their average growth
                                                                                                                     rate slashed by nearly half (from 6.0 to 3.8%).
Figure 4: Annual employment growth and turnover
growth rate                                                                                                          E-commerce in SME sector exceeds
In per cent                                                                                                          EUR 250 billion
                                                                                                                     The intensification of digital business processes is in-
      10.0                 9.4
                                                   8.1                                                               creasingly being reflected in SMEs’ turnover. In the
                                 7.6      6.7                                                                        year 2018 their e-commerce turnover reached
                     5.2                                                                         4.7                 EUR 255 billion.8 This includes, for example, digital
                                                                                        3.9                 4.9
4.4
               4.3                                                        3.3    3.3                                 market places, online shops, procurement platforms
                                            2.5                  2.4                                        3.3
                       2.8
                                    0.4            2.6                    2.8            2.7          2.7
                                                                                                                     and automatic data exchange between enterprises.
                                                           2.1     1.9           2.3
0.8                                                                                                                  That is a 27% increase in the digital sale of products
      2005   2006    2007    2008   2009    2010    2011    2012   2013   2014   2015   2016   2017    2018
                                                                                                                     and services since the last survey in the year 2016,
                                                                                                                     when it was EUR 201 billion (2015: EUR 153 billion).
                                                                                                                     The current high growth rates result from the fact that
                                                                                                                     this is still a relatively new sales channel for SMEs
         Employment growth                      Turnover growth
                                                                                                                     whose potential has not yet been fully harnessed.
Source: KfW SME Panel 2006–2019.

Micro-businesses and construction firms set rec-                                                                     Around 800,000 SMEs – 21% of all SMEs – generated
ords, industrial SMEs show signs of weakness                                                                         turnover via e-commerce. The contribution of e-
The current cyclical upturn is particularly beneficial for                                                           commerce to an enterprise’s total turnover has recently
the turnover of micro-businesses with fewer than five                                                                grown continuously. It increased from a share of 20%
employees and SMEs in the construction sector. The                                                                   in 2015 to 23% in 2016 and reached 26% in 2018 – for

                                                                                                                                                                      Page 3
KfW Research

enterprises that generated any online turnover. The                      balance between optimistic and pessimistic responses
fact that the next generation of entrepreneurs is adapt-                 smaller (+3 percentage points vs. +18 percentage
ing their business models more strongly to e-commerce                    points in the entire SME sector).
indicates it will gain further importance. Its contribution
to turnover already averages 54% for young SME own-                      Dark clouds up ahead: Current indicators signal a
er-managers (under the age of 40).                                       slowdown in SMEs’ business activities
                                                                         More recent indicators are putting the optimism which
A relatively small group of very online-oriented                         SMEs expressed during the survey period of the
businesses accounts for the lion’s share of                              KfW SME Panel (spring 2019) into perspective. It ap-
e-commerce turnover. SMEs that generate at least                         pears the record run is coming to an end – alongside
half of their overall turnover via e-commerce account                    the clear economic slowdown in Germany since spring.
for EUR 168 billion or two thirds of all e-commerce
turnover alone. They achieve an average 55% of all                       The KfW-ifo SME Barometer shows an above-average
their turnover via this channel. The bulk of online turno-               decline in SME business sentiment at the end of sum-
ver in the SME sector overall (at least an estimated                     mer and the start of autumn 2019 (Figure 7).10 Small
90% or EUR 226 billion) presumably takes place in                        and medium-sized enterprises have long proven to be
business-to-business (B2B) operations. Direct busi-                      relatively resilient to business cycles, while sentiment
ness-to-customer transactions (B2C) with e-commerce                      among large enterprises has been characterised by
in SMEs are estimated at EUR 25 billion.                                 considerable pessimism for quite some time now. That
                                                                         negative sentiment, however, has now started to spill
SMEs will (probably) continue on a path of growth                        over to SMEs with some delay. The crisis is also likely
in 2019 as well                                                          to envelop SMEs in the medium term.
SMEs’ turnover expectations up to the year 2021 are
consistently positive (Figure 6). Significantly more                     Irrespective of a minimal improvement at the current
SMEs expect their turnover to rise (35%) than to fall                    margin11, SMEs’ business situation assessments and
(17%).                                                                   expectations for the coming six months have recently
                                                                         been much lower and the trend has accelerated.12 With
Nevertheless, the growth driver of the year 2018                         a view to economic performance, this points to a dim
– small and medium-sized construction firms – will                       second half year, as a technical recession – defined as
probably not be able to maintain the fast pace. They                     at least two consecutive negative quarterly growth
will likely increasingly reach the limits of their capacities            rates – seems almost inevitable. The main cause of
and the skills shortage will also act as a brake. This is                this is external weakness (a sluggish global economy,
already becoming apparent, as project completions are                    escalating trade conflicts and enormous Brexit uncer-
decoupling from pent-up building approvals and orders                    tainties) which has now spilled over into the domestic
received.9 Perhaps the affected SMEs’ turnover expec-                    economy.
tations already reflect this: In no other segment is the

Figure 5: SME turnover (left) and employment growth (right) by segment
Growth rates in per cent

                  Total SMEs                         4.9                                                   3.3

     Fewer than 5 employees                   6.1                                              2.1
             5 to 9 employees                                      3.4                           2.5
           10 to 49 employees                 6.0                                                                  4.2
         50 or more employees                             4.5                                                3.6

R&D-intensive manufacturing                                      3.8                                   3.1
          Other manufacturing                              4.3                                       2.7
                 Construction      8.0                                                          2.3
Knowledge-intensive services                              4.6                                                      4.3
                Other services                      5.1                                                            4.2

Source: KfW SME Panel 2019.

Page 4
KfW SME Panel 2019

Figure 6: SMEs’ turnover expectations up to 2021 (compared with the year 2018)
In per cent

R&D-intensive manufacturing                        11                  47                                 43
         Other manufacturing                 15                        50                             36
                   Construction    19                             60                            22
Knowledge-intensive services                      15                    46                             39
                 Other services          20                            47                            33
                          Trade              18                        48                                 43

     Fewer than 5 employees              18                            49                            33
              5 to 9 employees               13                        51                             36
          10 to 49 employees                           11               44                                 45
       50 or more employees                                  10              35                                 55

   Business under 5 years old                                7               37                                  57
               5 to 10 years old                        15                   37                             48
              10 to 20 years old         16                        52                                32
       More than 20 years old       21                             54                           25

                    Freelancers              21                         45                           34
                   Craftspeople         17                         54                            29
              Other professions                   14                   47                              38

                    Total SMEs               17                        48                             35
                                                  Falling               Consistent                   Rising

Source: KfW SME Panel 2019.

Further indicators on business development also show                        or three percentage points since then.
deteriorating confidence on various levels – although it
remains high: Orders have been weakening slightly                           Figure 7: SME business climate
(especially in manufacturing), turnover and revenues                        In balance points
are not increasing as much and SMEs’ hiring plans are
becoming more cautious.13                                                     30

                                                                              25
The bottom line is that SMEs are facing a year of un-
certainty. The long-running upturn appears to be grad-                        20
ually coming to an end. Despite the many records bro-
                                                                              15
ken last year, there are dark clouds on the horizon.
                                                                              10
Profitability increased slightly on what is already a
                                                                                  5
high level
Small and medium-sized enterprises have recovered                                 0
the minor losses in profitability of the previous year.                       -5
The average profit margin14 in the SME sector rose
moderately by 0.2 percentage points to 7.4%. After a                         -10
moderate decline was recorded last year for the first                        -15
time in eight years (and a stagnation in the previous                           2015         2016                2017    2018       2019
year), this minor increase is a welcome one.                                           Business climate                 Situation
                                                                                       Expectations
SMEs’ profitability has thus remained virtually un-
                                                                            Sources: KfW-ifo SME Barometer, KfW Research, ifo Institute
changed since 2015. However, the longer-term trend is
extremely positive. In 2006, the mean profit margin was
a mere 4.4%. It has thus improved by around two thirds

                                                                                                                                       Page 5
KfW Research

The considerable improvements of the past years are            panies have exhibited disproportionately and consist-
reflected not just in the average but in the overall distri-   ently high workforce growth in the past years (Fig-
bution as well. Significantly more SMEs have a higher          ure 2). Their headcount grew at an enormous pace in
profit margin and notably fewer SMEs have a lower              2018 in particular. The related increase in human re-
one. This is mainly the result of robust turnovers and         sources expenditure may be the reason their profitabil-
turnover increases achieved by SMEs in the past                ity virtually slumped despite strong turnover growth
years:                                                         (Figure 8, right). The profitability of SMEs in the
                                                               knowledge-intensive services sector was 11.6%, three
‒ At present, 60% of enterprises have a high profit            percentage points below the previous year’s level
  margin in excess of 10%, which only 43% of enter-            (2017: 14.6%).
  prises achieved in 2006.
                                                               Labour productivity up slightly, bolstered by indus-
‒ At the same time, the share of SMEs with a nega-             trial SMEs
  tive profit margin dropped to now 9%, down from a            The relatively strong turnover increases in the SME
  very high 21% in 2006.                                       sector (highest growth rate of the past seven years)
                                                               provided moderate impetus to labour productivity15.
Profit margins rose in construction and micro-                 Average turnover per full-time equivalent employee in-
businesses but are weak among knowledge-                       creased by around 2.5% after a slight drop in the previ-
intensive service providers and large SMEs                     ous year and is now at around EUR 126,000.
The massive turnover growth achieved by SMEs in the
construction sector saw their profits rise (Figure 8, right    Labour productivity across the SME sector has there-
side). Their profitability reached a very high rate of 8%      fore been moving virtually sideways for nearly ten
on average (+0.9 percentage points on the previous             years with only minor variations. Especially in the re-
year). Micro-businesses benefited from good turnover           cent past, businesses in the knowledge-intensive ser-
figures as well and in 2018 were more profitable than          vices sector and small SMEs in particular achieved no
ever before. The mean profit margin of SMEs with few-          or no significant productivity gains at all (Figure 9).
er than five employees was 15%. As with turnover, it is
these two business segments that determine the rate            Because of their high numbers, the key figures from
across the overall SME sector.                                 these two segments are crucial to the development of
                                                               the entire SME sector. A total of 1.51 million SMEs
The profit margins of individual segments in the SME           alone are classified as knowledge-intensive service
sector reflect the variations in their turnover. This be-      providers and 90% of all SMEs are micro-businesses
came clear in 2018 but not just in a positive sense. In        or small SMEs. The more the sectoral transformation
the meantime, large SMEs continue to have problems             shifts in favour of the services sector, the more closely
earning profits. Profit margins of SMEs with 50 and            aggregate productivity is coupled with the growth of
more employees failed to increase for the fourth year in       small service providers. In the aggregate analysis, the
a row. This is the enterprise size class with the lowest       much more productive segments (e.g. R&D-intensive
profitability growth since 2005 (Figure 8, left). Their        manufacturing16 or SMEs with 50 and more employees)
profitability has shown an almost continuous sideways          hardly make a difference.
movement since 2012.
                                                               Structural productivity gap has remained nearly
Not so the micro-businesses. On balance, the gap is            unchanged for the past 16 years
widening further, as small SMEs were around 3.6 times          Productivity reached 97 index points on average in
more profitable than large SMEs in 2018. But this is al-       2018 (2017: 94; base year 2003=100 index points).
so a matter of commercial necessity because smaller            The aggregate productivity gains were largely spread
businesses cannot or hardly benefit from economies of          out, as most segments experienced increases. The
scale because their batch sizes tend to be smaller. In         structural productivity gap17 between large and small
addition, large SMEs in particular have hired a dispro-        SMEs widened slightly for the second consecutive year
portionately high number of workers in the past years          and was 33% in 2018. In other words, micro-busines-
(see Volume of Tables). This workforce growth may              ses achieve around 67% of the labour productivity of
have involved a disproportionately high increase in            large SMEs.18 That rate has been nearly unchanged
human resources expenditure.                                   since 2003. Micro-businesses therefore have had
                                                               roughly the same structural productivity gap with large
The same rationale might be applied to businesses in           SMEs for the past 16 years.
the knowledge-intensive services sector. These com-

Page 6
KfW SME Panel 2019

Figure 8: SME profit margins by size class (left) and industry (right)
Size class by number of full-time equivalent employees, figures in per cent
                                                                            15.0                                                                         14.6
                                                                     14.6                                                  12.8         12.8
                                                             13.8
                                                                                                                                                                 11.6
 9.9        9.7                                                                      9.2
                                           11.4
                                                                                                                                         7.9                     8.0
                                                            7.3             7.4                                                                    7.1
                                                                    7.2                                             6.6
             5.6                                                                                                                         6.0        5.5         5.9
                                                            5.4             6.2                                                   5.3
  5.4                   5.1                       4.9               6.1              4.6                                    4.8                                  5.4
                                                                                   4.3                      4.4
             3.9                                                                                                                           5.2
                                                                            4.2    4.1
3.6                                                         4.5     4.2
                                                  4.2                                                                                    4.0        3.9    3.8
  3.3                   3.1                                                          3.2                    3.0

        Fewer than 10              10 to 49                                                R&D-intensive manufacturing             Other manufacturing
        50 or more                 Total SMEs                                              Construction                            Knowledge-intensive services
                                                                                           Other services                          Trade

Source: KfW SME Panel 2006–2019.

Figure 9: SME productivity by size class (left) and sector (right)
Size classes by number of full-time equivalent employees

                                                                                                                                                                142

                                                                          117                                                                                   122

                                                                            113                                                                                 114
                                                                                                                                                                109
                                                                            97
                                                                            95

                                                                                                                                                                 76

                                                                                             R&D-intensive manufacturing            Other manufacturing
        Fewer than 5          5 to 9                    10 to 49
                                                                                             Construction                           Knowledge-intensive services
        50 or more            Total SMEs                                                     Other services

Notes: The figure shows indexed values (2003=100) of labour productivity (turnover per full-time equivalent employee), missing data on turno-
ver and employees were imputed.

Source: KfW SME Panel 2004–2019.

No end in sight to the investment boom: New                                          on the previous year). In the aggregate, the volume of
investments were up sharply in 2018                                                  total investment in the SME sector thus increased by
Small and medium-sized enterprises again invested                                    EUR 9 billion (4.3%) and is now a nominal
more in 2018 than the year before. The ongoing in-                                   EUR 220 billion. That is the highest level recorded in
vestment boom thus continued for the fifth consecutive                               the KfW SME Panel since 2003.
year. SMEs’ investments in new plant and buildings
(gross fixed capital formation or new investments) were                              The share of capacity expansion investment was high
up by EUR 8 billion or 4.5% last year, another strong                                again last year (54%). The volume of funds invested in
increase. New investments by SMEs thus totalled                                      replacement acquisitions was 36% (Figure 11). It is
some EUR 184 billion.                                                                known from previous analyses that when businesses
                                                                                     expand capacities, their total investment expenditure is
At the same time, investments in second-hand goods                                   higher on average than for pure replacement invest-
rose slightly by EUR 1 billion to EUR 36 billion (+2.9%                              ments. This pattern is also evident in 2018 (Figure 12).

                                                                                                                                                           Page 7
KfW Research

Figure 10: New investment in the corporate sector                                          Figure 11: Types of investment in the SME sector
in Germany                                                                                 Percentage of investment volume
EUR in billions; SME size class by number of full-time equivalent
employees                                                                                     12       11     10     8       8     6     9             8          7   10
                                                                                                                                               14
450
                                                                                                                             36   44     38            35     36      36
                                                                                              34       39     41    41
400                                                                                                                                            36
350

300                                                                                  235
                                                                               223
                                                                         211
250                                                                205
                             169               179 191 190
                                                           194
                                                                                              54                    51       56   51     53            57     57      54
                       176               164                                                           50     49                               50
200              165               148
       144 150
150
                                                                         74    76    80
                             65                               60   77
100              47    60          64    62    75   67   59                                  2008 2009 2010 2011 2012 2013 2014 2015 2016 2017 2018
       53   57
                 29    31    37                               41         41    42    48
       21   27                     33    29    35   38   35        41
 50                                                                                           Capacity expansion             Replacement acquisitions         Other
       43   39   52    48    55    35    45    37   37   42   49   38    50    52    48
   0                                                                                       Note: The category ‘Other’ comprises, inter alia, innovation, rationali-
       2004 2005 2006 2007 2008 2009 2010 2011 2012 2013 2014 2015 2016 2017 2018
                                                                                           sation, renovation, restructuring and repairs.
  Small SMEs (fewer than 10 employees)          Medium-sized SMEs (10 to 49 employees)
  Large SMEs (50 or more employees)             Large companies
                                                                                           Source: KfW SME Panel 2009–2019.

Note: The extrapolation by employment size class of SMEs does not                          Figure 12: Average volume invested by an enter-
include companies of the remaining sectors. Consequently, the indi-                        prise, by type of investment
vidual data on new investment undertaken by the SME size classes
do not add up to the total sum of new investment (gross fixed capital                      EUR
formation) shown in the text.                                                              250,000

Sources: KfW SME Panel 2005–2019; national accounts (as at                                 200,000
10 September 2019).
                                                                                           150,000
The face of the sectoral transformation: service
providers are investing the most                                                           100,000

Services again dominated investment volume, as                                              50,000
SMEs from services industries invested more in 2018
                                                                                                   0
than ever before. Enterprises offering knowledge-                                                       2012             2018     2012          2018       2012            2018
                                                                                                             Investment in          Investment in         Investment in
intensive services, in particular, invested an all-time                                                     expansion and          expansion only       replacements only
high of EUR 67 billion. One explanation for this is the                                                     replacements

fact that SMEs in this segment generally invest higher                                     Source: KfW SME Panel 2013–2019.
sums per full-time equivalent employee. In 2018 this
measure (also known as investment intensity) aver-                                         As investment expenditure grows, so does the
aged EUR 10,600. Construction firms, on the other                                          number of investors
hand, invest only EUR 5,600 per FTE employee. Manu-                                        Last year the number of investing SMEs increased
facturing SMEs also remain far below these levels.                                         along with the growth in investment expenditure. The
Across the entire SME sector, businesses currently in-                                     investment propensity – i.e. the share of SMEs with in-
vest approx. EUR 8,400 on average per FTE employee                                         vestment projects – increased or at least remained the
(see Volume of tables for details from each segment).                                      same in nearly all SME segments in a year-on-year
                                                                                           comparison (Figure 13). The share of investing SMEs
Service industries accounted for 55% of new invest-                                        increased overall by four percentage points to 42% in
ment (EUR 101 billion) and also 55% of total invest-                                       2018. The ‘slump’ of the year 2017 was hence offset by
ment (EUR 122 billion). For comparison, the long-term                                      SMEs’ increasing investment propensity. Some
average of both rates is approx. 47% (2004–2017). In                                       1,580,000 enterprises invested – around 180,000 more
2004 the share of services in total investment and new                                     than before.
investment was just 42%. In other words, in the past
15 years the relative importance of service enterprises                                    However, recent developments should not obscure the
for SMEs’ investment activity has grown by nearly one                                      longer-term trend of more dampened investment pro-
third.                                                                                     pensity in the SME sector. In the years 2006 to 2008,

Page 8
KfW SME Panel 2019

more than one in every two enterprises invested – a                  EUR 500 million also succeeded in at least offsetting
rate unmatched since then. It is not least the sharp de-             the loss in value of their capital stock with sufficient
cline in the investment propensity of micro-businesses               new investment last year. Their new investment now
(firms with fewer than five employees) compared with                 increased by EUR 12 billion to a nominal
other segments that is keeping the aggregate share of                EUR 235 billion. The volume of depreciation was on an
investors in the SME sector low. But even the rather in-             identical level, which puts large enterprises’ net in-
vestment-prone manufacturing enterprises have also                   vestment at zero. That makes 2018 the first year with
exhibited a diminishing investment activity over time                no loss of value (negative net investment) for large-
(Figure 13, right side).                                             scale enterprises since 2012 and only the fourth year
                                                                     since 2004.
Project size remains (nearly) unchanged on a high
level                                                                Aggregate gross fixed capital formation of the corpo-
The pool of investing enterprises has grown noticeably.              rate sector 21 in Germany grew from approx.
That also drove overall investment expenditure in 2018.              EUR 399 billion to EUR 419 billion. The share of small
On average, investors employed a similar volume of                   and medium-sized enterprises in new investment by all
funds as in the year before. Among those small and                   enterprises thus remains quite stable at around 44%.22
medium-sized enterprises that invested, the average
amount invested was EUR 149,000.19                                   SMEs have been eager to invest in 2019 as well
                                                                     Although the business cycle is slowing, there is nothing
The median dropped slightly, with half the investment                to indicate an abrupt end to SMEs’ ongoing investment
projects amounting to less than EUR 22,000. This is a                boom. This is evident from the results of the annual
clear sign that SMEs’ investment projects by and large               representative additional survey to the KfW SME Panel
tend to have a modest volume – even though they                      2019 (see explanatory notes at the end of the report).
have been characterised by an above-average number
of larger projects in the past years.                                It revealed that a persistently high share of 21% of en-
                                                                     terprises plan to invest more this year than last year,
SMEs have grown their capital stock                                  while 14% of SMEs expect to invest less. The majority
In 2018, SMEs made around EUR 184 billion of new                     of SMEs (65%) are biding their time and expect to in-
investments but depreciated approx. EUR 142 billion.                 vest roughly the same volume.
Their net investment thus totalled EUR 42 billion.20 The
capital investment to depreciation ratio continues on a              The renewed positive and slightly increased balance
very good level of 130%.                                             between the ones planning to invest more and those
                                                                     planning to invest less points to a positive growth of
Large enterprises with an annual turnover in excess of               new investments in the SME sector in 2019 as well.

Figure 13: Share of SMEs with investments by size class (left) and industry (right)
Size classes by number of full-time equivalent employees

             91                                   87
                                   85                                       77
 81                         82
                                                           85

                 73                                                                                     65
                                   68                 69
                            65                                                                    60
            66                                                                   59
  62                                                       66                                                             56

                  53                                             49                                                                              52
                            50     52                 53                                           49
  49                                                                                                         46                                  50
                                                           49                                                                                    43
46                                 41                 43
                       49                                                                                                                        40
                                                           42
                                                                                             41                                                  38
 42                                                        37   36                                                   38
                            40                                            33                            36
       34                          36                 37

       Fewer than 5 employees      5 to 9 employees
                                                                          R&D-intensive manufacturing             Other manufacturing
       10 to 49 employees          50 or more employees                   Construction                            Knowledge-intensive services
       Total SMEs                                                         Other services

Source: KfW SME Panel 2005–2019.

                                                                                                                                     Page 9
KfW Research

Figure 14: Main reasons for increasing investment in 2019
In per cent; only enterprises with expansion plans compared the previous year

                                                                                                                       58
                                                                                                                        59
    Positive turnover development of own company
                                                                                                                     56
                                                                                                                             73

                                                                                                      41
                                                                                                           44
              Replacement investments necessary
                                                                                                                52
                                                                                                 38

                                                                                                 39
                                                                                                           45
Introduction of new products/services to the market
                                                                                           34
                                                                                                  40

                                                                         20
                                                                 14
                     Continuing low financing costs
                                                                               24
                                                                                     29

                                                                 14
                                                                 14
     Positive aggregate economic growth expected
                                                                                     29
                                                          6

                                                               12
                                                                                25
             Expansion of sales region in Germany
                                                                         19
                                                                    15

                          Expanding digitalisation *
                                                                                                  39
                                                                                                 38

                                                        2015     2017         2018        2019

Note: Multiple answers were possible. Selection of three main reasons given by the enterprise. *The category ‘expand digitalisation’ was added
in the survey year 2018.

Source: KfW SME Panel 2019 (additional survey September 2019).

Growth outlook, digitalisation and borrowing costs                            costs as the main factor for investing more (29%).
are keeping SMEs’ investments on a high level
The survey of the causes of additional investments                            Digitalisation is another motive for investment, as it was
makes one thing perfectly clear this year: Enterprises                        in the previous year. A share of 38% of SMEs plan to
still have faith in the high domestic demand and strong                       invest more to pursue digitalisation activities. This is a
consumer sentiment (Figure 14). Positive turnover                             very welcome development, given that SMEs’ spending
growth was stated by 73% of SMEs as motivation for                            on digitalisation remains rather low. It is true that the
their plans to invest more in 2019.                                           number of SMEs that have successfully completed digi-
                                                                              talisation projects is on the rise (30% in the period of
However, companies’ individual growth assessments                             2015–2017). But average digitalisation expenditure
deviate sharply from their assessments of the eco-                            stagnated at EUR 17,000 from the previous year23.
nomic trend. The latter is rather more consistent with
the outlined general downturn in sentiment in the SME                         Some 500,000 SMEs negotiated loans and plan
sector. Only 6% of enterprises still plan to increase                         higher loan amounts
their investment expenditure because they expect posi-                        In 2018, a total of 498,000 SMEs conducted negotia-
tive economic growth. That is a decline of 23 percent-                        tions with banks and savings banks on loans to finance
age points on the previous year and may be seen as a                          their investment activities. That is around one third of
sign of the dark clouds gathering on the horizon.                             all investors last year. This shows that enterprises were
                                                                              reluctant to engage in loan negotiations again in 2018
What is striking is the renewed increase in the share of                      (Figure 16). There appear to be growing signs that the
enterprises which regard persistently low borrowing                           volumes of the pre-crisis years will probably not be

Page 10
KfW SME Panel 2019

achieved. From the viewpoint of SMEs, arguments                                                                the previous year). The share of loans in the financing
against borrowing to finance investment projects in-                                                           volume increased to 34%. Bank loans were already
clude the desire to be financially independent, con-                                                           heavily sought after in the previous year and now the
cerns about the effort involved and disclosure and doc-                                                        demand was even higher.
umentation requirements.
                                                                                                               Figure 16: Enterprises with negotiations on
SMEs’ borrowing plans for investment purposes in-                                                              investment loans
creased by EUR 17 billion to EUR 141 billion at the                                                            Shares in per cent
start of the year despite their rather weak willingness to
                                                                                                                 50             50
negotiate last year (Figure 15). The last time a similar
level was recorded was in the crisis year 2008. The                                                              40                  36                                      37
cause of this development was an increase in planning                                                                                                 31         32    32                                34
                                                                                                                                                                                    35                             32
for very large volumes in excess of EUR 500,000. The                                                             30
                                                                                                                           26
                                                                                                                                                                                               34

initially planned annual average volume per enterprise
conducting loan negotiations also increased and is now                                                           20
                                                                                                                                20                                          15       14        14
at EUR 324,000.                                                                                                                                       14
                                                                                                                                                                                                                   13
                                                                                                                 10                                              13    13
                                                                                                                                                                                                     13

Figure 15: Loan planning at start of year and real-                                                               0
ised financing volume
EUR in billions                                                                                                            … from total SMEs
 160
                                156.0
                                                                                                                           … from investing businesses
                                                                                                     141.1
 140              134.9                                                              133.5
          124.8
                                                                    127.8 131.5                                Source: KfW SME Panel 2007–2019.
                                    122.8
                                                            118.7
 120                                                                                         123.9
                                                                                                       107.7
                                                                                                               Figure 17: Credit financing for investment
       99.2                                   103.8 102.3                    105.5
                             100.5 106.3                         98.7 99.0
 100
                      97.6
                                                                                102.0
                                                                                             107.6             EUR in billions
              88.5                                 100.2 100.5
                                     88.7                                                                                                                                                                          45
                                            83.1                                                        97.9
       93.0                                                           93.0                      90.0
                     88.9 91.8                                                          87.7
 80           83.3                                                           81.6                                     37                                               37                                     36
                                           78.1    80.7 79.8 79.8                                                               34
                                  77.1                                                                                                                                                         33
       70.2                                                                                                                                      31                                                      32
                                                                                                                                                            30
 60                                                                                                              28        29
                                                                                                                                      27 28 27        29 29                         28
                                                                                                                                                                                          27        27
                                                                                                                                                                            25 25
                                                                                                                                                                  21
          Realised own funds                            Realised external financing
          Original loan planning

It is important to note that the initial loan planning is almost never ful-
ly realised. Plan revisions due to changed business strategies must
be taken into account above all. Details can be found in Reize
        24
(2011) .
                                                                                                                                 Short-term loans                                 Long-term loans
Source: KfW SME Panel 2006–2019.
                                                                                                               Source: KfW SME Panel 2006–2019.
Traditionally, SMEs sometimes plan well above their
actual needs and credit volumes ultimately realised.                                                           As was the case in the previous year, the increase in
Thus, the initial planning regularly exceeds the bank                                                          credit financing was driven by a higher uptake of long-
loans taken up by SMEs by around 50% and the total                                                             term bank loans with maturities exceeding five years. In
borrowed funds realised by 30% (mean values of the                                                             the past, borrowing was made up of short-term and
years 2005–2018). This is mainly because investment                                                            long-term bank loans in roughly equal proportions. That
and financing plans are amended during the year as                                                             ratio shifted slightly already in 2017 and increased sig-
investments are deferred, reduced or cancelled, for ex-                                                        nificantly in 2018: While the share of short-term bank
ample.                                                                                                         loans in total investment volume remained steady at
                                                                                                               14% (EUR 30 billion), long-term loans were more
SMEs are taking advantage of the financing                                                                     sought-after than ever. Their share in total investment
environment: borrowing for investments is at an                                                                volume rose to nearly 21% and totalled EUR 45 billion
all-time high, long-term loans are in demand                                                                   in absolute terms.
The volume of loans from banks and savings banks ac-
tually used to finance investments was higher than ever                                                        The attractive borrowing terms are having an effect. It
before in 2018 (Figure 17). SMEs borrowed new short-                                                           is possible that SMEs are expecting a tightening credit
term and long-term bank loans totalling EUR 75 billion                                                         supply and higher borrowing costs through rising inter-
to finance their investments (EUR 9 billion more than in                                                       est rates. As a result, they are making a greater effort
                                                                                                               to benefit from the current favourable financing condi-

                                                                                                                                                                                                         Page 11
KfW Research

tions. This also includes, in particular, the relatively low          EUR 20,000 and 82% of all investment loans were less
interest rate level, illustrated by SMEs’ lowest ever cu-             than EUR 100,000.
mulative interest expenditure of around EUR 32 billion
in 2018.                                                              Figure 19: Bank loan amounts for SMEs
                                                                      Share of enterprises with bank loans of a specific volume, in per cent
Figure 18: Interest expenditures of SMEs                                4      4      4      4      4         4    3        3      4         4         5    5
                                                                        5      4      3      3      4         3    4        4      3         4         4    4
EUR in billions                                                         8     10      8      7      9     10       8       10      9     10            7    8
                                                                                     13     11                     11              9                   15
                      53                                                11    10                    11    13               11            11                 13
                                                                                            14                                    16
                 46                                                     22    21     21                            23                                  20   20
                                                                                                    26    26               27            27
                                        43
            44
                           43                          37
                                41 41
       38                                    38
  37
                                                  35        35          50    51     51     62      45    45       51      45     58     45            48   49
                                                                 32
                                                                       2007 2008 2009 2010 2011 2012 2013 2014 2015 2016 2017 2018

                                                                        Up to EUR 20,000                               More than EUR 20,000 to EUR 50,000

                                                                        More than EUR 50,000 to EUR 100,000            More than EUR 100,000 to EUR 250,000

                                                                        More than EUR 250,000 to EUR 500,000           More than EUR 500,000

                                                                      Notes: Only SMEs with loan negotiations that actually used bank
                                                                      loans to finance investment.
Source: KfW SME Panel 2006–2019.
                                                                      Source: KfW SME Panel 2008–2019.
Number of borrowers has remained unchanged
– but loan ticket size has grown sharply                              For 2019 it is to be assumed that the days of strong
The number of borrowers in the SME sector has not in-                 credit growth in the SME sector are slowly coming to
creased despite a noticeable growth in credit volume.                 an end. Estimates by KfW Research on new lending
In 2018, some 573,000 SMEs took up bank loans to fi-                  from banks and savings banks in Germany to enter-
nance their investments. Since the crisis years (when                 prises and self-employed persons indicate this as well.
the number of SME borrowers was significantly higher),                Looking ahead, above-average growth rates should
this figure has been roughly on the same level.                       hardly be expected anymore. The main dampening ef-
                                                                      fect will come from the subdued economic outlook.25
Significantly more businesses are focusing on short-
term loans. In 2018, approx. 269,000 SMEs took up a                   Figure 20: Indexed development of relevant SME
short-term bank loan or made use of overdraft facilities.             borrowing indicators
Around 114,000 SMEs took up a long-term bank loan,                    2007=100 index points
and some 190,000 SMEs entered into loan agreements                                                                                                          137
with various maturities. In a year-on-year comparison,
the number of borrowing SMEs has remained virtually                                                                                              122
unchanged. At the same time, however, the total bor-                                                                     111           111
rowing volume has grown. This is due to an increase in                                             106

the ticket size (Figure 20 illustrates the development):                                                                         107                        101
                                                                      100
The average volume of bank loans applied for to fi-
                                                                                            86
nance investment in 2018 was 13% higher than in the                                                                       85            83             89
                                                                                                    78                           81
previous year and amounted to EUR 130,000. That is
the third consecutive increase. To put this in perspec-                                                                    76     76
                                                                                                                                                            74
                                                                                      73                                                75         73
tive: In the previous ten years (2007–2016) the loan                                                          69
ticket size averaged EUR 97,000.                                        2007 2008 2009 2010 2011 2012 2013 2014 2015 2016 2017 2018

                                                                             Volume of bank loans
However, the developments of increasing average loan
                                                                             Number of companies with bank loans
volumes over the past years should not conceal the                           Average volume of bank loans
fact that SMEs generally – currently and historically –
                                                                      Source: KfW SME Panel 2008–2019.
have a moderate borrowing appetite (Figure 19). Near-
ly half of all investment loans taken did not exceed

Page 12
KfW SME Panel 2019

Large enterprises are driving the trend and have                         Promotional funds are also in higher demand than
been for quite some time                                                 before
The loan financing dynamic of the year 2018 was driv-                    It is not just debt capital that increased as a source of
en primarily by large SMEs (Figure 21). SMEs with 50                     external investment finance in 2018. The use of public
and more employees increased their borrowing for in-                     promotional funds increased at the same rate. Unlike in
vestment purposes by a massive EUR 8 billion to                          2017, when about half of the additional investment vol-
EUR 29 billion. Their average loan volume jumped to                      ume came from bank loans and companies’ own re-
approx. EUR 1.1 million. This financing volume is sig-                   sources, additional investment last year was financed
nificantly above average. The long-term average be-                      exclusively from external sources.
tween 2007 and 2017 was quite stable at around EUR
19 billion and the average ticket size during that same                  The volume of promotional funds used by SMEs rose
period was around EUR 800,000.                                           by approx. EUR 9 billion to EUR 34 billion (2017:
                                                                         EUR 25 billion) – another all-time high. The share of
At the same time, the share of loan-financed invest-                     promotional funds in total investment finance rose to
ments in this segment increased by seven percentage                      15%. A concentration on any particular segment cannot
points to 31%. On a structural level, a steady, gradual                  be established. In relation to their shares, micro-
dominance of larger SMEs in overall SME borrowing                        businesses (+5 percentage points), other manufactur-
can be observed since 2007 (Figure 21).                                  ing SMEs (+8 percentage points) and other service
                                                                         providers (+6 percentage points) posted the highest in-
In addition, a look at the different segments shows that                 creases (Figure 22).
R&D-intensive manufacturing industries increased their
borrowing. Bank loans reached an all-time high share                     Other sources (e.g. private equity or mezzanine capital)
of 36% of investment volume.                                             were used to a volume of EUR 14 billion, which repre-
                                                                         sented a share of 6% of total financing volume.
Figure 21: Shares of SME size classes in total SME
borrowing
Size class by number of full-time equivalent employees; figures in per
cent

                                                            42
                                                    40
   33             28               32

    23            22               35

                                                    26      27
                   9
    9
                                   10               10
                                                              13
                  41
   35
                                   24               24        19

2007 2008 2009 2010 2011 2012 2013 2014 2015 2016 2017 2018

    Fewer than 5 employees         5 to 9 employees
    10 to 49 employees             50 or more employees

Source: KfW SME Panel 2008–2019.

                                                                                                                         Page 13
KfW Research

Figure 22: SME investment finance by segment
Size classes by number of full-time equivalent employees, percentage of investment volume
                  Fewer than 5 employees                                            5 to 9 employees                                             10 to 49 employees                                     50 or more employees
                                                                                                  4 8 5 3                                                   3 3 5         3 6
           6 5 6 7 6 8 5 4 4 7 8 5                                  10 8 11 6 5 6 7 4 8 5                                                       9 5 9 4             10 5                      7 10 8 10 6 9 7 6 8 4 7 9 7 7
  15 14 13 8 8 5        6 11 6                                   18                               9                              15 12 10 11                                              13
                 9 5           11 13 18                              9       15 14 20 10 15 12 22      14 18                                      16    14 17 17
                                                                                                                                                                       19 19 17              12 11 13 11 16    13 12 15 14 11 11 9 13
                     12                                                                             14                                                           22 14
      7                                                                19 11                                                          15 16 14 18    15                                   10                14
  13    17                                                       10                                                              12

                 44                                                   40                                      50
                      55 57 47 59                                                                                       43 38
                                    47 61 54
                                               59
                                                    53 47 46                    42 38 48 36 48 51 47               48            38 40 37
                                                                                                                                            37        44 42 46 44 45        42 46 42 42   42                                                  49
       51                                                        41        39                            42                                      40                    42                           49 47 51 52        56 61 53 55 59 52 60
                                                                                                                                                                                               59                 55
  50        43

                                                                      41           39                                     42
                 42
                      33 32 38 30 33 28 32 30 30 32 31           31        34 36        33 38 34 30 33 31 37 31 38               35 33 38 39 34 35 33 36 36 34 30 35 30 36 35             35        30 31 28 26                         28 24 31
  23 28 26                                                                                                                                                                                     22                 22 24 21 24 27 24

   Bank loans           Own funds       Promotional funds          Other

       R&D-intensive manufacturing                             Other manufacturing                                       Construction                                                                                  Other services
                                                                                                                                                               Knowledge-intensive services
                                                     10 12 12 9 10 10 12 6            8 8 5 5        5    6 5 6 11 3 3 3 3                  4    3    3            3       4 4 5 3 4 4 4 7
    7 10 7 10 5 11 8            6                                                                    4                      6                    6    7    7   5                                          7 10 5 6 4 5 5 5 8                  7    7
  17                   19 20 14 7                                                                         7 10 12   13 8 11                 8                          11
                                                                                                                                                                                                                    9
                                                                                                                                                                                                                                          9
                13                                                                   10 14 12 20                                                          12 12 15
                                                                                                                                                                          11 13
                                                                                                                                                                                15 19 14 19 20           10 9 10 12   14 9 12 8               8
    16    16 14    8 9        7                      18 17 14 16 14 16 16
                                                                                  20                              8
                                                                                                                                                                                               18
                                                                                                                                                                                                                                          8       14
                                                                                                                                                                       14
  9    25              6
                          10                                                                         42
                                                                                                                    34                       50 52
                                               50                                                         50 47               46 53 47 61 49                                                             42 42 46    51    49 42 45 45 45
                                                                                                                         47                                                                                       51                      41
                                                     39 42                           58 51 57 47                                                          49 56                                                         49
  45 46                      61                               48 48 46 47                                                                                       56 47 62 61 55
                                                                                                                                                                               54 56 55 52 45
                 56 55 62 64    52 45 56                   52             53
            45

                                                                                                     49             48
                                                                                                                                           41 37
                                               36    33 29                                                37 39          35 38 36 40 31 39                                                               40 38 38
                                                                                                                                                                                                                    32 36 32 37
                                                                                                                                                                                                                                41 39 37 40 38
  30 31                                                       22 27 27
                                                                       28 25       28 26 28                                                               33
                                                                                                                                                               27 26 28 23 23 25 24 25 22 25 30
            20 21 21 20 17 23 23 24 22                                       22 25

  Bank loans       Own funds   Promotional funds      Other

Notes: The category ‘Other’ comprises, among others, mezzanine capital and private equity.

Source: KfW SME Panel 2005–2019.

Loan denial rate hit historic low, as credit was more                                                                             failed decreased by five percentage points to a histori-
accessible than ever                                                                                                              cally low 14%. Although their own denials also in-
The additional incentives for enterprises to borrow ex-                                                                           creased – i.e. banks more often presented a loan offer
ternal funds were sweetened by even easier access to                                                                              that was not acceptable to the enterprise –, this in-
credit in 2018. The rate of loan denials determined in                                                                            crease could be regarded as an indication of a recent
the KfW SME Panel (proportion of enterprises whose                                                                                rise in micro-businesses’ bargaining power. SMEs may
negotiations on investment loans with banks all failed)                                                                           be less willing to accept terms that are unattractive to
was last at 11% – the lowest ever rate (Figure 23).                                                                               them because they have sufficient alternatives or other
                                                                                                                                  funding options from other sources.
Bank denials also fell to an all-time low. Thus, loan ne-
gotiations in the SME sector failing due to credit institu-                                                                       The positive development for micro-businesses specifi-
tions not making an offer was at the lowest rate ever                                                                             cally is very pleasing. They are particularly often affect-
(-4 percentage points to 15%). This is a strong indica-                                                                           ed by difficulties in accessing capital. The asymmetrical
tion that credit institutions are taking a much less re-                                                                          distribution of information means that lenders often
strictive approach in their negotiations. A further build-                                                                        have great difficulty or incur very high expenses in ac-
ing block rounds off the extremely positive overall pic-                                                                          cessing the overall credit worthiness or the chances of
ture: The share of enterprises for which all negotiations                                                                         success of the projects to be financed. Small and
on investment loans were successful increased for the                                                                             young enterprises often do not have a credit history or
third consecutive year to now 64%. Only in 2012 were                                                                              established relationship with the lender. That makes it
SMEs generally more successful.                                                                                                   harder for them to provide credible assurances that
                                                                                                                                  they represent a low risk. As these enterprises usually
Micro-businesses did well and enjoyed more bar-                                                                                   apply for small loan amounts, the cost of eliminating
gaining power                                                                                                                     these information deficits is too high for lenders. As a
Micro-businesses above all benefited substantially in                                                                             result, they may add risk premiums to the interest rate
2018. The share of bank denials in this size segment                                                                              and require more collateral or documentation, or they
fell by seven percentage points to 18%. At the same                                                                               generally offer lower amounts or charge higher costs.
time, the share of enterprises whose negotiations all

Page 14
KfW SME Panel 2019

Figure 23: Outcome of loan negotiations and successful loan negotiations by size class
Right: All negotiations successful (in per cent); size classes by full-time equivalent employees

                                                   67                                                                                                                             82                82
                    61                                       63
                                                                          60              64
                                                                                                                                                  76
                                         56                                       62                       74                                                76                                                   77
              51                                                                                                               71                                                  72
                                                        57         57                                                                                                                                    75
                                  47                                                                        67
47                                                                                             67                                                                                         65
                                                                                                                                                 69               68       64                        62           65
               37                                                                                                              67
                                                                                               62               61
35                                32                                                                                                                                                                              59
35                                                                                             57                              60                       62                61
               27   25                                                                                                                                                                         55        58
                                   24      24           23          24     24                              56                                   50
                                                              23                          22
                                         20                                       19           49
                    16                                     20 16           16                                                  41
17                                22                 17            20
                    14                    17            14    14                          15
               12                                                          13
                                                                                         11

 2004 2005 2006 2007 2008 2009 2010 2011 2012 2013 2014 2015 2016 2017 2018                     2006 2007 2008 2009 2010 2011 2012 2013 2014 2015 2016 2017 2018

        All negotiations successful                                                                        Fewer than 5                      5 to 9            10 to 49                50 or more employees
        At least one negotiation failed, business turns down loan offer
        At least one negotiation failed, bank does not make loan offer
        All negotiations failed, bank does not make loan offer

Source: KfW SME Panel 2005–2019.

Figure 24: Basic equity ratio indicators in the SME sector
In per cent
                                                                                                                                                                                            46.0
                                                                                       31.2                                                                       46.4
                                                               29.7        30.0                                         42.3
                                                                                                                                                                                                         43.3
                                                    27.4                                            39.1
                                         26.6                                                                                         38.1
                                  25.4                                                                                                                                                                          38.8
                     23.9                           26.2                  24.1
           22.5                                                                                                                                                                                                 34.5

 18.4                    20.5                                                                                              28.7                         30.0
                                         19.3                  19.2                    19.6                                                                               30.1                      28.9

                                  17.0                                                                 23.0
 15.6                15.3
           14.3

 2002     2004       2006         2008   2010      2012        2014        2016        2018         2002         2004          2006      2008          2010        2012          2014      2016            2018

        Mean             Median                                                                             Equity ratio under 10% (total SMEs)
                                                                                                            Equity ratio at least 30% (total SMEs)

Source: KfW SME Panel 2003–2019.

Firms are holding onto reserves and using fewer own resources
                                                                                                           (Figure 22). On average, enterprises in this segment
                                                                                                           reduce the share of own resources in their investment
While enterprises borrowed more external funds to fi-                                                      financing by 11 percentage points to currently 49%.
nance their investments last year, they were more re-
luctant to use their own funds (Figure 15). The volume                                                     Equity ratio remains on a record high level
of own resources used by SMEs to fund investments                                                          SMEs’ self-financing capacity on average remained
decreased by EUR 10 billion to EUR 98 billion.                                                             on the high level of the previous year, as the average
                                                                                                           equity ratio remained at 31.2% in 2018 (Figure 24).
Although it was still above the long-term average                                                          Their financial buffer therefore continues to be very
(2004–2017: EUR 95 billion), the proportion of own                                                         comfortable overall.
resources in overall financing fell by six percentage
points to 45%. The last time such a low proportion of                                                      In the past, considerations on improving their credit
internal resources was registered was in 2007. This is                                                     rating, preserving the independence, safeguarding
a reflection of the very favourable borrowing environ-                                                     flexibility and the desire for greater resilience in times
ment. Businesses fully realised the higher investment                                                      of crisis have led to a steady build-up in SMEs’ equity
expenditure by increasing external financing (bank                                                         ratios.26 Around the turn of the millennium, the equity
loans and promotional funds), while focusing more on                                                       ratio was still at around 18%. The amendments to
holding onto the reserves they have built in the past.                                                     banking regulations that had to be complied with later
                                                                                                           (Basel II) forced enterprises to focus more on addres-
This development is most obvious in large SMEs                                                             sing their risks and credit rating to avoid jeopardising

                                                                                                                                                                                                          Page 15
KfW Research

their access to credit. Given the improvements they                                                      stroke, they thus cancelled out the improvements pre-
have achieved since then in their equity base (2002–                                                     viously achieved for this indicator. At the same time,
2018: average increase of +13 percentage points),                                                        the share of SMEs with a high equity ratio of at least
SMEs should be equipped for a potentially more diffi-                                                    30% dropped for the second consecutive year to 39%.
cult financing climate. This is aided by the positive as-                                                This is more evidence of the decoupling of the trend in
pect that, just as last year, only 8% of SMEs have a                                                     equity build-up in small SMEs, as the deterioration of
negative equity ratio.                                                                                   the indicators mentioned can be observed primarily in
                                                                                                         the small size segment (Figure 26).
Equity ratio of small SMEs is unable to keep pace,
gap is widening and weighing on overall SME                                                              Strong gains for manufacturing and construction,
sector                                                                                                   losses for knowledge-intensive service providers
Nevertheless, it is hard to overlook the fact that                                                       The equity rally nonetheless appears to be continuing
growth has slowed in the past years. Given the al-                                                       in some sub-sectors (Figure 25, right). Other manu-
ready high level, this is comprehensible and reduces                                                     facturing companies increased their already high ratio
the likelihood of sharp rises in the future. Moreover, a                                                 to 41% on average. R&D-intensive manufacturing
detailed look reveals a widening gap between the eq-                                                     SMEs posted equally strong gains (+3 percentage
uity ratios of small and large SMEs (Figure 25, left                                                     points to 32% on average). The average equity of
side). While small enterprises with fewer than ten em-                                                   construction firms grew even more strongly, gaining
ployees have been hovering on a similar level since                                                      four percentage points and taking the sector to an all-
2011, enterprises in the other size classes have grad-                                                   time high of 25%.
ually increased their equity ratio further (by approx.
+7 percentage points each since 2011). This reduces                                                      By contrast, the decline among knowledge-intensive
the value for the SME sector as a whole and also low-                                                    service providers reflects the muted development of
ers the median significantly.                                                                            small businesses (-1.2 percentage points on 2017).
                                                                                                         This sub-segment generally exhibited a very subdued
Other indicators for the equity base also suggest that                                                   development all across the survey period. It does not
the long record run is coming to an end. The propor-                                                     show any of the improvement to the equity situation
tion of enterprises that have an equity ratio of less                                                    that is visible in the overall SME sector. These SMEs
than 10% is now higher again than it has been for the                                                    have made no long-term gains (2006: 26.4% vs. 2018:
past six years (Figure 24, right side). In a single                                                      26.8%).

Figure 25: SMEs’ equity ratios by size class (left) and sector (right)
Size class by number of full-time equivalent employees; figures in per cent
                                                                                                                                                                                                41.1

                                                                                  34.8
                                                                                                                                                                                                33.9
                                                                                          33.5
                                                                                                  31.3                                                                                             32.2
                                                                                                                                                                                                  31.6

                                                                                                  28.7                                                                                             26.8
21.8                                                                                                                                                                                               25.0
                                                                                  22.4            23.9

                                                                                                 17.5
 15.0
                                                                                                   16.1
14.9

   2002 2003 2004 2005 2006 2007 2008 2009 2010 2011 2012 2013 2014 2015 2016 2017 2018             2005    2006   2007   2008   2009   2010   2011   2012   2013   2014   2015   2016   2017   2018

         Fewer than 10         10 to 49        50 or more                                                  R&D-intensive manufacturing            Other manufacturing
                                                                                                           Construction                           Knowledge-intensive services
                                                                                                           Other services                         Trade

Source: KfW SME Panel 2003–2019.

Page 16
KfW SME Panel 2019

Figure 26: SMEs with a low equity base (left) and a high equity base (right) by company size
Shares of enterprises in per cent; size class by number of full-time equivalent employees

                                                                                                                                          53.8

                                                                                                                                          48.2
                                                                 36.9

                                                                                                                                          35.9
                                                                 28.1

                                                                 17.8

 2002    2004   2006    2008   2010    2012   2014     2016   2018          2002    2004    2006   2008   2010   2012   2014   2016    2018

        Fewer than 10      10 to 49       50 or more                               Fewer than 10      10 to 49      50 or more

Source: KfW SME Panel 2003–2019.

                                                                                                                                      Page 17
KfW Research

The structure of SMEs in 2018                            Figure 28: SMEs by number of employees in 2018
The SME sector covers all enterprises in Germany
                                                                                    2%
with an annual turnover of not more than                                    7%
EUR 500 million. By this definition, there were around
                                                                    9%
3.81 million SMEs in Germany in the year 2018. The
SME sector thus accounts for 99.95% of all enterpris-
es in Germany. Around 3.1 million SMEs (82%) are
domiciled in the western German states, while
698,000 (18%) are domiciled in eastern Germany.

SMEs are very small on average
The vast majority of SMEs in Germany is small (Fig-
ure 27), with 86% (3.28 million businesses) generating
                                                                                                      81%
annual sales turnover of less than EUR 1 million.
Fewer than 0.3% (or approx. 13,600) of SMEs gener-         Fewer than 5 employees          5 to 9 employees
ate an annual sales turnover of more than                  10 to 49 employees              50 or more employees
EUR 50 million.
                                                         Source: KfW SME Panel 2019.

Figure 27: SMEs by annual turnover in 2018               Increasing focus on services
                                                         Service industries are increasingly dominating eco-
               6%       2%     0%                        nomic activity. The majority of German SMEs are ser-
          5%
                                                         vice providers (Figure 29), with 2.87 million – or 76%
                                                         of all SMEs – operating in service industries, and 1.51
                                                         million of these providing knowledge-intensive ser-
                                                         vices, a trend that is increasing.

                                                         Figure 29: SMEs by industry in 2018
                                                                            6%      3%      1%   5%

                                                                                                              10%

                                                                36%
                                     87%
       Up to EUR 1 million
       More than EUR 1 million up to EUR 2 million
       More than EUR 2 million up to EUR 10 million
       More than EUR 10 million up to EUR 50 million
       More than EUR 50 million
                                                                                                               40%
Source: KfW SME Panel 2019.

The fragmented nature of the SME sector is also re-
                                                                          R&D-intensive manufacturing
flected in the employee numbers (Figure 28). Eighty-
                                                                          Other manufacturing
one per cent of SMEs (3.1 million) have fewer than                        Construction
five employees. That share has grown by around four                       Knowledge-intensive services
percentage points since the turn of the millennium.                       Other services
The share of SMEs with 50 and more employees is                           Other
1.9%.                                                                     Not specified

                                                         Source: KfW SME Panel 2019.
The average SME size in Germany in 2018 was
7.5 full-time equivalent employees (median is 2), or     There are many different causes for the shift towards
roughly 9.0 workers. The SME sector has become           services. One of them is businesses’ outsourcing or
more fragmented in the past years, mostly as a result    contracting of what were previously in-company ser-
of increasing tertiarisation.                            vices to third-party companies (for example, IT

Page 18
KfW SME Panel 2019

aintenance, data storage, personnel recruitment, legal     In 2018, around 1.4% of all SMEs were R&D-intensive
affairs and tax matters). These decisions are based        manufacturers (some 52,000 enterprises). Manufac-
on considerations relating to costs, specialisation and    turing generally accounts for a relatively low share of
division of tasks. Another factor is that structural de-   approx. 6.7% of all small and medium-sized enterpris-
velopments have created an increased demand for            es but employs 16% of the entire workforce.
services for some time now (driven by demographic
change and the growing proportion of small house-          Figure 30: Shifts in sectoral structure of SMEs
holds, for example).                                       from 2006 to 2018
                                                           Sectoral shares in per cent each year
Among the knowledge-intensive services, the sub-
                                                                                                                              100%
segment of business-related services accounts for the
largest and growing share (Figure 30). Since 2008,           13.7                                                      14.1

their number has increased by more than 300,000. By                                                                           75%
contrast, the number of small and medium-sized en-            26.7
                                                                                                                       34.9
terprises in hospitality and retail has fallen by some
100,000 each over the same period.                           5.0                                                              50%
                                                             4.5
                                                                                                                        4.8
                                                             5.7
                                                                                                                        4.5
                                                                                                                        2.8
                                                             20.7
                                                                                                                       16.2   25%

                                                             9.7                                                       10.2
                                                             8.4                                                        6.7
                                                                                                                              0%
                                                           2006 2007 2008 2009 2010 2011 2012 2013 2014 2015 2016 2017 2018

                                                               Manufacturing                   Construction
                                                               Retail                          Hospitality
                                                               Infrastructure, communication   Financial services
                                                               Business-related services       Other services
                                                               Other sectors

                                                           Source: KfW SME Panel 2007–2019.

                                                                                                                    Page 19
You can also read