KBC Group / Bank Debt presentation May 2019 - More infomation: www.kbc.com KBC Group - Investor Relations Office - Email
←
→
Page content transcription
If your browser does not render page correctly, please read the page content below
KBC Group / Bank
 Debt presentation
 May 2019

More infomation: www.kbc.com
KBC Group - Investor Relations Office – Email: investor.relations@kbc.com

                                                                            1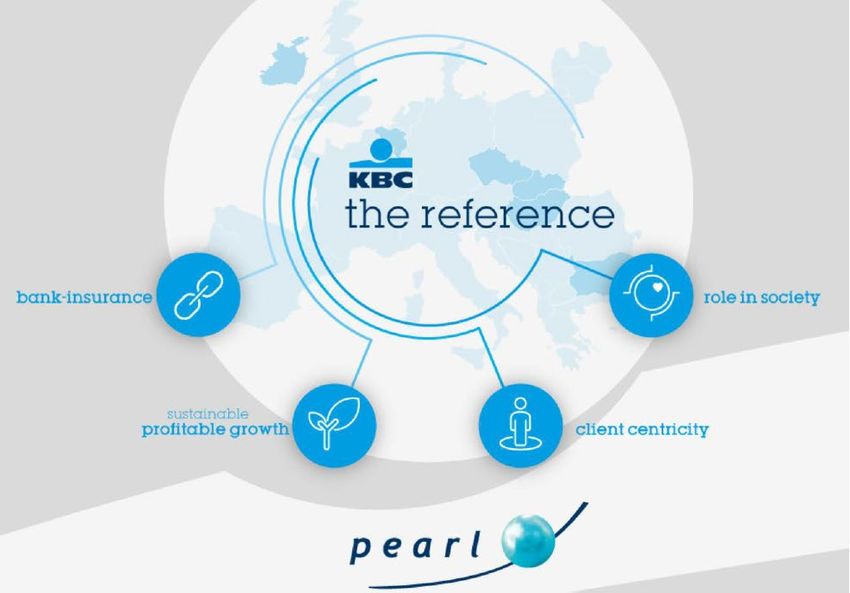
Important information for investors
This presentation is provided for information purposes only. It does not constitute an offer to sell or the solicitation to buy any
security issued by the KBC Group.
KBC believes that this presentation is reliable, although some information is condensed and therefore incomplete. KBC cannot be
held liable for any loss or damage resulting from the use of the information.
This presentation contains non-IFRS information and forward-looking statements with respect to the strategy, earnings and capital
trends of KBC, involving numerous assumptions and uncertainties. There is a risk that these statements may not be fulfilled and
that future developments differ materially. Moreover, KBC does not undertake any obligation to update the presentation in line
with new developments.
By reading this presentation, each investor is deemed to represent that it possesses sufficient expertise to understand the risks
involved.
2
KBC Passport
Well-defined core markets: access to ‘new growth’ in Europe
Market share
(end 2018) BE CZ SK HU BG IRL
20% 19%
Loans and deposits 10% 11% 10% 9%*
3.5m clients 3.7m clients
580 branches 235 branches 32% 23%
101bn EUR loans 24bn EUR loans 13% 14%
Investment funds 7%
134bn EUR dep. 32bn EUR dep.
IRELAND
0.6m clients
24%
122 branches Life insurance 13% 8% 4% 3%
7bn EUR loans
BELGIUM
6bn EUR dep.
9% 8% 11%
Non-life insurance 7%
CZECH REP 3%
0.3m clients SLOVAKIA
16 branches
10bn EUR loans HUNGARY Real GDP
5bn EUR dep. growth BE CZ SK HU BG IRL
1.6m clients 64%
206 branches
% of Assets 21%
4bn EUR loans 3% 3% 2% 4%
7bn EUR dep.
6.7%
4.1% 4.9%
BULGARIA 2.9% 3.1%
2018 1.4%
1.3m clients 3.7% 3.9% 3.2% 3.5%
2.6%
207 branches 1.2%
2019e
3bn EUR loans
Internat
Belgium Czech
ional 4bn EUR dep. 3.5% 2.6% 3.3% 3.1%
Republic 2.3%
Business
Business
Markets 1.1%
Unit Business
Unit 2020e
Unit
GDP growth: KBC data, May ‘19
3
* Retail segment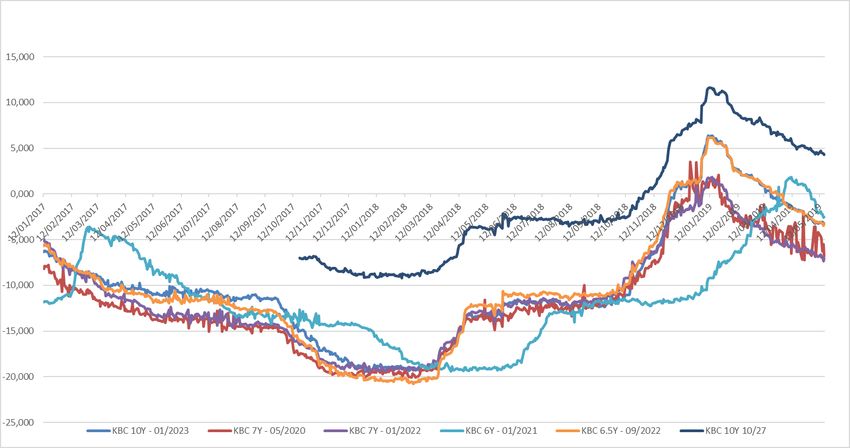
KBC Passport
Group’s legal structure and issuer of debt instruments
KBC Group NV
AT 1
Tier 2 MREL
Senior
100% 100%
KBC Bank* KBC Insurance
Covered bond No public issuance
KBC IFIMA**
Retail and Wholesale EMTN
* End of April 2019 the opportunity was taken to simplify the shareholders’ structure of KBC AM, the shares of KBC AM held by KBC Group NV (48%) shifted to KBC Bank
** All debt obligations of KBC IFIMA are unconditionally and irrevocably guaranteed by KBC Bank.
4
Contents
1 Strategy and business profile SHAREHOLDER STRUCTURE AT END 1Q19
2 Financial performance MRBB
Other core
7.3%
Cera 11.5%
3 Solvency, liquidity and funding 2.7%
4 Covered bond programme KBC Ancora 18.6%
5 Green Bond framework 59.9%
Free float
6 Looking forward
Roughly 40% of KBC shares are owned by a syndicate of core
shareholders, providing continuity to pursue long-term strategic
goals. Committed shareholders include the Cera/KBC Ancora
Appendices Group (co-operative investment company), the Belgian farmers’
association (MRBB) and a group of industrialist families
The free float is held mainly by a large variety of international
institutional investors
5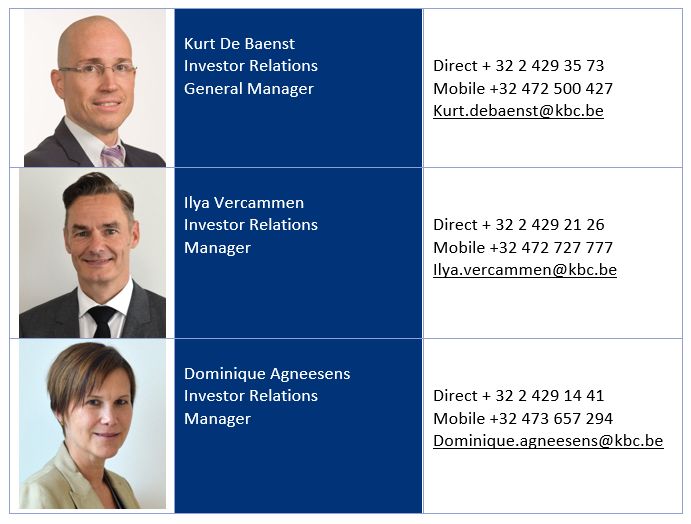
KBC Group in a nutshell (1)
We want to be among Europe’s best performing financial institutions! By achieving this,
KBC wants to become the reference in bank-insurance in its core markets
• We are a leading European financial group with a focus on providing bank-insurance products and services to
retail, SME and mid-cap clients, in our core countries: Belgium, Czech Republic, Slovakia, Hungary, Bulgaria and
Ireland.
Diversified and strong business performance
… geographically
• Mature markets (BE, CZ, IRL) versus developing markets (SK, HU, BG)
• Economies of BE & 4 CEE-countries highly oriented towards Germany, while IRL is more oriented to the UK & US
• Robust market position in all key markets & strong trends in loan and deposit growth
… and from a business point of view KBC Group: topline diversification 2014-2018 (in %)
• An integrated bank-insurer 100%
• Strongly developed & tailored AM business 80% 45% 47% 49% 47%
49%
• Strong value creator with good operational
60%
results through the cycle Diversification Synergy
• Unique selling proposition: in-depth 40%
55%
knowledge of local markets and profound 20%
53% 51% 51% 53%
relationships with clients
0%
• Integrated model creates cost synergies and results Customer Centricity FY 2014 FY 2015 FY 2016 FY 2017 FY 2018
in a complementary & optimised product offering Net Interest Income Other Income
• Broadening ‘one-stop shop’ offering to our clients 6
KBC Group in a nutshell (2)
High profitability
CET1 generation
C/I ratio Combined ratio Net result ROE before any deployment
277 bps 279 bps 271 bps
EUR
57% 88% 2570m EUR 16%
55% 88% 2575m 17%
2016 2017 2018
FY18
FY17
Solid capital position… … and robust liquidity positions
Fully loaded Basel 3 CET1 ratio of KBC Group (Danish Compromise)
15.7% 15.7% 15.9% 16.3% 15.9% 15.8% 16.0% 16.0% NSFR LCR
14.0% ‘Own Capital Target’
10.6% regulatory minimum*
136% 139%
134% 139%
1Q17 1H17 9M17 FY17 1Q18 1H18 9M18 FY18 FY18
FY17
*SREP of 10.7% in 2019 onwards
7
KBC Group in a nutshell (3)
We aim to be one of the better capitalised financial institutions in Europe
• Every year, we assess the CET1 ratios of a peer
Flexible buffer for M&A 2.0%*
group of European banks active in the retail, SME
and corporate client segments. We position
ourselves on the fully loaded median CET1 ratio of
the peer group (remained 14% at end of 2018) ‘Reference Capital
Own capital target Position’
• We want to keep a flexible buffer of up to 2%*
CET1 for potential add-on M&A in our core markets
= 14.0% = 16.0%
Median CET1
• This buffer comes on top of our ‘Own Capital Peers (FL)
Target’ and together they form the ‘Reference
Capital Position’
• Any M&A opportunity will be assessed subject to
very strict financial and strategic criteria
2019
* KBC Group’s 2% M&A buffer will be lowered to 1.7% at the closing of the
acquisition of the 45% stake in CMSS, which is expected before the end of 2Q19
Capital distribution to shareholders
• Payout ratio policy (i.e. dividend + AT1 coupon) of at least 50% of consolidated profit
• Interim dividend of 1 EUR per share in November of each accounting year as an advance on the total dividend
• On top of the payout ratio of 50% of consolidated profit, each year, the Board of Directors will take a decision,
at its discretion, on the distribution of the capital above the ‘Reference Capital Position‘
8
More of the same, but differently
Wants to be among the best performing financial institutions in Europe
KBC wants to be among Europe’s
best performing financial
institutions. This will be achieved by:
• Strengthening our bank-insurance
business model for retail, SME and
mid-cap clients in our core markets, in
a highly cost-efficient way
• Focusing on sustainable and profitable
growth within the framework of solid
risk, capital and liquidity management
• Creating superior client satisfaction via
a seamless, multi-channel, client-
centric distribution approach
By achieving this, KBC wants to
become the reference in bank-
insurance in its core markets
9
Our bank-insurance model
In different countries and different stages of implementation

         Level 4: Integrated distribution and operation
     Acting as a single operational company: bank and insurance operations
     working under unified governance and achieving commercial and non-
                                                                                     Belgium
                               commercial synergies

                   Level 3: Integrated distribution
            Acting as a single commercial company: bank and insurance
                                                                               Target for Central
            operations working under unified governance and achieving               Europe
                                commercial synergies

                    Level 2: Exclusive distribution                          KBC targets to reach at
               Bank branches selling insurance products from intra-
                                                                             least level 3 in every
                          group insurance company as                         country, adapted to the
                        additional source of fee income
                                                                             local market structure and
                                                                             KBC’s market position in
                         Level 1: Non-exclusive
                              distribution
                                                                             banking and insurance.
                         Bank branches selling insurance
                        products of third party insurers as
                         additional source of fee income

                                                                      10
More of the same… but differently…
Enhanced channels for empowered clients
Creating superior client satisfaction via a
seamless, multi-channel client-centric
distribution approach
Investing €1.5bn cash-flow (2017-20):
• Further optimise our integrated distribution
model according to a real-time omni-channel
Real approach
time
• Prepare our applications to engage with
Fintechs and other value chain players
• Invest in our digital presence (e.g. social media)
to enhance client relationships and anticipate
their needs
• Further increase efficiency and effectiveness of
data management
• Set up an open architecture IT package as core
banking system for our International Markets
Business Unit
Operating Expenses 2017-2020 = 1bn EUR
Enhanced channels for empowered clients
11KBC the reference…
Group financial guidance (Investor visit 2017)
Guidance End 2018
CAGR total income (‘16-’20)* ≥ 2.25% by 2020 2.5% (CAGR FY18 – FY16)
C/I ratio banking excluding bank tax ≤ 47% by 2020 51% (FY2018)
C/I ratio banking including bank tax ≤ 54% by 2020 57.5% (FY2018)
Combined ratio ≤ 94% by 2020 88% (FY2018)
Dividend payout ratio ≥ 50% as of now 59% (end 2018, incl. total dividend and
AT1 coupon)
* Excluding marked-to-market valuations of ALM derivatives
Regulatory requirements End 1Q19
Common equity ratio*excluding P2G ≥ 10.7% by 2019 15.7%**
Common equity ratio*including P2G ≥ 11.7% by 2019 15.7%**
MREL ratio ≥ 25.9% by May ‘19 26.0%***
NSFR ≥ 100% as of now 138%
LCR ≥ 100% as of now 140%
• Fully loaded, Danish Compromise. P2G = Pillar 2 guidance
** See slide 40… Is 15.8% when including 1Q19 net result taking into account the payout ratio in FY2018 of 59% (dividend + AT1 coupon)
*** Taking into account the senior Holdco issue of 500m EUR in April 2019
12KBC the reference…
Group non-financial guidance (Investor visit 2017)
Non-financial guidance: End 2018 Non-financial guidance: End 2018
CAGR Bank-Insurance clients (growth CAGR Bank-Insurance stable clients (growth
FY18-FY16) FY18-FY16)
(1 Bank product + 1 Insurance product) (3 Bk + 3 Ins products in Belgium;
2 Bk + 2 Ins products in CE)
BU BE > 2% by 2020 +1% BU BE > 2% by 2020 +1%
BU CR > 15% by 2020 +12% BU CR > 15% by 2020 +19%
BU IM > 10% by 2020 +31% BU IM > 15% by 2020 +33%
Non-financial guidance: End 1Q19
% Inbound contacts via omni-channel and
digital channel*
KBC Group** > 80% by 2020 79%
• Clients interacting with KBC through at least one of the non-physical channels (digital or
through a remote advisory centre), possibly in addition to contact through physical branches.
This means that clients solely interacting with KBC through physical branches (or ATMs) are
excluded
** Bulgaria & PSB out of scope for Group target
13Sustainablity
The core of our sustainability strategy
Strict policies for our day-to-day activities Four focus domains
that are close to our core activities
Focus on sustainable investments
Limiting our Increasing our Financial Stimulating
Reducing our own environmental adverse impact positive impact literacy entrepreneurship
on society on society
footprint
Environmental Longevity
responsibility or health
Encouraging responsible
behaviour on the part of
all employees
The mindset of all KBC staff should go beyond regulation and compliance. Responsible behaviour is a requirement to
implement an effective and credible sustainability strategy. Specific focus on responsible selling and responsible advice
2018 & 1Q19 achievements:
• Launch of the first Belgian Sustainable Pension Savings Fund for private individuals
• Successful launch of the Green Bond Framework and issue of the Inaugural Green Bond of 500m EUR
• SRI funds increased to 11.6bn EUR by the end of 1Q19 (12.5bn EUR including KBC’s Pension Fund for its employees)
• Updated KBC Sustainability Policies
• KBC/CSOB announced to stop financing of Coal Fired Power Generation and Coal mining (current exposure phases out in 2023)
• Launch of a Sustainable Finance Program (implementation of TCFD-recommendations and the EU Action Plan on Sustainable Finance)
Please find more info in our 2018 Sustainability Report 14Sustainablity
Our non-financial environmental targets
Indicator Goal 2018 2017
Share of renewables in total energy Minimum 50% by 2030 43.8% 41.1%
credit portfolio
Financing of coal-related activities Immediate stop of coal-related activities and 34m EUR exposure 86m EUR exposure
gradual exit in the Czech Republic by 20231
Total GHG emissions (excluding 25% reduction by 2020 relative to 2015, both -37.58% (absolute) -28.9% (absolute)
commuter travel) absolute and per FTE -36.64% (per FTE) -28.1% (per FTE)
Long term target for a 50%-decrease by 2030
ISO 14001-certified environmental ISO 14001 certification in all core countries at the All 6 core countries Belgium, Slovakia,
management system end of 2017 certified Hungary and Bulgaria
Business solutions in each of the focus Develop sustainable banking and insurance See Sustainability & Annual For examples: see
domains products and services to meet a range of social Report 2018 Sustainability &
and environmental challenges Annual Report 2018
Volume of SRI funds 10 billion EUR by end 20202 9 billion EUR3 7.1 billion EUR
Awareness of SRI among both our staff Increase awareness and knowledge of SRI 100% awareness among Progress in line with
and clients Belgian sales teams target
through e-learning courses
69 85/100 (Sector Leader) C (Prime, best in class) A- (Leadership)
(1) Except for financing of existing coal-fired district heating plants until 2035 under strict conditions, i.e. only to assist further ecological upgrades
(2) Our initial target of 5 billion EUR by the end of 2018 had already been met by mid-2017
(3) This
15
excludes 777m EUR from KBC’s Pension funds and includes 40m EUR Pricos SRIContents
1 Strategy and business profile
BREAKDOWN OF ALLOCATED CAPITAL
BY BUSINESS UNIT AS AT
2 Financial performance 31 MARCH 2019
3 Solvency and liquidity Czech Republic
15%
4 Covered bond programme
Belgium 61%
5 Green bond framework 21%
International Markets
6 Looking forward 3%
Group Centre
Appendices
161Q 2019 key takeaways
1Q19 financial performance
1Q19
Commercial bank-insurance franchises in core ROE 14.5% *
markets performed well Cost-income ratio 57% (adjusted for specific items)
Customer loans and customer deposits Combined ratio 93%
increased in most of our core countries Credit cost ratio 0.16%
Lower net interest income and net interest Common equity ratio 15.7%** (B3, DC, fully loaded)
margin Leverage ratio 6.0% (fully loaded)
Good net
NSFR 138% & LCR 140%
Higher net fee and commission income result of
Higher net gains from financial instruments at 430m Net result
fair value and lower net other income EUR in 692 701
621
556
Excellent sales of non-life insurance and higher 1Q19 430
sales of life insurance y-o-y
Strict cost management
1Q18 2Q18 3Q18 4Q18 1Q19
Higher net impairments on loans
* when evenly spreading the bank tax throughout the year
Solid solvency and liquidity ** 15.8% when including 1Q19 net result taking into account the
payout ratio in FY2018 of 59% (dividend + AT1 coupon)
Comparisons against the previous quarter unless otherwise stated
17Net result at KBC Group
CONTRIBUTION OF BANKING ACTIVITIES
TO KBC GROUP NET RESULT*
574 603
539
461
334
NET RESULT AT KBC GROUP*
692 701
621
556 1Q18 2Q18 3Q18 4Q18 1Q19
430
CONTRIBUTION OF INSURANCE ACTIVITIES
TO KBC GROUP NET RESULT*
155
1Q18 2Q18 3Q18 4Q18 1Q19
74 107 93
102
96
42 73 66
33
113
75 61 62 68
-15 -4
* Difference between net result at KBC Group and the sum of the banking and insurance -32 -27 -35
contribution is accounted for by the holding-company/group items
1Q18 2Q18 3Q18 4Q18 1Q19
Non-Life result Non-technical & taxes
Amounts in m EUR 18
Life resultLower net interest income and net interest margin
NII Amounts in m EUR
1,125 1,117 1,136 1,166 1,129 Net interest income (1,129m EUR)
0 27 1 19 128 2 17 125 2 24 118 4 16 • Down by 3% q-o-q and stable y-o-y. Note that NII banking
128 124
decreased by 2% q-o-q, but rose by 2% y-o-y
• The q-o-q decrease was driven primarily by:
1,016
970 972 989 992 o lower reinvestment yields in our euro area core countries
o pressure on commercial loan margins (on total outstanding
portfolio) in most core countries
1Q18 2Q18 3Q18 4Q18 1Q19 o lower netted positive impact of ALM FX swaps
NII - netted positive impact of ALM FX swaps* NII - Insurance
o lower number of days
NII - Holding-company/group NII - Banking
partly offset by:
NIM ** o continued good loan volume growth
2.01% 2.00% 2.02% o small additional positive impact of both short- & long-term
1.98% 1.98%
interest rate increases in the Czech Republic
o slightly lower funding costs
Net interest margin (1.98%)
• Down by 4 bps q-o-q and by 3 bps y-o-y due mainly to
negative impact of lower reinvestment yields, pressure on
1Q18 2Q18 3Q18 4Q18 1Q19
commercial loan margins (on total outstanding portfolio) and
* From all ALM FX swap desks
** NIM is calculated excluding the dealing room and the net positive impact of ALM FX swaps & repos
an increase of the interest-bearing assets (denominator)
ORGANIC VOLUME TREND Total loans** o/w retail mortgages Customer deposits*** AuM Life reserves
Volume 149bn 62bn 198bn 210bn 28bn
Growth q-o-q* +1% +1% +2% +5% +1%
Growth y-o-y +5% +3% +6% -2% -1%
* Non-annualised ** Loans to customers, excluding reverse repos (and bonds) 19
*** Customer deposits, including debt certificates but excluding repos. Customer deposit volumes excluding debt certificates & repos +3% q-o-q and +6% y-o-yHigher net fee and commission income
F&C Amounts in m EUR
Net fee and commission income (410m EUR)
450 438 424
• Up by 1% q-o-q and down by 9% y-o-y
407 410
• Q-o-q increase was the result chiefly of the following:
215 223 219 225 219 o Net F&C income from Asset Management Services
increased by 3% q-o-q as a result of higher entry and
management fees from mutual funds and unit-linked life
299 275
insurance products
281 255 264
o Net F&C income from banking services decreased by 3%
q-o-q due mainly to seasonally lower fees from payment
-70 -74 -73
-64 -66 services, lower fees from credit files & bank guarantees and
1Q18 2Q18 3Q18 4Q18 1Q19 lower network income, partly offset by higher securities-
related fees
Distribution Banking services Asset management services
o Distribution costs fell by 2% q-o-q
• Y-o-y decrease was mainly the result of the following:
o Net F&C from Asset Management Services decreased by
Amounts in bn EUR
12% y-o-y as a result of lower entry and management fees
from mutual funds & unit-linked life insurance products
AuM
o Net F&C income from banking services increased by 2%
213 214 213 210 y-o-y as higher fees from payment services and higher
200
network income more than offset lower securities-related
fees and lower fees from credit files & bank guarantees
o Distribution costs rose by 14% y-o-y due chiefly to higher
commission paid on non-life insurance sales
Assets under management (210bn EUR)
1Q18 2Q18 3Q18 4Q18 1Q19 • Increased by 5% q-o-q due entirely to a positive price effect
• The mutual fund business has seen small net inflows,
offset by net outflows in investment advice
20Insurance premium income up y-o-y
and good combined ratio
PREMIUM INCOME (GROSS EARNED PREMIUMS) Insurance premium income (gross earned
825
premiums) at 766m EUR
766
714 707 696 • Non-life premium income (415m) increased by
416 351
10% y-o-y
336 315 293
• Life premium income (351m) down by 16% q-o-q
and up by 4% y-o-y
378 392 403 409 415
1Q18 2Q18 3Q18 4Q18 1Q19
Life premium income Non-Life premium income
The non-life combined ratio for 1Q19
COMBINED RATIO (NON-LIFE) amounted to 93%, a good number given
90% 93%
88% 88% 88%
higher technical charges due mainly to storm
claims (especially in Belgium, and to a lesser
extent in the Czech Republic) and large fire
claims in Belgium
1Q 1H 9M FY
2018 2019
21
Amounts in m EURNon-life and life sales up y-o-y
NON-LIFE SALES (GROSS WRITTEN PREMIUM) Sales of non-life insurance products
534 • Up by 9% y-o-y thanks to a good commercial
492
performance in all major product lines in our core
382 378 373 markets and tariff increases
1Q18 2Q18 3Q18 4Q18 1Q19
Sales of life insurance products
• Increased by 1% q-o-q and by 4% y-o-y
LIFE SALES • The q-o-q increase was driven entirely by higher sales of
498 510 516 unit-linked products in Belgium, partly offset by lower
426
383
sales of guaranteed interest products in Belgium
279 341 302 (attributable chiefly to traditionally higher volumes in
261 230
tax-incentivised pension saving products in 4Q18)
• The y-o-y increase was driven by higher sales of
219 169 214 guaranteed interest products in Belgium and Bulgaria
165 153
• Sales of unit-linked products accounted for 41% of total
1Q18 2Q18 3Q18 4Q18 1Q19 life insurance sales in 1Q19
Guaranteed interest products Unit-linked products
22
Amounts in m EURHigher FV gains and lower net other income
FV GAINS The higher q-o-q figures for net gains from
96
54
99 financial instruments at fair value were
79
2 62
attributable mainly to:
78 55 45 36 • a positive change in market, credit and funding value
4 33 22 32
11 adjustments (mainly as a result of changes in the
19 29
-5 -21 2 11 -3 underlying market value of the derivatives portfolio
-14 -62 and decreased credit & funding spreads)
-3
• higher net result on equity instruments (insurance)
1Q18 2Q18 3Q18 4Q18 1Q19 • higher dealing room income
Dealing room & other income M2M ALM derivatives partly offset by:
MVA/CVA/FVA Net result on equity instruments (overlay insurance) • a negative change in ALM derivatives
Net other income amounted to 59m EUR, more
or less in line with the normal run rate of around
NET OTHER INCOME 50m EUR. 1Q19 was positively impacted by the
71
76 settlement of a legacy legal file in the Czech
56 59 Republic (+6m EUR), while 4Q18 was positively
impacted by the settlement of legacy legal files
in the Belgium Business Unit (+33m EUR)
23
1Q18 2Q18 3Q18 4Q18 1Q19
23
Amounts in m EURStrict cost management. Cost/income ratio of 57%
OPERATING EXPENSES Cost/income ratio (banking) adjusted for specific
1,291 1,296
items* at 57% in 1Q19 (57% in FY18)
Cost/income ratio (banking): 72% in 1Q19,
371 966 981 996 382
distorted by the bank taxes
24 26 41
Operating expenses excluding bank tax decreased
by 4% q-o-q primarily as a result of:
956 954
920 942 913 o lower staff expenses (partly thanks to an 8m EUR
positive one-off due to a review of the employee
benefit plans), despite wage inflation in most
1Q18 2Q18 3Q18 4Q18 1Q19 countries
o seasonally lower professional fee, ICT & marketing
Bank tax Operating expenses
expenses
• Operating expenses without bank tax decreased by 1%
EXPECTED BANK TAX SPREAD IN 2019 (PRELIMINARY)** y-o-y due mainly to lower staff expenses and lower
facility expenses (as 1Q18 was impacted by a 12m
TOTAL Upfront Spread out over the year
negative one-off for one specific file in Belgium)
1Q19 1Q19 1Q19 2Q19e 3Q19e 4Q19e
BE BU 273 273 0 0 0 0
CZ BU 35 35 0 0 0 0 • Pursuant to IFRIC 21, certain levies (such as
contributions to the European Single Resolution Fund)
Hungary 46 26 20 22 23 24 have to be recognised upfront, and this adversely
impacted the results for 1Q19
Slovakia 8 4 4 4 4 5
• Total bank taxes (including ESRF contribution) are
Bulgaria 16 16 0 0 0 0 expected to increase from 462m EUR in FY18 to 488m
Ireland 4 3 1 1 1 23 EUR in FY19
GC 0 0 0 0 0 0
TOTAL 382 356 25 27 28 52 * See glossary (slide 78) for the exact definition
24
Amounts in m EUR ** Still subject to changesHigher asset impairments, benign credit cost ratio and
stable impaired loans ratio
ASSET IMPAIRMENT
69 Higher asset impairments
1
43 • This was attributable mainly to:
13 67 o loan loss impairments of 82m EUR in Belgium due to a
30
6
20
6 number of corporate files
-8
-63 -21 -2 o small loan loss impairments in Slovakia and Bulgaria
-1 partly offset by:
-56 o net loan loss impairment releases in Ireland of 12m EUR
1Q18 2Q18 3Q18 4Q18 1Q19 (compared with 15m EUR in 4Q18)
Other impairments Impairments on financial assets at AC* and FVOCI o small net loan loss impairment reversals in the Czech
* AC = Amortised Cost. Under IAS 39, impairments on L&R
Republic and Group Centre
CREDIT COST RATIO Note that there were no loan loss impairments in Hungary as
0.42% net impairment releases in retail were offset by loan loss
impairments in corporate
0.23%
0.16%
0.09%
The credit cost ratio amounted to 0.16% in 1Q19 due to
higher gross impairments in Belgium
-0.06% -0.04%
FY14 FY15 FY16 FY17 FY18 1Q19
The impaired loans ratio stabilised at 4.3%, 2.4% of
IMPAIRED LOANS RATIO
5.9%
which over 90 days past due. The sharp improvement
5.5% 5.5% noticed in 4Q18 was mainly the result of the sale of part
4.3% 4.3% of the Irish legacy portfolio (closed during 4Q18)
3.5% 3.2% 3.2%
2.5% 2.4%
1Q18 2Q18 3Q18 4Q18 1Q19
25
Impaired loans ratio of which over 90 days past dueLoan loss experience at KBC
1Q19 FY18 FY17 FY16 FY15 AVERAGE
CREDIT COST CREDIT COST CREDIT COST CREDIT COST CREDIT COST ‘99 –’18
RATIO RATIO RATIO RATIO RATIO
Belgium 0.30% 0.09% 0.09% 0.12% 0.19% n/a
Czech
-0.02% 0.03% 0.02% 0.11% 0.18% n/a
Republic
International
-0.11% -0.46% -0.74% -0.16% 0.32% n/a
Markets
Group Centre -0.60% -0.83% 0.40% 0.67% 0.54% n/a
Total 0.16% -0.04% -0.06% 0.09% 0.23% 0.44%
Credit cost ratio: amount of losses incurred on troubled loans as a % of total average outstanding loan portfolio
26Impaired loans ratios, of which over 90 days past due
KBC GROUP BELGIUM BU
5.9% 2.6% 2.6% 2.6%
5.5% 5.5% 2.4% 2.4%
4.3% * 4.3%
3.5% 3.2% 3.2% 1.3% 1.3%
2.5% 2.4% 1.2% 1.2% 1.2%
1Q18 2Q18 3Q18 4Q18 1Q19 1Q18 2Q18 3Q18 4Q18 1Q19
Impaired loans ratio
Of which over 90 days past due
CZECH REPUBLIC BU INTERNATIONAL MARKETS BU
2.4% 2.4% 2.4% 20.4%
2.3% 19.5% 18.9%
2.1%
12.2%* 11.8%
1.6% 1.5% 1.4% 12.1% 11.2%
1.3% 1.3% 11.5%
7.9% 7.6%
1Q18 2Q18 3Q18 4Q18 1Q19 1Q18 2Q18 3Q18 4Q18 1Q19
* This sharp improvement was mainly the result of the sale of part of the Irish portfolio (closed during 4Q18)
27Cover ratios
KBC GROUP BELGIUM BU
68.1% 67.7% 66.8% 65.7% 65.6% 67.6% 66.4% 66.0%
63.4% 64.4%
47.8% 48.0% 47.2% 45.9%
44.8% 45.3% 44.2% 44.4%
41.6% 42.1%
1Q18 2Q18 3Q18 4Q18 1Q19 1Q18 2Q18 3Q18 4Q18 1Q19
Impaired loans cover ratio
Cover ratio for loans with over 90 days past due
CZECH REPUBLIC BU INTERNATIONAL MARKETS BU
66.8% 66.9% 66.9% 67.9% 69.0% 66.0% 65.5% 64.8%
60.4% 60.7%
52.5% 53.0%
48.1% 47.0% 47.4% 46.9% 46.0% 45.7%
42.5% 43.0%
1Q18 2Q18 3Q18 4Q18 1Q19 1Q18 2Q18 3Q18 4Q18 1Q19
28Overview of contribution of business units to 1Q19 result
Amounts in m EUR
NET PROFIT – KBC GROUP
1Q19 ROAC: 16%*
2,639 2,575 2,570
2,427
2,129 1,945 2,014
2,035
430
510 392 630 556
2015 2016 2017 2018 2019
2Q-4Q 1Q
NET PROFIT – BELGIUM NET PROFIT – CZECH REPUBLIC NET PROFIT – INTERNATIONAL MARKETS
1Q19 ROAC: 11%* 1Q19 ROAC: 43%* 1Q19 ROAC: 12%*
1,564 1,575
1,432 1,450
702
654
596
542 533
1,234 1,274 428 444
1,207 521 483
1,223
399 467 396
245 330
177 368
176 221 70
330 301 243 181 171 137
209 143 129 114
24 60
2015 2016 2017 2018 2019 2015 2016 2017 2018 2019 2015 2016 2017 2018 2019
2Q-4Q 1Q 2Q-4Q 1Q 2Q-4Q 1Q
* Distorted by bank taxes
29Balance sheet
KBC Group consolidated at 31 March 2019
Total assets Total liabilities and equity
(EUR 292bn) (EUR 292bn)
Credit quality 149 164 Capital adequacy &
liquidity position
62 19
34
14 19
6
13
6
62
37
Loan book (loans and advances to customers) Deposits from customers
Investment portfolio (equity and debt securties) Equity (including AT1)
Insurance investment contracts Other MREL instruments and debt certificates
Trading assets Technical provisions, before reinsurance NL and L
Other (incl. interbank loans, reverse repos, Liabilities under insurance investment contracts
property & equipment etc...) Trading liabilities
Other (incl. interbank deposits)
30Balance sheet:
Loans and deposits continue to grow in most core countries
9%
8%
BE
5% 6%
2%
0%
Y-O-Y ORGANIC* VOLUME GROWTH Loans** Retail Deposits*** Loans** Retail Deposits***
mortgages mortgages
7% 7%
6%
6%
5% CR 7%
3% 2%
3% Loans** Retail Deposits*** Loans** Retail Deposits***
4% mortgages mortgages****
9%
8%
Loans** Retail Deposits***
mortgages 5%
1% 2%
Loans** Retail Deposits***
-11%
mortgages
* Volume growth excluding FX effects and divestments/acquisitions Loans** Retail Deposits***
** Loans to customers, excluding reverse repos (and bonds)
*** Customer deposits, including debt certificates but excluding repos
mortgages
31
**** Retail mortgages in Bulgaria: new business (written from 1 Jan 2014) +6% y-o-y, while legacy -29% y-o-ySectorial breakdown of outstanding loan portfolio (1)
(166bn EUR*) of KBC Bank Consolidated
Services
11%
Oil, gas & other fuels
Distribution Electricity
Hotels, bars & restaurants
8%
Shipping 0.7% 1.7%
Private Persons 0.9% 0.6%
40% Machinery & heavy equipment Food producers
1.0% 1.7%
15% Rest
Chemicals 1.4%
1.6%
Metals 5.4%
7%
Real estate Other sectors
3%
Automotive 3% 7%
3% 4%
Agriculture, farming, fishing Finance & insurance
Authorities Building & construction
* It includes all payment credit, guarantee credit (except for confirmations of letters of credit and similar export/import related commercial credit), standby credit and credit
derivatives, granted by KBC to private persons, companies, governments and banks. Bonds held in the investment portfolio are included if they are corporate or bank issued,
hence government bonds and trading book exposure are not included
* Outstanding amount includes all on-balance sheet commitments and off-balance sheet guarantees
32Geographical breakdown of the outstanding loan portfolio (2)
(166bn EUR*) of KBC Bank Consolidated
North America Asia
Other CEE Rest
Other W-Eur 1.8%
0.4%
8.6% 1.4%
Bulgaria 1.6%
Hungary 2.0%
3.2%
Slovakia 4.9%
Ireland 6.5% 54.7%
14.9% Belgium
Czech Rep.
* It includes all payment credit, guarantee credit (except for confirmations of letters of credit and similar export/import related commercial credit), standby credit and credit
derivatives, granted by KBC to private persons, companies, governments and banks. Bonds held in the investment portfolio are included if they are corporate or bank issued,
hence government bonds and trading book exposure are not included
* Outstanding amount includes all on-balance sheet commitments and off-balance sheet guarantees
33Government bond portfolio – Notional value
Notional investment of 44.8bn EUR in government bonds (excl. trading book) at end of 1Q19, primarily as a
result of a significant excess liquidity position and the reinvestment of insurance reserves in fixed-income
instruments
Notional value of GIIPS exposure amounted to 5.9bn EUR at the end of 1Q19
END OF FY18 END OF 1Q19
(Notional value of 45.0bn EUR) (Notional value of 44.8bn EUR)
Netherlands * Ireland Netherlands * Ireland
Austria * Portugal * Austria * Portugal *
Germany ** Germany **
Spain Spain
5% 5%
Other 30%
9% 32% Other
9%
Belgium
France 13% Belgium
France 13%
4% 4% 14%
Italy 2% 13%
6% Italy 2% 6% Czech Rep.
Bulgaria** Czech Rep.
5% 3% Bulgaria** 5% 3%
Slovakia Poland
Slovakia
Hungary Poland Hungary
(*) 1%, (**) 2% (*) 1%, (**) 2%
34Contents
1 Strategy and business profile
2 Financial performance
3 Solvency, liquidity and funding
4 Covered bond programme
5 Green bond framework
6 Looking forward
Appendices
35More stringent ECB approach re. dividend policy
Our unchanged dividend policy / capital distribution to shareholders
• Payout ratio policy (i.e. dividend + AT1 coupon) of at least 50% of consolidated profit
• Interim dividend of 1 EUR per share in November of each accounting year as an advance on the total dividend
• On top of the payout ratio of 50% of consolidated profit, each year, the Board of Directors will take a decision,
at its discretion, on the distribution of the capital above the ‘Reference Capital Position‘
More stringent ECB approach since recently, based on the ECB Umbrella Decision
• We can apply for interim profit recognition based on the ECB Umbrella Decision (Decision EU 2015/656 of 4
February 2015), which states that the dividend to be deducted is the highest of (i) maximum pay-out according
to dividend policy, (ii) average pay-out ratio over the last 3 years or (iii) last year’s pay-out ratio
• BUT since recently:
• the ECB interpret ‘at least 50%’ as a range with an upper end of 100% pay-out
• ECB indicated that KBC should first accrue for the interim dividend of 1 EUR per share before any profit
can be recognised (under the ECB Umbrella decision)
What does this mean in practice in the meantime?
• In anticipation of further clarification and reaching agreement upon our approach re. the interim profit
recognition process going forward, no interim profit has been recognised for 1Q19. This resulted in a CET1 ratio
of 15.7% at the end of 1Q19
• When including 1Q19 net result taking into account 59% pay-out (dividend + AT1 coupon), in line with the
payout ratio in FY2018, the CET1 ratio at KBC Group (Danish Compromise) amounted to 15.8% at the end of
1Q19
36Strong capital position
Fully loaded Basel 3 CET1 ratio at KBC Group (Danish Compromise) The common equity ratio slightly decreased from
15.9% 15.8% 16.0% 16.0% 15.7%
16.0% at the end of FY18 to 15.7%* at the end of
1Q19 based on the Danish Compromise due mainly
14.0% ‘Own Capital Target’ to RWA increase. This clearly exceeds the minimum
capital requirements** set by the competent
10.7% fully loaded regulatory minimum
supervisors of 10.7% fully loaded. Our ‘Own Capital
Target’ remained at 14.0% for 2019 after the
update of the median CET1 ratio of our peer group
(based on FY18 numbers)
* See previous slide…Is 15.8% when including 1Q19 net result
taking into account the payout ratio in FY2018 of 59% (dividend +
1Q18 1H18 9M18 FY18 1Q19 AT1 coupon)
** Excludes a pillar 2 guidance (P2G) of 1.0% CET1
Fully loaded Basel 3 total capital ratio (Danish Compromise)
20.8% 20.9%
19.7% 19.2% 19.3%
2.4% T2 2.3% T2
2.3% T2 2.2% T2 2.1% T2 The fully loaded total capital ratio rose from 19.2%
1.5% AT1 2.6% AT1 2.6% AT1
1.1% AT1 1.6% AT1 at the end of 2018 to 19.3% at the end of 1Q19 as
we successfully issued a new AT1 instrument of
500m EUR in March 2019
15.9% CET1 15.8% CET1 16.0%CET1 16.0% CET1 15.7% CET1 Total distributable items (under Belgian GAAP) KBC Group
6.3bn EUR at 1Q 2019, of which:
• available reserves: 949m
• accumulated profits: 5 207m
1Q18 1H18 9M18 FY18 1Q19
37Fully loaded Basel 3 leverage ratio and Solvency II ratio
Fully loaded Basel 3 leverage ratio at KBC Group Fully loaded Basel 3 leverage ratio at KBC Bank
6.0% 6.1% 6.1% 6.0%
5.7%
5.1% 5.2% 5.2% 5.2%
4.7%
1Q18 1H18 9M18 FY18 1Q19 1Q18 1H18 9M18 FY18 1Q19
Solvency II ratio
FY18 1Q19 The decrease (-7% points) in the Solvency II ratio
was mainly the result of lower interest rates and
Solvency II ratio 217% 210% additional bond purchases
38Strong and growing customer funding base with liquidity
ratios remaining very strong
KBC Bank continues to have a strong retail/mid-cap deposit base in its core markets – resulting in a stable funding mix with a significant portion of the funding
attracted from core customer segments and markets
Customer funding increased further versus FY18. The net unsecured interbank funding was related to ST arbitrage opportunities
9% 10%
10% 8% 100% Funding from customers (mln EUR)
4% 5% 8% 7%
2% 2% 7% 155 774 163 824 167 504
8% 8% 8% 9% 9% 133 766 139 560 143 690
9% 7%
9% 8% 8% 7%
3% 3% 8% 10%
FY14 FY15 FY16 FY17 FY18 1Q19
77% 78%
73% 73% 69% 70%
5%
78%
Retail and SME
customer 20%
Mid-cap
-1% -6% driven
-9% -11% Government and PSE
75%
FY14 FY15 FY16 FY17 FY18 1Q19
Net unsecured interbank funding Total equity
Net secured funding Certificates of deposit
Debt issues placed with institutional investors Funding from customers
Ratios FY18 1Q19 Regulatory requirement NSFR is at 138% and LCR is at 140% by the end of 1Q19
NSFR* 136% 138% ≥100% • Both ratios were well above the regulatory requirement of 100%
LCR** 139% 140% ≥100%
* Net Stable Funding Ratio (NSFR) is based on KBC Bank’s interpretation of the proposal of CRR amendment.
** Liquidity Coverage ratio (LCR) is based on the Delegated Act requirements. From EOY2017 onwards, KBC
Bank discloses 12 months average LCR in accordance to EBA guidelines on LCR disclosure 39Upcoming mid-term funding maturities
Breakdown Funding Maturity Buckets CoCo has been called (on 25 January 2018)
6000
(Including % of KBC Group’s balance sheet) KBC Bank placed covered bonds of 750m EUR with 8-year maturity
1.9% and 250m EUR with 20-year maturity in March 2018
5000
1.8% KBC Group issued a perpetual non-call 7.5-year additional Tier-1
1.5%
instrument of 1bn EUR in April 2018
4000
KBC Group successfully issued its inaugural green senior benchmark
issue of 500m EUR with a 5-year maturity in June 2018
m EUR
2018 - 2019
3000
In January 2019, KBC Group NV has successfully issued a new senior
holdco benchmark of 750mn EUR with 5 year maturity
2000
0.7% 0.7% In March 2019, KBC Goup NV successfully issued a new perpetual
0.6% AT1 instrument of 500m EUR
1000
0.3 % KBC Group NV called the inaugural 1.4bn EUR AT1 instrument at its
0.3%
0.2% 0.2% first call date (March 2019)
In April 2019, KBC Group NV successfully issued a new senior holdco
0
2019 2020 2021 2022 2023 2024 2025 2026 2027 >= 2028 benchmark of 500m EUR with 6-year maturity.
Senior Unsecured - Holdco Senior Unsecured - Opco Subordinated T1 Subordinated T2 Covered Bond TLTRO
KBC Group’s credit spreads have tightened at the end of 1Q19 in line
with the overall market
21%
28% KBC Bank has 6 solid sources of long-term funding:
• Retail term deposits
Total • Retail EMTN
5% • Public benchmark transactions
outstanding =
23.1 bn EUR 6% • Covered bonds
• Structured notes and covered bonds using the private placement
10%
format
29%
• Senior unsecured, T1 and T2 capital instruments issued at KBC
Group level and down-streamed to KBC Bank
40KBC has strong buffers cushioning Sr. debt at all levels (31 March 2019)
Senior issued by KBC Bank, To large extent customer-
which will be limited going
forward (for funding
related, protected as
much as possible
KBC Group
reasons) Senior
4 769
Tier 2
KBC Bank 2 182 KBC Insurance
Senior Other liabilities
Additional Tier 1 Tier 2
574 45 668
1 500 500
Subordinated on loan by KBC Group
4 769 CET1 (fully loaded) Parent shareholders equity
15 112 3 131
Tier 2
379 1 682 Buffer for Sr. level 18.8 bn EUR
Additional Tier 1
1 500
CET1 (fully loaded)
12 588
Buffer for Sr. level 20.5bn EUR
Legacy T2 issued by KBC Bank will disappear over time
41
nominal amounts in million EURKBC well on track to comply with resolution requirements
The resolution plan for KBC is based on a Single Point of Entry (SPE) approach at KBC Group level
Bail-in is identified as the preferred resolution tool
SRB’s current approach to MREL is defined in the ‘2017 MREL Policy’ published on 20 December 2017, which is based on the current legal
framework and hence might be revised in the context of the ongoing legislative process to review BRRD
The MREL target for KBC is 25.9% as % of RWA (9.76% as % of TLOF), which is based on fully loaded capital requirements as at 31 December 2016
SRB requires KBC to achieve this target by 1 May 2019, using both HoldCo and eligible OpCo instruments. Taking into account the senior Holdco
issue of 500m EUR in April 2019, MREL amounted to 26.0% as % of RWA and 9.9% as % of TLOF
Regulatory requirement Consolidated approach Actual Equal to 9.7%
as % of TLOF
MCC 2.9% (CBR – 1,25%) HoldCo approach 25.4%
1.0% OpCo (T2 & senior >1y)
1.75% P2R = 24.4%
@ 95% RWA HoldCo senior 4.9%
RCA Gradually mature.
8% P1
T2 2.3% To be replaced by
AT1 1.6% HoldCo senior
= 25.9% Translated into a % of
TLOF: 9.76% MREL
4.15% CBR target
1.75% P2R
LAA
@ 100% RWA CET1 15.7%
8% P1
LAA Loss Absorbing Amount
RCA ReCapitalisation Amount
MCC Market Confidence Charge 42
1Q19
CBR = Combined Buffer Requirement = 2.5% Conservation Buffer +1.5% O-SII buffer + 0.15% countercyclical bufferAvailable MREL as a % of RWA (fully loaded)
26.4% 26.4% 26.0%
24.8% 1.4% 1.3% 25.4%*
1.0% 1.0%
1.3%
25.1% 25.1% 25.0% 24.4%
23.5%
1Q18 2Q18 3Q18 4Q18 1Q19
OpCo MREL HoldCo MREL
* Taking into account the senior Holdco issue of 500m EUR in April 2019, MREL amounted to 26.0% as % of RWA
43Latest credit ratings
Moody’s S&P Fitch
Senior Unsecured Baa1 A- A
Tier II - BBB A-
Group
Additional Tier I Ba1 BB+ -
Short-term P-2 A-2 F1
Outlook Positive Stable Stable
Covered Bonds AAA - AAA
Senior Unsecured A1 A+ A+
- BBB -
Bank
Tier II
Short-term P-1 A-1 F1
Outlook Positive Stable Stable
-
Insurance
Financial Strength Rating - A
Issuer Credit Rating - A -
Outlook - Stable -
Latest updates:
• 23 Nov 2018: Fitch rating upgrade of KBC Bank
• 19 Nov 2018: Moody’s revised KBC Group, KBC Bank and KBC Bank Ireland outlook to positive and affirmed ratings
• 30 July 2018: S&P rating upgrade of KBC Group, KBC Bank, Insurance and CSOB CR.
44Contents
1 Strategy and business profile
2 Financial performance
3 Solvency, liquidity and funding
4 Covered bond programme
5 Green bond framework
6 Looking forward
Appendices
45KBC’s covered bond programme
Residential mortgage covered bond programme
The covered bond programme is considered as an important funding tool for the treasury department.
KBC’s intentions are to be a frequent benchmark issuer if markets and funding plan permit.
Issuer: • KBC Bank NV
• min 105% of covered bond outstanding is covered by residential mortgage loans and
Main asset category:
collections thereon
• Up to 10bn EUR (only)
Programme size:
• Outstanding amount of 6,67bn EUR
Interest rate: • Fixed rate, floating rate or zero coupon
• Soft bullet: payment of the principal amount may be deferred past the final maturity
Maturity: date until the extended final maturity date if the issuer fails to pay
• Extension period is 12 months for all series
• Failure to pay any amount of principal on the extended final maturity date
Events of default:
• A default in the payment of an amount of interest on any interest payment date
Rating agencies: • Moody’s Aaa / Fitch AAA
Moody’s Fitch
Over-collateralisation 10% 7,5%
TPI Cap Probable D-cap 4 (moderate risk)
46KBC’s covered bond programme
Belgian legal framework
Direct covered bond issuance from a bank’s balance
sheet
Dual recourse, including recourse to a special estate
with cover assets included in a register
The special estate is not affected by a bank’s insolvency
National Bank of Requires licenses from the National Bank of Belgium
Belgium (NBB)
Ongoing supervision by the NBB
The cover pool monitor verifies the register and the
Cover Pool
portfolio tests and reports to the NBB
Monitor
The NBB can appoint a cover pool administrator to
manage the special estate
Covered bonds
Issuer Special Estate with Cover
Note Holders
Assets in a Register
Proceeds
Cover Pool Representative
Administrator of the Noteholders
47KBC’s covered bond programme
Strong legal protection mechanisms
1 The value of one asset category must be at least 85% of the nominal amount of
covered bonds
Collateral type
• KBC Bank selects residential mortgage loans and commits that their value (including
collections) will be at least 105%
2 The value of the cover assets must at least be 105% of the covered bonds
Over- • The value of residential mortgage loans:
1) is limited to 80% LTV
collateralisation
Test 2) must be fully covered by a mortgage inscription (min 60%) plus a mortgage mandate (max 40%)
3) 30 day overdue loans get a 50% haircut and 90 days (or defaulted) get zero value
3
The sum of interest, principal and other revenues of the cover assets must at
Cover Asset least be the interest, principal and costs relating to the covered bonds
Coverage Test • Interest rates are stressed by plus and minus 2% for this test
4 Cover assets must generate sufficient liquidity or include enough liquid assets to
Liquidity Test pay all unconditional payments on the covered bonds falling due the next 6
months
Interest rates are stressed by plus and minus 2% for this test
5
Cap on Issuance Maximum 8% of a bank’s assets can be used for the issuance of covered bonds
48KBC’s covered bond programme
Cover pool
COVER POOL: BELGIAN RESIDENTIAL MORTGAGE LOANS
• Exclusively, this is selected as main asset category
• Value (including collections) at least 105% of the outstanding covered bonds
• Branch originated prime residential mortgages predominantly out of Flanders
• Selected cover asset have low average LTV (60.57%) and high seasoning (54 months)
KBC HAS A DISCIPLINED ORIGINATION POLICY
• 2009 to 2018 residential mortgage loan losses below 4 bp
• Arrears in Belgium approx. stable over the past 10 years:
(i) Cultural aspects, stigma associated with arrears, importance attached to owning one’s
property
(ii)High home ownership also implies that the change in house prices itself has limited
impact on loan performance
(iii)Well established credit bureau, surrounding legislation and positive property market
49Contents
1 Strategy and business profile
2 Financial performance
3 Solvency, liquidity and funding
4 Covered bond programme
5 Green bond framework
6 Looking forward
Appendices
50Sustainability
Introduction to KBC’s Green Bond
Rationale: enhancing the KBC sustainability strategy Aligned with best practices and market developments
KBC is convinced that the financial industry has a key role to play in the The KBC Green Bond Framework is in line with the Green
transition to a low carbon economy and is willing to contribute to the Bond Principles (2017)
development of a sustainable financial market Second party opinion provided by Sustainalytics and Pre-
Green funding provides an opportunity to KBC Bank to further enhance its issuance- certification by the Climate Bonds Initiative
ability to finance the green projects of its clients and to mobilise all its KBC intends to align its Green Bond Framework with
stakeholders around this objective emerging good practices, such as a potential European
Green Bond Standard or other forthcoming regulatory
requirements and guidelines
KBC Green Bond Framework
For latest impact report we refer to the KBC.COM website:
KBC follows the momentum created by the inaugural EUR 4.5bn Green https://www.kbc.com/en/kbc-green-bond
OLO issued by the Kingdom of Belgium in February 2018
KBC is implementing a comprehensive sustainability bond strategy to
support the development of the Green Bond markets in Belgium and
Europe
KBC Green Bonds can be issued under the KBC Green Bond Framework via
KBC Group NV, KBC Bank NV or any of its other subsidiaries
In case of Green Bonds issued at the holding company level (KBC Group
NV), KBC will allocate an equivalent amount of the proceeds to KBC Bank
or its subsidiaries where the Eligible Assets are located
The KBC Green Bond Framework is intended to accommodate secured and
unsecured transactions in various formats and currencies
51Sustainability
First green bond (June 2018)
KBC GREEN PORTFOLIO APPROACH
Certification
Inclusion of KBC will ensure the
existing and availability of sufficient
new Green Green Assets to match On 23 May 2018, the Climate
Assets Green funding Bonds Standard Board approved
the certification of the proposed
KBC Green Bond
Green
Bond
portfolio Green
Bond
Verification
Deletion of funding
ineligible or One year after issuance and until
maturity, a limited assurance
amortising
report on the allocation of the
Green Assets Green Bond proceeds to Eligible
Assets to be provided by an
At a first stage, in the context of the inaugural Green Bond, KBC allocated the external auditor
proceeds to two green asset categories: renewable energy (share of 40%) and Latest impact report available on
KBC.COM website:
residential real-estate loans (share of 60%). https://www.kbc.com/en/kbc-
Within those categories, KBC has labelled EUR 0.7 billion of Green Assets (status green-bond
March 2019) in Belgium.
For future transactions, in cooperation with the relevant business teams, KBC aims to
capture more green assets from other categories and expand the green eligibility to
more business lines and clients.
52Contents
1 Strategy and business profile
2 Financial performance
3 Solvency, liquidity and funding
4 Covered bond programme
5 Green bond framework
6 Looking forward
Appendices
53Looking forward
In line with global economic developments, the European economy is currently in a slowdown
period. However, this is likely temporary and we expect a rebound in 2020. Decreasing
unemployment rates, with growing labour shortages in some European economies, combined
Economic with gradually rising wage inflation will continue to support private consumption. Moreover, also
outlook investments will remain an important growth driver. The main elements that could substantially
impede European economic sentiment and growth remain the risk of further economic de-
globalisation, including an escalation of trade conflicts, Brexit and political turmoil in some euro
area countries
Solid returns for all Business Units
The acquisition of the remaining 45% of CMSS in the Czech Republic is expected to close before
the end of 2Q19. The transaction will have an impact of approximately -0.3% points on KBC
Group Group’s strong CET1 ratio. The revaluation of KBCs 55% stake in CMSS will lead to a one-off P&L
guidance gain for KBC, estimated at approximately 80m EUR
B4 impact (as of 1 January 2022) for KBC Group estimated at roughly 8bn EUR higher RWA on
fully loaded basis at year-end 2018, corresponding with 9% RWA inflation and -1.3% points
impact on CET1 ratio
Next to the Belgium and Czech Republic Business Units, the International Markets Business Unit
Business
has become a strong net result contributor (although 2018 figures were flattered by net
units impairment releases)
54Appendices
1 Overview of outstanding benchmarks
2 Summary of KBC’s covered bond programme
3 Solvency: details on capital
4 Details on business unit international markets
5 Details on credit exposure of Ireland
55Annex 1 - Outstanding benchmarks
Overview till end of April 2019
Amount Next Own
Type Issuer Maturity coupon ISIN reset spread Trigger Level MREL
(in mio) call date funds
Additional Tier1
temporary
AT1 24/04/2018 KBC Group 1 000 € 24/10/2025 Perpetual 4,250% BE0002592708MS 5Y+ 359,4bps write-down 5,125%
temporary
AT1 10/03/2019 KBC Group 500 € 10/03/2024 Perpetual 4,750% BE0002638196MS 5Y+ 468,9bps write-down 5,125%
Tier2: subordinated notes
GBP 3M Libor supervisory event
GF*
AT1 KBC Bank £44,5 19/12/2019 Perpetual 6,202% BE0119284710 + 193bp or concursus
regulatory+
T2 25/11/2014 KBC Group 750 € 25/11/2019 25/11/2024 2,375% BE0002479542 MS 5Y+ 198bps tax call
regulatory+
T2 11/03/2015 KBC Group 750 € 11/03/2022 11/03/2027 1,875% BE0002485606 MS 5Y+ 150bps tax call
regulatory+
T2 18/09/2017 KBC Group 500 € 18/09/2024 18/09/2029 1,625% BE0002290592 MS 5Y+ 125bps tax call
Amount * GF: Grand-fathered
Type Issuer Maturity coupon ISIN MREL
(in mio)
Senior
Senior 26/06/2016 KBC Group 750 € 26/04/2021 1,000% BE6286238561
Senior 18/10/2016 KBC Group 750 € 18/10/2023 0,750% BE0002266352
Senior 01/03/2017 KBC Group 1 250 € 1/03/2022 0,750% BE0002272418
Senior 24/05/2017 KBC Group 750 € 24/11/2022 3M+0,55% BE0002281500
Senior 27/06/2018 KBC Group 500 € 27/06/2023 0,875% BE0002602804
Senior 07/02/2019 KBC Group 750 € 25/01/2024 1,125% BE0002631126
Senior 10/04/2019 KBC Group 500 € 10/04/2025 0,625% BE0002645266
Covered bonds
CB 31/1/2013 KBC Bank 750 € 31/01/2023 2,000% BE0002425974
CB 28/5/2013 KBC Bank 1 000 € 28/05/2020 1,250% BE0002434091
CB 22/1/2015 KBC Bank 1 000 € 22/01/2022 0,450% BE0002482579
CB 28/4/2015 KBC Bank 1 000 € 28/04/2021 0,125% BE0002489640
CB 1/3/2016 KBC Bank 1 250 € 1/09/2022 0,375% BE0002498732
CB 24/10/2017 KBC Bank 500 € 24/10/2027 0,750% BE0002500750
CB 8/3/2018 KBC Bank 750 € 8/03/2026 0,750% BE0002583616
56Annex 1
Credit spreads evolution
Credit Spreads Evolution
140
210
120
100 160
80
110
60
40 60
20
10
0
-20 -40
0.5Y Senior Debt Opco (LHS) 5Y Covered Bond Interpolated (LHS) 5Y Senior Debt Holdco Interpolated (LHS) 7NC2 Subordinated Tier 2 (RHS)
57Annex 2 – KBC’s covered bond programme
Key cover pool characteristics
Investor reports, final terms and prospectus are available on www.kbc.com/covered_bonds
Portfolio data as of : 31 March 2019
Total Outstanding Principal Balance 10 637 504 442
Total value of the assets for the over-collateralisation test 9 949 837 411
No. of Loans 141 968
Average Current Loan Balance per Borrower 106 688
Maximum Loan Balance 1 000 000
Minimum Loan Balance 1 000
Number of Borrowers 99 707
Longest Maturity 359 month
Shortest Maturity 1 month
Weighted Average Seasoning 61 months
Weighted Average Remaining Maturity 176 months
Weighted Average Current Interest Rate 2.09%
Weighted Average Current LTV 60%
No. of Loans in Arrears (+30days) 255
Direct Debit Paying 98%
58Annex 2 – KBC’s covered bond programme
Key cover pool characteristics
REPAYMENT TYPE (LINEAR VS. ANNUITY) GEOGRAPHICAL ALLOCATION
Brussels Hoofdstedelijk gewest
5% Waals Brabant
Linear 1%
3%
Oost-
Vlaanderen Vlaams
18% Brabant
18%
West-
Vlaanderen
14%
Annuity Luxemburg Antwerpen
97% 0% 29%
Limburg
Henegouwen 13%
1% Luik
Namen
1%
0%
LOAN PURPOSE INTEREST RATE TYPE (FIXED PERIODS)
Construction
10% 10 y / 5 y 15 y 20 y / 5 y
1% /5y 0%
5 y / 5 y… 0%
Purchase 3y/3y
Remortgage 49% 15%
41% 1y/1y
No review
12%
64%
59Annex 2 – KBC’s covered bond programme
Key cover pool characteristics
FINAL MATURITY DATE SEASONING
25,00
70,00
Weighted Average
60,00 20,00 Seasoning:
Weighted Average
Remaining Maturity: 61 months
50,00
176 months 15,00
40,00
30,00 10,00
20,00 5,00
10,00
0,00
0,00
0 - 12 13 - 2425 - 3637 - 4849 - 6061 - 7273 - 8485 - 9697 -108 109 -
2013 - 2017 2018 - 2022 2023 - 2027 2028 - 2032 > 2032
INTEREST RATE
CURRENT LTV
80,00
Weighted 18,00
70,00 16,00
Average Current Weighted Average
60,00 14,00
Interest Rate: 12,00 Current LTV:
50,00
2.09% 10,00 60%
40,00 8,00
30,00 6,00
20,00 4,00
2,00
10,00 0,00
0,00Annex 2 – KBC’s covered bond programme
Benchmark issuance KBC covered bonds
Since establishment of the covered bond programme KBC has issued eight benchmark issuances:
SPREAD EVOLUTION KBC COVERED BONDS (SPREAD IN BP VERSUS 6 MONTH MID SWAP)
Source Bloomberg Mid ASW levels
61Annex 2: Belgian real estate market
Roughly stabilization in prices since 2012, with again an acceleration from
2016 onwards
House prices Belgium (*)
(*) Corrected for price changes resulting from changes Debt position Belgian households
in the quality and location of the real estate sold (outstanding amounts, in % of GDP)
Belgium - Other debt (consumer loans)
Index (Q1 2008 = 100, lhs) 16 80% Belgium - Mortgage debt
Year-on-year change (in %, rhs)
14 Euro Area (total debt)
120 70%
12
60%
115 10
8 50%
110 6 40%
4
105 30%
2
0 20%
100
-2 10%
95 -4
0%
Source: FOD Economie Source: NBB.Stat; ECB
62Annex 2: Belgian real estate market
In 2018, price growth fell back to 2.9% yoy, from 3.6% yoy in 2017
63Annex 2 - Interest rates still historically low
64You can also read