Event-Triggered Ephemeral Group Communication and Coordination over Sound for Smart Consumer Devices - MDPI
←
→
Page content transcription
If your browser does not render page correctly, please read the page content below
sensors
Article
Event-Triggered Ephemeral Group Communication
and Coordination over Sound for Smart
Consumer Devices
Doohwan Song 1,2 , Ikjun Yeom 2 and Honguk Woo 2, *
 1    Samsung Electronics, Suwon 16677, Korea; duhwan.song@samsung.com
 2    Sungkyunkwan University, Suwon 16419, Korea; ikjun@skku.edu
 *    Correspondence: hwoo@skku.edu

 Received: 13 March 2019; Accepted: 18 April 2019; Published: 20 April 2019

 Abstract: Voice-based interfaces have become one of the most popular device capabilities, recently
 being regarded as one flagship user experience of smart consumer devices. However, the lack
 of common coordination mechanisms might often degrade the user experience, especially when
 interacting with multiple voice-enabled devices located closely. For example, a hotword or wake-up
 utterance such as “hi Bixby” or “ok Google” frequently triggers redundant responses by several
 nearby smartphones. Motivated by the problem of uncoordinated react of voice-enabled devices
 especially in a multiple device environment, in this paper, we discuss the notion of an ephemeral
 group of consumer devices in which the member devices and the transient lifetime are implicitly
 determined by an external event (e.g., hotword detection) without any provisioned group structure,
 and specifically we concentrate on the time-constrained leader election process in such an ephemeral
 group. To do so: (i) We first present the sound-based multiple device communication framework,
 namely tailtag, that leverages the isomorphic capability of consumer devices for the tasks of processing
 hotword events and transmitting data over sound, and thus renders both the tasks confined
 to the same room area and enables the spontaneous leader election process in a unstructured
 group upon a hotword event. (ii) To improve the success rate of the leader election with a
 given time constraint, we then develop the adaptive messaging scheme especially tailored for
 sound-based data communication that inherently has low data rate. Our adaptive scheme utilizes an
 application-specific score that is individually calculated by a member device for each event detection,
 and employs score-based scheduling by which messages of a high score are scheduled first and so
 unnecessary message transmission can be suppressed during the election process. (iii) Through
 experiments, we also demonstrate that, when a hotword is detected by multiple smartphones in
 a room, the framework with the adaptive messaging scheme enables them to successfully achieve
 a coordinated response under the given latency bound, yielding an insignificant non-consensus
 probability, no more than 2%.

 Keywords: voice-based interface; hotword; coordinated react; ephemeral group; data communication
 over sound; smart consumer device

1. Introduction
     Theses days, voice-based interfaces and assistants (e.g., Google Assistant, Apple Siri,
Amazon Alexa, and Samsung Bixby) have obtained attention from the consumer device markets.
Besides high-end smartphones equipped with voice-based interfaces and several auxiliary sensors,
a set of new voice-enable devices of different form factors, e.g., Home speaker [1] and Familyhub
refrigerator [2], have been introduced, and even resource-constrained wearables and smartwatches

Sensors 2019, 19, 1883; doi:10.3390/s19081883                                 www.mdpi.com/journal/sensors
Sensors 2019, 19, 1883 2 of 19
have become more capable of natural interactions. It is definitely anticipated that non-traditional
smart devices such as connected cars and home appliances (e.g., robot cleaners) will render their user
interfaces more intelligent and context-aware with ever-evolving machine learning based cognitive
applications as well as device components including microphones and speakers. The global market of
voice assistants is expected to grow significantly, up to USD 7.8 billion by 2023 [3], and the competition
in the market gets fiercer; e.g., at the Bixby developer event in 2018, it was announced that Samsung
plans to install the voice assistant Bixby on all its consumer electronics products, i.e., billions of devices,
by 2020 [4].
As the trend of natural interactions is likely to expand across various device types and service
domains, it might necessitate the cautious configuration and deployment in order not to incur awkward
situations and unnecessary communication. Consider the common case in which two or more
smartphones having the same voice assistant are closely located. Having a hotword (wake-up),
e.g., “ok Google” or “hi Bixby”, a user might experience that several simultaneous responses,
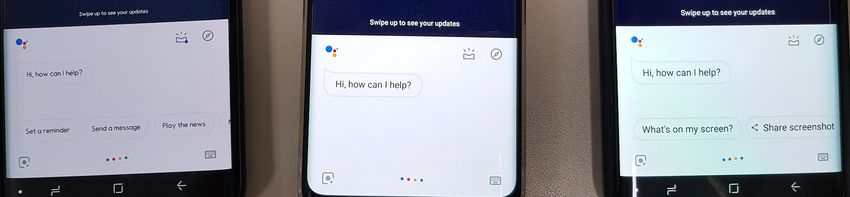
often seemingly arbitrary, from different smartphones are activated as the react signals (see Figure 1).
(a) Bixby case
(b) Google Assistant case
Figure 1. Uncoordinated react of voice-based interaction.
Few workaround schemes for achieving a controlled and consensus decision about a responder
among multiple devices are introduced. The short phrases for hotwords can be customized [5]
or the priority among a set of devices being logged-in under the same account can be stored [6],
which commonly relies on managed backend infrastructures and user configurations, or only considers
single-user scenarios. Similar to the aforementioned case of desiring a single coordinated response of
multiple consumer devices upon a user hotword, there are several situations in which a set of devices
in close proximity often need to instantly build a group and then temporally collaborate for taking
a timely step toward the given group goal, e.g., sharing the credentials upon a new member in an
ad-hoc network and tracking objects by surveillance sensors and cameras [7–9]. We consider a group
of devices to be ephemeral when an external event implicitly sets up the group members only for a short
period while the event is being handled by the group. Thus, an ephemeral group is temporal and
no provision at the infrastructure level for the group management is assumed.
In this paper, we focus on such an ephemeral group being triggered by a hotword event in a
room, and investigate its coordination mechanism tailored for timely reacting to the event. To this end,
we first present the sound-based multiple device communication framework, tailtag that renders data
transmission naturally confined to the same room area with hotword detection, and thus supports
short group communication with no group structure. Notice that sound-based communication is
effective for applications with room area context [10]. Accordingly, having a hotword event in a
room, the tailtag framework enables each device in the event-triggered ephemeral group to efficiently
broadcast its message in the group. Furthermore, we address the time-constrained leader electionSensors 2019, 19, 1883 3 of 19
problem over sound by exploring adaptive messaging strategies that can improve the quality of the
tailtag framework in terms of the success rate of timely leader election.
Note that the aforementioned problem of uncoordinated react of multiple voice-enabled consumer
devices can be investigated within the scope of the traditional leader election problem in a distributed
system, which has been studied over several decades. Formal algorithms are proposed to solve the
problem in [11–13], and they are applied to practical areas such as mobile ad-hoc networks [14] and
wireless sensor networks [15].
The leader election problem for our ephemeral group setting, however, is more practical and
requires a specific solution under the following two conditions: (i) to maintain the same room area
context between event detection and group communication, devices utilize sound for data transmission;
and (ii) to meet the user interaction requirements of voice-based interfaces, the time bound of each
election process is strictly restricted. Under these two conditions, we develop an adaptive messaging
scheme that can be seen as a variant of bully algorithms [13,16], yet adapted for sound-based data
communication and time-constrained leader election. Specifically, having an application-specific
score that is immediately available upon event detection, each device adjusts the backoff delay value
depending on its score in a way that messages of a high score are delivered first. This behavior of
individual devices reduces collisions on shared sound channels especially for important messages and
thus is likely to increase the chance to resolve the leader within a given time bound. The enhancements
of adaptive messaging are discussed and presented in the form of several adaptive delay functions
in Section 3.3.
The proposed framework combined with the adaptive messaging scheme enables us to
incorporate a lightweight coordination mechanism into voice-based interfaces (e.g., Bixby on Samsung
smartphones), thereby enhancing voice-based user experiences especially in a multiple device
environment. Moreover, the isomorphic structure of the framework and existing voice-based interfaces
simplifies the framework integration at device-side. The contributions of this paper are as follows.
• Having the motivating real-world problem, that is, the uncoordinated reaction of today’s
voice-enabled consumer devices (in Section 2.1), we present the framework solution tailtag,
which employs the sound-based data communication tailored to the problem (in Section 3).
• We introduce the adaptive messaging scheme, considering the inherent restriction of sound for
data transmission. This enables expediting the message transmission of high significance and
suppressing the unnecessary message transmission, hence providing a reliable solution to our
specific time-constrained leader election problem (in Section 3.3).
• We conducted simulation experiments under various environmental conditions, demonstrating
that the framework adoption is able to meet the requirement of the real application scenarios,
such as 98% accuracy for the Bixby hotword case, where the accuracy was measured based on
the rate that, within the given latency bound, a single (non-redundant) response among multiple
Bixby-enabled smartphones is appropriately made (in Section 4).
2. Background
In this section, we explain the motivation of our work toward the sound-based communication
and coordination for an ephemeral group of consumer devices and describe the technical foundation
of short messaging over sound wave.
2.1. Motivation
Suppose there are three smartphones with the voice-based service, e.g., D1 and D2 of user U1
and D3 of user U2 in near proximity. Further, suppose that user U1 tries activating the service with its
hotword. It is expected that either D1 or D2 responds, but often they both respond redundantly and
even worse D3 does too. We call these undesirable situations uncoordinated react.Sensors 2019, 19, 1883 4 of 19
Figure 1 depicts the example situations of uncoordinated react by hotword utterances of Bixby
and Google Assistant, showing that three Android smartphones all are simultaneously responding
to the hotword “hi Bixby” or “ok Google”, respectively. It is observable that the situations happen
mainly due to two conditions: (i) the limited capability of individual devices in context understanding;
and (ii) no mechanism commonly adopted for device collaboration.
Figure 2 demonstrates an example of the limited capability of an individual device in recognizing
the user context and determining whether it should respond to a user hotword. We tested the
Bixby voice assistant app on Samsung Galaxy S8 Android smartphones, which has the advanced
sensitivity configuration such that the low sensitivity intends to cautiously react only to the registered
user (i.e., the smartphone owner who registered and trained her voice), thus frequently rendering no
response at all, while the high sensitivity intends to react anyway, thus frequently incurs unwanted
redundancy. This recently released sensitivity supports the user-configurable settings, including
low, medium, and high options, and aims at mitigating the issue of limited context understanding
such as inherently imperfect recognition of the registered user voice. However, our tests with the
options show the tradeoff. In the 1 m distance test between a tester saying the Bixby hotword
and the two smartphones (one is registered by the tester and the other is not), when having the
medium sensitivity, about 87% hotword requests of the registered tester were successfully responded
the number o f tester device0 s responses
(denoted by True positive rate, the number o f tester 0 s hotwords ), but many requests (up to 19%) were
the number o f the other device0 s responses
arbitrarily responded (denoted by False positive rate, the number o f tester 0 s hotwords ); similarly,
when having the low (high) sensitivity setting, both percents decreased (increased). Notice that the
the response rate for each sensitivity option might vary depending on the experiment conditions and
thus our analysis should be limited to only the tradeoff pattern commonly observed with respect to
the sensitivity options. Notice that the sensitivity of the current Bixby version needs to be manually set
by a user, and, furthermore, it rarely considers a multiple device environment, thus has no support for
configuring a set of devices of a same user or multiple users.
True positive False positive
1 1 1
Response rate
0.5 0.5 0.5
0 0 0
High Medium Low High Medium Low High Medium Low
(a) Distance (1 m) (b) Distance (3 m) (c) Distance (5 m)
Figure 2. Tradeoff of Sensitivity Configuration for Hotword Response: (a) the response rates (on
y-axis) depending on the sensitivity options (on x-axis) when a hotword is uttered at 1 m distance;
and (b,c) the cases of 3 m and 5 m distance, respectively. The test was performed 100 times per each
configuration (combination) of three sensitivity options, five testers (adults aged over 25, with about
70 dB utterance volume), and three different distances in a room (5 m2 ) with no significant ambient
noise, less than 40 dB.
The undesirable behaviors of individual devices aforementioned become even worse in multiple
user, multiple device environments. Thus, it is worthwhile considering a common coordination
mechanism for enabling a group of individual devices to shortly communicate and collaborate, hence,
e.g., letting them achieve a single response appropriately through some consensus process upon an
event toward the group. For building such a common mechanism of device communication and
collaboration, it is natural to exploit either cloud-based service or device-to-device direct connectivity
approaches. In the cloud-based service approach, each device with long-distance connectivity acts as a
client connecting to a server and so client devices in a group can communicate and collaborate by the
direction of the server. In the direct device-to-device approach, local connectivity such as BLE or WiFi
is exploited for discovery, pairing, and sharing among nearby devices. In the following, we explainSensors 2019, 19, 1883 5 of 19
that both conventional approaches might not be a good solution for the the problem of uncoordinated
react unless correctly configured for a specific scenario.
In cloud-based services, a group of devices needs to be provisioned based on their proximity or
user registration. The GPS position accuracy of mobile devices has been investigated and measured as,
e.g., 5–8.5 m range errors outdoors [17], and up to 100 m range errors indoors [17]. Figure 3a illustrates
the location estimation accuracy of smartphones both indoors and outdoors. In this experiment, we set
up a pair of Samsung Galaxy devices to update the location estimates using Android 8.0 location APIs
(android.location.LocationManager) every 10 s to the server, and then observe the high variances.
This implies that grouping a set of devices based on the location APIs is not appropriate particularly
when the devices are in close proximity.
30 3 0
outdoor indoor w/o grouping overhead BLE-Same Room BLE-Other Room
Location difference (m)
w/ grouping overhead Wifi-Same Room Wifi-Other Room
Strength(dBm)
20 2 -50
Latency(s)
10 1 -100
0 0 -150
10 20 30 40 50 60 70 80 90 100 5 10 20 1 3 5
(a) Location errors (b) Grouping overhead (c) Local connectivity
Figure 3. Challenges of conventional cloud-based and local connectivity approaches for the
uncoordinated react problem: (a) the difference of location estimates (on y-axis) of the two smartphones
of a same walking person over time, based on the 10 measurements at every 10 s during 100 s (on x-axis);
(b) the latency of group information sharing (on y-axis) with respect to the group size (on x-axis), where
the grouping overhead denotes the case where no provisioned group connections are managed, thus
requiring the time for establishing the group connection upon a request; and (c) the measured strength
averages (on y-axis) of BLE and WiFi signals with respect to the distances between the signal source
and the receiver (on x-axis) where the measurement was performed 100 times for each distance and
connectivity. All tests were performed with Samsung Galaxy S8 and S6 smartphones.
While there are enhanced technologies on indoor localization, e.g., WiFi RSS fingerprinting [18–20]
that relies on the mapping of data collected before operation, or trilateration [21] that exploits distance
measurements from the reference locations by multiple access points [18], those require a certain
type of system provisioning at the infrastructure level. Figure 3b illustrates the overhead of device
group management and communication through cloud severs. For the experiment, we set up a group
of 5–20 clients connecting a provisioned backend server through either WiFi or LTE, and let them
immediately share the information upon an external event, a pair of client id and random integer k,
via the server so that they could render a consensus about the top rank arg maxid k. The latency was
increased more than three times unless a group of clients could immediately utilize the established,
authenticated connections to the server, and use the provisioned group management.
Most local connectivity technologies have penetrative nature. Thus, the local connectivity only
solutions are not often useful for the room area context [10]. Figure 3c shows the received signal
strength measured by smartphones using BLE and WiFi, indicating that those signals are rarely useful
for differentiating the devices in the same room and the devices in the next room. In Figure 4, suppose
we expect only D1, D2 and D3 in the same room become the members of a group for the event in the
Room 1. As shown in Figure 4c, however, D4 and D5 in the next room might be within the range
where the local connectivity is reached, and then there might be no significant difference among the
devices in terms of the connectivity signals. Such room area context problems can be addressed by
using the sound-based communication since sound wave signals hardly pass through walls and thus
only devices in the same space can communicate using the sound wave [10].
The aforementioned limitation of conventional cloud-based and device-to-device approaches
necessitates an alternative method to make an instant group and enable the short group communication.Sensors 2019, 19, 1883 6 of 19
In the next section, we explain the generalized form of the problem of uncoordinated react and our
approach based on sound-based data communication.
Room1 Room2 Room1 Room2 Room1 Room2
D1 D4 D1 D4 D1 D4
D2 D2 D2
D3 D5 D3 D5 D3 D5
: Event : Event : Event
(a) Event occurrence (b) Room area context (c) No room area context
Figure 4. Communication in Room Area Context: each circle denotes the confinement of the ephemeral
group members in the room area context, but others in the next room might have signals due to
the penetrative nature of local connectivity. (b,c) The cases of having the room area context and not,
respectively, for the two events occurred simultaneously, as shown in (a).
2.2. Sound-Based Data Communication
We consider the use cases of today’s smart consumer devices in which an external event occurs in
a multiple device environment and a set of devices individually detecting the event need to form a
tentative group for collaboratively taking an action. As explained above, such a group is regarded to
be ephemeral and it has neither provisioned controllers nor predefined group structures. In the context
of uncoordinated react, we view that a hotword is such an external event that triggers an ephemeral
group of consumer devices, and a timely, non-duplicated, and appropriate response is such an action
of the group. Our proposed approach for supporting an ephemeral group, the tailtag framework,
employs sound-based data communication. It should be noted that voice-based interfaces and our
approach are isomorphic in that processing hotword events and using the tailtag framework utilize the
same microphone and speaker capability of devices, and both rely on the room area context.
In the following, we show a set of profiling experiments on sound-based data communication
with modern consumer devices, Samsung Galaxy S8 (or S6) smartphones that support digital
recording up to 32 bits/384 kHz (or 24 bits/192 kHz) and uses a high AOP (Acoustic Overload Point)
microphone. Specifically, we implemented the MFSK (Multiple Frequency Shift Keying) modulation
using AudioTrack [22] with the setting of 44.1 kHz sampling frequency as the same setting as most
audio interfaces and 4410 samples per block. This yielded 0.1 s for the transmission time of one block
(denoted by D p ). We utilized the inaudible frequency range between 18 kHz and 21 kHz, considering
the environment of consumer devices directly interacting with users. Furthermore, we established
100 usable frequencies (denoted by Fall ) for the given bandwidth of 3 kHz in that the fast Fourier
transform was used to extract the frequency in 30 Hz units when receiving signals.
Figure 5a depicts the performance characteristic of data transmission over sound in our default
profiling configuration where the distance of the sender and the receiver devices was 1 m in a room
and the sender device utilized the maximum volume over inaudible sound. While the transmission
time varied greatly depending on the byte size (the difference of 1 byte and 4 bytes is more than
three times), there was insignificant difference in bit-rate. Having the same setting of the previous
experiment, Figure 5b shows the received signal strength over different channels. In this experiment,
we had seven channels in a way that the channel id was incremented on the inaudible frequency from
18 kHz to 21 kHz, As shown, the closer to 18 kHz was the channel, the stronger was the received signal.
Similarly, Figure 5c depicts the received signal strength and the noise strength on the 21 kHz band
(channel id = 7) where the strength was weakest. The result by the different volumes of the sender
device allowed us to configure the threshold value, i.e., 5 dB, for appropriately filtering noises.
Figure 5d demonstrates the effect of possible signal interference that can be incurred by the narrow
intervals between adjacent frequency bands used. The experiment showed that the 360 Hz interval
can ensure the high success rate of transmitting data. Figure 5e shows the effect of device volumes.Sensors 2019, 19, 1883 7 of 19
As expected, it was found that the higher was the device volume, the higher was the success rate of
transmitting data. The experiment illustrated that the distance was also relevant because it influenced
the strength measured by a receiver. Figure 5f depicts the benefit of sound-based communication by
which devices can be properly differentiated in the room area context, different from the other local
connectivity technologies shown in Figure 3c.
Channel id: 1 2 3 4 5 6 7 30
Transmission Time(s)
Transmission time Bit-rate
21kHz noise
Bit-rate(bps)
60
Strength(dB)
50 20
Strength(dB)
40
30
10
20
10
0 0
1 2 4 8 1 2 3 4 5 6 7 8 9 10 100 80 60 40 20 5
Bytes Distance(m) Device speaker volume(%)
(a) Transmission bit-rate (b) Channels (c) Strength on 21 kHz
Transmission Success Rate
1
Transmission Success Rate
80
1m 3m Same Room Other Room
60
Strength(dB)
0.5
40
20
0 0
60 120 180 240 300 360 420 5 20 40 60 80 100 1 3 5
Frequency interval(Hz) Device speaker volume(%) Distance(m)
(d) Frequency intervals (e) Device volumes (f) Received Strength
Figure 5. Data transmission experiments using microphones and speakers of consumer devices: these
show the test results when MFSK modulation is used for small data transmission through the inaudible
frequency range. Each measurement was performed 100 times and denoted by their average value.
The experiments thus far motivated us to design the framework optimized particularly for
small data transmission with time constraints in a multiple device environment. The framework
follows several design choices toward the optimization: (i) We define the short message format for
the framework that contains two fields (1-bit start tag, 4-bit data payload). As shown in Figure 5a,
the short message structure favors the low latency. (ii) We use MFSK, a simple and robust modulation
method [23–26] to efficiently support small-sized messages. (iii) We exploit the multiple channels over
the inaudible frequency range from 18 kHz to 21 kHz. The threshold value for filtering noises is set at
5 dB (Figure 5c). The guard band for mitigating the inter-channel signal interference of FDM is set at
360 Hz (Figure 5d), and thus 12 frequencies of the channel-to-channel guard interval (denoted by Fg )
are obtained.
3. Framework Design
In this section, we describe the framework architecture and the framework parameters.
3.1. Overall System
Figure 6 depicts the system flow of the tailtag framework at each device. A member device in
the ephemeral group encapsulates a message of significance score with respect to the event detected,
and then broadcasts the message data over sound in the group. As shown below, through the
framework, we implemented a variant of bully algorithms [13,16] designed to meet the requirement
of our time-constrained leader election scenario of an event-triggered ephemeral group. Specifically,
the framework enables reaching a group consensus about the member device responding to the event,
i.e., the device of the highest score within a given time bound. In the example, D2 sends its message
with the score k = 8 on the channel c = 1 after some random delay d = 0.6 s, and, similarly, D3 sends its
message with the score k = 5 on the channel c = 2. However, D1 performs carrier sensing and cancels
its message. Given the time duration (time constraint in the figure), each device can figure out theSensors 2019, 19, 1883 8 of 19
highest score k = 8 of all the messages received yet, and thus is able independently to decide whether
to respond to the event; D2 becomes the responder. We use the term round to denote the bounded
duration for handling an event between the time when the event is detected and the time when the
responder is determined. The significance score is encoded in the data field of a message and is used
for comparison. The goal of ephemeral group communication is to timely reach a consensus and thus
we facilitate the decision process by using the significance score. Specifically, a high-scored message
successfully delivered in a group can suppress all the messages with lower scores (e.g., D1’s message in
Figure 6). Hence, the framework strategically favors high-scored messages when scheduling messages
over a set of shared channels.
event occurrence
time constraint
calculate carrierSensing()
k:6/d:0.65 :00 00 00no
0 0 0 0 0 0 0 0 0channels
00000000000000000000000000000000000000000000000000000000
0 0 0 0 0 0 0 0 0 0 0 0 0 0 0 0 0 0 0 0 0 0 0 0 0 0 0 0 0 0 0 0 0 0 0 available
000000000000000000000000000000
00 00 00 00 00 00 00 00 00 00 00 00 00 00 00 00 00 00 00 00 00 00 00 00 00 00 00 00 00 00 00 00 00 00 00 00 00 00 00 00 00 00 00 00 00 00 00 00 00 00 00 00 00 00 00 00 00 00 00 00 00 00 00 00 00 00 00 00
8 > (k:6)
sleep(0.65s) 00000000000000000000000000000000000000000000000000000000000000000000
: return false
D1
event
message m message m
detection
(k:5) received (k:8) received
calculate carrierSensing(): clist (k:8) > 5
k:8/d:0.6 random.choice(clist): c=1
: return true
sleep(0.6s) transmitMsg(k:8)
D2
event
detection message m
(k:5) received
calculate carrierSensing(): clist
k:5/d:0.4 random.choice(clist): c=2 8 > (k:5)
sleep(0.4s) transmitMsg(k:5) : return false
D3
event
detection message m
(k:8) received
channel:1 (D2) transmitMsg(8)
channel:2 (D3) transmitMsg(5)
Figure 6. System flow example: As shown in the left figure of Figure 4b, upon an external event
occurrence in a room, devices D1, D2 and D3 all detect it simultaneously and independently, and thus
the dotted circle denotes the area in which the event can be reached and confines the ephemeral group
members. This example assumes two channels. Then, each member device individually follows the
steps of the supported framework, as explained in Section 3.1.
Algorithm 1 implements the system flow of each device. When detecting an event, each device
first initiates the round of the event by activating the timer of TC, the time constraint associated with
the round. The device obtains the message data, its score k with respect to the event e, and the wait
delay d from the framework functions f s (e) and f d (k ), respectively. After waiting for d time, the device
checks by the carrier sensing routine to retrieve the available channels clist . The device then transmits
the message on the channel c, which is randomly selected among the available ones. Note that e.ts and
curtime() denote the event detection time and the current system time, respectively, and they are used
to see if the device can send a message successfully within the time constraint.
In parallel, the device receives messages m from others and keeps the maximum of m’s data (m.k)
to get the highest score in the group. If any message higher than its own message is received during
the round, the device immediately cancels the timer and terminates the round. Otherwise, upon the
expiration of the timer, the device compares the messages received including its own message to
determine whether it should become a responder. Note that for the responder decision, the channel
on which the message is received is used when having tie scores, and the candidate(k) function is
used when neither receiving any message nor transmitting. The default value of candidate(k) is based
on the k-weighted random, and the statistical evaluation is explained in Section 3.3. In this system
flow, we assume the non-overlapping event occurrences within the time duration of each round.
The assumption might be a restriction to the framework generality, yet it is consistent with the behavior
of the ephemeral group of voice-enabled devices in that, e.g., a set of multiple, simultaneous hotwordSensors 2019, 19, 1883 9 of 19
utterances to a device do not generate the same set of corresponding responses, but normally one
or none.
Algorithm 1 handleEvent.
OUTPUT: whether or not respond
On event e:
1: setupTimer ( TC ), k max ← 0, cmax ← 0, f lagsend ← False
2: k ← f s (e), d ← f d (k) // calculate score and delay time
3: sleep(d)
4: while do
5: if (clist ← carrierSensing()) > 0 then
6: c ← random.choice(clist )
7: transmitMsg(k) on channel c
8: f lagsend ← True
9: break
10: end if
11: end while
On message m from channel cm :
1: if isTimerAlive( TC ) then
2: if m.k > k then
3: cancelTimer ( TC ) // early termination
4: return False // do not respond
5: else if m.k > k max then
6: k max ← m.k // update the highest score
7: cmax ← cm
8: else if m.k = k max ∧ cm > cmax then
9: cmax ← cm // keep the channel for the same highest scores
10: end if
11: end if
On timer expiration TC:
1: if f lagsend = True ∧ k = k max ∧ c ≥ cmax then
2: return True // respond
3: else if f lagsend = True ∧ k > k max then
4: return True // respond
5: else if f lagsend = False ∧ k max = 0 then
6: return candidate(k )
7: else
8: return False // do not respond
9: end if
In the following, we describe the functions of the algorithm. Table 1 illustrates the framework
parameters used in our explanation. The score captures the relevance of a device about dealing with
the given event. Having the cases of hotword events, we implement a score function with respect to
the event distance approximation based on RSS (Received Signal Strength) as
$ R RSS(e) %
xR=0 CDF ( x )
f s (e) = ∞ ·S (1)
x =0 CDF (x)
where RSS(e) is 20log10 ( amplitude o f e) and CDF () is the distribution estimated by our experiments
on RSS measurements of hotword utterances. Figure 7 shows the the average RSS of normal hotword
utterances measured by a smartphone having the same specification for the experiment in Figure 2,
with respect to various distances between the user and the smartphone in a room area. Note that
the accurate distance measurement using sound signals is beyond the scope of this paper, and the
score function above is an example implementation. We rather consider the extensibility of the score
function depending application requirements. For instance, the priority setting can be an additionalSensors 2019, 19, 1883 10 of 19
input to the function such that the home speaker might have a bias on the f s value, if it has a higher
priority than mobiles when reacting to a user request.
Table 1. Framework parameters.
Symbol Definitions (Default Values) Decided by
Fall Number of available frequencies Framework design
for the entire bandwidth (100)
Fg Number of available frequencies Framework design
for a guard interval (12)
Dp Transmission time for a block (0.1 s) Framework design
TC Time constraint (1.1 s) App
S Score size (10) App
De Event detection delay (0.1 s) App
dt Transmission time for a message (0.3 s) Derivation
dw Maximum wait delay (0.7 s) Derivation
csize Channel size (4) Derivation
80 1
0.8
Strength(dB)
70
0.6
CDF
0.4
60
0.2
50
0.5 1 1.5 2 2.5 3 3.5 4 4.5 5 0
50 55 60 65 70 75 80 85 90
Distance(m) Strength(dB)
(a) RSS by distance (b) CDF by RSS
Figure 7. Voice Event Strength: (a) the average RSS of smartphones detecting user hotwords with
respect to the distance from the user, 0.5 to 5 m; and (b) its cumulative distribution. Each measurement
was performed 100 times for 10 different distances and two testers.
When broadcasting its message, each device waits for d time to reduce the collision possibility on
the shared channels. By default, the delay time is chosen uniformly at random as
f d (·) = U [0, dw ] (2)
where dw is the maximum wait delay and U [·] denotes uniform distribution. We show how to
determine adaptively f d values according to the given score k in Section 3.3.
3.2. Framework Parameter Derivation
Here, we derive two framework parameter values, the channel size csize and the maximum wait
delay dw . In doing so, we first, given the time constraint TC associated with the round, derive the
feasible (csize , dw ) pairs. Notice that TC is the time constraint from the event detection to the end of the
event processing, and thus TC can be the value obtained by subtracting the event detection delay (De )
value from the total time latency requirement (1.2 s) which is specified by the application; each device
determines whether to respond within TC = 1.1 s upon the hotword event detection. For broadcastingSensors 2019, 19, 1883 11 of 19
a message successfully within TC, it should hold that TC ≈ D p + dw + dt where D p is the time to
perform carrierSensing() once. dw is stipulated by the message transmission time dt . The number of
Fall − Fg (csize −1)
usable frequencies per channel can be calculated as csize .
#blocks = 1 + blog Fall − Fg (csize −1) Sc (3)
b csize −1c
dt = D p × (#blocks + 1) (4)
!
dw ≈ TC − D p 3 + blog Fall − Fg (csize −1) Sc (5)
b csize −1c
Equation (3) computes the number of blocks for a message, and derives Equation (4) for dt where
the transmission time for a block D p is 0.1 s, as explained in Section 2.2. The number of different scores
S is specified by the application requirements, e.g., 10 in our example. Subsequently, Equation (5) is
derived by the time constraint TC above, and then dw can be represented as a function of csize since the
other variables in the equation are all constant.
Table 2 lists the feasible (csize , dw ) pairs derived by Equation (5) with the constraint such that
the number of usable frequencies per channel should be no fewer than three; FSK needs at least two
frequencies and the tailtag message format requires an additional frequency for the 1-bit start tag.
Now, to establish the optimal setting, we find the configuration that minimizes the chance of message
collisions and thus enables improving the success rate of timely reaching the consensus about the
responder. We name the success rate simply accuracy. More than a single message being simultaneously
sent on the same channel might incur a collision, and thus large csize and dw values can reduce the
collision possibility and improve the accuracy. However, the constraint of Equation (5) restricts their
valid range. Figure 8 shows the accuracy yielded by simulation experiment with various csize values
listed in Table 2 (and the derived valid dw values accordingly) with respect to the size of a device
group 2 ≤ N ≤ 20. We then establish the channel size csize = 4 and accordingly dw = 0.7 s as in Table 2,
which together yield consistently the better accuracy regardless of the group size. The simulation
experiment was performed using the Java-based simulator that we implemented for analyzing the
multiple device communication over sound with the tailtag framework.
Table 2. Feasible configurations.
csize #blocks dt dw
1–4 2 0.3 s 0.7 s
5–6 3 0.4 s 0.6 s
7 4 0.5 s 0.5 s
Channel size: 1 2 3 4
1
5 6 7
0.9
0.8
Accuracy
0.7
0.6
0.5
0.4
0.3
0.2
0.1
2 5 10 15 20
Number of devices
Figure 8. Accuracy by channel size: the graph shows the accuracy (on y-axis) that is the rate of
successfully resolving a single responder in a group within the time constraint, with respect to the
number of devices in a group (on x-axis). The simulation experiment was performed 100 times for each
pair of channel size and group size.Sensors 2019, 19, 1883 12 of 19
3.3. Adaptive Parameters
For improving the framework quality, we propose the adaptive messaging schemes by which the
wait delay d for broadcasting a message is adaptively determined according to the importance degree
of the message specified by the score.
We first consider the score-based delay function of k ∈ {1, 2, . . . , S} in Equation (6), which yields
relatively longer delays for low-scored messages. Intuitively, this intends for sending high-score
messages first as well as reducing their collisions, hence being likely to suppress the transmission of
unnecessary low-scored messages.
f d,score (k) = min( D p · (S − k), dw ) (6)
Given an event, its event detection time might be sightly different among the group devices as the
devices individually process the event. Here, we extend the score-based delay function to reflect such
asynchronous event detection. Specifically, we employ the adaptive delay by exploiting the received
messages of which the transmission time can be presumed according to the score, and the temporal
difference estimate δ between the event detection delay of a device and the framework parameter De
value, which the average event detection delay of a group normally follows:
f d,adapt (k ) = min(max( f d,score (k) + δ, 0), dw ) (7)
For each device, the δ estimate is continuously updated along with event occurrences and
messages as
δ = δ + α · (m.ts − e.ts + δ + D p + f d,score (m.k) + dt ) (8)
where α is the update rate. Figure 9a illustrates an example of adaptive delay updates. Upon an
event occurrence, each device individually initiates processing of the event. When a message with the
score k is received, the device adapts its δ and accordingly its delay function by using the temporal
difference between the expected time and the actual time of the message received (denoted by exp(m.k )
and m.ts in the figure). This adaptation is effective since we observe through the experiments that
the propagation delay of short-range sound-based data communication in the room area context is
normally more stable than the event detection delay. Having the simulation results in Figure 9b that
shows the derivations of δ values of the group members over the stream of event occurrences, we set
the update rate α = 0.2 by default for the stable convergence.
event occurrence 0.1 0.2 0.3 0.4 0.5
rate(Į):
event 180
detection transmitMsg 150
D1
Deviation
120
time
event message m
90
detection 60
D2
m.ts 30
e.ts į+Dp+fd,score(m.k)+dt
exp(m.k)
0
1 5 10 15 20 25 30 35 40 45 50 55 60
Update į = į + Į(m.ts – exp(m.k)) = +10ms
Number of events
(a) Adaptive detection delay estimate (b) Update rate for delay estimate
Figure 9. Adaptive mechanism of event detection delay: (a) an example of how to update the
temporal difference δ between the event detection delay of a device and the framework parameter De ,
the expected detection delay, using the message m and its score k received; and (b) the impact of α
values, different update rates, along with the event occurrences over time. The simulation experiment
was performed over 60 subsequent event occurrences for each update rate.
Recall that the framework parameter TC is derived as part of the application requirements.
Having high variances on event detection delays among individual devices, however, it is beneficial forSensors 2019, 19, 1883 13 of 19
each device to continuously calculate the delay-aware time constraint TCδ = min(max( TCδ + δ, TC −
dw ), TC + De ) and use TCδ in Algorithm 1 instead of TC.
As explained, a higher-scored message can suppress the transmission of any lower-scored
messages and thus it is important that high-scored messages are quickly scheduled. Moreover,
it is also beneficial to incorporate the possible ranking of scored messages into the scheduling policy.
In the following, we discuss the prediction model in which the wait delay of a k-scored message
is determined based on the expectation such that k is the highest in a group. This intends for not
only increasing the chance that the presumably top-ranking message is sent first with a shorter delay
even when its score is not in the high range but also mitigating possible collisions even when several
high-scored messages exist. Having the score k = f s (e) for event e in Equation (1), we calculate the
predictive ranking-based score by
t ( k )− P ( k )
Ppo pr t (k) ≥ P (k)
k + (S − k) · 1− Ppr (k) , if Ppo
pr
t
f s,rank (k ) = (9)
Pt (k )
k · Ppo (k) , 1 , otherwise
max
pr
where Ppot ( k ) is the posterior that the score k is the highest at the time duration t and P ( k ) is its
pr
prior distribution. The posterior distribution can be used for implementing the candidate() function in
k N −(k −1) N
Algorithm 1. Note we have the score size S as a known parameter and set Ppr (k) = SN
for the
t
group size N. Each device continuously updates Ppo (k) exploiting its observations about its scores and
the highest scores in its groups at the time duration t as:
(1 − β) Pt−1 (k ) + β · #ot (t h,k) , if #o t (k ) > 0
t po #o (k )
Ppo (k) = (10)
t−1 ( k ), otherwise
Ppo
where #o t (h, k ) and #o t (k) denote the number of observations that the score k is given and is the highest,
and the number of observations that the score k is given, respectively, at the time duration t, and β
is the update rate. We set the update rate according to the number of observations during the time
∑iS=1 #o t (i )· TC
duration (600 s), i.e., β = min(max( duration(t)
, 0.1), 1.0).
4. Evaluations
Unless stated otherwise, the configurations of simulation experiments in this section set the
default values in Table 1 including the time constraint TC = 1.1 s, the max wait delay dw = 0.7 s, and the
channel size csize = 4.
4.1. Algorithm Comparison
We discuss the performance of our framework with the different algorithmic strategies introduced
in Section 3.3 against various conditions in terms of the event dynamics, the number of devices,
and the density in a group. Table 3 lists the conditions. The performance is represented by the
accuracy about a single responder with the highest score being resolved successfully within the time
constraint for an event. In the experiments, we denote the baseline algorithms with the random delay,
base_R (Equation (2)) and with the score-based delay, base_S (Equation (6)). Furthermore, we denote
the adaptive algorithms with the adaptive delay, ad_D (Equation (7)) and with the predictive ranking
in addition to the adaptive delay, ad_RD (Equation (9)).Sensors 2019, 19, 1883 14 of 19
Table 3. Experiment configuration.
Condition Definition Settings
slow = 10,
The average number of successive event
Event dynamics medium = 5,
occurrences in the same location
fast = 1
Group size The number of member devices in a group N = 5, 10, 20
sparse = 2,
Group spatial
Average distance between devices (m) medium = 1,
density
dense = 0.5
Figure 10a shows the simulation result when the various dynamics regarding the event locations
were considered, given that the number of devices in a group was set to 5, and Figure 10b shows the
simulation result when various group sizes (the number of devices) were considered, given that the
event dynamics was set to slow. The adaptive algorithms ad_D, ad_RD both outperformed the other
algorithms and specifically showed about 98% accuracy with five devices and slow dynamics case,
which we considered one of the commonly recognized multiple user, multiple device environment
settings for the uncoordinated react by hotword scenarios. Figure 10c shows the simulation result
when different density settings of a device group were considered, depicting the possible advantage of
using the predictive ranking in ad_RD particularly for the cases of having many nearby devices in a
dense area. Because ad_RD intends to differentiate the similarly scored devices by using the prediction
model, its yielded relatively high distribution on wait delays for the dense case.
base_R base_S ad_D ad_RD base_R base_S ad_D ad_RD base_R base_S ad_D ad_RD
1 1 1
0.8 0.8 0.8
Accuracy
Accuracy
Accuracy
0.6 0.6 0.6
0.4 0.4 0.4
0.2 0.2 0.2
Slow Medium Fast 5 10 20 Sparse Medium Dense
Variation of event location Number of devices Density of devices
Figure 10. Accuracy by algorithms: having the test conditions in Table 3, the graphs show the accuracy
by the algorithms implemented differently using Equations (2) and (6)–(10). The simulation was
performed 1000 times for each pair of configuration and algorithm.
4.2. Tailtag Adoption
In most voice assistants, voice commands subsequently issued after a hotword are processed through
several tasks including ASR (Automatic Speech Recognition) and NLU (Natural Language Understanding)
running on servers, and thus a device needs to keep the dedicated session to the servers for dealing with
streams of voice commands. Here, we discuss the prototype implementation of the tailtag framework
interfacing with Bixby at the device side. As abstracted in Figure 11, the implementation included the two
interfaces for processing a hotword signal as an input event to the tailtag framework as well as returning
the corresponding output.Sensors 2019, 19, 1883 15 of 19
Speech Hotword Voice App Response
Voice App F/W
Signal Detector Controller or not
RSS(e) true/false
Tailtag F/W
Score/Delay/Channel Broadcast
Consensus
Decision message
Receive
message
Figure 11. The tailtag integration with existing voice app framework.
Figure 12 shows the benefit of the coordination by tailtag in a multiple device, multiple user
environment. We compared Google Assistant (denoted by G) and existing Bixby of different sensitivity
settings (denoted by B_High and B_Low) with our tailtag-based prototype (denoted by tailtag) in terms
of accuracy. The experiment conditions were set as those of Bixby sensitivity tradeoff tests in Figure 2,
having Samsung Galaxy S8 devices, five adult testers, and 1 m distance between a tester and devices
in the same room setting with insignificant ambient noise. Figure 12a,b depicts the cases of multiple
devices of a single user and multiple devices of multiple users, respectively, clearly demonstrating
the high accuracy of our approach, no less than 98% when the group size was up to five. Notice
that the low accuracy by the existing voice-based services was mostly because they do not normally
deliberate much on the implication of multiple devices and multiple users yet, and rarely include the
coordination process of devices when processing user requests. Accordingly, we frequently observed
redundant responses in the tests. It should be also noted that the tests focused only on the coordinated
response to hotwords, and thus the result should be separated from all the other performance factors
of voice-based services.
G B_High B_Low tailtag G B_High B_Low tailtag
1 1
0.8 0.8
Accuracy
Accuracy
0.6 0.6
0.4 0.4
0.2 0.2
0 0
2 3 5 2 3 5
Number of Devices Number of Devices
(a) Single user case (b) Multiple user case
Figure 12. Accuracy by Framework: (a) the test result of multiple devices of a single user; and (b) the
test result of multiple devices of multiple users (where only one device is registered for the user saying
the hotword). The x-axis denotes the number of devices and the y-axis denotes the accuracy. The test
was performed 100 times for each combination of five testers, four compared solutions, and the number
of devices.
Our prototype managed to meet the feasibility requirements of our target scenario in terms of
accuracy and latency, which were initially discussed with the user experience team. In the case of
using the existing voice app framework of Bixby, we know empirically that it takes 0.8 s on average to
react to hotwords (with no coordination), and, as demonstrated through the experiment with devices,Sensors 2019, 19, 1883 16 of 19
the tailtag framework was successfully configured to satisfy the time constraint of 1.1 s (TC) with
high accuracy.
5. Related Work
Several works exploit sound wave to transmit data among consumer devices. Google Tone [27]
allows computer users to broadcast URL data to nearby devices through sound wave. Signal360 [28]
enables performing customized services in indoor stores, exploiting beacon signals that are emitted
via BLE or inaudible sound wave. Starbucks offers a remote ordering service (namely, siren order)
that provides the online ordering and payment method [29]. Inaudible sound was tested for siren
order. As explained, it is hard to pinpoint the user location (e.g., whether a user is in the store or
not) using BLE, WiFi, or GPS, and thus sound-based data communication becomes a solution for
the room area context. While the user scenarios using sound-based data communication above are
commonly relevant to one-to-many device communication (e.g., a store server to several consumer
devices), our interest is rather on many-to-many (e.g., consumer devices to consumer devices) for
enabling the ephemeral group communication.
Chirp SDK [30] is a commercially packaged solution that aims to efficiently handle multi-bytes
data payloads and reliably support one-to-one and one-to-many device communication over sound in
the domain of consumer device apps, and accordingly its message format contains a relatively large
header with error correction symbols. Our internal tests observed that such multi-byte messaging
degrades the performance for the ephemeral group scenario that requires small data transmission in
many-to-many device communication with the time constraint.
A novel form of real-time sound communication method called Dolphin is proposed in [31].
Experiments on ambient noise measurement show that noise can be ignored at frequencies higher than
8 kHz. Thus, both audible and inaudible bands in 8–20 kHz are used. Dolphin achieves 500 bps at a
decoding rate within 1 m distance, but does not consider multiple device environments.
In mobile communication, CDMA enables multiple devices to communicate simultaneously over
the entire frequency band. Such multiple access technologies have been seldom researched for sound
wave communication. Most relevant efforts have been made for Underwater Wireless Sensor Networks
(UWSNs) [32,33], concentrating on the design of contention-based MAC protocols. It is rarely feasible
to incorporate the existing contention-based protocols into our framework due to the ephemeral
group structure with no controller. Using network coordinators [34], channel reservation [35],
or handshaking [36–38] over sound wave is less desirable for low latency communication in an
ephemeral group.
In a voice-assisted app, keyword spotting system (KWS) runs to quickly detect a trigger
phrase (hotword) activating the app. As demonstrated by the experiments previously, this often
creates redundant or seemingly arbitrary responses when multiple devices are involved. In [39],
the authors proposed a novel KWS that explores the contextual automatic speech recognition, showing
improvement such that the false alarm is reduced by 89%. However, they focused on single device
cases and rarely considered the environment conditions where several devices are closely located.
When CSMA/CA is applied as a multiple access scheme in inter-vehicular wireless communication,
the probability of message collision increases as the vehicle density becomes larger. The work in [40]
proposes the adaptive scheme, Distance-Dependent Adaptive Backoff (DDAB), that utilizes the different
ranges of random backoff depending on the location of vehicles especially for facilitating the distribution
of emergency warning messages efficiently. This work is relevant to the score-based delay of tailtag in that
both explore the similar concept of priority-based messaging. However, the tailtag framework uses the
sound-based data communication for consumer devices and explores not only message scheduling but
also message suppression based on scores.
Leader election has been studied in the domain of distributed systems [11,12,14,15]. Our approach
using broadcast messages to make a brief consensus on the group responder upon an external event can be
seen as relevant to bully algorithms [13,16]. Several research works about cluster head selection [41–43] inSensors 2019, 19, 1883 17 of 19
sensor networks also have similar relevance. While sharing the common structure of leader election with
those previous works, however, the framework in this paper differently concentrates on two challenging
conditions, namely the unstructured group communication over sound and the time constraint on the
election process, which render the work here unique as well as applicable to the real world scenarios of
voiced-enabled devices.
6. Conclusions
The presented framework tailtag addresses the issue of possible uncoordinated, redundant
responses of smart consumer devices that interact with a user. To do so, we introduce the notion
of an ephemeral group, in which a set of devices individually detecting an external event make a
group implicitly and communicate shortly for deciding the event responder, and utilize inaudible
sound for unstructured group communication with room area context. We view such ephemeral
group coordination as the time-constrained leader election process over sound, and employ the
importance-aware adaptive messaging in the group to satisfy the given time bound requirement.
For dealing with hotwords in voice assistants of consumer devices, we exploit the isomorphic room
area capability of detecting hotword events and communicating over sound in a group.
The simulations and the prototype tests of real-world consumer device scenarios demonstrate
that, without any prebuilt controller or backend infrastructure for coordination, a set of devices in
a close range can communicate short messages and reach a certain consensus efficiently in a timely
manner. Thus far, we have shown the feasibility of the framework, focusing on the specific target
scenarios of handling a hotword event among multiple devices. Our future work includes adopting
the framework more than dealing with a single event and group type, and thus generalizing the
framework structure to support variable time constraints and different external event types.
Author Contributions: Conceptualization, D.S. and H.W.; Methodology, H.W. and I.Y.; software, D.S. and H.W.;
validation, I.Y.; formal analysis, D.S.; investigation, D.S. and H.W.; writing—original draft preparation, D.S. and
H.W.; and writing—review and editing, H.W. and I.Y.
Funding: This research was supported by Basic Science Research Program through the National Research Foundation
of Korea (NRF) funded by the Ministry of Science, ICT and Future Planning (NRF-2016R1E1A1A01943474 and
NRF-2018R1D1A1A02086102).
Conflicts of Interest: The authors declare no conflict of interest.
References
1. Google Assistant. Available online: https://assistant.google.com/platforms/speakers/ (accessed on
25 February 2019).
2. Samsung Family Hub. Available online: https://www.samsung.com/us/explore/family-hub-refrigerator/
overview/ (accessed on 25 February 2019).
3. Voice Assistant Market Research Report. Available online: https://www.marketresearchfuture.com/
reports/voice-assistant-market-4003 (accessed on 25 February 2019).
4. Bixby Developer Day. Available online: http://bixbydeveloperday.developer.samsung.com/ (accessed on
25 February 2019).
5. Snowboy Hotword Detection. Available online: https://snowboy.kitt.ai/ (accessed on 25 February 2019).
6. Google Home. Available online: https://support.google.com/googlehome/answer/7257763?hl=en&co=
GENIE.Platform=Android (accessed on 25 February 2019).
7. Medeiros, H.; Park, J.; Kak, A. A Light-weight event-driven protocol for sensor clustering in wireless camera
networks. In Proceedings of the 2007 First ACM/IEEE International Conference on Distributed Smart
Cameras, Vienna, Austria, 25–28 September 2007; pp. 203–210.
8. Medeiros, H.; Park, J.; Kak, A. Distributed object tracking using a cluster-based kalman filter in wireless
camera networks. IEEE J. Sel. Top. Signal Process. 2008, 2, 448–463. [CrossRef]You can also read