Copernicus Emergency Management Service The European Flood Awareness System - European ...
←
→
Page content transcription
If your browser does not render page correctly, please read the page content below
Copernicus
Emergency Management Service

The European Flood
Awareness System
Detailed Assessment report: “The 2020
spring floods in the Scandinavian countries”
Prepared by the EFAS DISSEMINATION CENTRE, the CEMS HYDROLOGICAL and
METEOROLOGICAL DATA COLLECTION CENTRE, the CEMS COMPUTATIONAL CENTRE, and
the JOINT RESEARCH CENTRE.

 1
This publication is a Technical report by the flood forecast and monitoring component of the Copernicus Emergency Management Service.
In specific the “CEMS Hydrological Forecast Centre – Analytics and Dissemination” (operated by the Swedish Meteorological and
Hydrological Institute, Rijkswaterstaat and Slovak Hydro-Meteorological Institute), the “CEMS Hydrological Forecast Centre –
Computation” (operated by ECMWF), the “CEMS Hydrological Data Collection Centre” (operated by the Agencia de Medio Ambiente y Agua
de Andalucía and Soologic Technological Solutions S.L), the “CEMS Meteorological Data Collection Centre” (operated by KISTERS AG and
the Deutscher Wetterdienst) and the Joint Research Centre (JRC), the European Commission’s science and knowledge service. It aims to
provide evidence-based scientific support to the European policymaking process. The scientific output expressed does not imply a policy
position of the European Commission. Neither the European Commission nor any person acting on behalf of the Commission is
responsible for the use that might be made of this publication. For information on the methodology and quality underlying the data used
in this publication for which the source is neither Eurostat nor other Commission services, users should contact the referenced source. The
designations employed and the presentation of material on the maps do not imply the expression of any opinion whatsoever on the part
of the European Union concerning the legal status of any country, territory, city or area or of its authorities, or concerning the delimitation
of its frontiers or boundaries.

EU Science Hub
https://ec.europa.eu/jrc

JRC 126336

Ispra: European Commission, 2021

© European Union, 2021

The reuse policy of the European Commission is implemented by the Commission Decision 2011/833/EU of 12 December 2011 on the
reuse of Commission documents (OJ L 330, 14.12.2011, p. 39). Except otherwise noted, the reuse of this document is authorised under
the Creative Commons Attribution 4.0 International (CC BY 4.0) licence (https://creativecommons.org/licenses/by/4.0/). This means that
reuse is allowed provided appropriate credit is given and any changes are indicated. For any use or reproduction of photos or other
material that is not owned by the EU, permission must be sought directly from the copyright holders.

All content © European Union, 2021

How to cite this report: Blanco De Córdova, D., Carpintero-Salvo, I., Fuentes-Andino, D., Hansford, E., García Sánchez, R., Márquez Arroyo,
M., Mazzetti, C., Moschini, F., O`regan, K., Pechlivanidis, I., Prudhomme, C., Rauthe-Schöch, A., Rehfeldt, K., Salamon, P., Schweim, C.,
Thiemig, V. and Walawender, J., Detailed Assessment report: “The 2020 spring floods in the Scandinavian countries”, European
Commission, 2021, JRC126336.
Contents
 1 Introduction ................................................................................................................................. 2
 2 Description of the flood event .................................................................................................... 3
 2.1 The study area..................................................................................................................... 3
 2.2 The meteorological situation leading to the event............................................................. 3
 2.3 Description of reported flood and their impact .................................................................. 6
 3 Hydrological analysis on the in-situ observations.................................................................... 12
 3.1 Introduction ....................................................................................................................... 12
 3.2 Methodology ...................................................................................................................... 12
 3.3 Results ............................................................................................................................... 14
 3.4 Comparison with previous events ..................................................................................... 23
 4 Public information about the flood event................................................................................. 25
 4.1 Finland ............................................................................................................................... 25
 4.2 Norway .............................................................................................................................. 25
 4.3 Sweden .............................................................................................................................. 26
 5 EFAS forecast and information ................................................................................................. 29
 5.1 Background information about EFAS ................................................................................ 29
 5.2 EFAS forecast during the event ........................................................................................ 30
 6 Verification ................................................................................................................................ 33
 6.1 Verification of EFAS forecasts .......................................................................................... 33
 6.2 Verification of the EFAS service ........................................................................................ 37
 6.3 Performance of EFAS 3.6 versus 4.0 ................................................................................ 38
 7 Conclusions ................................................................................................................................ 51
 7.1 Summary of the flood event............................................................................................. 51
 7.2 Lessons learnt from the detailed assessment ................................................................. 51
 7.3 Moving forward ................................................................................................................. 52
 Table of Figures ................................................................................................................................ 53
 Annexes ............................................................................................................................................. 56
 1 Media reports ............................................................................................................................. 56
 2 Analysis of the effect of forecasted precipitation and temperature errors on forecasted
 discharge ....................................................................................................................................... 56
 3 Feedback from partners (reported points) ................................................................................ 58
 4 Feedback from partners (survey) .............................................................................................. 58

 i
The 2020 spring floods in the Scandinavian countries - EFAS detailed assessment report

Acronyms

 CoA Condition of Access
 DHMZ Croatian Meteorological and Hydrological Service
 DWD Germany's National Meteorological Service
 ECMWF European Centre for Medium-Range Weather Forecasts
 EFAS European Flood Awareness System
 NRT Near Real-Time
 NVE Norwegian Water Resources and Energy Directorate
 NWP Numerical Weather Predictions
 RP Return period
 SWE Snow Water Equivalent
 SMHI Swedish Meteorological and Hydrological Institute
 SYKE Finnish Environment Institute

 1
Copernicus Emergency Management Service

1 Introduction
Flooding is one of the most destructive hazards and accounts for large economic damages and
human losses worldwide. The European Flood Awareness System (EFAS, https://www.efas.eu/)
operated by the Copernicus Emergency Management Service (CEMS) operationally monitors and
forecasts floods across Europe since 2012. EFAS forecast supports preparatory measures before
major flood events, particularly in the large trans-national river basins and throughout Europe.
EFAS provides early warning information up to 10 days in advance, while the EFAS Information
System (EFAS-IS) is the interface used to access the forecast information including a variety of
products. EFAS provides complementary, added-value information (e.g. probabilistic, medium-range
flood forecasts, flash flood indicators, and impact forecasts) to the relevant national and regional
authorities. The EFAS forecasters access the hydro-meteorological information, discuss the
situation, summarize it and finally disseminate it by email to National authorities, regional
hydrological services and the European Response and Coordination Centre (ERCC).

The present document is a detailed assessment report which aims to evaluate the performance of
EFAS for the flood events during the spring season of the year 2020 (end May to end July) for the
Scandinavian countries of Finland, Norway and Sweden. In Scandinavia high flows occur in the
months of May to July, with the snow melting being the main hydrological driver. In addition, strong
precipitation events can significantly increase the flow response leading to potential floods. The
performance will be evaluated in terms of timing, magnitude, lead time and missed events. In this
report, the usefulness of the system from the user’s perspective is also analysed. In addition to the
EFAS notifications, this report presents the national flood warnings during the 2020 spring flood
period as disseminated to the public through the national webpages. Overall this assessment allows
to evaluate the accuracy of the EFAS forecasts and disseminated notifications, with the aim of
shaping suggestions for further service evolutions.

The report is organized as follows: section 2 includes a general description of the events. Section 3
analyzes data from available stations. Section 4 presents the public information about the flood
events, while section 5 describes and 6 evaluates the EFAS forecast and information from the
EFAS-IS. Finally, section 7 presents conclusions and recommendations.

 2
The 2020 spring floods in the Scandinavian countries - EFAS detailed assessment report

2 Description of the flood event
2.1 The study area
Scandinavia is a subregion in Northern Europe. Here, the study area is the Scandinavian countries
within the EFAS system, which refer to Finland, Norway, and Sweden. The geography of Scandinavia
is extremely varied, consisting of the Scandinavian mountains, the low areas in the archipelagos of
Sweden, Finland and Norway. These countries also have many lakes and reservoirs for the
hydropower production. The climate varies from north to south and from west to east, including
humid continental climate, subarctic climate, and alpine climate in the mountains. The climate in
these country makes it possible for snow to be accumulated mainly in the winter months
(December till February), however especially in the northern part of the countries snow can be
accumulated earlier than December and later than March. The temperature increase above zero
degrees starting during the spring season can lead to floods, which are called spring floods. The
magnitude of the spring floods is largely depending on the quantity of accumulated snow, the
pattern in which the temperature increase, and the amount of runoff coming from rainfall in
addition to the snow melting process.

2.2 The meteorological situation leading to the event
This section describes the overall meteorological situation prior and at the beginning of this event.
The data were taken from the EFAS Meteorological Data Collection Centre (MDCC) data base, if no
other source is given.
Starting position
Since the beginning of the hydrological year 2020, which started in October 2019, a precipitation
excess accumulated till May 2020 in large parts of northern Scandinavia (Figure 2.1). Some regions
in Norway and Finland received over 100 mm more precipitation from October 2019 till May 2020
than the long-term average (based on data from 1990-2013). On the other hand, precipitation
totals in northern Sweden mountains were below the long-term means.
As shown by the station “Rovaniemi Airport” within the affected area in Finland, on a monthly basis,
October 2019 and December 2019 till February 2020 were significantly wetter than normal while
March 2020 was around normal and November 2019 and April 2020 were slightly drier than usual
(Figure 2.2)

 3
Copernicus Emergency Management Service

Figure 2.1: Accumulated precipitation anomaly from October 2019 till May 2020 relative to long-term means 1990-2013.

Figure 2.2: Monthly precipitation total and anomaly for station "Rovaniemi Airport" (WMO-Number 02845) in Finland
(source: https://www.cpc.ncep.noaa.gov/products/timeseries/).

Daily mean temperatures were below normal in October 2019 and November 2019, above normal,
but mostly below zero degree Celsius, from December 2019 till March 2020 and again below

 4
The 2020 spring floods in the Scandinavian countries - EFAS detailed assessment report

normal in April 2020 and May 2020 till May, 22nd (Figure 2.3, for a station in Finland). Daily mean
temperatures below zero degree Celsius were reported until end of April 2020 (Figure 2.4).
Therefore, until then the majority of the received precipitation was accumulated as a snowpack.

Figure 2.3: Daily mean and average daily mean temperature for station " Rovaniemi Airport " (WMO-Number 02845) in
Finland (Source: https://www.cpc.ncep.noaa.gov/products/timeseries/).

During the event
The widespread floods were mainly triggered by a steep temperature increase, which caused a rapid
snowmelt. Daily mean temperature timeseries at the station “Rovaniemi Airport” are depicted in
Figure 2.4 for the event. While daily mean temperatures were only slightly above zero degrees
Celsius till May, 21st, they increased in the following six days by eleven degrees Celsius from below
normal to above normal temperatures. This increase was caused by two consecutive low-pressure
systems over the northern Atlantic Ocean which adverted subtropical warm air masses far to the
north.

Monthly precipitation amounts were around normal in May 2020 and in June (see Figure 2.2).
Precipitation totals in July 2020 were above normal in Finland and Northeast Sweden, locally by as
much as twice the precipitation amount as the normal (information found at the bulletin/EFAS-IS,
not shown here).

 5
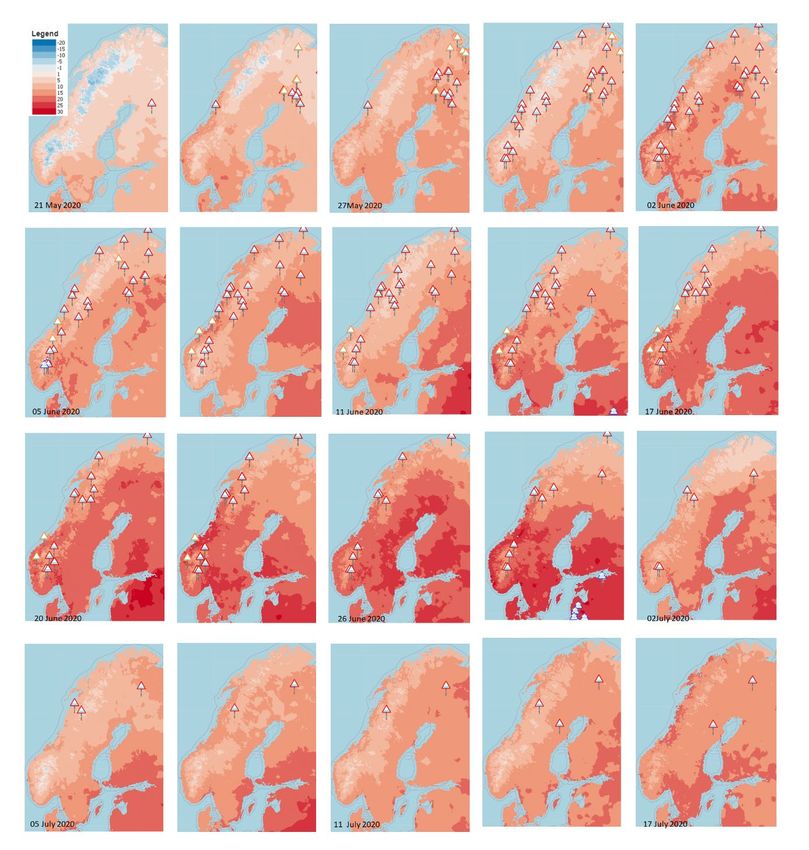
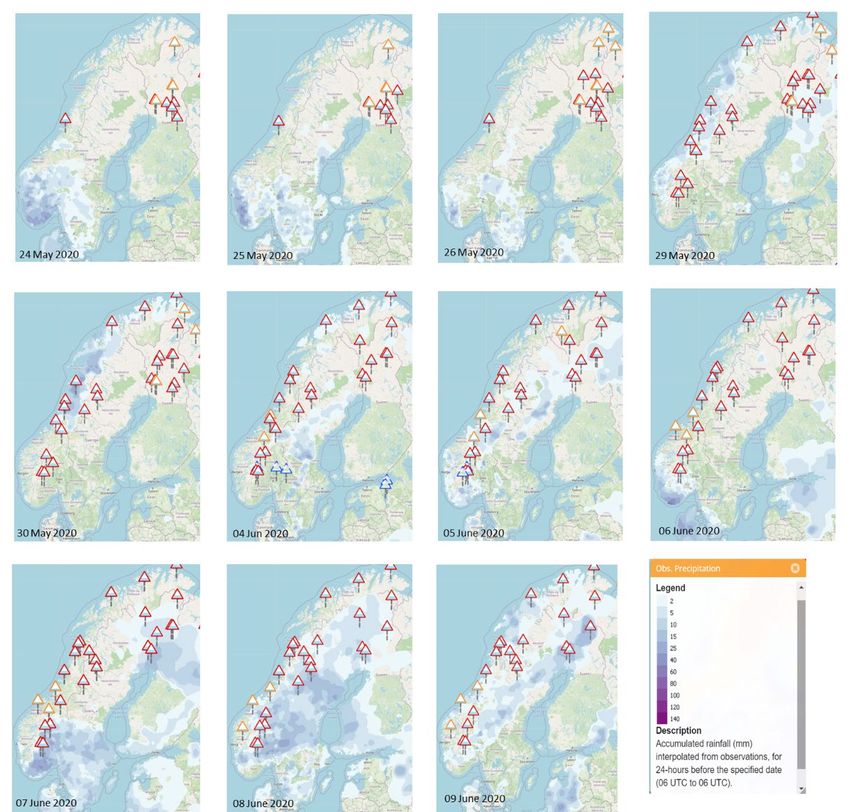
Copernicus Emergency Management Service

Figure 2.4: Mean daily temperature for station " Rovaniemi airport" (WMO-Number 02845) in Finland, during the days the
flood event starts.

2.3 Description of reported flood and their impact
2.3.1 Description of the flood event
Information in the EFAS-IS during the event showed a large amount of water equivalent snow
(larger than 250 mm, Figure 2.5) just before a steep increase in temperature starting at the end of
May (Figure 2.6), while temperature prevailed above zero the rest of the spring. The last
combination resulted in snow melting which in turn lead to a series of EFAS flood warning
notifications for the Scandinavian region starting on the 23rd of May. Precipitation intensified the
magnitude of the flood temporary, see for example precipitation during the 29th and 30th of May,
and the 7th, 8th and 9th of June in Figure 2.7. In general, the observed (spatially interpolated at the
5km grid) precipitation reached a maximum of 25 mm per day with the exception of few small
areas where it reached up to 40 mm.
In general, the first affected area by the 2020 spring flood in Scandinavia was the central and
northern Finland, and successively extended to Norway (spread around the country) and west-
central and northern parts of Sweden. Depending on the location within the Scandinavian region, the
5-year return period (RP) threshold was exceeded anytime between the 25th of May to the end of
June, when almost all the snow had melted for the three countries (Figure 2.5).

EFAS predicted discharge exceeding the 20-year RP for 15 notifications, located all over the
affected area, of which six are presented in Figure 2.8. In the next sections of this report, it is shown
that the 2020 event is one of the largest spring floods in recent years. The snow melting event
exceeded of the highest national threshold for discharge in Finland and Norway.

 6
The 2020 spring floods in the Scandinavian countries - EFAS detailed assessment report

Figure 2.5: Evolution of EFAS issued flood notifications at intervals of 3 days. The background shows the LISFLOOD
simulated amount of snow (mm; snow water equivalent) based on observed meteorological input.

 7
Copernicus Emergency Management Service

Figure 2.6: Evolution of EFAS issued flood notifications at intervals of 3 days. The average observed daily temperature is
shown in the background.

 8
The 2020 spring floods in the Scandinavian countries - EFAS detailed assessment report

Figure 2.7: Distribution of daily accumulated precipitation for selected days when the accumulation was significant. Issued
EFAS notifications are also shown.

 9
Copernicus Emergency Management Service

Figure 2.8: EFAS forecasted hydrographs for some of the most critical 2020 spring floods in Scandinavia; black dots
represent LISFLOOD forced with observations (precipitation, temperature).

2.3.2 Impacts - based on media reports
Finland
Media reports 1 and 2 in Annex 1 show that the snow melting event was forecasted way ahead on
time. This allowed the preparation of mitigation measures so that institutions, municipalities and
those in control of reservoirs cooperated and smoothed down the high flows. As they reported later
“many of the efforts paid off” (see Media report 3 in Annex 1). Nevertheless, the consequences of
the spring flood in Lapland included evacuations, and roads and houses being affected (Media
report 4 in Annex 1), see an example in Figure 2.9.

 10
The 2020 spring floods in the Scandinavian countries - EFAS detailed assessment report

Figure 2.9: Picture taken at Lånestranden in Rovaniemi on the 31st May.

Norway
Media report 5 (Annex 1) mentioned that the likelihood of large spring floods was somewhat
reduced in Norway due to the warm weather at the beginning of May; the actual flood could have
been more severe if part of the snow would not melt earlier. Consequences reported in the media
on the 8th of June includes evacuations of some homes in and around Norway’s northern city of
Alta (Figure 2.10) and the E6 highway being affected (see Media report 6 and 7 in Annex 1).

Figure 2.10: Picture taken at Alta in Finnmark on the 8th of June.

Sweden
On the 3rd of June small local problems were reported in Sweden as consequences of flooding
(report 8 in Annex 1, made by the Swedish Civil Contingencies Agency). On the 10th of June local
problems were specifically described at, among others, the Hemavan Tärnaby airport and at a
bridge along the way 322 which was at risk of falling. In general, the affected area had a low
population density, but have touristic visitors. Measures for the dissemination of information at
different centers were taken. The last report on the spring flood in Sweden occurred on the 8th of
July.

 11
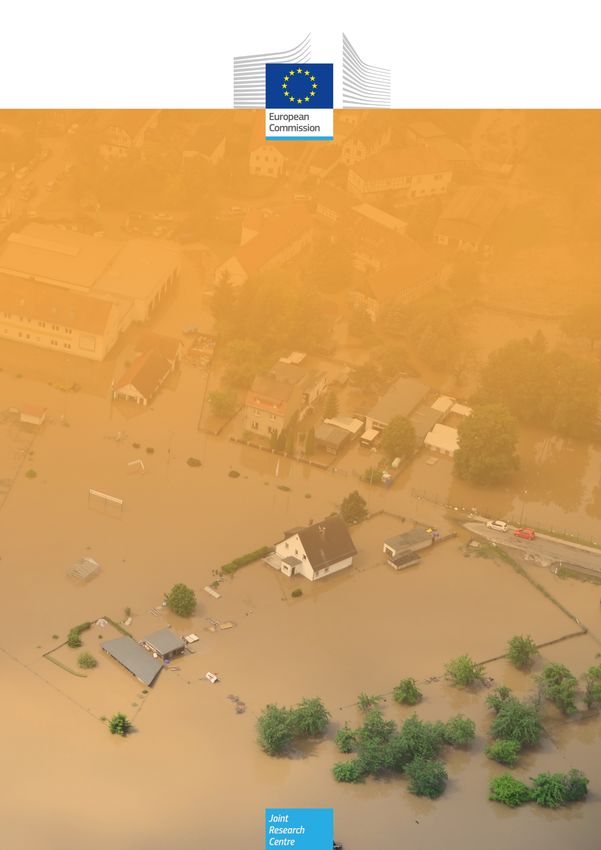
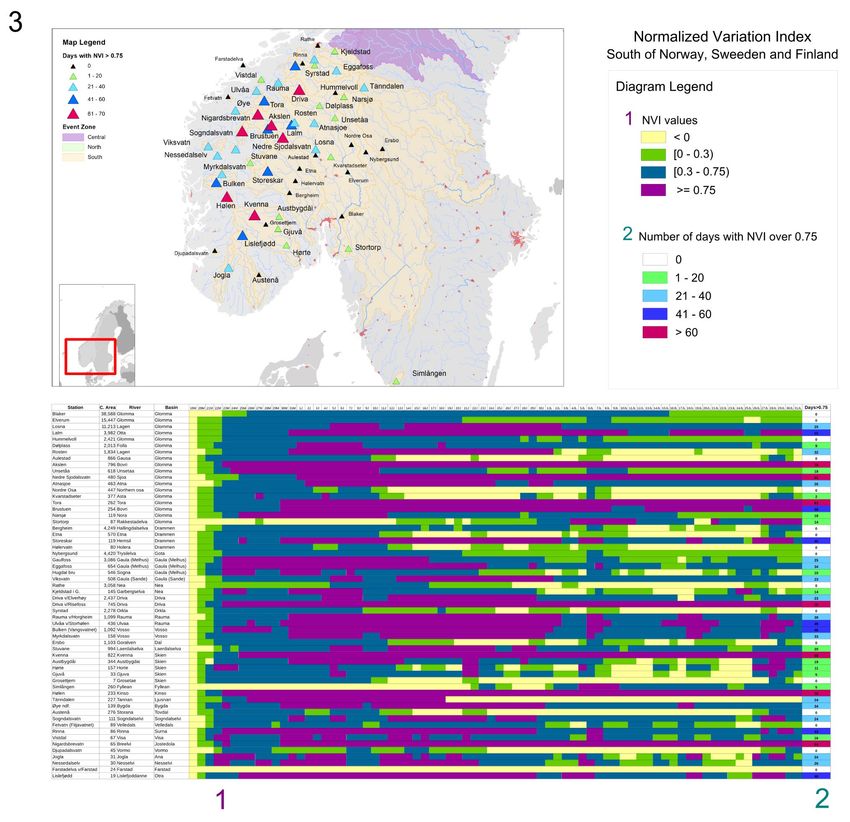
Copernicus Emergency Management Service

3 Hydrological analysis on the in-situ observations
3.1 Introduction
To analyze the hydrological situation in the Scandinavian countries, EFAS provides information at
gauging stations from three different Data Providers: Norway (NO-1002: Norwegian Water
Resources and Energy Directorate), Sweden (SE-1014: Swedish Meteorological and Hydrological
Institute) and Finland (FI-1011: Finnish Environment Institute). There is a total of 230 gauging
stations with discharge values to be analyzed, but after a first preliminary analysis the study
focused on 114 gauge stations that show a notable increase in flow for the period of the event
(May 19th to July 31th). See Figure 3.1.

Figure 3.1: Location map with the EFAS stations selected, including the year of the first Near Real-Time data, and areas with Flood
Maps made by Copernicus.

3.2 Methodology
The hydrological analysis is based on three different indicators. To make it easier to interpret the
results, we present maps and calendar matrices, showing the indicators for each zone (North,
Central and South, see in Figure 3.1) and their progression over time.
3.2.1 Normalized Variation Index (NVI)
The NVI is an indicator for the daily evolution of the event. It is for each day f calculated as a

difference between the maximum observed discharge of day f of the event ( ) and the maximum

discharge on the day before the event starts ( ), divided by their sum:

 −
 =
 +

 12
The 2020 spring floods in the Scandinavian countries - EFAS detailed assessment report

The NVI provides values between -1 and 1, allowing a relative comparison in a simple and objective
way. Zero value represents the non-variation between the initial date and the day being compared
with, while positive and negative values represent increasing and decreasing flows, respectively.
For the present flood analysis, the NVI is grouped into four classes: =0.75.
Negative values were grouped into a single class since this analysis focuses on floods, hence positive
NVI values; see Figure 3.2 (1) for an example of an NVI analysis. In addition, for each station the
number of days per NVI class were computed and for the highest class (NVI >0.75) the following
grouping was done: 0 days, 1-20 days, 21-40 days, 41-60 days and >60 days to show it in a diagram
and in a map (Figures 3.3, 3.6 and 3.9).

Figure 3.2: Vækkava” station: 1) Example of NVI analysis. 2) Example of percentile analysis. 3)
Example of a threshold level exceedance evaluation.

3.2.2 Percentiles
Percentiles are useful to assess the severity of the flood event in a historical perspective. Four
levels were chosen based on the 95th, 99th and Max percentiles: < P95, P95-99, P99-Max, >Max
(Figure 3.2 (2)). The 95th and 99th percentiles represent floods that are exceeded on average 18 and
4 days per year, respectively, and the Max represents the value that has never been exceeded
before. Also, the 99th percentile is not necessarily exceeded every year, although the annual
frequency of exceedances will depend on the catchment size. The percentiles for each station were
obtained from real-time data (daily aggregated maximum), where data is available from (at least)
2014, however many stations have data from 2008 (see in Figure 3.1).

Figure 3.2 (2) shows an example of the percentile evaluation. As for the NVI, also here the number
of days per percentile was computed, and the number of days exceeding the 99th percentile and the
Maximum were plotted on a map per zone (Figure 3.4, 3.7 and 3.10).

 13
Copernicus Emergency Management Service

3.2.3 Exceedance of station-specific thresholds
The threshold exceedance analysis was done only for the stations located in Norway and Sweden,
because in Finland the stations are not provided with threshold levels. There are four threshold
levels defined in the EFAS System, but these Providers only uses three. EFAS then orders them as
Level 1, Level 3 and Level 4 (TL1, TL3 and TL4). The three levels can be referred to as: Activation,
Pre-alert and Alert Threshold, respectively.
Figure 3.2 (3) shows an example of a threshold level exceedance. The number of days above each
threshold is further used as an indicator for the severity of the event and has been plotted in a
calendar matrix and mapped by zones in Figures 3.5, 3.8 and 3.11.

3.3 Results
3.3.1 North zone
To facilitate the analysis and interpretation of the NVI, a map-diagram composition was created at
the basin level. It is composed of three parts: 1) a calendar matrix showing the NVI value for each
day and stations, 2) the number of days within the highest NVI class per station, and 3) a map with
this last value for each station (Figure 3.3).

A total of 31 stations have been analyzed for the time period between May, 19th and July, 31th of
2020. The highest number of days with values over 0.75 can be found in the north of Norway
(Leirbotnvatn, Halsnes and Svartfossberget stations). In the south area the event is not as high as in
the rest or the studied domain. The stations show an increase in discharge but it does not reach an
NVI of 0.75. This happens mainly in Kemijoki, Kalix and Torne basins (see in the top of the diagram in
Figure 3.3).

 14
The 2020 spring floods in the Scandinavian countries - EFAS detailed assessment report

Figure 3.3: NVI analysis for the North Zone. 1) Calendar matrix showing the evolution of NVI levels. 2) The number of days with
NVI > 0.75 by river and station. 3) Map of stations representing the number of days with NVI > 0.75 grouped in 5 classes.

 To facilitate the results of the percentile analysis (see Figure 3.4), the map-diagram composition
 includes four sections: 1) a calendar matrix showing the percentile reached for each day and stations,
 2) the number of days over the 99th percentile per station, 3) the number of days over the Maximum
 per station, and 4) a map with these two last values for each station.

 From the 31 stations, 28 overpassed the 99th percentile and 17 of them exceed the Maximum, with
 Polmak nye, Masi, Onnelansuvanto and Iijärvi having the highest number of days above the Maximum.

 15
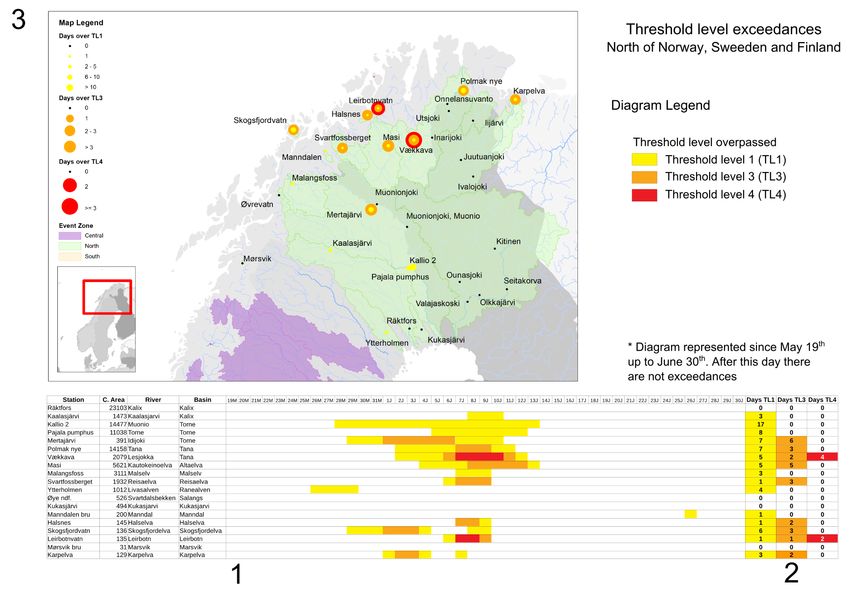
Copernicus Emergency Management Service

Figure 3.4: Percentiles analysis for North Zone. 1) Calendar matrix showing the evolution of Percentile levels. 2) The number of
days with Maximum Daily Discharge (MaxD) > P99 by river and station. 3) The number of days with MaxD > Maximum by river
and station. 4) Map of stations representing the number of days with MaxD > P99 grouped in 5 classes and MaxD > Max grouped
in 3 classes.

Regarding the exceedance of threshold levels, it is necessary to clarify that only 18 out of the 31
stations contain threshold levels defined in EFAS System. Considering this, the area with exceedances
of the highest level is again northern Norway. Leirbotnvatn and Vaekkava stations are the ones that
overpass TL4, but 14 of the 18 stations overpass TL1 and 8 overpass TL2 (see results in Figure 3.5).

 16
The 2020 spring floods in the Scandinavian countries - EFAS detailed assessment report

Figure 3.5 Threshold exceedance analysis for the North Zone. 1) Calendar matrix showing the evolution of thresholds exceedance.
2) The number of days overpassing the maximum threshold by river and station. 3) Map of stations showing the number of days
exceeding the maximum threshold level.

3.3.2 Central zone
Here 24 stations were analyzed for the Central zone for the time period between May 19th and July
31th, 2020. The most remarkable are located in Norway (See Figure 3.6). Selfors and Fustvatn stations
remain for 70 days with NVI greater than 0.75, being followed by Junkerdalselv (68), Nervoll (66) and
Tängvattnet (63). For the Swedish stations, the increase of discharge values is smaller than in the
stations mentioned above, however Stenudden and Sorsele stations present NVI values greater than
0.75 during a high number of days (59 and 45, respectively).

 17
Copernicus Emergency Management Service

Figure 3.6: NVI analysis for the Central Zone. 1) Calendar matrix showing the evolution of NVI levels. 2) The number of days with
NVI > 0.75 by river and station. 3) Map of stations representing the number of days with NVI > 0.75 grouped in 5 classes.

Regarding the percentile analysis, only two of the 24 stations do not overpass the minimum percentile
considered (95th percentile); Øyungen and Mevatnet, two of the stations with a smaller catchment
area, in Norway. Fyrås and Torrböle-2 stations only overpass the 95th percentile, and the other 20
stations overpass the 99th percentile. Tängvattnet, Laksfors and Nervoll stations located in larger
areas show more remarkable exceedances; the first one is the only one with Maximum exceedance,
during 5 days (Figure 3.7).

 18
The 2020 spring floods in the Scandinavian countries - EFAS detailed assessment report

Figure 3.7: Percentiles analysis for the Central zone. 1) Calendar matrix showing the evolution of Percentile levels. 2) The number
of days with Maximum Daily Discharge (MaxD) > P99 by river and station. 3) The number of days with MaxD > Maximum by river
and station. 4) Map of stations representing the number of days with MaxD > P99 grouped in 5 classes and MaxD > Max grouped
in 3 classes.

Finally, as can be seen in Figure 3.8, there are not exceedances of TL4 in the central area, and only
three stations exceed TL3. In decreasing order of number of days and catchment area these are
Tängvattnet, Nervoll and Veravatn stations.

 19
Copernicus Emergency Management Service

Figure 3.8: Threshold exceedance analysis for the Central Zone. 1) Calendar matrix showing the evolution of thresholds
exceedance. 2) The number of days over passing the maximum threshold by river and station. 3) Map of stations showing the
number of days exceeding the maximum threshold level.

3.3.3 South zone
There were more stations in the south zone to be analysed. A total of 59 stations, with 42 of which
have exceedances of the NVI 0.75 value, while seven stations located in Norway are the ones with
more than 60 days with NVI > 0.75, and three of them are in the Glomma basin (Akslen, Nedre
Sjodalsvatn and Tora). The remaining three are Driva (Driva basin river), Kvenna (Skien basin river)
and Hølen (Kinso river). See details in Figure 3.9.

 20
The 2020 spring floods in the Scandinavian countries - EFAS detailed assessment report

Figure 3.9: NVI analysis for the South zone. 1) Calendar matrix showing the evolution of NVI levels. 2) The number of days with
NVI > 0.7 by river and station. 3) Map of stations representing the number of days with NVI > 0.7 grouped in 5 classes.

The percentile exceedances are lower than those of the North zone. Only 7 stations exceed the
Maximum, and they do so for a short period of days. The only station with exceedances of 7 days is
Gaulfoss, on the Gaula River. The other stations are: Rauma and Ulvåa, on the Rauma river, Stuvane,
on the Laerdalselva river, Hørte, on the Skien river and Karpelva on the Karpelva river. Despite this,
only 16 out of the 59 stations do not exceed the 99th percentile. Most of them are located in the
southeast of Norway and southwest of Sweden, while the remaining stations overpassed percentiles
although not as high as in the north (see Figure 3.10).

 21
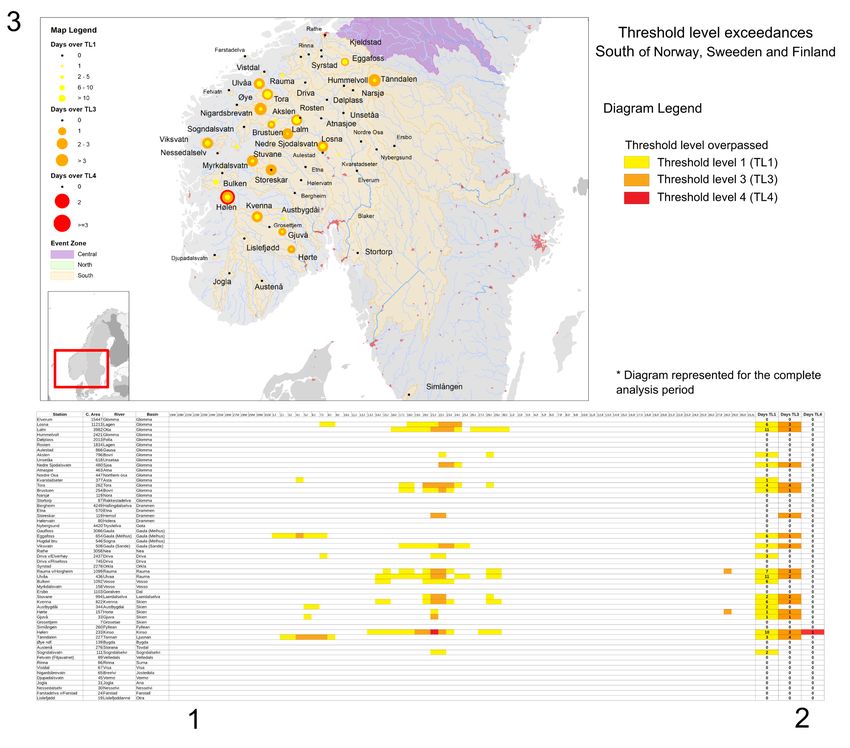
Copernicus Emergency Management Service

Figure 3.10: Percentiles analysis for the South zone. 1) Calendar matrix showing the evolution of Percentile levels. 2) The number of
days with Maximum Daily Discharge (MaxD) > P99 by river and station. 3) The number of days with MaxD > Maximum by river and
station. 4) Map of stations representing the number of days with MaxD > P99 grouped in 5 classes and MaxD > Max grouped in 3
classes.

There are 57 stations in the south area with threshold levels defined in EFAS System. Only one of
them, exceed the three levels: Hølen, on the Kinso river, level TL4 was overpassed during only one
day, TL3 and TL1 were exceeded during three and ten days respectively. However, the exceedances
of TL3 are mainly in Norway, with fifteen stations overpassing TL3. In Sweden only the Tänndalen
stations on the Tannan river exceeded the thresholds (Figure 3.11).

 22
The 2020 spring floods in the Scandinavian countries - EFAS detailed assessment report

Figure 3.11: Threshold exceedance analysis for the South Zone. 1) Calendar matrix showing the evolution of thresholds
exceedance. 2) The number of days overpassing the maximum threshold by river and station. 3) Map of stations showing the
number of days exceeding the maximum threshold level.

3.4 Comparison with previous events
For the comparative study of previous events in the 114 stations affected by this event, an analysis
of the Near Real-Time (NRT) data up to 31 December 2019 has been carried out. The three most
outstanding peaks (or events) of each station have been selected, establishing a ranking of events
per station (1st, 2nd and 3rd) according to the maximum value reached. As a result of this analysis it
is possible to highlight 4 spring snowmelt events, due to their extension or high number of stations
affected (see Figure 3.12 (3)): spring 2014, which stands out in 26 stations; spring 2015, which stands
out in 25 stations; spring 2017, which stands out in 39 stations; and finally spring 2018, which stands
out in 59 stations, of which a total of 31 had the highest peak discharge observed in the available
record. The 2018 event could therefore be considered the largest and most intense in the recent past,
and has been selected for comparison with the 2020 event. However, comparing the extent of the
events, the 2020 event could be classified as the largest event in the entire Scandinavian territory in
recent years.

For the 31 stations located in the northern zone, the 2018 event affected 74% of them (23) and is

 23
Copernicus Emergency Management Service

the most representative in almost 40% (12). In the central zone (with 24 stations), it is the most
representative for 30% of the stations (7) and in the south (with 59 stations) it stands up in 20% of
the stations (12). Figure 3.12 (1) represents a map with the stations that present the 2018 event,
indicating the order of importance of this event in each station.

Figure 3.12: 1) Map with locations for the 2018 event, including the order of importance by station. 2) Comparison, in five
stations, between the events of 2020 and 2018. 3) Ranking table of previous events. Zone breakdown of the 2018 event
and comparison with the 2020 event.

In Figure 3.12 (2) there is also a graphical representation for some selected stations in the three
zones. The selection has been made based on the stations with exceedances of the threshold levels
in the 2020 event. To facilitate the visual comparison, the hydrographs of both events were overlaid
with each other and aligned at their respective peaks (event time = 0). The negative and positive
values of "event time" represent time before and after arrival the peak discharge, respectively.

Regarding the intensity of both events, Figure 3.12 (1) shows in red the 24 stations where the 2020
event exceeded the 2018 event and in green the 35 where the 2018 event is still more intense. It is
important to note that 10 stations show the 2020 event as the most intense, among which are
stations the Vaekkava and Mertajärvi, depicted in Figure 3.12 (2) in hydrographs 1 and 2 respectively.

 24
The 2020 spring floods in the Scandinavian countries - EFAS detailed assessment report

4 Public information about the flood event
4.1 Finland
Information at the Finnish Environment Institute (SYKE) website for flood warning (Figure 4.1)
showed approximately 20 stations with a level associated to a dangerous or unusual flood (level 2
out of 3) during the most intensive period of the snow melting (4th June to ~21st of June). One
station went over the level for very dangerous or exceptional flood (level 3 out of 3) on the 4th of
June. The number of active stations decreased to two at the end of June, while at the end of July
only one station was active. There were no reports at floodlist.com.

Figure 4.1: Screenshots of the Finnish Environment Institute (SYKE) website for flood warnings. Yellow, orange and red
triangles indicate warning level 1, 2 and 3 respectively.

4.2 Norway
Information from the Water Resources and Energy Directorate (NVE) website for flood warning
showed stations above the orange level (3 out of 4) almost every day from 4th June until 2nd July.
Among the days with the most intensive forecast was the 8th of June with 2 orange stations (level 3
out of 4) and 1 red station (level 4 out of 4). The highest level (4 out of 4) was active for 3 days at
Finnmark, see Figure 4.2 (left). The 22nd and 23rd June can also be considered intense with a total of
4 stations above the orange level, see Figure 4.2 (right). There were no reports at floodlist.com.

 25
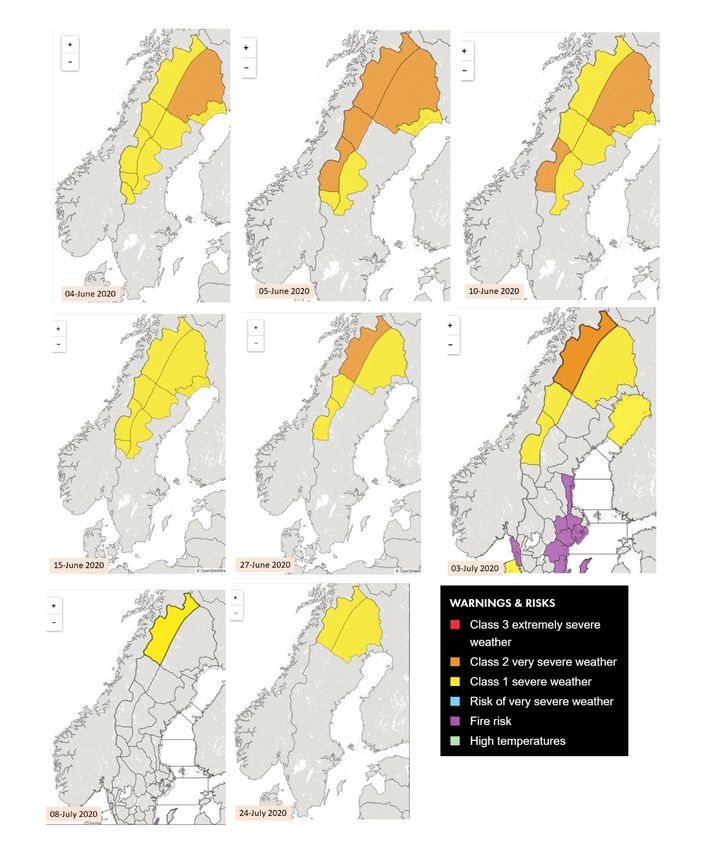
Copernicus Emergency Management Service

Figure 4.2: Screenshots of the Water Resources and Energy Directorate (NVE) website for flood warning on the 8th June
2020 (left) and on the 23rd June (right). Yellow, orange and red colors indicate warning level 1, 2 and 3 respectively.

4.3 Sweden
The Swedish Meteorological and Hydrological Institute (SMHI) issued several warnings (level 2 out
of 3, which indicates exceedance of the 10-year RP) for the north-west of the country between 4th
June to 3rd of July (Figure 4.3). Warning level 1 out of 3 were issued until the 24th July. Discharge
values in the river network at different parts of the country were clearly larger than the mean value
for the specific days in the months of June and July (blue areas in Figure 4.4). There were no
reports at floodlist.com.

 26
The 2020 spring floods in the Scandinavian countries - EFAS detailed assessment report

Figure 4.3: Screenshots from the Swedish Meteorological and Hydrological Institute (SMHI) website for flood warnings
during the 2020 spring flood period.

 27
Copernicus Emergency Management Service

Figure 4.4: Discharge variation in relation to the mean value for the same day. Blue (red) colors indicate above (below)
normal conditions.

 28
The 2020 spring floods in the Scandinavian countries - EFAS detailed assessment report

5 EFAS forecast and information
5.1 Background information about EFAS
EFAS forecasts are computed at the European Centre for Medium-Range Weather Forecasts
(ECMWF, UK) and then disseminated twice a day by three Centers located at different countries. The
hydrological forecasts are generated using meteorological and hydrological data from ECMWF and
DWD as well as other EFAS data providers. More specifically, the system incorporates weather
forecasts from two different weather services, real-time weather observations from around 15,000
stations across Europe and real-time hydrological observation from more than 1900 stations.
Observations are used to calibrate, validate and generate the forecast through the hydrological
model LISFLOOD.
EFAS version 3.6 was operational until the 15th October 2020 (currently the improved version EFAS
4.2 is operational). EFAS produces information twice a day, based on the 00:00 UTC and 12:00 UTC
meteorological forecasts, and the information is made available to all EFAS partners using EFAS-IS.
EFAS-IS is the interface where a number of products are visualized, including simulated soil
moisture, snow accumulation, observed temperature and precipitation averages, rapid impact
assessment, probabilistic river flood hazard forecasts, flash flood hazard forecasts, accumulated
precipitation forecasts, and (sub-)seasonal hydrological forecast outlook. Only partners, third party
or research projects have access to the real-time forecasts after agreeing on and signing a
Condition of Access (CoA), whereas all the information older than 30 days is freely open to the
public.
The forecasters for the EFAS Dissemination Centre analyses the EFAS results twice a day, in the
morning by 8:30 CET/CEST and in the afternoon by 16:00 CET/CEST. Forecasters on duty discuss the
situation and what notifications should be sent via the communication platform and in complicated
cases by telephone. The notifications are logged in the EFAS-IS and distributed by email including
the name of the responsible forecaster who can then be contacted by the EFAS partners in case of
further questions.

The criteria used in EFAS 3.6 to send notifications are described in below.
Criteria for EFAS Flood Notification - Type Formal:
• Catchment part of Conditions of Access.
• Catchment area is larger than 2000 km2.
• Event more than 48 hours in advance with respect to forecast date.
• Forecasts are persistent (3 consecutive forecasts with more than 30 % exceeding EFAS 5-year
 return period threshold according to ECMWF-ENS or to COSMO-LEPS).
• At least one of the deterministic forecasts (ECMWF or DWD) exceeds also the EFAS 5-year
 return period threshold.
Criteria for EFAS Flood Notification – Type Informal:
• Catchment part of Conditions of Access.
• Any of the above criteria is not met (catchment size, lead time, forecast persistence,
 deterministic forecast exceedance) but the forecasters think the authorities should be informed.
 Note: The minimum catchment size where EFAS provides skillful results is approx. 1000 km2.
 For catchment areas significantly smaller than 1000 km2 no EFAS Flood Notification – Type
 Informal should be sent.
• Any other doubt.

The following rules are also followed before deciding for a notification:

 29
Copernicus Emergency Management Service

 • If an EFAS Flood Notification has been sent already for a tributary there is no need to send
 another one if a new reporting point appears further downstream in the same tributary (i.e.
 the flood wave is travelling downstream)
 • If an EFAS Flood Notification has been sent for a tributary and a new reporting point
 appears further downstream located in the main stream a notification should be sent.
 • If an EFAS Flood Notification has been sent for major river and a new reporting point
 appears further downstream a notification should be sent if the new reporting point is
 located in another country.
 • If an EFAS Flood Notification has been sent for a specific reporting point and the forecasted
 discharge falls below the EFAS high threshold and then rises again above the EFAS high
 threshold this can be considered a new event and a new notification should be sent.
Sending out an EFAS Flood Notifications is done using the EFAS cart system in www.efas.eu. An
EFAS Notification should always be sent first to partners, before submission of the ERCC Overview.
Although parts of the Notification email are composed automatically, the forecaster needs to adapt
some parts of the text manually.
A request for feedback is automatically integrated in the Formal Flood notification email sent to the
partners.

5.2 EFAS forecast during the event
5.2.1 EFAS timeline of the event
A timeline for the issued notifications is shown in Table 5.1. Flow above the 5-year RP was firstly
forecasted on the 22nd of May for the Norwegian river Namsen and the high discharge values were
the result of a combined effect of rainfall and snow melting. Both the DWD and ECMWF predictive
systems forecasted a steep increase in temperature (see Figure 5.1) leading to a number of
reporting points associated merely with snow melting on the 23rd of May. Consequently, a total of 5
notifications were issued which later increased to a total of 14 on the 27th; all of them in Finland
(see green rows in Table 5.1).
One of the first notifications in Finland (River Iijoki) forecasted 2 days ahead on time an exceedance
of the 5-year RP with the event starting on the 25th of May. The period during which a notification
was active varied from 3 to 36 days (Table 5.1), while the short lead time of the forecast led to two
of the informal flood notifications.

The EFAS sub-seasonal outlook (river flow anomaly and its probability of occurrence for the next six
weeks, aggregated over regions) predicted a high probability of high flow in the affected areas
already from the 20th of April (Figure 5.2). The EFAS seasonal outlook (river flow anomaly and its
probability of occurrence for the next eight weeks, aggregated over regions) predicted high
probability of high flow in the affected areas starting from the 1st of May (Figure 5.3).

Figure 5.1: EFAS Forecasted temperature at a station near the Rovaniemi airport on the 20th of May 2020.

 30
The 2020 spring floods in the Scandinavian countries - EFAS detailed assessment report

Table 5.1: Issued EFAS formal/informal notifications during the 2020 spring flood for the Scandinavian region (countries
are differentiated by colour).

 Area Duration
 No Station ID Country Basin River Station Name [km2] PointID Sent on Disable on (days) Type of warning
 1 -99 NORWAY Norway Namsen Not a station 6200 DH000201 2020-05-22 2020-06-17 26 Formal
 2 1999 Finland Oulujoki-Iijoki Kuivajoki LUUJOKI HAARAN 1350 SH000161 Informal Because
 ALA PUOLELLE of the small
 2020-05-23 2020-06-01 9 affected area
 3 124 Finland Kemijoki Jumiskonjoki Jumisko 1300 SH000068 Informal because
 of the small
 2020-05-23 2020-05-26 3 affected area
 4 2885 Finland Iijoki Iijoki Vaatajansuvanto 4150 SM000155
 2020-05-23 2020-06-01 9 Formal
 5 2887 Finland Iijoki Livojoki Livojoki Hanhikoski 2150 SM000155
 2020-05-24 2020-05-30 6 Formal
 6 2886 Finland Iijoki Jaurakkajarvi Jaurakkajarvi- 2550 SH000160
 luusua 2020-05-24 2020-06-03 10 Formal
 7 2000 Finland Simojoki Simojoki SIMO 3125 SH000154 2020-05-24 2020-06-01 8 Formal
 8 -99 Finland Finland (Gulf of Kemijoki, above Not a station 3125 DH000066
 Bothnia) Ounasjoki 2020-05-24 2020-05-26 2 Formal
 9 -99 Finland Patsojoki Paatsjoki Not a station 2725 DH000031 Informal due to
 2020-05-24 2020-05-29 5 the short lead time
 10 2888 Finland Oulankajoki KOUTAJOKI Oulankajoki 2100 SH000106 2020-05-25 2020-06-04 10 Formal
 11 -99 Finland Finland (Gulf of Luiro Not a station 4925 DH000053
 Bothnia) 2020-05-26 2020-06-08 13 Formal
 12 131 Finland Kemijoki Meltausjoki Unari luusua 1175 SH000086 2020-05-26 2020-06-04 9 Formal
 13 125 Finland Kemijoki Kemijoki Kemihaara 10 325 SH000074 2020-05-27 2020-06-13 17 Formal
 14 132 Finland Kemijoki Ounasjoki Ounasjoki, 12 900 SH000102
 Marraskoski 2020-05-27 2020-06-07 11 Formal
 15 319 Norway Drammen Snarum Sklfoss 5100 SH000405 2020-05-28 2020-06-04 7 Formal
 16 -99 Norway Moel Moel Not a station 2525 DH000291 2020-05-28 2020-07-03 36 Formal
 17 307 Norway Glomma Glomma Hummelvoll 2450 SH000295 2020-05-28 2020-06-08 11 Formal
 18 -99 Norway Hallingdalselva Hallingdalselva Not a station 2325 DH000379
 2020-05-28 2020-07-01 34 Formal
 19 -99 Norway Temijoki Tenojoki Not a station 15 800 DM000001 2020-05-28 2020-07-01 34 Formal
 20 1099 Norway Gaula (Melhus) Gaula (Melhus) Gaulfoss 3200 SH000269
 2020-05-28 2020-06-05 8 Formal
 21 1982 Norway Altaelva Altaelva KISTA 6250 SH000019 2020-05-28 2020-06-10 13 Formal
 22 1114 Norway Vefsna Vefsna Laksfors 3575 SH000184 2020-05-28 2020-06-20 23 Formal
 23 -99 Sweden Indals Indals?lven Not a station 2475 DH000230 2020-05-28 2020-06-09 12 Formal
 24 1132 Norway Byaelva Byaelva Hkkadalbrua 2125 SH000155 2020-05-29 2020-06-04 6 Formal
 25 -99 SWEDEN Angerman Angerman Not a station 3000 DH000204 2020-05-29 2020-06-16 18 Formal
 26 -99 SWEDEN Angerman Vojman Not a station 2300 DH000120 2020-05-29 2020-06-16 18 Formal
 27 134 Finland Kemijoki Kemijoki Isohaara 52 475 SH000151 2020-05-29 2020-06-16 18 Formal
 28 1107 Norway Malselv Malselv Malangsfoss 2975 SH000050 2020-05-29 2020-06-27 29 Formal
 29 144 Finland YES Paatsjoki Paatsjoki Kaitakoski 14 575 2020-05-30 2020-06-14 15 Formal
 30 136 Finland Torne Muonio Muonionjoki, Muonio 9250 SH000063
 2020-05-31 2020-06-12 12 Formal
 31 1966 Sweden Torne Torneaelven KUKKOLANKOSKI 39 975 SH000146
 OEVRE 2020-05-31 2020-06-12 12 Formal
 32 297 Norway Drammen Begna Bagn 2975 SH000365 2020-06-03 2020-06-09 6 Formal
 33 -99 NORWAY Norway Coastal zone Not a station 2100 DH000155 2020-06-04 2020-07-02 28 Formal
 34 317 Norway Glomma Lagen Rosten 1825 SH000315 Informal due to
 the small affected
 2020-06-04 2020-06-08 4 area
 35 1076 Norway Nea Nea Rathe 3050 SM000249 Informal due to
 the short forecast
 2020-06-04 2020-06-10 6 lead-time.
 36 -99 NORWAY Norway Rana Not a station 3975 DH000152 2020-06-06 2020-07-07 31
 37 1075 Norway Rauma Rauma Rauma v/Horgheim 1125 SH000287 Informal due to
 the small affected
 2020-06-06 2020-06-24 18 area.
 38 -99 SWEDEN Umelrven Ume?lven Not a station 3175 DH000184 2020-06-07 2020-07-16 39 Formal
 39 1056 Norway Vosso Vosso Bulken 1075 SH000372 Informal due to to
 (Vangsvatnet) the small affected
 2020-06-08 2020-06-26 18 area.
 40 301 Norway Glomma Lagen Eide 7925 SH000328 2020-06-08 2020-06-30 22 Formal
 41 -99 SWEDEN Skellefte Skellefte Not a station 3075 DH000136 2020-06-08 2020-06-20 12 Formal
 42 1195 Sweden Pite Tjeggelvas Stenudden 2375 SH000060
 2020-06-10 2020-06-24 14 Formal
 43 -99 SWEDEN Lullmlven Stora Lule Not a station 2350 DH000045 2020-06-10 2020-06-26 16 Formal
 44 -99 SWEDEN Umelrven Vindel Not a station 3050 DH000164 2020-06-16 2020-06-22 6 Formal
 45 319 Norway Drammen Snarum Sklfoss 5100 SH000367 2020-06-20 2020-06-24 4 Formal
 46 1195 Sweden Pite Tjeggelvas Stenudden 2375 SH000060 2020-06-29 2020-06-30 1 Formal
 47 -99 FINLAND Finland (Gulf of Luiro Not a station 3625 DH000031
 Bothnia) 2020-06-29 2020-07-29 30 Formal
 48 2897 Sweden Umeliven Umeliven HARRSELE KRV 13650 SH000176
 2020-07-12 2020-08-06 25 Formal

 31
Copernicus Emergency Management Service

Figure 5.2: EFAS river flow anomaly and its probability of occurrence for the next six weeks, aggregated over regions for
the 20th April 2020 (left) and 29 April 2020 (right) initializations. This is based on the EFAS sub-seasonal outlook product.

Figure 5.3: EFAS river flow anomaly and its probability of occurrence for the next eight weeks, aggregated over regions
(forecasts initialized on the 1st of May 2020). This is based on the EFAS seasonal outlook product.

 32
The 2020 spring floods in the Scandinavian countries - EFAS detailed assessment report

6 Verification
6.1 Verification of EFAS forecasts
6.1.1 Meteorological situation
6.1.1.1 Snow
EFAS modelled larger amount of snow water equivalent for Norway (specially along the west coast)
and Finland (northern part) than the other parts of Scandinavia (see Figure 2.5). This result agrees
with the analysis of observed precipitation prior to the event (see section 2.2, and specifically Figure
2.1 and 2.2). Furthermore, different media reports in Finland and Norway (see Media report 1 and 5
respectively in Annex 1) referred to an unusual high amount of snow for winter in 2020.
6.1.1.2 Effect of forecasted precipitation and temperature errors on forecasted discharge
The combined effect that errors in temperature and precipitation from the meteorological forecasts
have on the medium-range discharge forecasts was analyzed for 6 EFAS notification points (see
Annex 2), which are those that were associated with the most severe flooding.

Based on the analysis in Annex 2, it can be summarized that the ECMWF meteorological forecasts
could persistently forecast the precipitation and temperature conditions from 4 to 9 days ahead on
time. The forecasted time to peak agreed quite well with the time obtained later when the model
was run with the observed input data; differences were negligible except for one point in Sweden
where the overprediction was about 50%. The hydrological predictions always achieved with time a
correct value as a result of the model (initial conditions) update with the meteorological
observations. The persistence of the DWD forecast was inferior in comparison to the ECMWF
forecast persistence for 4 out of 6 stations. The DWD forecasts usually overestimated the peak by
at least 15% for all the cases. By inspecting the stations with problems in persistence, it appeared
that the DWD system tended to forecast a higher (plus 2-3 oC) temperature leading to an increased
amount of snowmelt.
For the local case in Finland, the pattern of EFAS 3.6 forecasted temperature (10 days ahead on
time; see Figure 5.1) agree well, but also locally with the observed temperature from a station in
Finland (Figure 2.4); differences of max 3 °C can be observed between the DWD and ECMWF
forecasts. The temperature at the station measured about 3 °C higher than the temperature in the
EFAS information/forecast (for both DWD and ECMWF), which could be the result of local variations.
In general, it seems that forecasted temperature for ECMWF was slightly better and more persistent
than that for DWD.

6.1.2 EFAS flood hazard forecasting
6.1.2.1 Medium-range forecasting
In terms of timing
Table 6.1 presents a summary of the performance of the EFAS forecast for the stations where
notifications were sent and had discharge observations during the event. An evaluation was done
for the forecasts 6 and 2 days before the observed peak; 6 days was chosen here to make it
possible to identify the peak of the forecasted event, this might not have been possible if chosen
the maximum lead time (10 days). For the notifications analyzed in Table 6.1, EFAS forecasted the
time of the peak to be earlier than the actual observation for almost all the predictions i.e. for 6 or
2 days before the peak, for both DWD and ECMWF. The ECMWF and DWD systems estimated the
peak to be too early, with an average of 3 and 2 days respectively when the forecast was 6 days
before the observed peak. For the 2 days lead time, the forecast of the correct time of the peak
improved for DWD and decreased slightly for ECMWF.
The result of this analysis is also supported by EFAS partners’ input. It was mentioned in one
reported point (see Annex 3) that the forecasted time of the peak was about 3 days too early. In

 33
Copernicus Emergency Management Service

addition, a comment from a partner in Norway pointed out that the partner experienced EFAS to
have a faster response when comparing with the local observations (see Annex 4).

In terms of peak magnitude
For the analyzed stations in Table 6.1, underprediction is shown for most of the stations using both
the DWD and ECMWF forecasts. The forecasted magnitude of the peak did not change significantly
when the lead time to peak was shorter, i.e. from 6 to 2 days or even when using real observed
input data (column Diff Obs Input data). This shows that the meteorological predictions were
somewhat persistent and that in fact the errors were caused by the hydrological model. The
forecasts from 6 days lead time led to an average underprediction of 28% and 25% for ECMWF
and DWD respectively. The underprediction improved for the 2 days lead time and resulted into
21% for both systems.
In terms of spatial extent
Figure 3.4 shows a total of 17 stations in north Scandinavia that reached discharge values larger
than the maximum measured in the historical (at least 6 years) records. Together in the central and
northern part of Scandinavia 7 stations reached the maximum (Figure 3.9 and 3.10). Particularly,
values in the north of Finland and Norway experienced maximum values in more than 10 days (red
circles in Figure 3.4).
Based on a visual evaluation, it can be concluded that notifications sent by EFAS (See for example
Figure 2.6) cover all the areas with high flows (exceeding the 99th percentile) as shown in Figure 3.4,
3.7 and 3.10. EFAS notifications are not sent to all stations with high flows, since according to the
criteria to send EFAS notifications, only one notification per tributary is sent unless a new reporting
point appears downstream in a main stream or in another country. Comparison of Figure 3.5, 3.8,
3.11 and 2.6 indicate that all stations where observed discharge exceeded a threshold level were
covered by the EFAS notifications.
Analysis at stations that reached the highest alert level
Analysis of the discharge exceeding the national threshold levels (only available for Norway and
Sweden) shows that the highest Level (TL4) was exceeded for 3 stations; 2 in the north
(Leirbothnvatn and Vaekkava in Norway), none in central, and 1 in the south zone (Holen in Norway)
(Figure 3.7, 3.10 and 3.13 respectively). Inspection of the EFAS forecasts for the Vaekkava station
(Figure 6.1) shows that while the magnitude of the peak was near the observation, the time of the
peak was about 7 days too early. The stations Leirbothnvatn and Holen were not analyzed here as
the drainage area is smaller than the threshold set in EFAS, i.e. 2000 km2.

 34
The 2020 spring floods in the Scandinavian countries - EFAS detailed assessment report

Figure 6.1: EFAS forecasts for station Vaekkava for the: a) 6th of June, and b) 10th of June. c) shows the observation
when discharge reached a maximum peak.

Although information on exceedance levels is not available for Finland, from the national service is
shown that one station near the lake Inarijärvi exceeded the highest warning level from the 4th to
the 6th of June (Figure 4.1). The location of the station in the national system agrees well with the
location of the EFAS station with ID 144, named Kaitakoski in the basin Paatsjoki (Figure 2.8). The
forecasted time of the peak was on the 3rd of June based on DWD and on the 5th of June based on
ECMWF, which agrees well with the time when the station exceeded the highest level in the national
system. The station went over the 20-year RP which indicates that probably the forecasted
magnitude was close to the observations.

None of the stations in Sweden reached the highest level according to the observations. The highest
level in Sweden is associated with return periods larger than 50 years. Although some stations
exceeded the 20-year RP in EFAS, these would be classified as second level (TL3 in Figure 3.5, 3.8
and 3.11) which agrees with locations where Level 2 (from 10 to 50-year RP) was exceeded in the
national system (Figure 4.3).

 35
You can also read