Equilibrium exchange rate - FACULTY OF MATHEMATICS, PHYSICS AND INFORMATICS COMENIUS UNIVERSITY BRATISLAVA - Master thesis
←
→
Page content transcription
If your browser does not render page correctly, please read the page content below
FACULTY OF MATHEMATICS, PHYSICS AND
              INFORMATICS
  COMENIUS UNIVERSITY BRATISLAVA
     Mathematics of Economics and Finance

 Equilibrium exchange rate
                Master thesis

            Author: Dénes Kucsera
                Bratislava 2007
Rovnovážny výmenný kurz
Diplomová práca
Dénes Kucsera
UNIVERZITA KOMENSKÉHO
FAKULTA MATEMATIKY, FYZIKY A INFORMATIKY
KATEDRA APLIKOVANEJ MATEMATIKY A ŠTATISTIKY
Ekonomická a finančná matematika
Vedúci diplomovej práce: RNDr. Juraj Zeman, CSc.
BRATISLAVA 2007I declare this thesis was written on my own, with the only help provided by my supervisor and the reffered-to literature.
I would like to express special thanks to my supervisor RNDr. Juraj
Zeman, CSc. for all support and guidance he offered throughout the elabo-
ration of this thesis. I would like to also thank my family and friends, who
were supporting me throughout my whole studies.
Abstract

In this paper a CPI and PPI based real effective equilibrium exchange rate
of the Slovak koruna is investigated. The model inspired by Alberola et
al. (1999, 2002) estimates the behavioral equilibrium exchange rate (BEER)
by using macroeconomic fundaments, dual productivity (Balassa-Samuelson
effect) and country’s net foreign assets position. The resulting model is
decomposed to permanent (permanent equilibrium exchange rate) and tran-
sitory component using Gonzalo-Granger decomposition and HP filter. The
BEER approach enables to estimate the future path of real equilibrium ex-
change rate using the observed relationship. By backward transformation of
real equilibrium exchange rate, the estimate of the value of equilibrium nom-
inal exchange rate at the period of Slovakia’s euro adoption can be obtainted.

Keywords: real equilibrium exchange rate, cointegration analysis, Balassa-
Samuleson effect, net foreign assets, Gonzalo-Granger decomposition

                                      v
Abstrakt
V tejto diplomovej práci skúmame reálny efektı́vny rovnovážny výmenný
kurz Slovenskej koruny založený na indexe spotrebitel’ských cien a cien výrob-
cov. Model na určenie behaviorálneho rovnovážneho kurzu (BEER) použitý
v tejto práci bol inšpirovaný Alberola et al. (1999, 2002). Správanie sa rov-
novážneho kurzu je popı́sané pomocou produktivity a čistých zahraničných
aktı́v. Výsledný časový rad je následne rozložený na permanentnú zložku
(PEER) a krátkodobé výkyvy, pričom použité sú dve metódy: Gonzalo-
Grangerov rozklad a HP filter. Metóda BEER na základe odhadnutých
vzt’ahov umožňuje predikovat’ vývoj rovnovážneho výmenného kurzu. Spät-
nou transformáciou prognózovaného reálneho rovnovážneho kurzu môžeme
zı́skat’ predikciu konverzného kurzu voči euru.
Kl’účové slová: reálny rovnovážny výmenný kurz, kointegrácia, Balassa-
Samuelsonov efekt, čisté zahraničné aktı́va, Gonzalo-Grangerov rozklad
viContents
Abstract v
Contents vii
List of Figures ix
List of Tables x
Introduction 1
1 Econometric Methodology 3
1.1 Time series and stochastic processes . . . . . . . . . . . . . . . 3
1.1.1 Stationary stochastic processes . . . . . . . . . . . . . 4
1.1.2 Autoregressive and moving average processes . . . . . . 5
1.2 Integrated processes and tests for Unit Root . . . . . . . . . . 5
1.2.1 Dickey-Fuller test for Unit Root . . . . . . . . . . . . . 6
1.2.2 Alternative approaches for testing Unit Root . . . . . . 7
1.3 Cointegration . . . . . . . . . . . . . . . . . . . . . . . . . . . 7
1.3.1 Vector error correction (VEC) . . . . . . . . . . . . . . 8
1.3.2 Testing cointegration . . . . . . . . . . . . . . . . . . . 9
1.3.3 The econometric decomposition - Gonzalo and Granger 11
2 The Econometric Model 12
2.1 Nominal and real exchange rate . . . . . . . . . . . . . . . . . 12
2.2 The real effective exchange rate . . . . . . . . . . . . . . . . . 14
vii2.3 Equilibrium exchange rate modelling . . . . . . . . . . . . . . 15
2.3.1 Purchasing power parity (PPP) . . . . . . . . . . . . . 15
2.3.2 Fundamental equilibrium exchange rate (FEER) . . . . 16
2.3.3 Behavioral equilibrium exchange rate (BEER) . . . . . 17
2.3.4 Permanent equilibrium exchange rate (PEER) . . . . . 18
2.4 Which fundamentals use for modelling? . . . . . . . . . . . . . 18
2.4.1 External balance . . . . . . . . . . . . . . . . . . . . . 19
2.4.2 Internal Balance - The Balassa-Samuelson effect . . . . 21
2.5 Gonzalo and Granger decomposition . . . . . . . . . . . . . . 22
3 Data Sources and the Construction of Time Series 24
3.1 Volume of bilateral trade . . . . . . . . . . . . . . . . . . . . . 25
3.2 The real effective exchange rate in Slovakia . . . . . . . . . . . 27
3.3 The dual productivity differential . . . . . . . . . . . . . . . . 29
3.4 Net foreign assets . . . . . . . . . . . . . . . . . . . . . . . . . 31
4 Estimation Results 34
4.1 Estimation of behavioral equilibrium exchange rate . . . . . . 36
4.1.1 The CPI based real effective exchange rate . . . . . . . 36
4.1.2 The PPI based equilibrium exchange rate . . . . . . . . 38
4.2 Real misalignment . . . . . . . . . . . . . . . . . . . . . . . . 39
4.3 Forecasting real equilibrium exchange rate . . . . . . . . . . . 43
4.4 The forecast of the nominal exchange rate . . . . . . . . . . . 45
Conluding Remarks 47
A Indicators for Trading Partners 49
B REER Forecasts and Estimation Results 51
Bibliography 55
viiiList of Figures
2.1 The comparison of different methods. . . . . . . . . . . . . . . 18
3.1 The percentage of Slovak trade volume with its main trading
partners. . . . . . . . . . . . . . . . . . . . . . . . . . . . . . . 25
3.2 The evolution of the trade of goods with Czech Republic and
Germany relative to total trade of Slovak Republic (in %). . . 26
3.3 The CPI and PPI based real exchange rate. . . . . . . . . . . 28
3.4 The nominal effective exchange rate for basic and extended
scenario. . . . . . . . . . . . . . . . . . . . . . . . . . . . . . . 29
3.5 Dual productivity differential for both scenarios. . . . . . . . . 30
3.6 The two proxies of net foreign assets. . . . . . . . . . . . . . . 32
4.1 CPI based BEER for extended scenario. . . . . . . . . . . . . 37
4.2 CPI based BEER for basic scenario. . . . . . . . . . . . . . . . 38
4.3 PPI based BEER for basic scenario. . . . . . . . . . . . . . . . 39
4.4 Real misalignment indicated by model 1. . . . . . . . . . . . . 40
4.5 Real misalignment indicated by model 2. . . . . . . . . . . . . 40
4.6 Real misalignment indicated by model 3. . . . . . . . . . . . . 41
4.7 The percentage appreciations of the models . . . . . . . . . . 43
A.1 The nominal exchange rates (SKK vs. trading partners) . . . 50
B.1 Johansen method estimation results for model 1 . . . . . . . . 53
B.2 Johansen method estimation results for model 2 . . . . . . . . 53
B.3 Johansen method estimation results for model 3 . . . . . . . . 54
ixList of Tables
4.1 ADF test results for time series in levels. . . . . . . . . . . . . 35
4.2 ADF test results for first differences of the time series. . . . . 35
4.3 The weighted average of the forecasts for basic scenarios. . . . 44
4.4 The forecasts of macroeconomic fundamentals for Slovak Re-
public. . . . . . . . . . . . . . . . . . . . . . . . . . . . . . . . 44
4.5 The forecasts of REER. . . . . . . . . . . . . . . . . . . . . . 45
4.6 The forecast of the SKK/EUR exchange rate at the end of 2008. 46
A.1 The weight coefficients of trade balance for basic scenario . . . 49
A.2 The weight coefficients of trade balance for extended scenario . 49
A.3 Forecasts of trading partners’ macroeconomic indicators . . . . 50
B.1 Contributions of particular fundaments to the appreciation of
REER (in percentage points) . . . . . . . . . . . . . . . . . . 51
B.2 The percentage appreciation of the REER in the period of
1993-2008 . . . . . . . . . . . . . . . . . . . . . . . . . . . . . 52
B.3 LM test results . . . . . . . . . . . . . . . . . . . . . . . . . . 52
xIntroduction After entering the European Union in May 2004, Slovakia is facing an other great challenge in the convergence process, the adoption of the euro in 2009. Consequently, the knowledge of the equilibrium exchange rate or even more the deviation of the actual exchange rate from its equilibrium is one of the key interests of policy makers and market participants. An overvalued currency may lead to an unsustainable current account deficit, increasing external debt and the risk of speculative attacks. On the other hand, an undervalued currency has undermining effects on economic growth. In recent years, the Slovak economy is pulled by the production start in au- tomotive industry. Thanks to huge foreign direct investments in this sector, Slovakia became a so-called Central-European Tiger, with almost double- digit growth rates starting from the second half of 2006. Along with high economic growth, also the Slovak currency appreciates continuously. One of the aims of this thesis is to determine, whether the appreciation is in line with the economic fundaments. If not, further policy instruments are needed to ensure sustainable growth and the fulfilment of Maastricht criteria, in- evitable for adopting the European currency. Foreign capital brings new technologies and know-how, hence indirectly im- proving the productivity. Foreign direct investments and productivity are the fundaments, with the help of which we attempt to model the real effec- tive equilibrium exchange rate of Slovakia. As for the relative price measures
2

we utilize the series of CPI and PPI indexes in Slovakia and its main trad-
ing partners. For these purposes, we construct two sets of foreign countries
consisting of Slovakias two (Czech Rep. and Germany) and nine (Cz, Ge, It,
Fr, At, Us, Ne, Uk, Sw) main trading partners.

The paper is structured as follows. Chapter 1 provides a brief overview of the
econometric methodology (unit root test, cointegration) later used in mod-
elling the equilibrium exchange rate. Chapter 2 discusses the basic definitions
and different methods the real equilibrium exchange rate can be modelled.
Chapter 3 describes the construction of the data set, followed by chapter 4
providing the unit-root tests and the estimated models. It concludes with
the forecasts of real and nominal equilibrium exchange rates.
Chapter 1

Econometric Methodology

”In all econometrics, a model is a set of restrictions on the joint distribution
of observed variables or, in other words, a set of joint distributions satisfying
a set of assumptions.”

                                                                        Robert M. Kunst

      In this chapter, first we decribe the basic terms in econometric termi-
nology. Econometric time series can be classified in several ways, indicating
various methods for modelling time series. In this section, we will get closer
with integration of time series and related Durbin-Watson test. Finally we
introduce the term cointegration and the most widespread Johansen’s coin-
tegration test.

1.1         Time series and stochastic processes
A time series is a sequence of data points that show the evolution of a variable
measured usually in equidistant time points.
      A stochastic process Xt (ω) can be defined as a sequence of real-valued
random variables Xt : ω → R, defined on a common probability space such
that all joint probabilities exist. If Xt (ω) is a stochastic process, X1 , ..., XT
will denote the realization of discrete-time stochastic process1 . This sequence
  1
      We talk about discrete-time series when it has finite or countable realizations.
1.1 Time series and stochastic processes 4
of realization of the random variable is called time series.
1.1.1 Stationary stochastic processes
If the time series has time constant mean, time constant variance and the
covariance between two observations depends just on the distance between
the time points:
E(Xt ) = µ; ∀t (1.1)
E(Xt − µ)2 = σ 2 < ∞; ∀t (1.2)
E[(Xs − µ)(Xt − µ)] = C(s − t); ∀s, t (1.3)
than the time series is called covariance stationary.
The most known and the so called ”basic models” of time series analyses
are white noise and random walk. Stochastic process is called a white noise
when it has zero mean and constant variance, so it can be written:
E(Xt ) = 0; ∀t (1.4)
E(Xt2 − µ)2 = σ 2 < ∞; ∀t (1.5)
E(Xs Xt ) = 0; ∀t 6= s (1.6)
Further, the process is called random walk, when the series of its incre-
ments (first differences) are white noise:
Xt − Xt−1 = εt (1.7)
E(εt ) = 0; E(ε2t ) = σ 2 ; E(εs εt ) = 0, s 6= t (1.8)
Many econometric and financial time series show similar pattern as ran-
dom walk processes like share prices, interest rates, exchange rates. Relating
to the time path of the process is often compared with a path followed by a
”drunken seaman”2 .
2
Dixon, R. (2004)1.2 Integrated processes and tests for Unit Root 5
1.1.2 Autoregressive and moving average processes
The most frequently used and probably the most relevant class of time series
models are autoregressive processes. The general p-th order autoregression
process, AR(p) is expressed as follows:
Xt = φ1 Xt−1 + φ2 Xt−2 + ... + φp Xt−p + εt (1.9)
where εt is a while noise and φ1 , ..., φp are fixed parameters.
Another popular class of time series models is moving-average processes,
MA(q). This process is a weighted sum of white noise processes, which are
always stationary:
Xt = εt + θ1 εt−1 +, ..., +θq εt−q (1.10)
1.2 Integrated processes and tests for Unit
Root
The time series is said to be integrated of order d (denoted by I(d)), if it
becomes stationary after differencing d -times. It follows that the random
walk process is I(1).
If the time series are stationary, for estimating coefficients we can use
standard methods like ordinary least squares. If all time series are integrated
of the same order, the standard methods (e.g. OLS) could be misleading.
On the other hand, if the series are not integrated of the same order, there
could occur the so called ”spurious regression”, which was firstly described
by Granger and Newbold (1974). Equations estimated by standard methods
could show statistically significant realationships with R2 close to 1. However,
in most cases, Durbin-Watson test indicates autocorrelation of the residuals.
If the series are integrated of the same order and there is also a coin-
tegration relationship between them, the parameters can be estimated by
vector autoregression model or vector error correction model. Therefore, it
was important to establish simple statistical test for determining the order1.2 Integrated processes and tests for Unit Root 6
of integration3 and the cointegration realationship.
1.2.1 Dickey-Fuller test for Unit Root
The most widely used statistical test for testing order of integration is Dickey-
Fuller test4 and the later version Augmented Dickey-Fuller test.
The processes can be classified by characteristic polynomials, which are
made as follows:
• From an underlying process one should remove all deterministic terms
such as trends or constants.
• The primary process should be formed to autoregressive (difference-
equation) process, which mainly consists of lagged variables and only
a contemporaneous noise, which should be replaced by 0.
• All lags Xt−j should be replaced by z j , therefore Xt by 1 = z 0 (Xt−j =Z j ).
We call the solutions of characteristic polynomial equation as roots and the
processes can be classified by these roots:
• If all roots of characteristic polynomial is greater than 1, the process is
stationary.
• If one root is around 1, the variable may be I(1).
• If at least 1 root is less than 1, we talk about explosive process.
This feature has been used by Dickey and Fuller for their well-known test, a
”milestone” in integration testing. The test is built as follows:
1. The lag order is increased, until the residual is close to white noise. This
is tested by one of these criteria: Ljung-Box statistics, LM statistics,
likelihood-ratio statistic or by information criteria.
3
Very effective concept is visual examination of the processes. This is based on exami-
nation of the time constancy of the mean and the variance. If the process is stationary, it
fluctuates around a constant mean and the variance is finite constant.
4
Based on assumption, that the process is AR(1)1.3 Cointegration 7
2. Second step is to estimate the regression by OLS5 :
p−1
X
∆Xt = a[+bt] + φXt−1 + φj ∆Xt−j + εt (1.11)
j=1
By transforming this regression to characteristic polynomial form we
get:
Φ(z) = (1 − z)(1 − φ1 z−, ..., −φp−1 z p−1 ) − φz (1.12)
The Null-hypothesis is that Φ(z) has a unit root, therefore φ must
equal to zero. If null-hypothesis is rejected, the examined time series
is stationary.
3. In third step, the t-statistics of φ is calculated, the distribution of which
differs from usual t-distribution and was made specially for this test by
Dickey and Fuller.
1.2.2 Alternative approaches for testing Unit Root
Although this test is the most popular one, there are some other alterna-
tive approaches. Phillis and Perron (1988) formed a new test based on the
basic version of Dickey-Fuller test. Instead of lagged differences they used
more general non-parametric correction term. Another very often used unit
root test is Kwiatowski-Phillips-Schmidt-Shin (KPSS) which is based on dif-
ferencing of the data and therefore, controversial to the Dickey-Fuller test.
Here, the null hypothesis is stationarity and the alternative hypothesis is
integratedness.
1.3 Cointegration
If two series are integrated to different order, intuitively one can say that
linear combination of these series will be integrated to the higher of the
5
The basic version of the test estimates regression: ∆Xt = a[+bt] + φXt+1 , while the
augmented one is expanded by lagged differentials.1.3 Cointegration 8
two orders. Engle&Granger considered two first order integrated processes,
the linear combination of which was stationary. As a generalized case, they
introduced the term cointegration for n-vector variable xt :
The components of the n-vector variable xt are said to be cointegrated of
order (d,b) denoted by I(d,b) iff a) all components of xt are I(d), b) there
exits a vector β 6= 0 such that zt = β 0 xt is I(d − b) where β is called a
cointegrating vector.
There can exist n-1 linearly independent cointegrating vectors (n is a
number of variables), which define the cointegrating rank of the system.
Cointegration between variables indicates a long-run relationship between
variables. It also determines a short-run relationship between variables and
its long-run trend, which is called the error correction. Intuitively one can
suggest that from cointegration of order I(d,d) (hence the aggregated series
is stationary) some information has to be missed out. This can be illustrated
by the following example, where we consider two I(1) variables:
y1,t = α + βt + ε1,t (1.13)
y2,t = γ + δt + ε2,t (1.14)
where ε1,t and ε2,t are white noise processes.
A linear combination zt = y1,t + θy2,t = (α + θγ) + (β + θδ)t + ε1,t + ε2,t will
be evidently stationary if the common linear trend is removed. Therefore the
cointegration will occur if the trend in one variable is a linear combination
of the trends in cointegration equation.
1.3.1 Vector error correction (VEC)
Cointegration describes the long-run equilibrium of given variables. There
exists a mechanism called error correction, which describes the speed of ad-
justment of the variable to return to the equilibrium when a shock occurs
in the evolution of the variable. Let us assume that the vector of variable
Xt contains only I(1) variables, than it can be written in the following error1.3 Cointegration 9
correction form:
p−1
X
∆Xt = µ + πXt−1 + πj ∆Xt−j + εt (1.15)
j=1
where µ is a vector of constants, πi ’s give the measure of the influence of
first differenced lags of the variable, describing short-run variation. For
economists the most important item is matrix π, which defines the long-run
relationship between the variables. The rank of the matrix π designates the
number of independent cointegrating vectors. Let us consider some special
cases:
1. rank(π) = 0: There is no cointegration relationship, so no long-run
equilibrium between variables.
2. rank(π) = 1: This case is the most special in practice, because indicates
only one cointegrating relationship.
3. rank(π) = n: The matrix π has full rank and indicates stationarity of
Xt .
It is very important that all variables were I(1). If there existed some I(0)
variables, then such a linear combination where all I(1)’s coefficients are
zeros and at least one I(0) has non-zero coefficient, would be stationary. For
determination of the number of cointegration relationships, it is essential that
the matrix π was estimated.
1.3.2 Testing cointegration
For determination of the number of cointegration relationships, there exist
two main approaches. Engle & Granger (1987) test the stationarity of equi-
librium errors of estimated equations. The Johansen method (1988) is more
widespread and comes out from VAR:
Yt = φ1 Yt−1 + φ2 Yt−2 +, ..., +φp Yt−p + εt (1.16)1.3 Cointegration 10
where Y is a vector of variables and φj ; j = 1, ..., p are matrices of dimension
n × n assuming n is the dimension of Yt . Furthermore, let Zt denote the
vector of (n × p − 1) variables:
Zt = (∆Yt−1 , ∆Yt−2 , ..., ∆Yt−p+1 )
and let denote D, E matrices of least squares residuals in the regression
of ∆Yt on Zt and Yt−p on Zt respectively. Then canonical correlations are
computed between columns in D and those in E. Canonical correlations give
the strength of the linear relationship of two vectors6 . Squared canonical
correlation is defined as ordered eigenvalues λ1 ≥ λ2 ≥ ... ≥ λr ≥ ... ≥ λn of
the matrix
−1 −1 −1
R∗ = RDD
2
RDE REE RED RDD
2
(1.17)
where Ri,j is the correlation matrix between variables in set i and set j for
i, j = D, E. Using trace statistics, the following null hypothesis is tested:
there are r or fewer cointegrating vectors in the system. That is, the following
statistics is calculated:
n
X
J(r) = −T log(1 − λ2j ) (1.18)
j=r+1
If J(r) does not imply rejection, there are r or less than r cointegration re-
lationships.
According to Granger theorem, we can decompose the n × n matrix π
into two n × r matrices α and β of rank r :
0
π = αβ (1.19)
The columns of the matrix β constitute the cointegrating vector, so the long-
term equilibrium and the matrix α gives the speed of adjustment of the
variables to the equilibrium.
6
Green(2000), p. 7961.3 Cointegration 11
1.3.3 The econometric decomposition - Gonzalo and
Granger
Let us consider a vector of variables Xt with one cointegration vector (Xt is
a n × 1 matrix and the matrix π is of rank 1). We can define the orthogonal
comlements α⊥ and β⊥ as complements of α and β respectively (α and β are
the matrices of the Granger decomposition of the matrix π):
0 0
α⊥ = (I − α(α α)−1 α ) (1.20)
0 0
β⊥ = (I − β(β β)−1 β ) (1.21)
0 0
It holds that α⊥ α = β⊥ β = 0. Furthermore, it can be written:
0 0 0 0
Xt = β⊥ (α⊥ β⊥ )−1 α⊥ Xt + α(β α)−1 β Xt (1.22)
Gonzalo and Granger denominated the first component of equation (1.22),
0 0 0 0
Pt = β⊥ (α⊥ β⊥ )−1 α⊥ Xt as permanent and the second, Tt = α(β α)−1 β Xt as
transitory component and showed that the transitory component has no effect
on permanent (long-term) component.Chapter 2
The Econometric Model
”When thinking about the meaning of equilibrium it quickly becomes apparent
that it is a difficult concept to pin down. ... The debate over what constitutes
equilibrium has ranged over issues as diverse as its existence, uniqueness,
optimality, determination, evolution over time and indeed whether it is even
valid to talk about disequilibrium. All of these points are important, as is
the question of whether the concept of equilibrium can be separated from the
models which are used to measure it.”
Rebecca L. Driver and Peter F. Westaway
2.1 Nominal and real exchange rate
The nominal exchange rate between two currencies specifies how much one
currency is worth in terms of the other. It can be given by two ways:
1. American - home currency per unit of foreign currency
2. English - foreign currency per unit of home currency
Throughout the paper the nominal exchange rate will be given by the English
definition, so increase of nominal exchange rate indicates appreciation and
oppositely decrease indicates depreciation:
#unit of f oreign currency
S= (2.1)
1 SKK2.1 Nominal and real exchange rate 13
Appreciation of home currency means that home products get more expen-
sive abroad and foreign products cheaper in home country. Accordingly, if
there are lot of foreign products in consumption basket, appreciation of home
currency is favourable for consumer. On the contrary, disadvantage is that
home products loose their competitiveness, so the appreciation has a negative
impact on trade balance1 . In literature we can find numerous definitions of
the real exchange rate. According to Égert, Halpern and MacDonald (2004),
internal exchange rate is the price ratio of non-tradables to tradables2 :
P NT
I
Q = T (2.2)
P
where P N T , P T is the price level in non-tradable and tradable sector respec-
tively.
According to the macroeconomic definition, real exchange rate or external
real exchange rate is the nominal exchange rate multiplied by the ratio of
domestic and foreign price levels:
q = s + p − p∗ (2.3)
where s is the logarithm of nominal exchange rate, p and p∗ represent the
logarithms of the relative price of domestic and foreign consumption basket
respectively3 .
1
This is the consequence of Marshall-Lerner condition, which tells us that the sum of
price elasticity of exports and imports exceeds one (in absolute value).
2
Tradable goods are those that have export or import potential. As a consequence
of different transportation costs or life expectancy, there are some goods, which are non-
tradable. These are mainly electricity and water (very high transport cost). Services are
considered as non-tradables.
3
Throughout the paper, lower case will denote natural logarithms transformation of
the variables.2.2 The real effective exchange rate 14
2.2 The real effective exchange rate
Nominal effective exchange rate (NEER) is a geometrically weighted average
of bilateral nominal exchange rates, where the weights are mostly given in
terms of the volume of bilateral trade:
n
Y
ef
S = (Si )wi (2.4)
i=1
n
X
ef
s = wi si (2.5)
i=1
where Si is the bilateral nominal exchange rate of home country to country i,
n is the number of foreign countries to which the NEER is calculated. Fur-
ther, wi is the proportionally calculated weight, based on the ratio of foreign
trade between trading partner i and home country to the total amonunt of
home country’s foreign trade. Equation (2.5) is the logarithmic transforma-
tion of (2.4).
The real effective exchange rate differs from the NEER by the fact, that
the ratio of the home price level and the geometrically weighted average of
foreign price levels are included:
P P
Qef = S ef = S ef
Q n ∗ wi
(2.6)
P∗ i=1 (Pi )
where S ef is the NEER, P is the price level in home country, Pi∗ is the price
level in country i and wi is the weight of country i (the same used in NEER).
There exist several ways how to measure the country’s price level. Consumer
price index (CPI) and producer price index (PPI) are ranked among the
most widely known indexes. However, in literature the wholesale price index
(WPI) and the unit labour costs (ULC) are also mentioned as a good proxies
for price measure.2.3 Equilibrium exchange rate modelling 15
2.3 Equilibrium exchange rate modelling
There exist several methods for modelling equilibrium exchange rate. Each
method is a normative concept, which defines the equilibrium exchange rate
in different way. Other viewpoint is the time horizon of the equilibrium
exchange rate. We can distinguish short-term, medium-term and log-term
equilibrium. The resulting misaligned exchange rate is not the consequence
of the ”inactive” market forces, but rather suggests the future development
of the exchange rate.
2.3.1 Purchasing power parity (PPP)
The first and maybe the mostly criticised method is purchasing power parity4 ,
which supposes that the Law of one price5 holds. As a result, the nominal
exchange rate is defined as a ratio of home and foreign prices. This definition
indicates a constant real exchange rate and ensures that goods cost the same
in all countries. This theory defines the equilibrium in very long-term. The
main criticisms of PPP are:
1. The weights of the goods in consumption basket are not the same across
countries - there are cultural differences.
2. There are differences in quality of goods - different technological equip-
ment used.
3. There exist non-tradable goods in consumption basket - mainly ser-
vices.
The observable phenomenon is that in less developed countries, so as in
transition countries, non-tradable goods are cheaper, than in more devel-
oped countries. This implies the failure of the PPP theory6 . The failure
4
Cassel (1916 and 1918)
5
Is an economic rule stating that in an efficient market, all identical goods must have
only one price.
6
This is a direct consequence of Balassa-Samuelson effect stated below.2.3 Equilibrium exchange rate modelling 16
of PPP led to new approaches in measuring equlibrium exchange rate. The
most commonly used are Fundamental equlibrium exchange rate (FEER),
Behavioral equilibrium exchange rate (BEER) and Permanent equilibrium
exchange rate (PEER).
2.3.2 Fundamental equilibrium exchange rate (FEER)
The notion of FEER has been formalized in papers issued by Williamson
(1985, 1994). This approach defines the equilibrium exchange rate in medium-
term, adjusting the country’s internal and external balance to equilibrium
simultaneously.
Internal balance is defined as a stage when GDP equals to potential GDP7 ,
so it is consistent with the NAIRU8 . There are several ways to determinate
the output gap. The simplest-statistical-method is the Hodrick-Prescott fil-
ter, which decomposes historical GDP into trend and cyclical component.
There exist a couple of approaches different from ststistical filters, based on
economic theory.
The external balance is interpreted as a normative stage, a sustainable
position over a medium-term of current account. There is no general ap-
proach to compute the sustainable position of current account. It is usually
modeled by export and import equations.
Another less frequently used method for estimating equilibrium exchange
rate is Natural real exchange rate9 (NATREX), evolved from FEER. This
approach comes out from internal-external balance achieved similarly as in
FEER, but the equilibrium is given in medium- and long-term. The differ-
ence between NATREX and FEER is in external balance, where the current
account is modeled as a difference between savings and investments.
7
Implying zero output gap
8
NAIRU - non-accelerating inflation rate of unemloyment
9
developed by Stein (1994, 1995, 2002)2.3 Equilibrium exchange rate modelling 17
2.3.3 Behavioral equilibrium exchange rate (BEER)
This approach is free of any normative elements of theoretical background.
The equilibrium exchange rate is described by economical fundamentals, in-
fluencing the exchange rate in long- and medium-term. Hence, this measure
is a statistical approach, linking the real exchange rate and the fundaments
in a single equation. Clark and MacDonald (1999) started from equation of
uncovered interest parity which relates interest rates and exchange rates in
home and foreign country:
set,t+k − st = −(it − i∗t ) + σt (2.7)
where st is the logarithm of nominal exchange rate, it and i∗t is the domestic
and foreign nominal interest rate in respectively, σt is the risk premium of
the country and set,t+k is the expected nominal exchange rate in time t for
the period t + k. If we include home and foreign expected inflation rate, the
equation changes to:
e
qt = qt,t+k − (r − r∗ ) + σt (2.8)
e
where qt is the real exchange rate, qt,t+k is the expected real exchange rate
in time t for the period t + k. The variable r and r∗ represent the domestic
and foreign real interest rate which is the difference between nominal interest
rate and the expected inflation in t for t + k.
e
r = i − πt+k (2.9)
For the expectation of real exchange rate in t for t + k we can assume,
that it is equal to long term real exchange rate, which can be interpreted by
economic fundamentals:
qt = β(f und)0t − (rt − rt∗ ); (2.10)
β = (β1 , ..., βn ); (f und)t = (f und1 , ..., f undn )
This equation indicates that the real exchange rate is a function of the
long- and medium-term fundamentals:
qt = qt (lt , mt ) (2.11)2.4 Which fundamentals use for modelling? 18
2.3.4 Permanent equilibrium exchange rate (PEER)
Permanent equilibrium exchange rate can be obtained by decomposing the
real exchange rate into permanent qtp and transitory qtT components. The
permanent component is than defined as the equilibrium.
qt = qtP + qtT (2.12)
Clark and MacDonald (2000) described the PEER as a decomposition of
BEER using Gonzalo-Granger method. This method ensures smoother equi-
librium exchange rate than BEER, and is better interpretable.
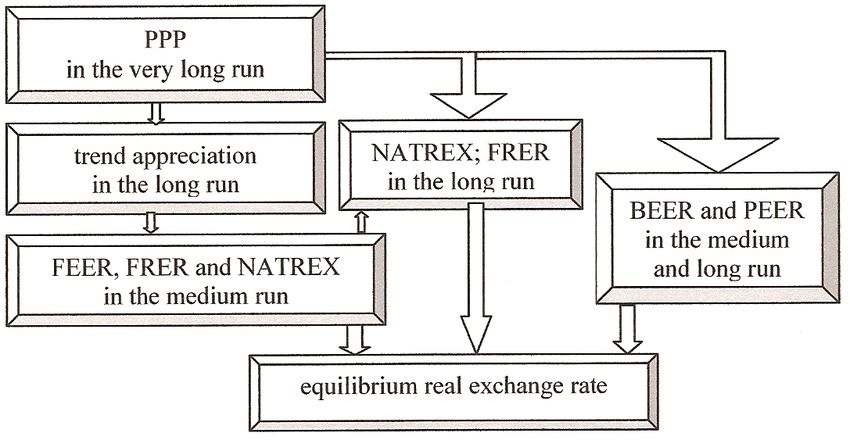
Finally, the following chart provides a birds-eye view summary of particular
methods’ time-dependent effectiveness.
Source: Égert, Halpern and MacDonald(2004).
Figure 2.1: The comparison of different methods.
2.4 Which fundamentals use for modelling?
We can distinguish two kinds of products - tradable (T) and non-tradable
(NT). The home and foreign prices can be than decomposed as follows:
p = αpT + (1 − α)N T ; p∗ = α∗ pT ∗ (1 − α)pN T ∗ (2.13)2.4 Which fundamentals use for modelling? 19
where pT and pN T are the prices of tradable and non-tradable goods respec-
tively and α and 1 − α are their weights in consumption basket10 . Following
Alberola and Tyvainen (1998) who measured these weights for EMU coun-
tries, we can suppose that α equals to α∗ . Using equation (2.3) and (2.13),
the real exchange rate can be split into two main components - real exchange
rate for tradable goods qX and the relative price of non-tradable to tradable
goods across countries qI :
q = qX + (1 − α)qI (2.14)
where equation qX = s + pT − pT ∗ , called external prices equation, contains
price ratio of home and foreign tradable goods and represents how much the
price of home tradable goods is worth in terms of foreign tradable prices.
Hence, qX represents the competitiveness of the economy and affects the
balance of payments of the country. The second component of equation
(2.14), qI = [(pN T − pT ) − (pN T ∗ − pT ∗ )] is called the equation of internal
relative prices, which captures the excess demand across sectors. Obviously,
equation (2.14) implies that the external and internal prices determine the
equilibrium exchange rate.
2.4.1 External balance
Nurske (1944) and Mussa (1984) argue that foreign asset position of the
country has a large effect on equilibrium exchange rate in the long-run. The
divergence from equilibrium is adjusted by current account11 , which on the
other hand leads to accumulation of net foreign assets (NFA). The change of
net foreign assets it can be written as:
∆nf a = ca = xn + (i∗ − g)nf a (2.15)
10
The variables with asterisk refer to foreign country.
11
Current account together with capital account, financial account and change in official
reserves create balance of payments. Current account is defined as a sum of balance of
trade (the difference between export and import of goods and services), balance of income
(e.g. dividends) and current transfers (e.g. EU-funds).2.4 Which fundamentals use for modelling? 20
where nfa is net foreign assets, ca is current account balance and xn is the
trade balance, all expressed relative to GDP. The variable g is the real GDP
growth and i∗ is the international interest rate.
The country’s export and import is the same as trading partners’s import
and export respectively, therefore the trade balance is the same in absolute
value but differs only in sign. The same can be written for the net income,
therefore the home country’s current account balance position is the same as
its tradeing partners’ but with the opposite sign:
ca = −ca∗ = xn + i∗ f (2.16)
Let us assume that the above-mentioned Marshall-Lerner condition holds,
therefore, the change in relative prices (real exchange rate) negatively influ-
ences the trade balance:
xn = −γQx ; γ > 0 (2.17)
The external balance in medium-term is characterized by convergence of
net foreign assets towards their optimal (desired) level:
∆nf a = a(nf a − nf a) (2.18)
The equilibrium level of NFA is given exogenously and is defined mainly
by savings, demographics and the stage of development. If the country’s net
foreign assets position is below its equilibrium value, the country will starting
to accumulate assest. On the other hand, if it is above the equilibrium, the
country will reduce the assets. Using equations (2.15), (2.17), (2.18), Qx can
be expressed as follows:
a i∗ − g
Qx = (nf a − nf a) + nf a (2.19)
γ γ
According to equation (2.19), the current stock of net foreign assets positively
influences the exchange rate. This means that if the amount of assets (debt)
accumulates, the exchange rate will appreciate (depreciate).2.4 Which fundamentals use for modelling? 21
2.4.2 Internal Balance - The Balassa-Samuelson effect
The recently known Balassa-Samuelson effect has been firstly formalized by
Roy Forbes Harrold in 1939. Bela Balassa and Paul Samuelson have sepa-
rately completed and extended this theory12 , and issued in 1964. They come
out from two main observations:
1. Consumer prices in wealthier countries are higher than in poorer coun-
tries - this is the consequence of Penn effect13 .
2. The productivity growth rate in tradable sector is higher than in non-
tradable sector - there are new technical processes and the competition
between tradable goods is higher than between non-tradable goods.
The B-S effect is based on 3 assumptions. The first one says that the
economy is divisible into two sectors, open sector (contains tradable goods)
and sheltered sector (contains non-tradable goods). The second condition is
that the wages depend on productivity in both sectors. In open sector, rising
productivity boosts the output and hence the company’s benefits. After
all, this will be reflected in higher wages, because the company can afford
to pay bonuses or pay higher salaries. The third assumption is the perfect
mobility of labour between sectors, which has a consequence that nominal
wages equalize between sectors. Let us assume that the production function
is defined by Cobb-Douglas definition, so the production is a function of
labour (L) and capital (C) in a following way:
YN T = AN T LδN T CN1−δ θ 1−θ
T ; YT = AT LT CT (2.20)
where A is a trend component of total factor productivity interpreted also as
technological progress, δ and θ are the elasticity of labour in non-tradable and
tradable sectors respectively. According to the second and third condition,
12
Hence the phenomenon is sometimes called as Harold-Balassa-Samuelson effect.
13
The Penn effect tells that the real income ratios between high and low income countries
are systematically exaggerated by GDP conversion at market exchange rates2.5 Gonzalo and Granger decomposition 22
wages equal to marginal product and these wages equalize in tradable and
non-tradable sector. It can be written:
δYN T W δYT W
= ; = (2.21)
δLN T PN T δLT PT
Using equations (2.20) and (2.21):
PN T θ LYT θP ROT
= YNTT = (2.22)
PT δ LN T δP RON T
where P ROT and P RON T denote the productivity in tradable and non-
tradable sector respectively. As a result, it follows from Balassa-Samuelson
effect that higher productivity growth in open sector causes increase in prices
in sheltered sector. By substituting equation (2.22) into internal price equa-
tion (second term of equation (2.14)) and according to third assumption we
can write:
QI = [(pN − pT ) − (p∗N − p∗T )] = (proT − proN ) − (pro∗T − pro∗N ) = (pro − pro∗ )
(2.23)
Therefore, if the home country has larger productivity growth than for-
eign countries, this will positively influences home country’s real exchange
rate and negatively the inflation.
2.5 Gonzalo and Granger decomposition
The decomposition of the observed real exchange rate into two components
is based on the cointegrating information contained in the data. The first
component presents the equilibrium exchange rate (the fundamentals are at
their equilibrium level) and the second component expresses the deviations
from this equilibrium. In our work we follow Gonzalo and Granger (1995)
decomposition into permanent and transitory components. The permanent
component characterizes the long-run equilibrium expressed by cointegration
relationship. This component is I(1). On the other hand, transitory com-
ponent is stationary and demonstrates the deviation from the permanent2.5 Gonzalo and Granger decomposition 23 component. Therefore, the deviation has no effect on the permanent com- ponent. In previous section we have described the econometric methodology of the Gonzalo and Granger decomposition. Relating to this description, the first and the second component of equation (1.22) denote the permanent and the transitory component respectively.
Chapter 3

Data Sources and the
Construction of Time Series

”The high external disequilibria accumulated by the new EU members coupled
with the appreciation trend of their currencies questions the sustainability of
such situation before and after the euro is adopted. Indeed, large net net
capital inflows and persistent current account deficit have been observed in
most transition countries as they increased their income levels in the last
decade.”

                                                             Enrique Alberola

   The purpose of this paper is to derive an effective real exchange rate using
BEER approach described in previous chapter. There are two main method-
ological questions: the price measure and the structure of weights, which
have to be determined for calculating real exchange rate. In our analysis,
we use consumer price index (CPI) and producer price index (PPI) as price
measures. The real exchange rate expressed in different price measures show
different evolution.
3.1 Volume of bilateral trade 25
3.1 Volume of bilateral trade
In the process of generating time series as nominal and real exchange rate
and productivity differential, the weights of foreign countries are determined
by bilateral trade between Slovakia and its trading partners.
Source: SOSR, 1997-2003 average.
Figure 3.1: The percentage of Slovak trade volume with its main trading
partners.
42,83 percent of trade balance consist of two countries, Germany and
Czech Republic (see Figure 3.1). In order to distinct between different levels
of detail of the analysis, consider two scenarios 1 :
1. In basic scenario, the two main trading partners, Germany and Czech
Republic are encompassed only.
2. The extended scenario involves 9 trading partners: Germany, Czech
Republic, Italy, Austria, France, the Netherlands, Great Britain, USA
and Switzerland. Including 9 countries instead of 2 seemingly provides
more accurate measure of the effective exchange rate. On the other
hand, the weights of Germany and Czech Republic constitutes almost
two thirds of all 9 countries total weight. Therefore, we can expect
1
The transformations of trade volume weight coefficients for both scenarios are pre-
sented in Appendix A.3.1 Volume of bilateral trade 26
similar real effective exchange rate and its equilibrium level to those in
the basic scenario.
The Slovak trade has undergone several changes throughout 1997 and
2003. The trade volume with two main trading partners changed in time
significantly, but in contrary, the trade volume with other trading partners
shows a smooth evolution.
Source: SOSR.
Figure 3.2: The evolution of the trade of goods with Czech Republic and
Germany relative to total trade of Slovak Republic (in %).
The bilateral trade volume with Czech Republic relative to Slovakia’s
total trade volume decreased gradually in time period 1997-2003 by 9.6 per-
centage points from 23.2% to 13.6%. The progress of trade volume between
Slovakia and Germany relative to the total trade volume of Slovakia changed
over time as well. It grew about 5.6 percentage points in 1997, but after this
period it mildly decreased until the end of 2001. In 2002, the trade volume
increased again, by 3.92%. Overall, the trade volume of Slovakia with Ger-
many increased by 6.6 p.p. over the period 1997-2003. This probably relates
to increasing FDI inflow and boosting automobile industry in Slovakia.3.2 The real effective exchange rate in Slovakia 27
Data for creation of real effective exchange rate time series and funda-
ments were obtained from IMF IFS and EUROSTAT database. Since data
availability, for the extended scenario, quarterly data covering the period
from the first quarter of 1993 to the second quarter of 2006 (54 observations)
are used. The time period for the basic scenario is longer, covering the period
1993:1 - 2006:4 (56 observations).
3.2 The real effective exchange rate in Slo-
vakia
In chapter 2 we have mentioned the definition of the real effective exchange
rate. According to the definition of nominal and real effective exchange
rate (equations (2.4) and (2.6)), for generation of time series we specify the
following form:
n
Y P SR
QE
t = (Si,t )wi Qn t ∗ wi (3.1)
i=1 i=1 (Pi,t )
where Si,t is the nominal bilateral exchange rate with country i, P SR is price
∗
level in Slovakia in time t, Pi,t is the price level in foreign country i in time
t. Further, wi is the weight coefficient of country i, computed on the basis of
bilateral trade volume, n is the number of countries (n = 2 in basic scenario
(BS) and n = 9 in extended scenario (ES)). For modelling purposes we
transform this variable into a natural logarithmic form: qtE = ln(QE
t ).
Figure 3.3 illustrates the real effective exchange rate for both scenarios.
On the left chart, the CPI based RER for the extended model is depicted,
and the right chart shows the CPI and PPI based RER for the basic scenario.
The shape of all curves are similar, displaying appreciation trend over the
time period.
All the RER indexes show a calm development in first years. Let us
consider the basic scenario’s CPI based RER index. It started to strongly3.2 The real effective exchange rate in Slovakia 28
Source: IMF IFS, EUROSTAT.
Figure 3.3: The CPI and PPI based real exchange rate.
appreciate at the beginning of 1997. To the end of the year 1997 it appreci-
ated about 15.3% compared to starting value in 1993, but after depreciating
a year, it almost came back to 93’s level. As of the beginning of 1999, the
RER started to strongly appreciate and in the middle of 2000, it reached 23%
above the 93’s level. In the next two and half years period, the RER stabilized
and fluctuated around this value with small deviations. From mid-2002, the
RER strongly appreciates thanks mainly to the nominal exchange rate appre-
ciation. By end 2006, the CPI-based RER has been 62.4% stronger and the
PPI-based RER 42.6% stronger, than the 93’ value. The CPI based RER for
extended scenario shows the biggest appreciation. The index reached 67.1%
in second quarter of 2006.
Until end-2002, the bilaterial nominal exchange rates depreciated with
respect to all other currencies2 . However, from 2003 it started to strongly
appreciate, therefore the nominal effective exchange rate showes a similar
development. This means that until the end of 2002, the appreciation of
RER passed through the inflation differential. That is, the prices in Slovakia
must have grown faster than prices in its trading partners. Indeed, CPI index
2
See appendix A.3.3 The dual productivity differential 29
in Slovakia grew about 173% and the PPI index 120%, while the weighted
average of trading partners’s CPI and PPI indexes grew just by 48% and 36%
respectively. This implies that the inflation differential played a crucial role in
RER appreciation in period before 2002. After 2002, the RER appreciated
more robustly, although due to appreciation of nominal effective exchange
rate (Figure 3.4).
Source: IMF IFS.
Figure 3.4: The nominal effective exchange rate for basic and extended sce-
nario.
3.3 The dual productivity differential
Relative productivity is computed as a ratio of labour productivity in Slo-
vakia relative to geometrically weighted foreign labour productivity. Labour
productivity is definied as a ratio of GDP to the total employment.
GDPtsr
Labour productivityi EM Ptsr
P ROt = Qn wi
= ∗
GDPi,t
(3.2)
i (Labour productivityi,t )
Q n wi
i=1 ( EM P ∗ ) i,t
where GDP is the index of gross domestic product in constant prices and
EMP is the index of employment. Further, SR and the asterisk denote the
home country and foreign countries respectively. Again, in the models we
use the natural logarithm of this variable: prot = ln(P ROt ).3.3 The dual productivity differential 30
Source: IMF IFS, EUROSTAT.
Figure 3.5: Dual productivity differential for both scenarios.
According to Balassa-Samuelson effect, the productivity differential has
positive effect to the RER. In the examined time period, the productivity
differential increased by 28.3% and 34,3% in basic and extended scenario
respectively. For both scenarios, the main increase has been attained in the
first 5 years of the whole time span, so in 1993-1998. In this time period the
series do not show seasonality, but after 1997 the seasonality is significant.
Due to unsustainable economic growth before 1999 and a consecutive need
for structural changes, the dual productivity differential decreased signifi-
cantly in 2000 and started gaining repeatedly together with the beginning of
economic sanitation (Figure 3.5).
From Taylor’s expansion, the percentage change of productivity differ-
ential (in time) equals the intertemporal difference of its natural logarithm.
Therefore, we should become aware what is behind the percentual change of
the productivity differential.
Productivity differential is nothing else than the ratio of GDP and num-
ber of employed (or hours worked). We can analyze the whole influence3.4 Net foreign assets 31
of the growth of these variables in Slovakia and in its trading partners to
the productivity differential. Consider the percentage change of GDP and
employment in one time period (t → t + 1) individually:
Let gSR and gi∗ denote the real GDP growth rate in Slovakia and its
trading partner i respectively. Further, let eSR and e∗i denote employment
growth in Slovakia and its trading partner i respectively.
Then the expected percentual change of variable PRO:
1+g SR
P ROt+1 −P ROt SR
%∆P RO = P ROt
= Qn
1+e
1+g ∗
w
i −1
i
i=1 1+e∗
i
3.4 Net foreign assets
The influence of the fundament net foreign assets to real exchange rate is
questionable for different economies. For transition countries like the Slo-
vakia, inflow of the foreign direct investments (FDI) is necessary to strength
their economic situation. The higher growth potential is financed by the
”inflowing foreign money”, accumulating foreign liabilities, so positively in-
fluencing the real exchange rate (leading to appreciation of RER) in the
medium run. On the other hand in the long-run, the current account deficit,
which occurs when the country starts paying factor payments on previous
FDI, would lead to depreciation of the real exchange rate.
Empirical results showed that in transition economies the NFA have posi-
tive link to the real exchange rate. In contrast, in emerging market economies,
NFA influence RER negatively. Égert, Revil and Lommatzsch (2004) showed
the same in their analysis. Though, Alberola (2005) comes to different con-
clusions for transition countries. In his paper, NFA positively influence the
real exchange rate in case of Hungary and Poland, but negatively for Czeech
Republic.
In literature we can find many different concepts for modelling NFA.
Mostly it is proxied by net foreign assets of the banking sector or by the
cumulated current account balance. Égert and Babetskii (2005) used these
two approximations and productivity differential for estimating BEER for3.4 Net foreign assets 32
the Czech Republic. There are large FDI inflows in the background of the
overall net foreign assets decrease, which mainly reflect the interventions of
national banks. Therefore, in our work we decided to use two proxies of NFA:
are cumulative sum of current account deficit (CUCA) and cumulative sum
of net foreign direct investments (CUFDI)3 . Both proxies are set to a zero
level at the beginning of the sample and normalized by GDP in constant
prices:
t
X caj
CU CA = (3.3)
j=1
GDPj
t
X f dij
CU F DI = (3.4)
j=1
GDPj
where caj is current account balance in time j in millions of euro, f dij is net
foreign direct investments in millions of euro and GDPj is the index of GDP
in constant prices in time j.
Source: IMF IFS, EUROSTAT.
Figure 3.6: The two proxies of net foreign assets.
The right chart of the Figure (3.6) shows that the development of net
3
Alberola (2002, 2005) uses both cumulative sum of current accout and foreign direct
investment inflow relative to GDP.3.4 Net foreign assets 33
foreign direct investments was very calm until 2000. This means that the
investments inflow was just a little bit higher than the investments outflow.
Following structural reforms in Slovakia, a huge inflow of foreign direct in-
vestments started in 2000, apparently supporting the economy. The most
important FDI inflows were the automobile factories, naturally ”pulling”
suppliers for automotive and metal industry. These companies play a crucial
role in current economic growth.
These variables were not transformed into logarithm, hence we are focus-
ing on the absolute change of the variable:
Pt cai
Pt−1 cai cat
∆CU CA = CU CAt − CU CAt−1 = i=1 GDPi − i=1 GDPi = GDPt
We can see that the absolute change of the variable CUCA depends only
on net current account balance and GDP in time t. Let us examine the
percentage change of two consecutive period’s absloute changes if the net
current account balance increase by c % and the GDP by g%:
cat cat−1
− GDP
GDPt t−1 c−g
%|CA| = cat−1 = 1+g
GDPt−1
∆CU F DI and %|F DI| is calculated similarly.Chapter 4
Estimation Results
”The future behaviour of nominal and real exchange rates in new EU members
is an issue of lively discussion. The election of the most suitable exchange
rate regime and monetary strategy in the run-up to EMU and the scope for
the persistence of inflation differentials within EMU have placed exchange
rates issues at the centre of the debate in recent times.”
Enrique Alberola
In this chapter, we present some selected relations between the real effec-
tive exchange rate and macroeconomic fundamentals described above. The
models are estimated by two different methods. The long-run relationships
estimated by Johansen cointegration method are denoted with a) and equa-
tions estimated by standard OLS method are denoted with b).
For Johansen’s method is indispensable that all time series were inte-
grated of the same order. Therefore, first we test stationarity of time series,
using Augmented Dickey-Fuller (ADF) test.
Tables 4.1 and 4.2 imply that all series are I(1) on 1% confidence level
(first differences are I(0)). A couple of models of the equilibrium exchange
rate have been estimated, using fundamentals or their seasonally adjusted
values, if the seasonal adjustment was necessary. Choosing the best model
among them is difficult, beacause of the short time span and inconsistency of35
Time series RER-bs (CPI) RER-bs (PPI) RER-es PRO-bs PRO-es CUCA CUFDI
t-statistic -0.7632 0.2 -0.7754 -1.753 -2.2335 0.956 1.75
probability 0.8211 0.97 0.817 0.71 0.461 0.3354 0.9996
Source: own calculations.
Table 4.1: ADF test results for time series in levels.
Time series RER-bs (CPI) RER-bs (PPI) RER-es PRO-bs PRO-es CUCA CUFDI
t-statistic -6.146 -5.8047 -6.53 -7.645 -7.3663 -3.364 -5.925
probability 0 0 0 0 0 0.0087 0
Source: own calculations.
Table 4.2: ADF test results for first differences of the time series.
the time series. Furthermore, the history of Slovak economy is characterized
by several structural changes, for example change in consumer preferencies.
While chosing the best model we have proceeded as follows:
1. The optimal number of lags was determined.
2. The cointegration equation was established.
3. The independence of the variables, the normality of the residuals (Jarque-
Bera statistics) and the autocorrelation of the residuals (LM statistics)
were tested.
4. The equations estimated by OLS have been compared with the equa-
tions using the same variables, estimated by Johansen method.
Another very important criterion is the sign and the value of the estimated
coefficients, which have to be consistent with economic theory. The results
of outperformed tests and of the estimations are presented in Appendix B.You can also read