Atlantic to Mediterranean Sea Level Difference Driven by Winds near Gibraltar Strait
←
→
Page content transcription
If your browser does not render page correctly, please read the page content below
FEBRUARY 2007 MENEMENLIS ET AL. 359
Atlantic to Mediterranean Sea Level Difference Driven by Winds near Gibraltar Strait
DIMITRIS MENEMENLIS, ICHIRO FUKUMORI, AND TONG LEE
Jet Propulsion Laboratory, California Institute of Technology, Pasadena, California
(Manuscript received 11 July 2005, in final form 17 May 2006)
ABSTRACT
Observations and numerical simulations show that winds near Gibraltar Strait cause an Atlantic Ocean
to Mediterranean Sea sea level difference of 20 cm peak to peak with a 3-cm standard deviation for periods
of days to years. Theoretical arguments and numerical experiments establish that this wind-driven sea level
difference is caused in part by storm surges due to alongshore winds near the North African coastline on
the Atlantic side of Gibraltar. The fraction of the Moroccan coastal current offshore of the 284-m isobath
is deflected across Gibraltar Strait, west of Camarinal Sill, resulting in a geostrophic surface pressure
gradient that contributes to a sea level difference at the stationary limit. The sea level difference is also
caused in part by the along-strait wind setup, with a contribution proportional to the along-strait wind stress
and to the length of Gibraltar Strait and adjoining regions and inversely proportional to its depth. In the
20–360-day band, average transfer coefficients between the Atlantic–Alboran sea level difference and
surface wind stress at 36°N, 6.5°W, estimated from barometrically corrected Ocean Topography Experi-
ment (TOPEX)/Poseidon data and NCEP–NCAR reanalysis data, are 0.10 ⫾ 0.04 m Pa⫺1 with 1 ⫾ 5-day
lag and 0.19 ⫾ 0.08 m Pa⫺1 with 5 ⫾ 4-day lag for the zonal and meridional wind stresses, respectively. This
transfer function is consistent with equivalent estimates derived from a 1992–2003 high-resolution barotro-
pic simulation forced by the NCEP–NCAR wind stress. The barotropic simulation explains 29% of the
observed Atlantic–Alboran sea level difference in the 20–360-day band. In turn, the Alboran and Medi-
terranean mean sea level time series are highly correlated, ⫽ 0.7 in the observations and ⫽ 0.8 in the
barotropic simulation, hence providing a pathway for winds near Gibraltar Strait to affect the mean sea level
of the entire Mediterranean.
1. Introduction wind forcing of 0.3 Sv (Sv ⬅ 106 m3 s⫺1), which is added
to a 0.5–0.6-Sv contribution from atmospheric pressure.
The sea level difference between the Atlantic Ocean
Fukumori et al. (2007) analyze altimetric sea level ob-
and the Mediterranean Sea has been attributed mostly
servations, from which tidal and atmospheric pressure
to the following: tides (e.g., Brandt et al. 2004), atmo-
signals have been removed, and identify a near-uniform
spheric pressure fluctuations (e.g., Tsimplis and Josey
basin-wide sea level fluctuation of the Mediterranean
2001), steric contributions (e.g., Cazenave et al. 2002),
Sea with periods ranging from days to years and with
and geostrophic or hydraulic controls within the Strait
amplitudes of up to 0.2 m peak to peak. They estimate
of Gibraltar (e.g., Ross and Garrett 2000). Some studies
that these fluctuations are caused by a net mass flux
(Fukumori et al. 2007; García-Lafuente et al. 2002a,b;
through the Strait of Gibraltar with a peak 10-day-
Garrett 1983), however, suggest that winds in the vicin-
averaged amplitude of 0.26 Sv, corresponding to a
ity of Gibraltar Strait may be a fifth major cause of
depth-averaged current of 0.08 m s⫺1 at the Camarinal
Atlantic to Mediterranean sea level difference. García- Sill. By comparison, Astraldi et al. (1999) report that
Lafuente et al. (2002a) describe a meteorological forc- tidal currents within the strait have velocities higher
ing event that interrupts inflow in the Strait of Gibral- than 2.5 m s⫺1, that atmospheric pressure fluctuations
tar. They estimate an approximate contribution from cause currents with magnitudes of about 0.4 m s⫺1, and
that there are baroclinic currents with magnitudes of
about 0.5 m s⫺1 that are induced by the specific budget
Corresponding author address: Dimitris Menemenlis, Jet Pro-
pulsion Laboratory, California Institute of Technology, Mail Stop of the Mediterranean Sea.
300–323, 4800 Oak Grove Dr., Pasadena, CA 91109. From theoretical considerations, Garrett (1983) esti-
E-mail: menemenlis@jpl.nasa.gov mates that wind-driven storm surges on the continental
DOI: 10.1175/JPO3015.1
© 2007 American Meteorological Society
JPO3015360 JOURNAL OF PHYSICAL OCEANOGRAPHY VOLUME 37
shelf of North Africa, just outside the Strait of Gibral- m s⫺1. The impact of along-strait winds on the along-
tar, may produce sea level changes in the Mediterra- strait sea level difference, however, is assumed to be
nean that are up to 30% of the pressure-driven vari- small (Garrett et al. 1989).
ability. Using numerical simulations, forced first by at- The hypothesis considered herein is that wind-driven
mospheric pressure alone and then by atmospheric Atlantic to Mediterranean sea level difference does
pressure and wind stress, García-Lafuente et al. (2002b) not, to first order, occur within the Strait of Gibraltar.
infer that, although the main driving force of subinertial Instead, as suggested by Garrett (1983), it is proposed
flow through Gibraltar Strait is atmospheric pressure that the sea level difference is primarily caused by
over the Mediterranean Sea, wind stress on the Atlantic winds blowing over the shallow and wide Atlantic con-
side of the strait may also contribute appreciably to tinental shelf near the western entrance of Gibraltar
the subinertial net flow. Using numerical experiments Strait. Garrett (1983) argues that the principal cause of
in a quasi-global, coarse-resolution ocean circulation the low-frequency, wind-driven, Atlantic–Mediterranean
model, Fukumori et al. (2007) proposed that the ob- sea level difference is alongshore wind on the continen-
served basin-wide intraannual sea level variability of tal shelf of North Africa just outside the Strait of
the Mediterranean Sea is barotropic in the sense that Gibraltar. Garrett [1983, Eq. (7.1)] estimates that the
the fluctuations are insensitive to stratification. They sea level difference is approximately 1 cm for a 1 m s⫺1
also suggest that the fluctuations are driven by winds in wind, that is, for a wind stress of approximately 0.002 Pa.
the vicinity of Gibraltar Strait. In particular, their This study revisits the Garrett (1983) hypothesis and
coarse-resolution simulations show the existence of a estimate using TOPEX/Poseidon sea level data, surface
dynamic balance between the Atlantic–Mediterranean wind stress from the National Centers for Environmen-
sea level difference and the winds at the Strait of tal Prediction–National Center for Atmospheric Re-
Gibraltar and its neighboring regions, including the search (NCEP–NCAR) reanalysis, and high-resolution
Alboran Sea and a part of the Atlantic Ocean immedi- numerical simulations of Gibraltar Strait. While the
ately to the west of the strait. The present study aims to Garrett (1983) estimate is based on the effects of near-
identify and to describe in detail the physical processes shore currents, this study finds large contributions from
responsible for this dynamic balance. currents offshore of the 284-m isobath and from the
Understanding and quantifying externally forced along-strait wind setup. This study also finds that the
sources of spatially correlated sea surface height vari- sea level difference is approximately proportional to
ability are important to scientists and to engineers that the wind stress rather than the wind speed.
use altimeter data to study other oceanographic pro- The remainder of this article is organized as follows.
cesses in the Mediterranean Sea. Fieguth et al. (1998) Section 2 compares the observations of sea level and
used a multiresolution optimal interpolation algorithm winds near Gibraltar Strait. Section 3 lays out a theo-
to estimate the error budget of Mediterranean altim- retical basis for the wind-driven Atlantic to Mediterra-
eter data. For barometrically corrected Ocean Topog- nean sea level difference. Section 4 presents results
raphy Experiment (TOPEX)/Poseidon data, they esti- from high-resolution barotropic simulations of wind-
mate low-wavenumber errors to have a standard devia- driven currents through the Strait of Gibraltar. Discus-
tion of 2.5 cm during the summer months and of 4–8 cm sion and conclusions follow in section 5.
during the winter. If it were possible to explain and to
predict some substantial fraction of these errors, more
2. Observations of sea level and wind near
accurate sea level maps could be generated for studies
Gibraltar
of the Mediterranean dynamics, climate, and sea level
variability. This section aims to compare time series of the sea
Along-strait winds above Gibraltar are locally inten- level difference between the Atlantic and Mediterra-
sified (Dorman et al. 1995) and they impact the surface nean ends of Gibraltar Strait with surface wind stress
inflow of Atlantic water. Garrett et al. (1989) estimate above the Atlantic continental shelf immediately west
that the Atlantic inflow current variability caused by of the strait. Figure 1 depicts the complex bathymetry
along-strait winds is of order 0.8–1.4 m s⫺1 root-mean- of Gibraltar Strait and the adjoining seas. On the At-
square (rms) at the surface. Stanichny et al. (2005) note lantic side of the strait there is a wide and shallow con-
a high correlation between the zonal wind component tinental shelf. By comparison, the Alboran Sea on the
and the Tarifa to Ceuta cross-strait sea level difference. eastern side of the strait has a much steeper coastline.
They estimate that a 10 m s⫺1 zonal wind will cause a The shallowest section of the Strait of Gibraltar is at the
cross-strait sea level difference of 0.85 m corresponding Camarinal Sill, near the western entrance, where the
to a zonal surface geostrophic current of order 0.4 maximum water depth is 284 m.FEBRUARY 2007 MENEMENLIS ET AL. 361
tion available online at http://podaac.jpl.nasa.gov). The
Pathfinder altimeter data are derived from TOPEX/
Poseidon geophysical data record files, they are inter-
polated to a specific ground track, and they are pro-
vided at 1-s intervals, approximately every 6 km along
the ground track. The data cover the period 23 Septem-
ber 1992–11 August 2002, that is, TOPEX/Poseidon
cycles 1–364. All known geophysical, media, and instru-
ment corrections have been applied, including correc-
tions for tides and for atmospheric loading.
Fluxes associated with atmospheric loading dominate
subinertial variations through Gibraltar Strait (Candela
et al. 1989). The altimeter data used herein have been
FIG. 1. Bathymetry and TOPEX/Poseidon tracks near Gibraltar
Strait. Bathymetric contour lines indicate the 80-, 284-, 500-, and
adjusted for atmospheric loading according to the in-
1000-m depths. The shallowest section of the strait is 284 m deep verse barometer correction (Larnicol et al. 1995; Ponte
at the Camarinal Sill. Large dots along the tracks represent alti- et al. 1991); that is, sea level drops 1 cm when atmo-
metric observations, which are used to estimate the sea level on spheric pressure rises by 1 hPa. Deviations from an
the Atlantic side of Gibraltar Strait and in the Alboran Sea. Small inverse barometer response in the Mediterranean have
dots represent available but unused altimetric data in regions shal-
lower than 1000 m.
been observed, especially for periods shorter than a few
days, possibly because of restrictions of flow through
Gibraltar Strait (Garrett and Majaess 1984; Le Traon
and Gauzelin 1997). For periods of 20 days and longer,
a. TOPEX/Poseidon sea level
however, deviations from the inverse barometer re-
Many studies of sea level near and within Gibraltar sponse are expected to be small.
Strait are based in part on coastal tide gauge data (e.g., Atlantic and Alboran mean sea level time series are
Brandt et al. 2004; Cazenave et al. 2002; García- computed based on, respectively, four altimeter tracks
Lafuente et al. 2004; Garrett et al. 1989; Sannino et al. west and east of Gibraltar Strait, as shown in Fig. 1.
2004; Stanichny et al. 2005; Tsimplis and Baker 2000). Altimeter data from regions shallower that 1000 m are
Tide gauge data at Cadiz, Spain, or Tangier, Morocco, not included to reduce contamination of the time series
are often taken to represent Atlantic sea level while by coastal processes and altimeter errors. Mediterra-
tide gauge data at Malaga, Spain; the British overseas nean sea level is computed based on all Mediterranean
territory of Gibraltar; or the Spanish enclave of Ceuta tracks, including tracks in the Alboran Sea. The black
in North Africa are taken to represent Mediterranean lines in Fig. 2 are constructed based on 364 ten-day
sea level. Coastal sea level stations, however, are not averages, 1 ten-day average per TOPEX/Poseidon
necessarily representative of basin-averaged sea level cycle. Therefore, signals with periods shorter than 20
[e.g., cf. Fig. 3, showing the Cadiz-to-Malaga sea level days cannot be resolved. The gray lines are low-pass-
drop, with Fig. 4b, showing the northeastern Atlantic to filtered time series with a cutoff period of 360 days.
western Mediterranean sea level drop, in Ross and Specifically, the available TOPEX/Poseidon data are
Garrett (2000)]. To reduce complications due to near- first linearly interpolated in time to generate daily time
shore processes, altimetric rather than coastal tide series and then an eighth-order Chebyshev type I filter
gauge data are used to estimate the Atlantic–Mediter- with a 360-day cutoff period is applied (Antoniou
ranean sea level difference. 1993). That is, the gray lines in Fig. 2 represent the
Figure 2 shows time series of the spatially averaged annual cycle and interannual variability.
sea level for the Atlantic side of Gibraltar Strait, atl ;
for the Alboran Sea, alb ; for the Mediterranean, med ;
and for the sea level difference, h ⫽ alb ⫺ atl ; see
b. NCEP–NCAR surface wind stress
Table 1 for a summary of the notation used. Sea level The surface wind stress is from the NCEP–NCAR
data are taken from the National Aeronautics and atmospheric reanalysis (Kistler et al. 2001). Wind
Space Administration (NASA) Goddard Space Flight stress, rather than 10-m winds, is used in this
Center Altimeter Ocean Pathfinder TOPEX/Poseidon study because NCEP–NCAR winds are unrealistically
sea surface height anomaly, version 9.2, obtained from low in coastal regions. The quality of the NCEP–
the NASA Jet Propulsion Laboratory Physical Ocean- NCAR wind stress data near Gibraltar Strait can be
ography Distributed Active Archive Center (informa- assessed through comparison with observations. Dor-362 JOURNAL OF PHYSICAL OCEANOGRAPHY VOLUME 37
FIG. 2. TOPEX/Poseidon mean sea level time series for the Atlantic side of Gibraltar (atl),
the Alboran Sea (alb), the Mediterranean (med), and the Alboran–Atlantic difference (h ⫽
alb ⫺ atl). Black lines represent sea level after application of all standard corrections,
including corrections for tides and for atmospheric pressure. Gray lines are low-pass-filtered
time series with a cutoff period of 360 days.
man et al. (1995) report along-strait winds above where a is atmospheric density, approximately 1.25 kg
Gibraltar with standard deviations ranging from 7.5 m⫺3 near the sea surface; ua is the 10-m atmospheric
m s⫺1 in Punta Cires, Morocco, to 11.4 m s⫺1 at Castilla, wind; and CDa is an air–sea drag coefficient, approxi-
Spain. Dorman et al. (1995) also report standard devia- mately 1.3 ⫻ 10⫺3 for typical conditions (Kara et al.
tions for cross-strait winds ranging from 2.1 m s⫺1 at 2000). This leads to estimated NCEP–NCAR 10-m
Punta Cires to 4.3 m s⫺1 at Castilla. The observed winds at 36°N, 6.5°W that have zonal and meridional
wind speed variability can be compared to the NCEP– standard deviations of, respectively, 7.5 and 5.3 m s⫺1,
NCAR wind stress data using an approximate formula which is about right for the zonal wind but somewhat
for conversion of wind speed to stress: higher than the observations for the meridional wind.
Some characteristics of the zonal x and meridional y
⫽ aCDaua | ua |, 共1兲 wind stresses at 36°N, 6.5°W, 83 km west of CamarinalFEBRUARY 2007 MENEMENLIS ET AL. 363
TABLE 1. Summary of notation. match the 10-day TOPEX/Poseidon repeat cycle.
Eighth-order Chebyshev type I filters are once again
Symbol Definition
employed both for the low-pass and for the high-pass
atl Sea level on the Atlantic side of Gibraltar Strait
filters that are applied to the wind stress and sea level
alb Sea level in the Alboran Sea
med Sea level in the Mediterranean Sea data. Table 2 shows that approximately 60% of the
h Sea level difference alb ⫺ atl wind stress variance is at periods shorter than 20 days
x Zonal surface wind stress at 36°N, 6.5°W and that 25% of the wind stress variance is in the 20–
y Meridional surface wind stress at 36°N, 6.5°W 360-day band. The remaining variance is at the annual
Ts Time scale for the setup due to the along-strait wind
Th Delay due to Gibraltar Strait hydraulics
cycle and longer periods.
Tb Barotropic equilibration time scale Table 2 also shows that in all frequency bands, the
Tf Frictional adjustment time Alboran and Mediterranean sea level variability is
larger than that of the Atlantic Ocean near Gibraltar
Strait. This is because Gibraltar Strait exchange pro-
Sill, and of the sea level time series from Fig. 2 are listed cesses have a disproportionately larger impact on Medi-
on Table 2. At the annual period, peak sea level occurs terranean rather than on Atlantic sea level variability
in late September–early October, which is consistent given that the volume of the Mediterranean is approxi-
with the seasonal heating and cooling of the water col- mately 4 ⫻ 1015 m3 as compared with 1.4 ⫻ 1018 m3 for
umn. The annual cycle amplitude of the Mediterranean the global ocean. In the 20–360-day band, the standard
and Alboran sea level is approximately twice that of deviation of the Alboran–Atlantic sea level difference
Atlantic sea level: 7.4 versus 4.2 cm. The Alboran to is 3.8 cm. The hypothesis investigated in this article is
Atlantic sea level difference h has an annual cycle am- that some significant fraction of this variability results
plitude of 3.3 cm with peak difference in early Septem- from the barotropic response to winds near Gibraltar.
ber. By comparison, the peak wind stress at the annual For this purpose, Fig. 3 compares the bandpassed wind
period occurs in mid-July for x and early January for stress time series with the bandpassed Alboran–Atlan-
y. This phase difference indicates that winds near tic sea level difference. Black lines represent the zonal
Gibraltar are unlikely to be a primary driver of the (x; Fig. 3, top) and meridional (y; Fig. 3, bottom) sur-
Alboran to Atlantic sea level difference at the annual face wind stresses at 36°N, 6.5°W and gray lines repre-
cycle. At the semiannual period, there is a much closer sent the sea level difference h ⫽ alb ⫺ atl. Note that
correspondence between the phase of h (137 days) and given the coarse horizontal grid spacing of the NCEP–
the phases of x and y (135 and 140 days, respectively). NCAR reanalysis (167 km zonally and 210 km meridi-
This indicates a possible dependence of h on x and y onally near Gibraltar Strait), the wind stress at 36°N,
with an approximate transfer coefficient of 0.43 m Pa⫺1. 6.5°W represents a spatial average across the complete
To reduce the contamination of the sea surface Gibraltar Strait and the adjoining coastal regions on the
height observations from processes other than barotro- Atlantic side of the strait.
pic wind-driven currents, for example, from the sea- The correlation coefficient functions for the time se-
sonal heating and cooling of the water column and from ries in Fig. 3 are displayed in Fig. 4 as a function of time
low-frequency changes in the hydraulic regime of lag. The thick dashed and solid lines represent, respec-
Gibraltar Strait (Ross and Garrett 2000), the analysis tively, (h, x) and (h, y), the correlation of the ob-
that follows is restricted to periods ranging from 20 to served Alboran–Atlantic sea level difference with zonal
360 days, the 20-day cutoff being imposed in order to and meridional NCEP–NCAR wind stresses at 36°N,
TABLE 2. Summary characteristics of the sea level time series in Fig. 2 and of the surface wind stress from NCEP–NCAR reanalysis
data at 36°N, 6.5°W. Units are as indicated, except for phase, which is time of peak amplitude in days from 1 January.
atl alb med h x y
(cm) (cm) (cm) (cm) (Pa) (Pa)
Std dev 3.8 7.0 6.2 5.4 0.21 0.12
Std dev of 0–20-day band — — — — 0.16 0.09
Std dev of 20–360-day band 1.9 3.9 3.2 3.8 0.11 0.06
Semiannual amplitude 0.7 1.4 1.5 0.7 0.015 0.007
Semiannual phase in days 120 128 135 137 135 140
Annual amplitude 4.2 7.4 7.4 3.3 0.030 0.043
Annual phase in days 273 264 282 251 200 5364 JOURNAL OF PHYSICAL OCEANOGRAPHY VOLUME 37
FIG. 3. Comparison of barometrically corrected TOPEX/Poseidon sea surface height and
NCEP–NCAR wind stress near Gibraltar Strait for periods ranging from 20 to 360 days. Black
lines represent (top) zonal (x) and (bottom) meridional (y) surface wind stresses at 36°N,
6.5°W, 83 km west of Camarinal Sill; positive values indicate eastward and northward wind
stresses, respectively. Gray lines represent the sea level difference between the Alboran Sea
and the Atlantic side of Gibraltar Strait; i.e., they are the high-passed difference h ⫽ alb ⫺
atl from the bottom panel in Fig. 2.
6.5°W. The thin lines are the 95% confidence intervals about the two coefficients, a decorrelation time scale of
computed by assuming that the joint distributions are 20 days, and the assumption that data errors account for
binormal and that the decorrelation time scale is 20 75% of the observed variance (Wunsch 1996). Equa-
days (Press et al. 1992). Sea level difference h exhibits tion (2) explains 21% of the observed alb ⫺ atl vari-
significant correlation both with x and with y; h lags x ance in the 20–360-day band, where the percent vari-
by 1 ⫾ 5 days and y by 5 ⫾ 4 days. Confidence intervals ance of time series x explained by time series y is de-
for the time lags represent the regions above the peak fined as
correlation coefficient functions that are within the
95% confidence intervals.
The above analysis was repeated for different powers
of wind stress, px and py with p ranging from 0.5 to 1.5.
The power laws that maximize the correlation coeffi-
cients are p ⫽ 0.85 and p ⫽ 1.05 for, respectively, (h,
x) and (h, y). But the differences in correlation co-
efficients are not significant at the 95% confidence in-
terval; that is, there is not sufficient information to
claim that p is different from 1.
By least squares fit, it is estimated that the ratio of
the TOPEX/Poseidon sea level difference to the
NCEP–NCAR surface wind stress near Gibraltar is
h共t兲 ⫽ 共0.10 ⫾ 0.04兲x 共t ⫺ 1兲 ⫹ 共0.19 ⫾ 0.08兲y 共t ⫺ 5兲,
共2兲 FIG. 4. Correlation coefficient function between the NCEP–
NCAR surface wind stress near Gibraltar Strait and the baro-
where t is time in days, h ⫽ alb ⫺ atl is the Alboran– metrically corrected TOPEX/Poseidon sea level difference be-
Atlantic sea level difference in meters, and x and y tween the Alboran Sea and the Atlantic Ocean, h ⫽ alb ⫺ atl.
Correlation functions are shown both for zonal, (h, x) is the
are, respectively, zonal and meridional surface wind thick dashed line, and meridional, (h, y) is the thick solid line,
stresses in pascals at 36°N, 6.5°W; the 95% confidence winds. Positive delay indicates that sea level lags wind stress. The
intervals are estimated assuming no prior information thin lines are the 95% confidence intervals.FEBRUARY 2007 MENEMENLIS ET AL. 365
var共x兲 ⫺ var共x ⫺ y兲
Explained variance ⫽ ⫻ 100%.
var共x兲
共3兲
Note that the residual x ⫺ y is not assumed to be un-
correlated with x or y and therefore that the explained
variance is not necessarily proportional with the square
of the correlation coefficient.
3. Barotropic currents over the continental shelf
Having established that the barometrically corrected
TOPEX/Poseidon sea level difference between the At-
lantic and the Alboran Sea is correlated with NCEP–
NCAR surface winds near Gibraltar, the next step is to
determine whether this correlation is accidental or
whether it indicates linear dependence. To establish a
linear dependence, this section lays out a theoretical
basis for the wind-driven Atlantic to Mediterranean sea
level difference.
The dynamics of the barotropic currents over the
continental shelf are discussed by Csanady (1974) using
linearized equations of motion and a quadratic bottom
friction law. When the wind direction is perpendicular FIG. 5. (top) The meridionally averaged and maximum depth of
Gibraltar Strait and the adjoining seas. The shallowest region is in
to the coastline, the sea level response is often called
the Atlantic, to the west of Camarinal Sill, between 6.5° and
barotropic or external wind setup (e.g., Gravili et al. 5.75°W. (bottom) The sea level change due to Eq. (5) and to a
2001). When the wind direction is parallel to the coast- steady along-strait surface wind stress of 0.1 Pa assuming a chan-
line, the sea level response is that of a local coastal nel of constant width and an along-channel depth profile equal to
storm surge (e.g., Gill 1982, section 10.9). The wind the meridionally averaged depth profile.
setups due to cross-shore or alongshore winds are rou-
tinely observed by tidal stations near Gibraltar (e.g.,
Integrating, the magnitude of the steady-state barotro-
García-Lafuente et al. 2004). The equations underlying
pic wind setup is
these two processes are briefly reviewed below.
a. Setup due to along-strait wind
共x兲 ⫽
x
w g 冕0
x
H共兲
d. 共5兲
When the wind blows perpendicular to a coastline, a Equation (5) can also be used to estimate the along-
steady-state balance is quickly established between the strait sea level change due to along-strait winds above a
surface wind stress and a pressure force due to the slope channel of constant width and of depth H() that varies
of the sea surface. The pressure force per unit volume only in the along-strait direction.
is w g/x, where w is the water density, g is the ac- To give some idea of what the magnitude of the sea
celeration due to gravity, is the sea surface height, level response due to Eq. (5) would be in the absence of
and x is a coordinate perpendicular to the coastline. other physics, Fig. 5 shows an estimate of the sea level
The wind stress force per unit volume is x /H, where H change assuming a steady zonal surface wind stress of
is the depth of the water column and x is the surface x ⫽ 0.1 Pa and a channel of constant width that has an
wind stress in a direction aligned with x. Thus, a force along-channel depth profile equal to the meridionally
balance predicts the sea surface slope to be [Csanady averaged depth profile of Gibraltar Strait and its ad-
1982, Eq. (2.2)] joining seas. Notice that both the meridionally aver-
aged (black line in Fig. 5, top) and the maximum (gray
⭸ x line in Fig. 5) depth profiles have their shallowest
⫽ . 共4兲
⭸x w gH depths in a region immediately west of the Camarinal366 JOURNAL OF PHYSICAL OCEANOGRAPHY VOLUME 37
Sill, between 6.5° and 5.75°W. This region is also where c. Storm surge due to alongshore wind
the maximum sea level change due to the along-strait
As pointed out by Garrett (1983), there is consider-
wind setup is expected to occur (Fig. 5, bottom).
able evidence to suggest that the alongshore wind com-
Ignoring any bathymetric inhomogeneities, hydraulic
ponent is much more important than the cross-shelf
constraints within Gibraltar Strait, and the presence of
wind component in producing coastal sea level changes
the Mediterranean Basin, the sea level to wind stress
at low frequency. Consider a semi-infinite sea of uni-
equilibrium is expected to be reached for time scales
form depth H bounded on the right by a straight bound-
longer than a setup time:
ary at x ⫽ 0. A wind stress parallel to the coast and of
magnitude y is applied starting at time t ⫽ 0. The wind
2L
Ts ⫽ , 共6兲 forcing produces an Ekman current to the right of the
c wind in the Northern Hemisphere, which causes the
surface to rise at a constant rate within a distance on the
where c ⫽ (gH )1/2 is the phase speed of shallow-water
order of the barotropic Rossby radius of deformation
gravity waves and L and H are representative length
from the coast. Ignoring friction, the rate of change of
and depth scales. For Gibraltar Strait and the adjoining
the sea surface elevation at the coast is [Gill 1982, Eq.
shelf regions, from 7°W to 4.5°W, L ⬇ 280 km, H ⬇ 730
(10.9.7)]
m, and Ts ⬍ 2 h.
y
共x, t兲 ⫽ t exp共⫺xⲐa兲, 共10兲
b. Barotropic response of the Mediterranean Sea wc
Even though the setup time Ts ⬍ 2 h is extremely where x is the distance from the coastline, a ⫽ c /f is the
fast, the geostrophic or hydraulic controls (Garrett barotropic Rossby radius of deformation, and f ⬇ 8.5 ⫻
2004) of the flow through the Strait of Gibraltar are 10⫺5 s⫺1 is the Coriolis parameter. That is, the storm
expected to delay the Mediterranean sea level response surge solution in Eq. (10) is proportional to the along-
to sudden changes in sea level on the Atlantic side of shore wind stress y and increases linearly with time t.
the strait. Theoretical (Bormans and Garrett 1989) and Equation (10) predicts a region of coastal influence that
experimental (Garrett et al. 1989) results suggest that decays with exp(⫺x/a), where a is the radius of defor-
the ratio of the Gibraltar Strait throughflow to the sea mation based on some appropriate depth scale. Csan-
level difference between the Atlantic and the Mediter- ady (1974) suggests that, for typical coastal regions, the
ranean is approximately ␣ ⬇ 4 ⫻ 107 m2 s⫺1, that is, 0.4 appropriate depth scale is the depth of the open ocean.
Sv cm⫺1. Therefore, A conservative estimate is H ⫽ 284 m, the depth of
Camarinal Sill, which nevertheless results in a ⬇ 620
⭸h ⫺␣h
⫽ , 共7兲 km, much longer than the 43-km width of Gibraltar
⭸t Amed Strait on the Atlantic side. Therefore, coastal processes
on either side of the strait are expected to influence sea
where h is the Atlantic–Alboran sea level difference level at the entrance of the strait.
and Amed ⬇ 2.5 ⫻ 1012 m2 is the surface area of the The storm surge solution due to alongshore wind
Mediterranean Sea. Integrating Eq. (7) gives an expo- stress also predicts a steadily increasing alongshore cur-
nential decay time of rent, parallel to the coast, which is in geostrophic equi-
librium with the pressure gradient due to Eq. (10). A
Amed
Th ⫽ ⬇ 17 h. 共8兲 steady state is reached when the bottom stress applied
␣ to this alongshore current is sufficiently large to balance
the surface stress. Assuming (i) the existence of slow
A delay may also be expected due to the time taken for large-scale motions, that is, /y K /x and K f,
a barotropic sea level change to establish itself within where is the frequency; (ii) a shelf width smaller than
the Mediterranean Basin. This delay could be of order the barotropic radius of deformation, which is the case
here; and (iii) a bottom stress of the form wCD | |,
2Lmed where CD is a drag coefficient and is the depth-
Tb ⬇ ⬇ 18 h, 共9兲
共gHmed兲1Ⲑ2 averaged alongshore current, the steady-state solution
is (Sandstrom 1980)
where Lmed ⬇ 3.9 ⫻ 106 m and Hmed ⬇ 1.5 ⫻ 103 m are,
respectively, the length and depth of the Mediterranean
Sea.
⭸ f
⫽
y
⭸x g wCD 冉 冊 1Ⲑ2
. 共11兲FEBRUARY 2007 MENEMENLIS ET AL. 367
Assuming a quadratic wind speed to wind stress con- to cross the opening of the strait at the Camarinal Sill
version law as in Eq. (1), Eq. (11) predicts that the local and to join with (or to compete against) coastal currents
storm surge sea level will scale linearly with wind speed, on the north side of the Gibraltar Strait. The surface
contrary to the wind setup solution in Eq. (4), which is pressure gradient associated with this cross-strait cur-
expected to scale linearly with wind stress. Equation rent west of Camarinal Sill is expected to contribute to
(11) together with Eq. (1) and a shelf width of 40 km the sea level difference between the Atlantic and Medi-
was used by Garrett [(1983), Eq. (7.1)] to estimate that terranean. The Moroccan coastal current that is inshore
the Atlantic–Mediterranean sea level difference is ap- of the 284-m isobath continues into the Strait of Gibral-
proximately 1 cm for a 1 m s⫺1 wind. tar, but it is to a large extent unable to cross the strait
The sea level to wind stress equilibrium is reached for because of conservation of potential vorticity con-
time scales longer than a frictional adjustment time straints. At steady state, some fraction of this current
[Csanady 1982, Eq. 6.4b)]: will be dissipated in shallow coastal regions while the
冉 冊
remainder may contribute to additional changes in the
H w 1Ⲑ2
Tf ⫽ . 共12兲 Atlantic–Mediterranean sea level difference or be bal-
2 CDⱍyⱍ anced by the outgoing current on the northern side of
The frictional adjustment time varies directly with Gibraltar Strait.
depth and inversely with the square root of the wind To summarize, the Atlantic–Mediterranean sea level
stress and bottom drag coefficient. Below, it is argued difference due to an alongshore wind-driven currents is
that the relevant Tf for the Atlantic–Mediterranean sea expected to occur primarily offshore of the 284-m iso-
level difference may be the time needed to establish the bath on the Atlantic side of Gibraltar Strait west of
frictional equilibrium at the depth of Camarinal Sill: Camarinal Sill. Given the irregular coastline and
H ⫽ 284 m. A typical value for the nearshore bottom bathymetry of the strait, however, it is hard to estimate
drag coefficient is CD ⫽ 0.002 (e.g., Feddersen et al. sea level at the 284-m isobath. With the hindsight of
2003). For y ⫽ 0.1 Pa, the approximate frictional ad- numerical simulation results, which are presented in
justment time is Tf ⬇ 90 h. section 4, sea level is set west of Tangier, near the clos-
est approach of the 284-m isobath to the coastline, ap-
d. The role of Camarinal Sill proximately 6 km offshore; the sea level amplitude at
the 284-m isobath near Tangier is approximately 4 cm
At steady state, with zero net transport through the for a steady, homogeneous, south-southwesterly wind
Strait of Gibraltar, a pressure gradient /x normal to stress of 0.1 Pa.
the Atlantic coastline is established via Eq. (11), caus-
ing an alongshore current,
4. Barotropic simulations of Gibraltar throughflow
g ⭸
⫽ , 共13兲 The complicated bathymetry of Gibraltar Strait and
f ⭸x
the surrounding areas makes it difficult to obtain pre-
in geostrophic balance with the pressure gradient. The cise estimates on the impact of the along-strait wind
North African coastline stretching from Cap Blanc, at setup and of alongshore windstorm surges on the At-
the southern tip of the western Sahara, to Gibraltar lantic–Mediterranean sea level difference from analytic
exposes almost 2000 km of relatively straight, uninter- considerations alone. In this section, high-resolution
rupted, and shallow continental shelf to south-south- barotropic simulations of the throughflow are used to
westerly winds. For this reason, under steady homoge- test and to refine the analytic results.
neous wind forcing, alongshore currents along the Mo- Simulations are carried out using a global ocean con-
roccan coastline are expected to be larger than those in figuration of the Massachusetts Institute of Technology
the Gulf of Cadiz or in the Alboran Sea. As the Mo- general circulation model (MITgcm; Marshall et al.
roccan coastal current reaches the opening of the strait, 1997a,b) with a telescoping horizontal grid that has in-
the assumptions used in deriving the storm surge equa- creased resolution in the region near Gibraltar. Near
tion [Eq. (11)] break down. The expectation is that, in Gibraltar, the horizontal grid spacing is 1⁄30°, approxi-
an attempt to follow isobaths and hence to conserve mately 3 km zonal by 3.7 km meridional. Grid spacing
potential vorticity (Csanady 1974), the Moroccan gradually increases to approximately 4° near the poles
coastal current will be deflected toward the strait and and in the Pacific Ocean. This grid configuration avoids
accelerate as the isobaths get closer together. Some having to make arbitrary decisions about where and
fraction of this coastal current, approximately that what open boundary conditions to impose, it provides
which follows isobaths deeper than 284 m, will be able high horizontal resolution in the study region, and yet it368 JOURNAL OF PHYSICAL OCEANOGRAPHY VOLUME 37
FIG. 6. Comparison of observed (gray lines) and simulated (black lines) sea levels for the
20–360-day band. (top) The mean sea level on the Atlantic side of Gibraltar Strait, (middle)
the mean sea level in the Alboran Sea, and (bottom) the mean sea level in the Mediterranean,
including the Alboran Sea.
results in a manageable 440 ⫻ 266 horizontal grid di- Vertical viscosity above the bottom level is set to 1 ⫻
mension. 10⫺3 m2 s⫺1. The horizontal viscosity is biharmonic and
Bathymetry is from the National Geophysical Data follows Leith (1996) but with the addition of a term
Center (NGDC) 2-min gridded global relief data (2⬘ proportional to the horizontal gradient of the diver-
Gridded Earth Topography; ETOPO2), which in the gence (B. Fox-Kemper 2005, personal communication).
region of interest is obtained from the work of Smith The model is initialized from rest and integrated using
and Sandwell (1997). The model’s vertical grid extends an implicit free-surface formulation and a time step of
to a maximum depth of 5200 m and comprises 15 ver- 90 s.
tical levels ranging in thickness from 50 m at the surface
to 690 m at the bottom. The model employs the partial-
a. 1992–2003 integration
cell formulation of Adcroft et al. (1997), which permits
the accurate representation of the bathymetry despite In a first numerical experiment, the barotropic model
the small number of vertical levels. is integrated for the 1992–2003 period forced by the
The model is barotropic in the sense that the poten- NCEP–NCAR surface wind stress. Figure 6 compares
tial temperature and salinity are kept constant through- the barometrically corrected TOPEX/Poseidon obser-
out the domain and period of integration. Because of vations with simulation results for the 20–360-day band.
frictional processes and variable bathymetry, however, The model time series are constructed by sampling and
the horizontal velocity is not expected to be uniform averaging the simulated sea surface height in exactly
throughout the water column. the same way as the available data in order to minimize
The bottom friction is quadratic in the model’s bot- the differences that arise because of sampling. We have
tommost wet level with the drag coefficient CD ⫽ 0.002. verified that the simulated time series sampled at theFEBRUARY 2007 MENEMENLIS ET AL. 369
TOPEX/Poseidon tracks are almost identical to the Strait to affect the mean sea level of the entire Medi-
suitably filtered basin averages that are obtained from terranean.
the full model fields. Therefore, aliasing due to the
b. Response to steady wind forcing
TOPEX/Poseidon sampling is likely to be small.
In the 20–360-day band, there is significant correla- To better understand the transient and steady-state
tion between the observed and simulated time series of responses to the wind forcing, the barotropic model is
the mean sea level in the Alboran Sea ( ⫽ 0.52) and in initialized from rest and forced with steady zonal and
the Mediterranean ( ⫽ 0.56) but not in the Atlantic meridional winds for 40 days. A uniform surface wind
Ocean ( ⫽ 0.09). The simulation explains 27% of the stress is applied on a region with a 500-km radius, cen-
observed variance in the Alboran Sea, 28% of the ob- tered near Gibraltar (36°N, 6°W). Outside this region,
served variance in the Mediterranean, but only 0.2% of the wind stress decays gradually with a sinusoidal pro-
the observed variance on the Atlantic side of the file. The complete footprint of the wind stress pertur-
Gibraltar Strait. This suggests that while the mean sea bation has a radius of 4000 km; therefore, it includes all
level on the Atlantic side of the Gibraltar Strait is of the northwestern African coastline, where along-
dominated by internal variability (e.g., Ambar et al. shore windstorm surges develop that are expected to
1999), which is not simulated by the barotropic model, influence the Atlantic–Mediterranean sea level differ-
the Alboran Sea and Mediterranean mean sea level ence.
variability has a large barotropic component in the Figure 7a shows the steady-state sea level anomaly
20–360-day band. The correlation coefficient between near Gibraltar Strait from an integration forced by
the simulated and observed Atlantic–Alboran sea level zonal wind X ⫽ 0.1 Pa. The corresponding meridionally
difference is ⫽ 0.55 and the explained variance is averaged sea level as a function of longitude is shown
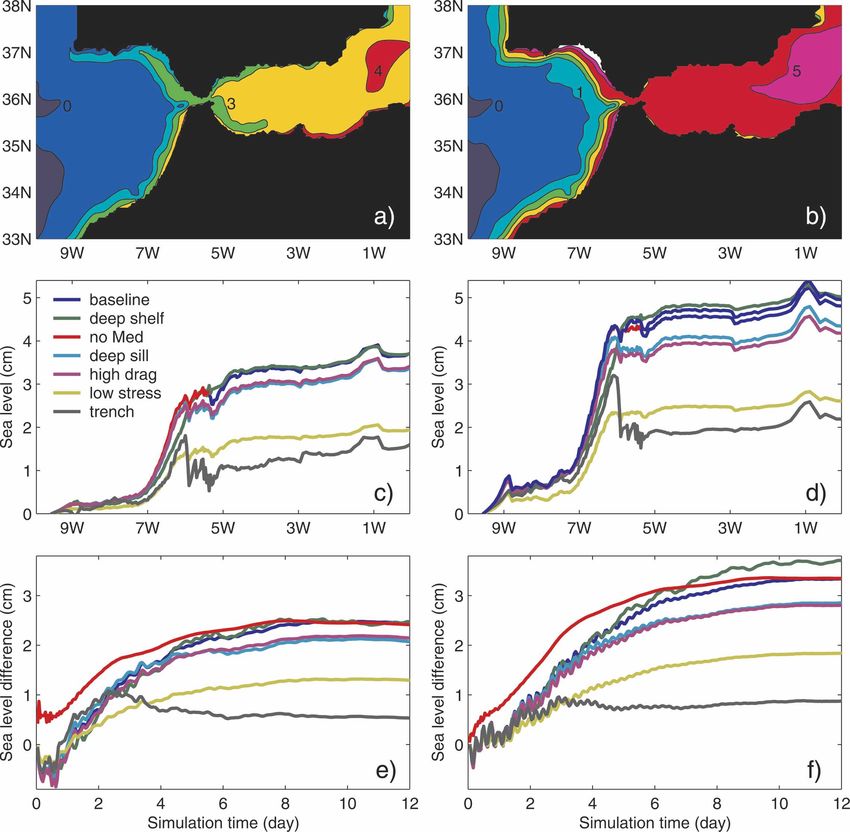
29%. by the blue line in Fig. 7c. The Atlantic to Mediterra-
Repeating the data analysis carried out in section 2b, nean sea level rise is approximately 3.6 cm, most of it
but replacing the TOPEX/Poseidon data with equiva- (⬇2.3 cm) occurring between 7° and 6°W on the At-
lently sampled model simulation results, the correla- lantic side of the strait. This sea level rise is larger than
tion coefficient functions between the simulated h and can be explained by the along-strait wind setup alone,
the NCEP–NCAR surface wind stress have peaks at which from Eq. (5) and Fig. 5 is estimated to be ap-
(h, x) ⫽ 0.54 and (h, y) ⫽ 0.62 with delays of, proximately 1.4 cm. The increased coastal sea level
respectively, 1 ⫾ 2.5 days and 2.6 ⫾ 2.5 days. The op- along Morocco and the decreased coastal sea level
timal power-law coefficients are, respectively, p ⫽ 1.05 along the Iberian Peninsula are consistent with the
and p ⫽ 1.15. Once again, there are no grounds to claim storm surge solution due to the alongshore component
that these power laws are significantly different from 1. of the wind.
By using a least squares fit, it is estimated that the ratio The blue line in Fig. 7e is a time series of the meridi-
of the simulated Atlantic–Alboran mean sea level dif- onally averaged sea level difference between 7.5° and
ference to the NCEP–NCAR surface wind stress is 5.5°W. As predicted by Eq. (6), the spinup for the
along-strait wind begins with an extremely fast adjust-
h共t兲 ⫽ 共0.10 ⫾ 0.02兲 x 共t ⫺ 1兲 ⫹ 共0.23 ⫾ 0.06兲 y 共t ⫺ 2.6兲, ment, order 2 h, which initially causes the sea level on
共14兲 the Atlantic side to be higher by approximately 0.6 cm
than that of the Mediterranean. This is because to a first
which is consistent with Eq. (2), which was derived us- approximation the Gibraltar Strait initially acts as a
ing the TOPEX/Poseidon mean sea level data. Equa- closed boundary. On the Atlantic side, the setup due to
tion (14) explains 58% of the variance of the simulated cross-shelf winds raises the sea level while on the Albo-
h in the 20 to 360-day band. ran side it lowers the sea level. The Mediterranean sea
Last, there is a high degree of similarity between the level responds to the Atlantic sea level change with a
Alboran and Mediterranean mean sea level time series. delay of approximately 36 h, which is consistent with
For barometrically corrected TOPEX/Poseidon data, Eqs. (8) and (9). The overall delay is of order 79 h,
the Alboran mean sea level explains 21% of the Medi- comparable to the frictional adjustment time [Eq. (12)]
terranean mean sea level variance and the correlation of a storm surge due to the alongshore wind.
coefficient between the two time series is ⫽ 0.70. For Figure 7b shows the steady-state sea level from an
the simulation, the explained variance is 59% and the integration forced by the meridional wind y ⫽ 0.1 Pa.
correlation coefficient is ⫽ 0.80. The similarity of The Mediterranean–Atlantic sea level rise is of order
the Alboran and Mediterranean mean sea level time 4.6 cm, with most of this rise (⬇3.3 cm) once again
series provides a pathway for winds near Gibraltar occurring on the Atlantic side of the strait. For the370 JOURNAL OF PHYSICAL OCEANOGRAPHY VOLUME 37
FIG. 7. Simulated sea level change from the Atlantic to the Mediterranean for (left) zonal and (right) meridional wind forcings. (a)
Steady-state (day 40) response of the baseline configuration to a zonal wind stress x ⫽ 0.1 Pa. Contour intervals are 1 cm. (b) Same
as in (a) but for meridional wind stress y ⫽ 0.1 Pa. (c) Meridionally averaged steady-state sea level for the region shown in (a). Results
are from the baseline integration and from six sensitivity studies as indicated in the legend. (d) Same as in (c) but for the meridional
wind stress. (e) Time series of the meridionally averaged sea level difference between 7.5° and 5.5°W. Legend is as in (c). (f) Same as
in (e) but for the meridional wind stress. Note that time series in (e) and (f) exclude the sea level rise on the Atlantic side of Gibraltar
Strait so that they can be compared with the “no Mediterranean” sensitivity experiments.
meridional wind, the alongshore wind component on isobath. The delay of the sea level response is approxi-
the Atlantic side of Gibraltar Strait is much larger than mately 98 h, comparable to the theoretical prediction Tf
the along-strait wind component. Therefore, the re- ⬇ 90 h for y ⫽ 0.1 Pa from (12).
sponse is expected to be primarily due to the storm
c. Sensitivity experiments with steady wind forcing
surge solution in Eq. (11). Notice that to a first approxi-
mation, the Atlantic–Mediterranean sea level differ- To test the scaling predictions made in section 3, the
ence occurs west of Tangier, offshore from the 284-m results from 12 additional steady-state sensitivity ex-FEBRUARY 2007 MENEMENLIS ET AL. 371
TABLE 3. Summary of sea level difference and time delay for 12 sumption breaks down for depths greater than 50 m, the
numerical experiments forced by steady winds near Gibraltar thickness of the top level. Above the bottommost wet
Strait. Sea level difference is reported between 7.5° and 5.5°W.
level, the simulation employs a constant vertical viscos-
Delay is defined as the time taken for the sea level difference to
reach 63% of its steady-state value. The results presented in this ity of 1 ⫻ 10⫺3 m2 s⫺1. Therefore, the effective CD act-
table exclude the sea level rise on the Atlantic side of Gibraltar ing on the depth-averaged would tend to be larger as
Strait so that they can be compared with the “no Mediterranean” the wind stress y is decreased. As a consequence, for
sensitivity experiments. small y, the sea level and the frictional time scale from
Forcing Sea level Delay the numerical simulations will tend to be smaller than
Expt (Pa) (cm) (h) the analytic predictions in Eqs. (11) and (12) and the
Baseline x ⫽ 0.1 2.4 79
power-law dependence of the sea level difference to
y ⫽ 0.1 3.3 98 wind stress would tend to be closer to 1 than to 1⁄2.
Low stress x ⫽ 0.05 1.3 79
y ⫽ 0.05 1.8 95 2) HIGH DRAG
High drag x ⫽ 0.1 2.1 78
y ⫽ 0.1 2.8 90 In a second set of experiments, the bottom drag co-
Deep sill x ⫽ 0.1 2.0 79 efficient CD is doubled to a value of 0.004 as compared
y ⫽ 0.1 2.8 82 with a value of 0.002 in the baseline integration. A dou-
No Mediterranean x ⫽ 0.1 2.4 52 bling of the bottom drag coefficient is not expected to
y ⫽ 0.1 3.3 68
Deep shelf x ⫽ 0.1 2.4 97
impact the wind setup solution [Eqs. (4) and (6)], but it
y ⫽ 0.1 3.7 111 is expected to reduce the amplitude [Eq. (11)] and the
Trench x ⫽ 0.1 0.5 24 delay [Eq. (12)] of the storm surge solution. The ratios
y ⫽ 0.1 0.9 48 between the meridional baseline and the high-drag ex-
periments for the sea level difference and the delay are,
respectively, 1.2 and 1.1, which are lower than the ex-
periments, 6 with zonal wind forcing and 6 with meridi- pected value of 21/2. Once again, the proposed expla-
onal wind forcing, are compared with the two baseline nation for this discrepancy is that CD in the numerical
solutions in Fig. 7 and Table 3. simulations acts upon the bottom layer velocity only,
while Eqs. (11) and (12) were derived assuming that CD
1) LOW STRESS acts upon the depth-averaged velocity.
In a first set of experiments, the wind stress is re- 3) DEEP SILL
duced from 0.1 to 0.05 Pa. Relative to the baseline ex-
periments, the sea level difference between 7.5° and In a third set of experiments, the minimum depth of
5.5°W decreases from 2.4 to 1.3 for the zonal and from Gibraltar Strait is increased by 50% from 284 to 426 m.
3.3 to 1.8 for the meridional forcing. The ratio of the sea This leads to a decrease in the fraction of the Moroccan
level difference between the baseline and the low-stress coastal current that is able to cross Gibraltar Strait west
experiments is approximately 1.8, which is smaller than of Camarinal Sill. It also leads to a decrease in the sea
the predicted ratio of 2 for the wind setup solution in level difference comparable to that of the high-drag
Eq. (4) and larger than the predicted ratio of 21/2 for the experiment, which is consistent with the hypothesis that
storm surge solution from Eq. (11). The expectation, the wind-driven Atlantic–Mediterranean sea level dif-
especially for the meridional experiments, is that the ference is in part controlled by the depth of Camarinal
sea level response is dominated by the storm surge so- Sill.
lution. Therefore, the ratio should be closer to 21/2 than
4) NO MEDITERRANEAN
to 2. The time delay between the wind forcing and the
sea level difference is approximately the same for the In a fourth set of numerical experiments, Gibraltar
low-stress experiments as it is for the baseline experi- Strait is blocked at 5.3°W and the Mediterranean Sea is
ments (see Table 3). This is contrary to Eq. (12), which removed. As expected, the presence or absence of the
predicts that the frictional adjustment time is inversely Mediterranean Sea has no steady-state impact on the
proportional to the square root of the wind stress. Gibraltar Strait sea level. It does however impact the
Csanady (1974) provides a possible explanation for transient solution, as is seen from the differences be-
the above discrepancies by noting that as depth is in- tween the red and blue lines in Figs. 7e and 7f.
creased, the assumption of the bottom stress of form w First, the wind setup response to the zonal forcing
CD | |, which is used to derive Eqs. (11) and (12), does not cause an initial negative sea level response, as
breaks down. In the numerical simulations, this as- is the case for all of the experiments that include a372 JOURNAL OF PHYSICAL OCEANOGRAPHY VOLUME 37
Mediterranean Basin (see Fig. 7e). Instead, an initial Strait for the “baseline” and for the “trench” experi-
positive sea level response of approximately 6 mm is ments.
obtained. The expectation is that this fast response is The baseline experiments show that the Moroccan
dominated by the setup in Eq. (5) and the time scale coastal current is accelerated as it nears Tangier, that it
from Eq. (6). The 6-mm estimated sea level rise be- is deflected toward Gibraltar Strait, and that a fraction
tween 7.5° and 5.5°W is very close to that estimated for of this current is able to cross the strait immediately
a channel of constant width that has an along-channel west of Camarinal Sill near the 284-m isobath. The frac-
depth profile equal to the meridionally averaged depth tion of the Moroccan coastal current that is inshore of
of Gibraltar Strait and the adjoining regions (Fig. 5). It the 284-m isobath continues into the Strait of Gibraltar
is therefore estimated that for a steady zonal forcing of where it is in part dissipated in shallow coastal regions.
0.1 Pa, the setup due to the along-strait winds contrib- Notice that the alongshore currents are also established
utes approximately 25% of the Atlantic–Mediterranean along the Iberian coastline, southward flowing for zonal
sea level change between 7.5° and 5.5°W. forcing and northward flowing for meridional forcing,
Second, the time delay is reduced by approximately as expected. However, these currents are much weaker
30 h relative to the baseline integrations (see Table 3). than their Moroccan counterparts because of the lim-
This delay reduction corresponds to the time it takes to ited fetch of the Iberian continental shelf; hence, the
change the mean Mediterranean sea level following a Iberian coastal currents offer little resistance or ampli-
sea level disturbance on the western side of Gibraltar fication to the fraction of the Moroccan coastal currents
Strait and it is comparable to the theoretical expecta- that cross the strait near the 284-m isobath. The surface
tion of Th ⫹ Tb ⬇ 35 h estimated from Eqs. (8) and (9). pressure gradient associated with the portion of the
Moroccan current that crosses Gibraltar Strait contrib-
5) DEEP SHELF
utes approximately 1.5 cm of sea level rise to the zonal
In a fifth set of experiments, the Atlantic and Albo- wind experiment (Fig. 8a) and 2.5 cm to the meridional
ran continental shelves are lowered to 284 m, the depth wind experiment (Fig. 8b).
of Camarinal Sill. This deepening is expected to de- In the trench experiments (Figs. 8c and 8d), the same
crease the setup due to the along-strait wind [Eq. (4)] alongshore currents as in baseline experiments are es-
but to have a relatively small impact on the storm surge tablished. But contrary to the setup of the baseline ex-
due to the alongshore wind [Eqs. (11) and (12)]. In- periments, the Moroccan coastal currents are to a large
stead, the impact of a deeper shelf on the experiment extent unable to cross Gibraltar Strait. Instead, they are
forced with the meridional wind is to increase the time mostly deflected through the strait, where they are in
delay and the steady-state sea level difference by ap- part dissipated in shallow coastal regions and in part
proximately 12% relative to the baseline experiment. balanced by outflowing water inside the trench and on
The larger sea level difference occurs because the deep- the northern side of the strait. Therefore, while these
ening of the shelf provides a less convoluted path for currents affect the coastal sea level along the southern
the Moroccan coastal current to cross the opening of coast of Gibraltar Strait, they have a much smaller im-
Gibraltar Strait. The experiment forced by the zonal pact on the Atlantic–Mediterranean sea level differ-
wind shows very little change relative to the baseline. ence than they do in the baseline experiments.
We speculate that this is because the decrease in the The net Atlantic to Mediterranean sea level rise in
along-strait setup response due to the deeper shelves is the trench experiments is approximately 45% of that in
compensated for by an increase in the alongshore storm the baseline experiments (Figs. 7c and 7d). For the ex-
surge response. periment forced by the zonal wind, this may be due in
part to the along-strait wind setup. In particular, the net
6) TRENCH sea level change of the zonal wind trench experiment
In a sixth set of sensitivity experiments, the model (black line in Fig. 7c) is very similar to the theoretical
bathymetry includes a deep and narrow trench, 2 km estimate for the wind setup due to the along-strait wind
deep and 3.7 km (one model grid) wide, passing in a constant-width channel. The wind setup corre-
through the middle of Gibraltar Strait from the Atlantic sponding to Fig. 5, but with an average depth including
to the Mediterranean. The presence of this trench in- the trench, predicts a 1.2-cm sea level difference from
terrupts the Moroccan coast–Gulf of Cadiz current, re- 10°W to 0° as compared to 1.3 cm in the numerical
sulting in a much smaller Atlantic–Mediterranean sea simulation. For the meridional wind trench experiment,
level difference than any of the other experiments. Fig- the Atlantic–Mediterranean sea level difference may be
ure 8 shows depth-averaged currents near Gibraltar due in part to the fraction of the Moroccan coastalFEBRUARY 2007 MENEMENLIS ET AL. 373
FIG. 8. Depth-averaged currents near Gibraltar Strait for the “baseline” and for the “trench” experiments. (a),
(b) Currents for the baseline experiments, which have realistic bathymetry. (c), (d) The trench experiments, which
have a 2-km-deep and 3.7-km-wide trench in the middle of Gibraltar Strait. Both (a) and (c) are forced by steady
zonal wind x ⫽ 0.1 Pa and (b) and (d) are forced by steady meridional wind y ⫽ 0.1 Pa. The thin solid lines
represent the 285-m isobath in the model bathymetry. The length of the vectors is proportional to the current speed
and not to the vertical transport.
current that is not dissipated by frictional processes sition at the 60-h period. The latter corresponds to the
within Gibraltar Strait. transition from a negative to positive sea level anomaly
in the experiment forced by the steady zonal wind (blue
d. Sensitivity experiments with cyclical wind forcing line in Fig. 7e). For meridional forcing, there are peaks
at the 6-, 24-, and 54-h periods. A possible rectification
To further investigate the barotropic model’s re-
of the high-frequency response, that is, a small bias in
sponse, two final sets of numerical experiments have
the sea level response to high-frequency winds, is noted
been conducted. A first set of experiments is forced
but not investigated.
with spatially homogeneous but time-varying zonal
wind stress. The second set of experiments is forced
with spatially homogeneous but time-varying meridi- 5. Summary and concluding remarks
onal wind stress. In both sets of experiments the tem-
poral variation is sinusoidal with periods ranging from 6 Evidence presented here supports the hypothesis of
h to 28 days and an amplitude of 0.1 Pa. Figure 9 docu- Garrett (1983), García-Lafuente et al. (2002b), and Fu-
ments some of the results from these two sets of ex- kumori et al. (2007) that a significant fraction of the
periments. Atlantic–Mediterranean sea level difference variability,
At periods longer than 20 days, the transfer function excluding atmospheric pressure and seasonal cycle con-
of the sea level difference between 8.5° and 1.5°W to tributions, is a barotropic response to winds in the vi-
the surface wind stress asymptotes to 0.35 m Pa⫺1 with cinity of Gibraltar Strait. A high-resolution barotropic
a time lag of 3.5 days and to 0.4 m Pa⫺1 with a time lag numerical simulation forced by NCEP–NCAR reanaly-
of 4.5 days for, respectively, the zonal and meridional sis surface wind stress for the years 1992–2003 has a
wind forcing. These values are close to the steady-state Mediterranean mean sea level variability in the 20–360-
model response (the blue lines in Figs. 7e and 7f). day band that is significantly correlated with barometri-
At short periods, the model’s response is more com- cally corrected TOPEX/Poseidon data ( ⫽ 0.56) and
plicated. For zonal forcing, there is a peak in the trans- that explains 28% of the observed variance. This simu-
fer function at the 30-h period and a sharp phase tran- lation suggests that the wind-driven barotropic variabil-You can also read