Extragalactic Astronomy with a deep NIR Large Area Survey - some thoughts about...

Page created by Theodore Walters
 
CONTINUE READING
Extragalactic Astronomy with a deep NIR Large Area Survey - some thoughts about...
some thoughts about...

 Extragalactic Astronomy with
a deep NIR Large Area Survey

             Vladimir Avila-Reese
      Instituto de Astronomía, UNAM
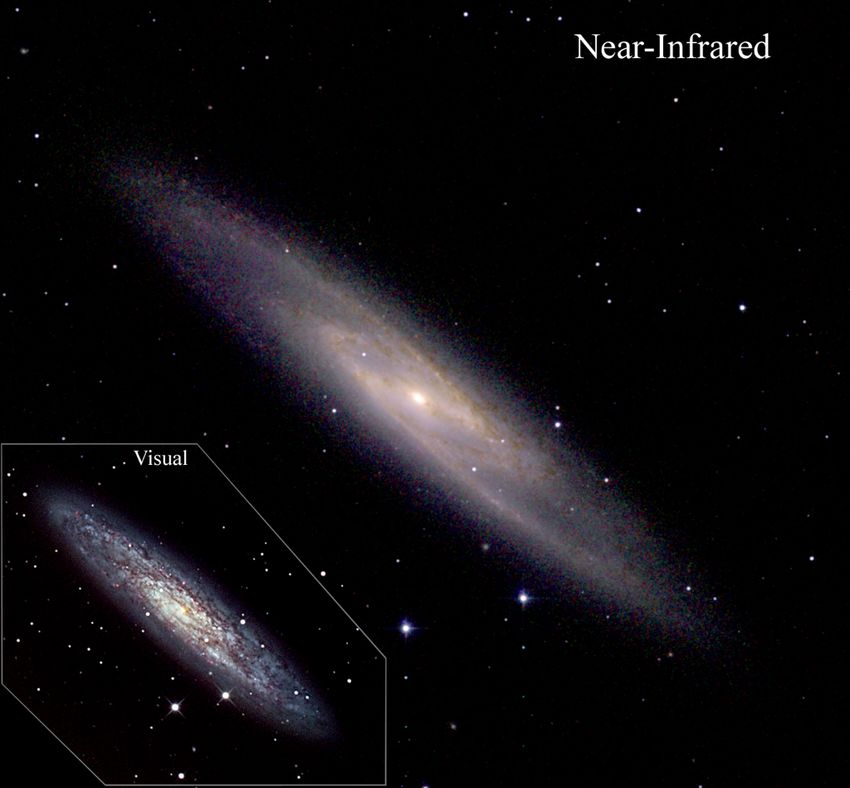
Extragalactic Astronomy with a deep NIR Large Area Survey - some thoughts about...
The context
            (only galaxies/ see other talks for QSO’s, clusters, lensing)

    There are several competitive current and future
    ‘static’ NIR surveys with science drivers focused
    on EG astronomy (UKIDSS www.ukidss.org/index.html ,VISTA
    www.vista.ac.uk/index.html   VIRMOS VDS www.oamp.fr/virmos/virmos_vvds.htm, etc.)
•   NIR traces Ms, the galaxy stellar structure, hot dust, and
    in combination with opt. bands, provide key information
    about the stellar pop’s.

•   High-z pop’s: e.g., already-in-place at z~1-3 L✴ E’s are revealed
    in NIR surveys; SF-ing giant galaxies at z>4-5; growth of
    structure and bias from z=3 to z=0 // but z is crucial!
Extragalactic Astronomy with a deep NIR Large Area Survey - some thoughts about...
What might be                      Sensitivity
the SASSIR                z~0                           z>0
strengths?      -Low    L, low SB pop’s -Sample completeness
                (dIrr, BCD, dSph, LSB). down to low L’s &
                                        SB’s (SMF up to z~4)
                -Outer galaxy regions -Galaxy evolution
                (structure, dust)       (K~22 for a L✴ E at z=3)

                         Sky area (large statistics)
                          z~0                           z>0
                -Morphology (T, bars,         -Clustering of different
                rings, shells,...) & global   pop’s at different z’s
                structure of gal’s (SB
                profiles, radii, B/D ratio,   -Statistics of rare objects
                CAS, lopsidness)              -LSS studies: correlations
                -Stellar scaling relations    functions, BAO’s, voids &
                -Environment corrtn’s         superclusters (ISW)
Extragalactic Astronomy with a deep NIR Large Area Survey - some thoughts about...
Spectral range
                                                                   z~0
                                                          -YJHK color-color traces                   z>0
                                                                                          - N I R c o l o r- c o l o r
                                                          SF activity & hot dust
                                                                                          diagram may select high-
                                                          -By combining with
                                                                                          z galaxy pop’s (gal. evol.).
                                                          opt. bands, full SP             -Opt. bands important for
                                                          description, age-Z              photometric z’s.
                                                          degeneracy broken
                                             Sasir

The dashed line shows the Euclidian number
counts relation, which goes as 10-0.6K, i.e. the
position of a survey relative to the line is a relative
measure of the volume of space surveyed. This
                                                                     Ultra Deep Survey?
illustrates, for example, that for surveys for brown
dwarfs 2MASS will detect many more than the
KPNO survey, and the LAS is an order of
magnitude bigger than 2MASS.
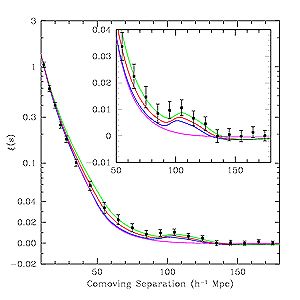
Extragalactic Astronomy with a deep NIR Large Area Survey - some thoughts about...
The local universe
  NIR M/L            ~ insensitive to                                                                                     o
                                                                                              Bell et al. 03 ApJS, 149, 249
galaxy or stellar type
  NIR light        ~ insensitive to
dust extinction
  K-correction in K-band ~
insensitive to galaxy type

 NIR traces well galaxy Ms &
       stellar structure
BUT, NIR sky SB (K:14-15) >>            but even in K-band, to estimate Ms, a color is needed!
outer SB of gal’s or even central
SB’s of low-L and LSB gal’s                            bar
                                                                                ‘ba
                                                                                   ryo
                                                             yon                      nic
                                                                ic g                     ’C
NIR bands are ideal for inferring                                      ala
                                                                          xie
                                                                                            DM
                                                                                                 ha
                                                                             s                     los
 stellar (and eventually baryonic)             stell
                                                    ar ga
                                                              laxie
      galaxy properties and                                        s

correlations, (i) to be compared
     with models, and (ii) to
                                            Baldry et al. 08, MNRAS
  determine the ‘efficiency’ of
    galaxy and star formation
The local universe
  NIR M/L            ~ insensitive to
                                                                                                       o
                                                                           Bell et al. 03 ApJS, 149, 249
galaxy or stellar type
  NIR light        ~ insensitive to
dust extinction
  K-correction in K-band ~
insensitive to galaxy type

 NIR traces well galaxy Ms &
       stellar structure
BUT, NIR sky SB (K:14-15) >>
outer SB of gal’s or even central       baryon and stellar fractions, a key constraint
SB’s of low-L and LSB gal’s                   to the galaxy formation models
                                                  bar
NIR bands are ideal for inferring
                                                 ?
                                                        yon
                                                           ic g
 stellar (and eventually baryonic)                             ala
                                                                  xie
                                                                     s
      galaxy properties and
correlations, (i) to be compared
     with models, and (ii) to
                                                                         Baldry et al. 08, MNRAS
  determine the ‘efficiency’ of
    galaxy and star formation
overed affect-                         from Fig. 2, it is assumed that any bias induced by this cut

                                                                                Galaxy L and Ms functions
 hat, for Pet-                         will be negligible.
der,
  d      when in-                                By estimating the area in this way, the assumption isK-band galaxies from UKIDSS LAS 5
                     2 A. J. Smith, J. Loveday & N. J. G. Cross
  ntly brighter                        that all SDSS target galaxies would be detected in the LAS,
                                                   ture fluxes, the ellipticity and the seeing, all made available
 icro-stepped,
1)                   Table 1. Sample sizesinofpart
                                       if   that         the
                                                          K-bandWSA  ofgalaxy
                                                                            the       sky
                                                                             (theluminosity
                                                                                      pipeline has  doesbeen
                                                                                                  functions.          surveyed.
                                                                                                              not measure  2 DATA          If this is not the
                                                                                                                                   the half-light
 this problem                          case, it          will have two effects: (1) particular
                                                   radius).                                                                                 types used
                                                                                                                           All of the galaxies          of galaxies
                                                                                                                                                              in this sample are drawn from the
 ) Given that                          will be underrepresented in the sample                                              main galaxy  (those samplewithin
                                                                                                                                                         of Data Release
                                                                                                                                                                     the 5 of the Sloan Digital

                                                                                                                                    effect of peculiar velocities:
et                                                                                                                         Sky Survey (SDSS; Adelman-McCarthy et al. 2007), from
,rs we have re-
                           Paper
                                       SDSS2.4
                           Loveday (2000)
                                                    completenessNumber of galaxies in sample
                                                               Surface brightness      limits but outside
                                                                                                      345
                                                                                                                               thethe
                                                                                                                           which      limitsopticalfor     the LAS)
                                                                                                                                                       photometry      and spectroscopic redshifts              K r 
     -Petrosian K mag and r limits--> SB fainter than 20.4m/
                  in the UKIDSS Large Area Survey,
                  Table   2 shows
                  investigation
                                             23 mag
                                        the various
                                 of surface
                                                    P
                                                brightnesslimits
                                                                       while leaving detailed
                                                         arcsec−2 , so we assume the limit in SDSS surface
                                                                             on theand
                                                                  completeness               sample.
                                                                                                the very
                                                                                                                       spectroscopic redshifts
                                                                                                                                            ☐
                                                                                                                       Petrosian magnitudes brighter
                                                                                                                                                          (zConf > 0.8) and with de-reddened
                                                                                                                                                             effect than
                                                                                                                                                                     of peculiar
                                                                                                                                                                           r = 17.6velocities, which are not taken into account.
                                                                                                                                                                                        is 391 052.
                                             brightness
                  faint-end of the luminosity function to future
                                                                adds       no     further        incompleteness
                                                                                        work. (in principle) ofOfbuilding
                                                                                                                             to   the
                                                                                                                            these,such
                                                                                                                                         sample,
                                                                                                                                      384a617                Note that this
                                                                                                                                                   are spectroscopically         limitaswould
                                                                                                                                                                            classified          need to be relaxed in order to
                                                                                                                                                                                          galaxies.
     1   INTRODUCTION
                                             once the magnitudeThe                    advantages
                                                                                 limits      in r and K and the surface                     census
                                                                                                                                          bright-
overed affect-                         from Fig. 2, it is assumed that any bias induced by this cut

                                                                              Galaxy L and Ms functions
 hat, for Pet-                         will be negligible.
der,
  d      when in-                                By estimating the area in this way, the assumption isK-band galaxies from UKIDSS LAS 5
                     2 A. J. Smith, J. Loveday & N. J. G. Cross
  ntly brighter                        that all SDSS target galaxies would be detected in the LAS,
                                                   ture fluxes, the ellipticity and the seeing, all made available
 icro-stepped,
1)                   Table 1. Sample sizesinofpart
                                       if   that         the
                                                          K-bandWSA  ofgalaxy
                                                                            the       sky
                                                                             (theluminosity
                                                                                      pipeline has  doesbeen
                                                                                                  functions.          surveyed.
                                                                                                              not measure  2 DATA          If this is not the
                                                                                                                                   the half-light
 this problem                          case, it          will have two effects: (1) particular
                                                   radius).                                                                                 types used
                                                                                                                           All of the galaxies          of galaxies
                                                                                                                                                              in this sample are drawn from the
 ) Given that                          will be underrepresented in the sample                                              main galaxy  (those samplewithin
                                                                                                                                                         of Data Release
                                                                                                                                                                     the 5 of the Sloan Digital

                                                                                                                                 effect of peculiar velocities:
et                                                                                                                         Sky Survey (SDSS; Adelman-McCarthy et al. 2007), from
,rs we have re-
                           Paper
                                       SDSS2.4
                           Loveday (2000)
                                                    completenessNumber of galaxies in sample
                                                               Surface brightness      limits but outside
                                                                                                      345
                                                                                                                               thethe
                                                                                                                           which      limitsopticalfor     the LAS)
                                                                                                                                                       photometry      and spectroscopic redshifts             K                                                                                                                                                                µe,K                                -       21 mag arcsec−2
                                ing good     agreement
                                                    The with       previous      results.    Possible     improvements    a are   discussed     e ! targeted for spectroscopy in the SDSS
                                                                                                                                            µthat
ce -fainter than K=16, deviates from the Euclidean slope
                  discussion about     possible     low-surface
                                                             SDSS      brightness
                                                                          main             incomplete-
                                                                                      galaxy        sample        hasnumber   limit of of
                                                                                                                                        galaxies
                                could   be implemented        when    extending        this analysis                   LAS. galaxy sample. But firstµthe
                                                                                                          to the full main                                         e,r size of this sample must -           24.5 mag arcsec−2
            effectness in 2MASS
                    of peculiar      (Andreon24.5 2002),
                                    velocities,     magwhich   which
                                                            arcsec  are−2 would
                                                                           not        affect
                                                                                    taken
                                                                              (Strauss         etthe
                                                                                                 intoal.low-
                                                                                                           account.
                                                                                                           2002). This          limit is taken
e, -sky brightness in K + LAS depth--> r 
     -Petrosian K mag and r limits--> SB fainter than 20.4m/
                  in the UKIDSS Large Area Survey,
                  Table   2 shows
                  investigation
                                             23 mag
                                        the various
                                 of surface
                                                    P
                                                brightnesslimits
                                                                       while leaving detailed
                                                         arcsec−2 , so we assume the limit in SDSS surface
                                                                             on theand
                                                                  completeness               sample.
                                                                                                the very
                                                                                                                       spectroscopic redshifts
                                                                                                                                            ☐
                                                                                                                       Petrosian magnitudes brighter
                                                                                                                                                          (zConf > 0.8) and with de-reddened
                                                                                                                                                             effect than
                                                                                                                                                                     of peculiar
                                                                                                                                                                           r = 17.6velocities, which are not taken into account.
                                                                                                                                                                                        is 391 052.
                                             brightness
                  faint-end of the luminosity function to future
                                                                adds       no     further        incompleteness
                                                                                        work. (in principle) ofOfbuilding
                                                                                                                             to   the
                                                                                                                            these,such
                                                                                                                                         sample,
                                                                                                                                      384a617                Note that this
                                                                                                                                                   are spectroscopically         limitaswould
                                                                                                                                                                            classified          need to be relaxed in order to
                                                                                                                                                                                          galaxies.
     1   INTRODUCTION
                                             once the magnitudeThe                    advantages
                                                                                 limits      in r and K and the surface                     census
                                                                                                                                          bright-
P = 0.18, and (3) making the LF 0.22 mag brighter in mag-
                   K-band galaxies from UKIDSS LAS 9
          nitude, to convert from 0.1 r to r. Schechter function parame-

                   ?
          ters are M ∗ − 5 log h = −20.32 ± 0.04, α = −0.87 ± 0.05 and
          φ∗ = (0.0216 ± 0.0010)h3 Mpc−3 .

                                                                                                                         red
                                                                                                          K-band galaxies from UKIDSS LAS                       13

                                                                                                   Intrinsic   or incompleteness? Detection of red-
                                                                                                    Figure 19. K-band (left) and r-band LFs for red and blue galax-
f
    Figure
           Figure 12.        K-band luminosity function for the whole sam-
               12. K-band luminosity function for the whole sam-                                   core    low-Lthe
                                                                                                    ies, showing gal’s is LF
                                                                                                                    total affected
                                                                                                                             as well. by the mag, r, and SB limits
e         ple, with a compendium of published results from observations
a
e
    ple, with    a compendium
          or semi-analytic
    or semi-analytic
          Schechter function
                               models.
                          models.
                                         of Only
                                   fit, Only
                                             published
                                         i.e., Mthe
                                                            results
                                                   the filled  pointsfrom   observations
                                                                       are used   in the
                                                       filled points are used in the
                                                  K − 5 log h < −20; the unfilled
                                                                                                                 faint            Stellar mass function
-   Schechter
          points function
         Figure   are likelyBBD
                    17.        fit,
                              to      i.e.,from
                                 suffer
                                     for     MK
                                           red  some− 5incompleteness
                                                galaxies,     h  2.35.
d   pointsbrightness
                 likelyorto
                          red,
             arebest-fitting    low-luminosity
                             suffer    from some    galaxies.  Schechter
                                                      incompleteness       function  pa- −           ing off of the luminosity–surface brightness relation at high
         The                 ∗
                               Cho"   loniewski    function,    estimatedof   low-surface
                                                                            using   M K
t         rameters
    brightness    or are
                     red,      − 5 log h = −23.17
                          Mlow-luminosity               ± 0.04,Schechter
                                                   galaxies.     α = −0.81function
                                                                             ± 0.04 andpa-           luminosities, suggesting that this division reflects a property

                                                                                                              ?
         5 log  h < −20 and µe,abs
            ∗ = (0.0176 ± 0.0009)h
                                               < 19, is shown by the red dotted
                                         3 Mpc−3 .
f         φ             ∗ − 5 log hof=the    −23.17   ± 0.04,                                        of the underlying population. Moreover, the Cho"loniewski
    rameters    are M
         contours.    Parameters                fit are   M ∗ −α5 = log−0.81   ± 0.04mag,
                                                                        h = −22.88     and
    φ∗ =α(0.0176         ∗ = 0.0121h
             = 0.17,±φ0.0009)h        3 Mpc    −3 .−3
                                            3 Mpc     , µ∗e,abs = 17.09 mag arcsec−2 ,               function appears to fit the blue BBD much better than it fits
                       0.570 mag arcsec−2                                                            the BBD for the whole sample. However, we caution that the
          σµe,abs =
       Equation (1) can be writtenand  as β = −0.012.
                                                                                                     lack of red-core galaxies with MK − 5 log h > −20 could be
                            “ r ”2
    Equation (1) can   be written                                                                    a symptom of the incompleteness identified in Fig. 10, while
                                    .asfunction. Only the filled points
                                P
       µe " K  + 2.5
             Figure
                     log
                     20.
                         2π
                          Stellar
           Figs. 17–19 show    2  mass
                                the K-band    BBD   and  K-    and
                                                                    (15)are
                                                                   r-band                          Figure   21. ofStellar
                                                                                                     the lack       suchmass     function,
                                                                                                                            galaxies       using
                                                                                                                                        with      various
                                                                                                                                               µe,abs      19.5 mag arcsec−2
                                                                                                                                                       > mass-to-light       rare
                         “ ”

                                                                                                                                                                            ?
        LFs     used in the Schechter
              split   by   the  SDSS rP rest-frame
                                           2 function fit, i.e.,
                                                        u−r       stellar mass greater than
                                                            −2 PSF colour. The space
                                                                                                   ratios and the default kcorrect mass, which is derived from the
                                                                                                     could be due to the low-surface brightness limit for de Vau-
    µe " K +102.5 hlog M
         For  K=16 9.5   and
                         −2     µ   =    19.5 . points are likely
                             2π" ;e the unfilled
                                              mag   arcsec      ,  this to
                                                                         corresponds       (15)
                                                                                           to
                                                                            suffer from some       template fit to the input (ugriz) absolute magnitudes. Masses
        density
         a limit   is    Petrosianof2by
                    inestimated
                incompleteness             summing
                                        radius    of 4.0
                                         low-surface    the   weights
                                                          arcsec,
                                                      brightness          of galaxies
                                                                      considerably
                                                                     galaxies.  Masses lesswith
                                                                                          calcu-     couleursfrom
                                                                                                   calculated   profile   galaxies.
                                                                                                                    the K-band     kcorrect mass-to-light ratios have
           − rthe
    For uK=16
         than    >and
                lated 62.35µe or
                        from
                         arcsecthe  u   − intrinsic
                                    K-band
                                =limit
                                     19.5  rmag
                                              <    2.35
                                              kcorrectto for
                                                   arcsec      red
                                                           −2data;     and
                                                           mass-to-light
                                                         the   , −2this only  blue
                                                                             ratios   galaxies
                                                                                     have
                                                                               for surface
                                                                          corresponds      been
                                                                                              to           The LFs
                                                                                                   been increased      show
                                                                                                                   by 0.1  dex. a sharp division, with red-core galax-
                increased
        respectively,         by   0.1
                            with than  dex.
                                    jackknifeSchechter   function     parameters     are  found
         brightness
    a limit              fainter
             intoPetrosian
                     be log(M∗ hradius
                                     2 /M ) =  oferrors
                                           20.38   mag
                                                  10.44 ±
                                                           estimated
                                                    4.0 arcsec
                                                         arcsec,      doessubsequently.
                                                                              the 6 arcsec
                                                            0.02, α considerably
                                                                       = −1.02 ± 0.04 less
                                                                                                     ies more abundant than blue-core galaxies by an order of
         largeThe
                radiusBBD     for dominate.
                           limit           "
                                    red galaxies,      excluding outliers, showsand           no     magnitude
                                                                                                   masses   derivedat  high
                                                                                                                    from   theluminosity
                                                                                                                                K-band M/L   (and   vice
                                                                                                                                                ratios    versa at
                                                                                                                                                       compared      low lumi-
                                                                                                                                                                   with
    than the 6φ arcsec
                  ∗  = (0.0112limit     intrinsic
                                  ± 0.0007)h   3  Mpcto the
                                                      −3
                                                               data;
                                                         . Stellar       onlybased
                                                                     masses      for surface
                                                                                      on other
        evidence
               Fig.
                IMFs  9ofalso
                            a correlation
                         have  shows            between
                                         the best-fitting
                                been reduced                 luminosity
                                                             Cho"
                                                 for comparison  −2 lwith  our and
                                                                     oniewski     fit tosurface
                                                                                results,  the
                                                                                          based      nosity),
                                                                                                   the  masses and   with
                                                                                                                derived  fromthethebright
                                                                                                                                    opticalend   of the
                                                                                                                                            bands.  The LF    around
                                                                                                                                                          precise cause 0.8 mag
    brightness fainter than 20.38 mag arcsec                         does the 6 arcsec
• A NIR survey with both a very large area and high sensitivity (depth of
    K~21)* will allow to reconstruct the local NIR bivariate L/SB function (i)
    down to the dwarf galaxy pop and including LSB galaxies, (ii) with
    enough statistics for determining accurately the LF bright end (rare gal’s)
    and for (iii) allowing to separate the LF function by galaxy types, colors,
    and environments (1200 nights for 3E4deg2 at J=20, K=18.4 in a 4m telescope;
                                                                    UKIDSS-LAS will be for only 4E3deg2)

                                                                    •Redshifts     are necessary; for local galaxies
                                                                    (z
The dwarf galaxy population (building blocks)

                                                     from Vaduvescu PhD thesis
•What is the abundance and the LF faint-end of different types of dwarf gal’s?
What is the minimum Ms of galaxies?
•How is the distribution of dwarfs in clusters, groups, filaments and voids?
•How is the stellar structure of dIrr’s, BCDs and dS’s?

NIR: mass, structure. Deep, LA surveys are necessary to explore
   dwarfs in the local volume and in different environments.
Some results from Vaduvescu thesis; Vaduvescu, Richer & McCall 06, AJ, 131
SPM observations. Careful photometric analysis. NIR SB profiles: sech law.

                                                        dE and dSph are probably old
                                                         fossils (or formed by tidal
                                                                 destruction?)

                                                         What about dIrr, BCD, dS?
                                                        BCD are dIrr in bursting phase
                                                           and dE are fading dIrr?

                                                           Key constraints to the
                                   kinematics!              LCDM model (see
                                                             Valenzuela’s talk)
Baryonic quantities, the ultimate goal

   To fully understand galaxy
formation & evolution, we need
to constrain stars, gas, and dust

Synergy of NIR surveys                   Baryonic
with HI surveys --> the
 real mass backbone of
                                          Stellar
        galaxies
Disk galaxy scaling relations                        4.2. The stellar scaling relations
                                                     The main changes as passing from the baryo
                                                  stellar
     Avila-Reese, Zavala, Firmani, Hernandez-Toledo,  AJ, in scaling   correlations
                                                              press; (Zavala,      A-R,H-T,are    the 03,
                                                                                              Firmani  decrease
                                                                                                           A&A) of
                                                  and intrinsic scatter in the Vm -M correlations.
2.6
                B                   2.6
                                                 Kters of the R-M and R-Vm correlations also
2.4                                 2.4           but   the           Very
                                                               significances      reduced
                                                                                  of  the          number
                                                                                            differences    are very
                                                  More interesting,of        the‘useful’        galaxies
                                                                                    (weak) anticorrelation              be
2.2                                 2.2           residuals of the baryonic Vm -Mbar and Rbar -M
   2                                   2                                  The TF relations
                                                  relations tends to dissapear in the stellar case,
                                                  lated to other of our results, namely that the
1.8            sl=0.314 (2.77)      1.8         sl=0.261
                                                  disk surface
                                                           (3.67)   •The     bar TFR is steeper than the
                                                                     density) is a third parameter in
                σintr=0.063                       σintr=0.049
                                                  onic    TFR       st one.
                                                                  but  not anymore in the stellar one.
1.6                                 1.6
                                               10 differences
                                                                    •Intrinsic
                                                                   are
                                                                                 scatters: change from bar to st
      9       10         11              9                11
                                                                    and to K-bandto
                                                                        related           the gas (or stellar) m
                                                                                        cases
                                                  tion of galaxies, •Crucialshowing        that the
                                                                               for constraining    modelsmass infa
                                                  histories vary systematically
                                                                          16                    among galaxies.
                                                                                                            Avila-Reese et al.

                                                  variations consistent with galaxy models bas
                                                                                 0
2.6
                St                  2.6
                                               Bar
2.4                                 2.4           ΛCDM framework?
                                                     Let us first discuss            in more detail the chan

                                                                                                                                                 ?
                                                                             -0.2
2.2                                 2.2           slope of the Vm -M relation. If the stellar m
   2                                   2          tion, fs = 1 − fg , depends on Ms as fs ∝ M
                                                  Mbar = Ms /fs ∝ -0.4       Ms 1−β . Therefore,
                                                                                            f
                                                                                                   M       from Vm             s
1.8             sl=0.274 (3.40)     1.8         sl=0.306 (3.00)                                =                s

                  σintr=0.045                     one   passes
                                                 σintr=0.051       to  V m   ∝    M   s          . In the left pan
                                                                                        α(1−β)M + M                       s        g

1.6                                 1.6           7, fs vs Ms is plotted     -0.6
                                                                                       for our galaxy sample.
      9       10         11              9     10         11
                                                  with a high scatter, fs9 correlates       10     11 with
                                                                                                        1.5 M 2 2.5rou
                                                                                                                   s
                            filled: HSB empty: LSB                                          €
                            ❍: red         ∆: blue                            fs = 0.65(Ms /1010M" )0.13 ,
                                                                                  Fig. 7.— Stellar fraction fs vs Ms , Σs,0 , and (B − K). Solid and empty sy
                                                                                galaxies are represented with circles, while blue galaxies with triangles. The solid
                                                                                are from models by FA00.
The radius-M (-L) relations
  1                                1
                                                              •Scattered   and segregated by
                                                              SB, and less by color
0.5                              0.5
                                                              •Slopes around 0.3, but for the
                                                              B band case, 0.44. ☛
  0                                0
                 sl=0.441                         sl=0.285
                σintr=0.19                       σintr=0.20
      9   10      11                   9    10      11
                                                              A wide range in SB is
                                                              crucial for this relation.
                                                              Most of previous similar
  1                                1                          samples did not include
                                                              LSB gal’s
0.5                              0.5

                                                              Scaling relations are fossils of:
                                                              cosmological initial conditions
  0
                 sl=0.310          0
                                                  sl=0.322
                                                              + gal. evolution + SP evolution.
                σintr=0.19                       σintr=0.20
                                                              Observational constraints
      9   10      11                   9    10      11
                                                              (including early-types) are yet
                   filled: HSB empty: LSB
                                                              very limited. Even scatters are
                   ❍: red         ∆: blue                     highly informative
Trends among the residuals

                  ✤In  the bar case there is a (weak)
                  anti-correlation: sl=-0.15. The level
-0.5   baryonic   of dependence of Vm on the disk
                  surface density decreases as SB
                  decreases (the halo becomes
                  dominant). Could MOND explain this?
                  ✤The anti-corr’n disappears in the
                  st and L cases. Why? (A SF effect)
       stellar
                  ✤The     B-band TFR residuals
                  increase as the gal’s are deviated
                  to the redder side (Kannappan+ 02).
                  For a given LK, the bluer the color,
       K band     the larger LB.
                  ✤The bar TFR residuals are larger
                  for gal’s that end with higher st.
                  fractions (formed earlier and/or
                  had an efficient SF)
       B band
                  The scaling rel’s change for luminous,
                  stellar, and baryonic quantities: clues to
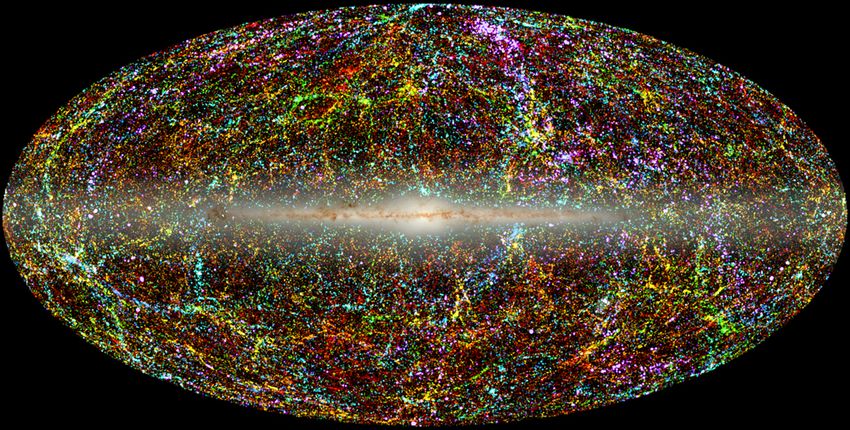
                  models of gal. formation and cosmology
The stellar structure of galaxies in the NIR
•NIR   morphology is different to the optical ones (de Blok, Puerari,...):
morphological reclassification.    B/D ratio and dust corrections
•NIR  bar and bulge statistics (z~0 and z>0 and as a function of
environment): secular evolution of galaxies & dynamical history (Hernandez-Toledo+)

                              NIR                        •NIR CAS parameters &
                              •not floculent arms        lopsideness statistics:
                              •a clear bar               galaxy assembly history,
                                                         dark matter halo structure
                                                         and sub-structure, etc.
                                                         (Hernandez-Toledo+,
                                                         Valenzuela+)
                                                         •Outer stellar disks
                                                         structure -cutoff?, warps
                                                         •Color gradients: inside
                                                         out formation, secular mass
                                                         redistribution, dust gradient?
                                  NGC 253
                                                         •LSB galaxy stellar
                                                         structure
CB07 models
                       MNRAS, 384,930

Colours of SF-ing galaxies are poorly understood.
5800 SDSS/UKIDSS late-type local galaxies
-More strongly SF-ing galaxies have redder H-K color.
-The more dust attenuation, the redder H-K
-TP-AGB stars dominate the H & K bands following a
SF burst.
-TP-AGB stars are the main source of dust in nuclear
region of the galaxy
                            SFing

                                                                              non-SFing

-Models: g-r vs Y-K could break         divided by age         divided by Z
the age-Z degeneracy.

-Data: marginally. Y-K is metal
sensitive (see also Galay+02)
NIR photometry is very useful for understanding the
    physics of interacting galaxies (several of their
underlaying properties are distorted in optical bands): a
deep and extensive NIR catalogue of these galaxies is
                       desirable
NIR colors as probes of interacting galaxies
                    (Geller et al. 06, AJ, 132, 2243)
      interacting              isolated control sample

                                                         Hot dust could be a new tracer of SF in
                                                          compact dust-enshrouded bursts. The
                                                           z=0 SFRD could be underestimated
The z>0 universe
A large area survey of well-defined mass-tracing objects (e.g.,
galaxies in the NIR) in a given z-range is useful for several LSS and
structure formation problems.

--Baryonic Acoustic Oscillations (e.g. SDSS-III): dA at z=0.3, 0.6 & 2.5

            ~150 Mpc, z=0.3
  Used to measure dark energy
          properties
Imprint of superstructures in the CMBR due to
     the ‘late-time’ Integrated Sach-Wolfe (ISW) effect
                                            Accelerated expansion due to dark energy (z
                           depends on DE    gravitational z--> secondary anysotropies in the CMBR:
                                            cross-correlate with LSS at the z of the effect.
Rudnick+07ApJ, 671                         The ISW signal peaks at l~20 and z=0.5: superstructures
                                           of ~4deg or 100 Mpc/h
                                                               Granett+ 0805.3695 (LRG in SDSS)
   1.4Ghz radio sources from NVSS

              140 Mpc hole @ the
                CMBR cold spot
                                           Measurement of DE parameters
                                            Test of cosmological models
Evolution of the K-band LF (UKIDSS-UDS)
For high-z studies,
z determination is
   demandatory
Cirasuolo + 08, 08043471

  Downsizing:
  bright/massive gal’s are
 assembled at high z (1-3)
    and then passively
     evolve, while the
formation of less L gal’s is
  progressively shifted to
         lower z’s
Models vs
observations:
   a great
  challenge
et al. (2001) in Figure 1, we estimate that the effective sky                         2001), there is evidence of clustering, particularly a dip around
 coverage of the parent sample is 650 deg2, with an error of                           z p 0.04 and a sharp peak around z p 0.06. Therefore, the

      Evolution of the galaxy pair fraction (merging rate)
 ∼5%. We ignore this error because it is much smaller than other                       fluctuations of the LF of paired galaxies around the smooth
 errors. Given our pair selection criteria, both components of a                       Schechter function (e.g., the excess at MK p !22.75) are pos-
 pair have the same Vmax determined by the Ks magnitude of the                         sibly1094due to this effect.                                                          RAWAT ET AL.                                                               Vol. 681
                                                                                          The stellar masses, corresponding to the absolute eterized                                     magnitude by their redshift flag). So in cases in which the neighbor
                                                                                       bins of the LF, are also listed in Table 1. Following has                                          Kochanek
                                                                                    Local pair fraction as a function
                                                                                                                                                                                             a VVDS redshift flag 2 (75% confidence) or worse, there is a
                                                                                       et al. (2001) and Cole et al. (2001), we first translate themuch                                         greater risk of the pair being designated as having discor-
                                                                                                                                                                                           isophotal
                                                                                                                                                                                        dant redshifts. In addition to this, one also has to allow for the
                                                                                       Ks magnitude to the “total” Ks magnitude (dK s p 0.2 fact
                                                                                     of L or M in K-band (2MASS)
                                                                                       assume the conversion factor of Mstar /L K p 1.32 M, shift
                                                                                                                                                                                        mag),       thenof the pairs using redshifts from the other two red-
                                                                                                                                                                                              that some
                                                                                                                                                                                        /L catalogs
                                                                                                                                                                                                 whichcan also be erroneously counted as discordant (for
                                                                                                                                                                                        the ,same reason as above). Such pairs account for "15/45 discor-
                                                                                       is
                                                                                       Thefor     a Salpeter
                                                                                           Astrophysical     Journal,initial        mass2008
                                                                                                                        681:1089Y1098,          function
                                                                                                                                                      July 10 (Cole et al. 2001). The
                                                                                                                                                                                        dant redshift pairs in the z band. This can significantly swing the
                                                                                     Xu+04, ApJ 603
                                                                                       # 2008. The American Astronomical Society. All rights reserved. Printed in U.S.A.
                                                                                       differential         pair     fraction         function             (Table       1   and     Fig.  2) isofcal-
                                                                                                                                                                                        number         pairs with discordant redshifts. If we discard these
                                                                                                                                                                                        15 discordant cases and recalculate the contamination rate, we
                                                                                       culated using the Schechter functions of the paired                                              get galaxies
                                                                                                                                                                                             60% # 14% as the contamination rate, which is in much bet-
                                                                                       and of 2MASS galaxies (Kochanek et al. 2001) interthe                                                      lumi-with the contamination rate of 42% # 6:3% that
                                                                                                                                                                                            agreement
                                                                                                                                                                                        we have obtained using our statistically estimated foreground/
                                                                                       nosity/mass rangeTOWARD            coveredAbyROBUST          the paired   ESTIMATEgalaxyOF    sample,
                                                                                                                                                                                        THE         with
                                                                                                                                                                                                 MERGER
                                                                                                                                                                                        background
                                                                                                                                                                                                                  RATE EVOLUTION
                                                                                                                                                                                                         contamination.
                                                                                       the error estimated from the quadratic sum of the error               USING        NEAR-IR       PHOTOMETRY
                                                                                                                                                                                           In a of    the our contamination calculation is robust, and the
                                                                                                                                                                                                 nutshell,
                                                                                       LF of paired galaxiesA. and                  Rawat,      1, 2
                                                                                                                                              its deviation
                                                                                                                                                       Francois Hammer,          2
                                                                                                                                                                          from Ajit     contamination
                                                                                                                                                                                    the K.   Kembhavi,1rate
                                                                                                                                                                                          Schechter           andcompares
                                                                                                                                                                                                                    Hectorwell     with2 the contamination rate
                                                                                                                                                                                                                               Flores
                                                                                                                                                                                        reported   in  literature,
                                                                                                                                                            Received 2007 June 19; accepted 2008 March 31
                                                                                                                                                                                                                   as well as  with  the subsample of our major
                                                                                       function. The last bin is not included                                      because therepairs      is where
                                                                                                                                                                                                onlyweahave spectroscopic redshifts for both members of
                                                                                       single galaxy in the bin, and therefore the value is toothe                                           pair. Also, as a result of our eagerness to throw out prospec-
                                                                                                                                                                                          uncertain.
                                                                                                                                                                                        tive pairs as having discordant redshifts due to spurious redshift
                                                                                                                                                                               ABSTRACT
                                                                                       Although error bars are substantial, some general trends                                                       canin some cases, we are going to end up with an es-
                                                                                       be identified
                                                                                                       We use solid:
                                                                                                               in Figure
                                                                                                                            K-band
                                                                                                                  a combination         of deep, high angular resolution imaging
                                                                                                                                   2. Unlike              the    LF ofthe2MASS
                                                                                                                                                                                        determination
                                                                                                                                                                                                  data
                                                                                                                                                                                           galaxies,
                                                                                                                                                                                        timate   of      fromfraction
                                                                                                                                                                                                     merger     the CDFS
                                                                                                                                                                                                                       that is(HST/ACS      GOODS
                                                                                                                                                                                                                                a bit too low, and thussurvey)
                                                                                                                                                                                                                                                        it should
                                                                                       the LFFig.   0:2  !  dashed:
                                                                                                    and ground-based
                                                                                                    of6.—Histogram
                                                                                                         paired
                                                                                                            z ! 1:2.  galaxies
                                                                                                                       of We
                                                                                                                               z-band
                                                                                                                              near-IR
                                                                                                                               $ z has
                                                                                                                          (z select
                                                                                                                               host
                                                                                                                                            Ks images
                                                                                                                                        )/(1 þ za negative
                                                                                                                                        galaxies
                                                                                                                                      neigh            solely
                                                                                                                                                     ) for
                                                                                                                                                  host
                                                                                                                                                             to derive
                                                                                                                                                           the 65on    slope
                                                                                                                                                                      the
                                                                                                                                                                  major   basis
                                                                                                                                                                        pairs
                                                                                                                                                                                evolution
                                                                                                                                                                                 in
                                                                                                                                                                                        be of
                                                                                                                                                                                     the faint
                                                                                                                                                                                 of their
                                                                                                                                                                              where
                                                                                                                                                                                                the
                                                                                                                                                                                            treated
                                                                                                                                                                                          J-bandend,
                                                                                                                                                                                                     galaxy
                                                                                                                                                                                                      as  a    major
                                                                                                                                                                                                            lower       merger
                                                                                                                                                                                                                   limit.         rate  in the  redshift range
                                                                                                                                                                                                     rest-frame absolute magnitude, which is a good
                                                                                                                                                                                 % redshift, 5.3.   Source    Blendin g and
                                                                                                                                                                                                                          /(1    þ z) 3:43#0:49
                                                                                                                                                                                                                               Photometric   Completeness
                                                                                       suggesting
                                                                                               both tracer
                                                                                                           that galaxies with
                                                                                                    membersof   the
                                                                                                             have    stellar   mass.
                                                                                                                  a spectroscopic        We
                                                                                                                                  redshift.    find
                                                                                                                                            Note
                                                                                               !z/(1 þ z) % 0:006 as seen in the figure. Most
                                                                                                                                                   low stellar mass are less likely
                                                                                                                                                       steep
                                                                                                                                                  that only 20 pairs have $0:006
                                                                                                                                                                evolution     with
                                                                                                                                                 other pairs have !z/(1 þ z) much
                                                                                                                                             2:18#0:18
                                                                                                                                                                                               with   the merger     rate                         for optically
                                                                                                   largerselected
                                                                                                          than 0.006pairs
                                                                                                                    so that and   /(1
                                                                                                                            they are     þthe
                                                                                                                                     out of z) frame.    for pairs selected in the near-IR.
                                                                                                                                                                                          A major Ourbias result     is unlikely
                                                                                                                                                                                                           when studying         close  to pairs
                                                                                                                                                                                                                                           be affected     by may
                                                                                                                                                                                                                                                  of objects   lumi-be
                                                                                                        nosity evolution that is relatively modest when using rest-frame               causedJ-band      selection.
                                                                                                                                                                                                by the fact that sourcesTheare apparently
                                                                                                                                                                                                                                   blended when  more   rapid
                                                                                                                                                                                                                                                      their     evo-
                                                                                                                                                                                                                                                            separation
                                                                                                        lution that we find in the visible TABLE 2 is likely   caused   by   biases    is comparable
                                                                                                                                                                                     relating   to      to the
                                                                                                                                                                                                   incompletenessPSF.  It  particularly
                                                                                                                                                                                                                           and  spatial     affects ground-based
                                                                                                                                                                                                                                            resolution     affectingKs
                                                                                                                                                                                                                                  00
                                                                                                      Inthe
                                                                                                          Figure   6  many  objects
                                                                                                             ground-based near-IR     have    !z/(1  þ
                                                                                                                                            photometry, z)  much   larger than
                                                                                                                                                              underestimating          images    because
                                                                                                                                                                                    pair counts at higher the  K  s PSF   ("0.5      ) is much   larger
                                                                                                                                                                                                                   redshifts in the near-IR. The major   than the  HST
                                                                                                   0.006  (so Paremeters
                                                                                                               much              of Schechter     out ofatFunction            Ks LF
                                                                                                                                                                         of 6).                              00
    Fig. 2.—Ks-band LFs and stellar mass functions and differential pair fraction                       merger    ratesowas
                                                                                                                        that most
                                                                                                                             $5.6oftimes
                                                                                                                                       them are
                                                                                                                                              higher      the
                                                                                                                                                            z$frame
                                                                                                                                                                 1:2inthan
                                                                                                                                                                        Fig. at the    opticalepoch.
                                                                                                                                                                                     current     PSF ("0.1      ). This
                                                                                                                                                                                                         Overall,     41% is illustrated
                                                                                                                                                                                                                              ; (0:5 Gyr/!)  in Figure
                                                                                                                                                                                                                                                   of all7,galaxies
                                                                                                                                                                                                                                                            where we
                                                                                                   The members of such pairsof     are Paired
                                                                                                                                        treated as Galaxies
                                                                                                                                                    having ‘‘discordant red-           have plotted the angular separation between the main galaxy
 (right coordinates). The lines are Schechter functions of the LF of paired                             with MJ ! %19:5 have undergone a major merger in the last $8 Gyr, where ! is the merger timescale. Interestingly,
                                                                                                   shifts’’ and are  essentially foreground/background superpositions.                 and neighbors identified in the z filter against the z magnitude
                                                                                                        we  findplot,
                                                                                                                  no we
                                                                                                                      effect
                                                                                                                          canon   the 5derived h major     merger    rate
                                                                                                                                                                        (fdue/h3to
                                                                                                                                                                                 ) theError
                                                                                                                                                                                        presence    of thesegregated
                                                                                                                                                                                                            large-scale       structure      at z ¼bins.
                                                                                                                                                                                                                                                       0:735   in the
 galaxies (solid ), of the LF of 2MASS galaxies by Kochanek et al. (2001;                          From  a this  Error          ∗ !derive
                                                                                                                             Mthen        logthe       Error
                                                                                                                                                   fraction        log
                                                                                                                                                              of pairs that 0are       of  the neighbor,                   into  three redshift            A neighbor
                                                                                                        CDFS.
                                                                                                   actually foreground/background superpositions (i.e., the contami-                   here is identified as any galaxy within 5 h100 kpc % r % 20 h$1
                                                                                                                                                                                                                                              $1
 dotted ), and of the LF of 2MASS galaxies by Cole et al. (2001; dashed ). The                                                                                                                                                                                      100
                                                                                                      0.30
                                                                                                   nation   rate).0.56
                                                                                                                   This
                                                                                                        Subject headingg         !22.55
                                                                                                                         contamination      rate  is   0.25
                                                                                                                                                      found   to be   !3.46
                                                                                                                                                                     "69%
                                                                                                                            s: galaxies: evolution — galaxies: formation      #        0.13—
                                                                                                                                                                                       kpc   of the primaryinteractions
                                                                                                                                                                                                 galaxies:     galaxy, regardless         of its magnitude.
                                                                                                                                                                                                                                 — galaxies:         statisticsThe re-
 shaded area presents the differential pair fractions and the errors.                            13%. On first sight this might appear larger than the contamina-                       sultant list of 1085 neighbors includes major as well as minor
                                                                                                 tion rate of 42% # 6:3% that we have obtained using our statisti-                      neighbors and constitutes the pool from which the major pairs
                                                                                                 cally estimated foreground/background contamination (although                          are identified. In Figure 7 the open circles denote neighbors that
                                                                                                 note the large error
                                                                                                                    1. bars since we are dealing with small number
                                                                                                                       INTRODUCTION                                                     have  Ks magnitudes,
                                                                                                                                                                                          technique             whereas the
                                                                                                                                                                                                       of pair counting.       green 2
                                                                                                                                                                                                                            Section  crosses  denote
                                                                                                                                                                                                                                       lists the dataneigh-
                                                                                                                                                                                                                                                      sets we have
                                                                                                 statistics here). However, we checked the spectra of the pairs                         bors that do not have Ks magnitude. As is shown in Figure 7,
                                                                                                                                                                                          used  in  this work   and  briefly explains   the  methodology    that we
                                                                                              Galaxy
                                                                                                 havingmergers    are believed
                                                                                                          discordant             to be the It
                                                                                                                      redshifts ourselves. chief
                                                                                                                                               turnsmechanism    driv-
                                                                                                                                                     out that in many                   there are a large number ("43%) of such neighbors that do not
                                                                                                 cases,evolution
                                                                                                         the redshift determination  can be quite  poor indeed,  espe-                    have  employed    in this paper  for deriving  the merger
                                                                                                                                                                                        have Ks -band magnitudes. This has the consequence of reduc- rate. Section 3
                                                                                           ing galaxy               within the hierarchical   framework.    Although
                                                                                                 cially                                                                                   details  the  sample   selection   criterion  employed    by  us  and  the
                                                                                           mergers  areinrare
                                                                                                           the at
                                                                                                               low-exposure
                                                                                                                  the current and  low-resolution
                                                                                                                               epoch,               VVDSframework
                                                                                                                                       the hierarchical    (as param-                   ing the pool of neighbors from which the major pairs are identified
                                                                                                                                                                                          possible biases in our sample. Section 4 explains the details of
                                                                                           predicts that the merger rate must have been higher at earlier
                                                                                                                                                                                          the photometry performed by us in the Ks filter. Section 5 explains
                                                                                           epochs. Despite its importance in understanding galaxy evolu-
                                                                                                                                                                                          in detail how we identify major pairs of galaxies, along with cor-

 The merging rate history is an
                                                                                           tion, the quantification of the galaxy major merger rate and its
                                                                                                                                                                                          recting for possible contamination and incompleteness issues.
                                                                                           evolution with redshift is still an ill-constrained and hotly de-
                                                                                           bated issue. Patton et al. (1997) have derived a clear increase in                             Section 6 compares the differences in pairs identified in the vis-
                                                                                                                                                                                          ible and the near-IR. Section 7 deals with the calculation of the
                                                                                           the merger fraction with redshift until z $ 0:33 with a power-law

important constrain to models.                                                             index of 2:8 # 0:9. However, extension of this work to higher
                                                                                           redshifts has been riddled with controversy. Le Fevre et al. (2000)
                                                                                           reported steep evolution of the major merger rate until z $ 1:0,
                                                                                                                                                                                          major merger rate from our identified pairs and its evolution with
                                                                                                                                                                                          redshift. We conclude by discussing the implications of our re-
                                                                                                                                                                                          sults obtained in this paper in Section 8. We adopt a cosmology

  High ang. resolution needed
                                                                                                                                                                                          with H0 ¼ 70 km s%1 Mpc%1, !M ¼ 0:3, and !" ¼ 0:7.
                                                                                           with a power-law index of 3:2 # 0:6 using pair-counting in the
                                                                                           optical band for identifying the merger candidates. Bundy et al.
                                                                                                                                                                                                                           2. THE DATA
                                                                                           (2004) reported a much more modest evolution of merger rate
                                                                                           using K 0 -band images for identifying major merger candidates.                                   We have used version v1.0 of the reduced, calibrated images of
                                                                                           Lin et al. (2004) also reported very weak evolution in the merger                              the Chandra Deep FieldYSouth (CDFS) acquired with HST/ACS
                                                                                           rates using the DEEP2 redshift survey. Bell et al. (2006) reported                             as part of the GOODS survey (Giavalisco et al. 2004). The
                                                                                           a fairly rapid evolution in merger fraction of massive galaxies                                SExtractor ( Bertin & Arnouts 1996) based version r1.1 of the
On the evolution of clustering of 24-µm-selected galaxies

                                                                                  M. Magliocchetti,1,2,3! M. Cirasuolo,4 R. J. McLure,4 J. S. Dunlop,4
                                                                                  O. Almaini,5 S. Foucaud,5 G. De Zotti,3,6 C. Simpson7 and K. Sekiguchi8
                                                                                  1 INAF, Osservatorio Astronomico di Trieste, Via Tiepolo 11, 34100 Trieste, Italy
                                                                                  2 ESO, Karl-Schwarzschild-Str.2, D-85748 Garching, Germany
1134          M. Magliocchetti et al.
                                                                                  3 SISSA, Via Beirut 4, 34014 Trieste, Italy
                                                                                                                                     1138 M. Magliocchetti et al.
                               intermedium z                                                                         high z                                                          intermedium z
                                                                                  4 SUPA, Scottish Universities Physics Alliance, Institute for Astronomy, University of Edinburgh, Royal Observatory, Edinburgh EH9 3HJ
                                                                                  5 School of Physics and Astronomy, University of Nottingham, University Park, Nottingham NG7 2RD
                                                                                                                                                                                                                                                                                    high z
                                                                                  6 INAF, Osservatorio Astronomico di Padova, Vicolo dell’Osservatorio 5, 35122 Padova, Italy
                                                                                  7 Astrophysics Research Institute, Liverpool John Moores University, Twelve Quays House, Egerton Wharf, Birkenhead CH41 1LD
                                                                                  8 National Astronomical Observatory of Japan, Mitaka, Tokyo 181-8588, Japan

                                                                                  Accepted 2007 October 16. Received 2007 October 9; in original form 2007 June 29

                                                                            Figure 5. Angular correlation function w(θ) for the low-z (left-hand panel) and high-z (right-hand panel) samples. The solid (blue) curves represent the best
                                                                            HON fits to the data obtained under the
                                                                                                                 A Bassumption
                                                                                                                     S T R A C T that the distribution of galaxies within their dark matter haloes mirrors that of the dark matter (chosen to
                                                                            be described by a NFW profile, cf. Section  4), while
                                                                                                                 This paper        the dashed
                                                                                                                              investigates the (green) curves
                                                                                                                                               clustering      are theofbest
                                                                                                                                                          properties         fits obtained
                                                                                                                                                                         a complete        forof
                                                                                                                                                                                      sample   a steeper galaxy profile, ρ ∝ r−3 . The long-short
                                                                                                                                                                                                 1041 24-µm-selected
                                                                            dashed (cyan) curves correspond to the best one-parameter                                                                                                            2
                                                                                                                 sources  brighter than fits
                                                                                                                                          F 24obtained by setting in equation (5) α = 0 and N 0 =the
                                                                                                                                              µm= 400 µJy in the overlapping region between
                                                                                                                                                                                                      1. Spitzer
                                                                                                                                                                                                         The negative
                                                                                                                                                                                                                 Wide-w(θ ) data points in the χ
                                                                            analysis of the low-z sample have been treated
                                                                                                                 Area       as in Extragalactic
                                                                                                                       Infrared   Section 3.1 (see text forand
                                                                                                                                                (SWIRE)     details).
                                                                                                                                                               UKIRT Infrared Deep Sky Survey (UKIDSS) Ultra
                                                                                                                                 Deep Survey (UDS) surveys. With the help of photometric redshift determinations we have
Figure 3. Sky distribution of UDS-SWIRE, F 24 µm ! 400 µJy sources (small dots). The filled (red) circles in the left-hand concentrated
                                                                                                                                 panel illustrate the 350         the two interval ranges z = [0.6–1.2] (low-z sample) and z ! 1.6 (high-z sam-
                                                                                                                                                            on objects
included in the redshift interval z = [0.6–1.2], while those in the right-hand panel represent the 210 sources with either z > 1.6 or no       Figure
                                                                                                                                                   optical5.orAngular
                                                                                                                                                                near-IR correlation function w(θ) for the low-z (left-hand panel) and high-z (right-hand panel) samples. The solid (blue) curves represent the best
                                                                       the data, as small-scale measurements                     ple) asof     it isthefits
                                                                                                                                                         intwo-point
                                                                                                                                                             these        regions   correlation
                                                                                                                                                                                         were       weassumption
                                                                                                                                                                                                          expect the        mid-infrared          (IR) population          tomatter
                                                                                                                                                                                                                                                                               be dominated
identification.
                                                                       function prefer smoother profiles by                      such  intense
                                                                                                                                               HON
                                                                                                                                            as NFW
                                                                                                                                               be   described
                                                                                                                                                             to  the data
                                                                                                                                                        dust-enshrouded
                                                                                                                                                                  by   a  NFW
                                                                                                                                                                              obtained
                                                                                                                                                                 or ρ ∝ r activity  −2.5
                                                                                                                                                                                  profile,
                                                                                                                                                                                          under the
                                                                                                                                                                                             cf. Section    4), while
                                                                                                                                                                                                                      that the
                                                                                                                                                                                                                       the
                                                                                                                                                                                                                                distribution of galaxies
                                                                                                                                                                                            . How-such as star formation and black hole accretion.
                                                                                                                                                                                                                           dashed    (green)   curves are
                                                                                                                                                                                                                                                            using
                                                                                                                                                                                                                                                          the best fits
                                                                                                                                                                                                                                                                         halo
                                                                                                                                                                                                                                                           within their dark
                                                                                                                                                                                                                                                                        obtained
                                                                                                                                                                                                                                                                                    ocupation
                                                                                                                                                                                                                                                                                 for a steeper
                                                                                                                                                                                                                                                                                                           model
                                                                                                                                                                                                                                                                                     haloes mirrors that of the dark matter (chosen to
                                                                                                                                                                                                                                                                                          Inves-
                                                                                                                                                                                                                                                                                               galaxy profile, ρ ∝ r−3 . The long-short
                                                                                                                                               dashed (cyan) curves correspond to the best one-parameter fits obtained by setting in equation (5) α = 0 and N 0 = 1. The negative w(θ ) data points in the χ 2
of galaxies undergoing intense star formation which we expect ever,    (cf.     atgeometry
                                                                                   very low          redshifts
                                                                                               of UDS,    and corresponds     to tigations
                                                                                                                    it is reasonable
                                                                                                                                 about The          ofthethe
                                                                                                                                                     to    expect
                                                                                                                                                 ofclustering
                                                                                                                                          halfanalysis            angular
                                                                                                                                                            maximum
                                                                                                                                                            of the low-z   theof  correlation
                                                                                                                                                                                   majority
                                                                                                                                                                                   BzK
                                                                                                                                                                              sample           been of
                                                                                                                                                                                        have galaxies
                                                                                                                                                                                                         function produce an amplitude A ∼ 0.010 for the high-z
                                                                                                                                                                                                       treated as in Section 3.1 (see text for details).
earlier in this section and also in Fig. 2) to dominate our sample.    dark matterscale probed
                                                                                            haloes by thetosurvey.
                                                                                                              be virialized      sample
                                                                                                                                      and
                                                                                                                                       (Hartley  and Aet
                                                                                                                                                therefore           0.0055
                                                                                                                                                               ∼ al., be in         for the low-z
                                                                                                                                                                              to prep.).
                                                                                                                                                                                    reasonably       Galaxies  one. The corresponding correlation lengths are r0 =
   The low-z sample instead contains 350 sources. Their sky dis-                     Fig. 4 presents our results for the two15.9  low-z+2.9
                                                                                                                                          (left-hand
                                                                                                                                                   and     panel)+1.5
                                                                                                                                                           8.5−1.8   and  Mpc,e.g.   showing           that the high-z         population is more strongly clustered. Com-
tribution is represented by the filled (red) circles on the left-hand  described  high-z(at     least beyond
                                                                                           (right-hand                  thewhile
                                                                                                          panel) samples,      veryTable
                                                                                                                                       insmall
                                                                                                                                         −3.4the
                                                                                                                                              1the      scales,
                                                                                                                                                       UDS
                                                                                                                                                  reports
                                                                                                                                                      data,  the    have
                                                                                                                                                                   w(θ   see
                                                                                                                                                                          )
                                                                                                                                                              as small-scale       been      Bukert
                                                                                                                                                                                                 selected
                                                                                                                                                                                      measurements          of the totwo-point correlation
side of Fig. 3. The average redshift of the sample is found to1995)      be       values
                                                                                 by        as a function profiles.
                                                                                        NFW-like            of angular scale
                                                                                                                           Two inparisons
                                                                                                                                   both   cases.
                                                                                                                                     options        with
                                                                                                                                                     The are physical
                                                                                                                                                            error   bars
                                                                                                                                                                 instead        models
                                                                                                                                                                                   possible    forsuch the asformation
                                                                                                                                                                                                        at < zNFW              and evolution of large-scale structure reveal
                                                                                                                                       lie    in     the
                                                                                                                                               function       redshift
                                                                                                                                                             prefer     smoother   rangeprofiles1.4                 <   or ρ ∝ r−2.5 . How-
                                                                                                                                                                                                                                               of massive (M " 10 M# ) haloes,
                                                                                                                                                                                                                                                                             13
!z" = 0.79, its median zmed = 0.84 and the comoving number den-                   show Poisson estimates for the points. Since   thatthe thedistribution
                                                                                                                                                 high-z
                                                                                                                                               ever,    at verysources
                                                                                                                                                                is clus-
                                                                                                                                                                   low redshifts are exclusively
                                                                                                                                                                                         it is reasonableassociated
                                                                                                                                                                                                                 to expect thewithmajority very
sity of these sources is n̄ G = (9.9 ± 1.0) × 10−5 Mpc−3 . Evensuch      in     high
                                                                                  tered,redshifts.
                                                                                         these estimatesThe       first one
                                                                                                            only provide   a lower islimit
                                                                                                                                        that
                                                                                                                                       2.5   to andgalaxies
                                                                                                                                                 the        can
                                                                                                                                                       uncertainties.  still
                                                                                                                                                                       be        do     trace
                                                                                                                                                                               characterised         the         as
this case, the number density is in excellent agreement with underlying
                                                                                                                                 comparable    dark mattertoofthosehaloeswhich           locally and
                                                                                                                                                                               to be virialized         hosttherefore
                                                                                                                                                                                                                 groups-to-clusters
                                                                                                                                                                                                                          be to reasonablyof galaxies and are very common
                                                                        the       However,distribution
                                                                                               it can be shown  ofthatthe
                                                                                                                        overdark      matter
                                                                                                                              the considered
                                                                                                                                 withineither          within
                                                                                                                                                     range
                                                                                                                                               described
                                                                                                                                              such        (rare)(at   their
                                                                                                                                                                  angu-
                                                                                                                                                       star-forming               haloes,
                                                                                                                                                                                       (sBzK)      and
                                                                                                                                                                     structures. Conversely, lower zsee
                                                                                                                                                                      least    beyond       the   very   or
                                                                                                                                                                                                          small    scales,        e.g. Bukert
                                                                                                                                                                                                                              galaxies        are found to reside in smaller haloes
findings of Caputi et al. (2007) for their z ∼ 1 sources with ν Lν !              lar scales this estimate is close to those         obtained       from     bootstrap
   11.3                                                                it  is  the   dark       matter       itself    which
                                                                                  resampling (e.g. Willumsen, Freudling (M         doespassive  not
                                                                                                                                               1995)    12follow
                                                                                                                                                          by   NFW-like
                                                                                                                                                            (pBzK)
                                                                                                                                                   10highMredshifts.       NFW-like
                                                                                                                                                                                 profiles.
                                                                                                                                                                                by     the     Twopro-
                                                                                                                                                                                                Daddi   optionset  are
                                                                                                                                                                                                                     al.instead   possible at
10 L& , where ν Lν was calculated as indicated before. The most                                                                  & Da     Costa
                                                                                                                                       min ∼
                                                                                                                                       issue such
                                                                                                                                                     1997).
                                                                                                                                                                 # ) In and The  to be     very
                                                                                                                                                                                       first  one rareis thatingalaxies
                                                                                                                                                                                                                  such systems.
                                                                                                                                                                                                                           still do trace Onthethe other hand, mid-IR photometry
relevant properties for the high-z and low-z samples are summarized    files. TheParticular
                                                                                        second         option
                                                                                                   attention  was is    instead
                                                                                                                   devoted   to the that
                                                                                                                                 shows (2004)   ofgalaxies
                                                                                                                                               that
                                                                                                                                                     close pairs.are
                                                                                                                                               underlying criteria.
                                                                                                                                                         the     low-z         simply
                                                                                                                                                                              In
                                                                                                                                                                              and   this        more
                                                                                                                                                                                              redshift
                                                                                                                                                                                     of the dark matter within their haloes, andobjects and probe a similar mix-
                                                                                                                                                                                       high-z        samples         include       similar
in Table 2.                                                                       fact, the points on the top left-hand corners of                 both w(θ)distribution
                                                                                                                                                                    esti-
                                                                       radiallymatesconcentrated              than scales
                                                                                          correspond to angular        the dominant
                                                                                                                                 turerange
                                                                                                                               close   toof        isdark
                                                                                                                                           theitactive the
                                                                                                                                                   5.4-arcsec   matter
                                                                                                                                                        it isdark
                                                                                                                                                              galactic
                                                                                                                                                                  the matter
                                                                                                                                                                   reso-         counterpart.
                                                                                                                                                                                  itself which
                                                                                                                                                                                nucleus
                                                                                                                                                                            passive             (AGN) does not
                                                                                                                                                                                                galaxies      andfollow      NFW-like pro-
                                                                                                                                                                                                                      star-forming
                                                                                                                                                                                                                    that                     galaxies. While recent studies have
                                                                                                                                               files.    The    second option is instead that galaxies are simply more
                                                                       Whatever the favourite choice, onedetermined
                                                                                  lution  of  the  24-µm   Spitzer channel   and    thing
                                                                                                                                  therefore      is
                                                                                                                                                 could
                                                                                                                                       areradially
                                                                                                                                                 foundclear;
                                                                                                                                                           be
                                                                                                                                                                 toonbe
                                                                                                                                                              affected
                                                                                                                                                          a concentrated
                                                                                                                                                             strong        subhalo
                                                                                                                                                                            evolution
                                                                                                                                                                                thethanmore
                                                                                                                                                                                             scales,
                                                                                                                                                                                               of the
                                                                                                                                                                                           the dominant
                                                                                                                                                                                                            24-µm
                                                                                                                                                                                                       highly            luminosity function between z ∼ 2 and 0, they
                                                                                                                                                                                                                 dark matter counterpart.
3 C L U S T E R I N G P R O P E RT I E S                                          by source confusion. However, since optical and near-IR                  images for
                                                                       24-µm-selected
                                                                                  these sources havegalaxies        at redshifts
                                                                                                          a much better          cannot
                                                                                                                           resolution  clustered.
                                                                                                                                         (∼0.8    !
                                                                                                                                            zWhatever
                                                                                                                                               provide   0.6the
                                                                                                                                                    arcsec),    weare
                                                                                                                                                                  Thecan more
                                                                                                                                                                information
                                                                                                                                                                     favouriteclustering strongly
                                                                                                                                                                                         on
                                                                                                                                                                                    choice,    the
                                                                                                                                                                                                one physical
                                                                                                                                                                                                       of
                                                                                                                                                                                                       thingaisset    nature     of such
                                                                                                                                                                                                                       ofon subhalo
                                                                                                                                                                                                                  clear;                       an evolution. Our clustering results
                                                                                                                                                                                                                                         scales,
                                                                       radiallyuseconcentrated
                                                                                       this information and   than     their
                                                                                                                consider         instead
                                                                                                                                low-redshift
                                                                                                                           as ‘good’            indicate          thatofbe
                                                                                                                                                 all thosecounterparts.
                                                                                                                                        pairs24-µm-selected   made          thisdirectly
                                                                                                                                                                           galaxies is due
                                                                                                                                                                                         at Such tolinked
                                                                                                                                                                                             redshifts the     ! 0.6 are of
                                                                                                                                                                                                         a zpresence          moredifferent
                                                                                                                                                                                                                                       stronglypopulations of objects inhabiting
3.1 The angular correlation function                                                                                                   galaxies
                                                                                  galaxies which are identified in the Subaru/UDSradially
                                                                                                                                                              can
                                                                                                                                                images, concentrated
                                                                                                                                                             while we              than   their    low-redshift
                                                                                                                                                                                                                   tocounterparts.      Such ato be exclusively associated with
                                                                       strong regard
                                                                                  concentration              is indicative       different          structures,            as active         systems halos   at z # 1.5 are found
The angular two-point correlation function w(θ) gives the excess                          as potentially spurious      those madeof  ofthea strong
                                                                                                                                         galaxiesmass
                                                                                                                                               strong  without interaction
                                                                                                                                                                ofsuch the
                                                                                                                                                           concentration        dark     between
                                                                                                                                                                                             matter
                                                                                                                                                                                  is indicative        of a strong interaction between
probability, with respect to a random Poisson distribution, of finding
                                                                       galaxiesoptical/near-IR
                                                                                     which reside             in the
                                                                                                      counterparts.  Forproximitylow-mass
                                                                                                                         the low-z   sample,  of      galaxies,
                                                                                                                                                     the
                                                                                                                                                  there
                                                                                                                                               galaxies   arehalo
                                                                                                                                                               11 pairs
                                                                                                                                                             which        whileinvery
                                                                                                                                                                         centres,
                                                                                                                                                                         reside        theand   massive
                                                                                                                                                                                                     we of sources
                                                                                                                                                                                             proximity                        appearandtowehave concluded their active phase
                                                                                                                                                                                                                 the halo centres,
two sources in the solid angles δ$1 , δ$2 separated by an angle                                                                      ◦ in which they reside; in the case of
                                                                                  with distances between 0.001◦ and 0.0031
                                                                       expect foundsuchto abe strong                             before
                                                                                                                                      . Of     this epoch.
                                                                                                                                             these,
                                                                                                                                               expect  onlysuch a Finally,
                                                                                                                                                              one    was               we noteto that
                                                                                                                                                                       strong interaction                       the small-scale
                                                                                                                                                                                                         eventually     drive a substantial clustering data seem to require steep
θ. In practice, w(θ ) is obtained by comparing the actual source                                  closer thaninteraction
                                                                                                               5.4 arcsec and bothto theeventually
                                                                                                                                       IRAC  −3  pBzKs
                                                                                                                                                 and R-band
                                                                                                                                               number
                                                                                                                                                                  drive
                                                                                                                                                                   the
                                                                                                                                                                    pho- dark
                                                                                                                                                             of mergers.
                                                                                                                                                                                aIt substantial
                                                                                                                                                                                         matternothalos
                                                                                                                                                                                     is possibly             agalaxies
                                                                                                                                                                                                                random coincidence           thathaloes. This is suggestive of close
distribution with a catalogue of randomly distributed objects subject                                                            (ρ   ∝   r        ) profiles        for     the   distribution           of                 within       their          Figure 6. Average number of galaxies $N% per dark matter halo of specified
                                                                       number       of
                                                                                  tometry mergers.
                                                                                             indicate thatIt weisarepossibly
                                                                                                                     dealing with not
                                                                                                                                       have   a
                                                                                                                                      two distinct  random
                                                                                                                                               bright masssources.
                                                                                                                                                                    in coincidence
                                                                                                                                                                       10
                                                                                                                                                          24-µm-selected   excess   sources   ofat that
                                                                                                                                                                                                    10    13 solar
                                                                                                                                                                                                    intermediate-to-high         redshifts    are
to the same mask constraints as the real data. We chose to use the                                                               encounters
                                                                                  close (i.e. again with distances between 0.0011 and       ◦           and/or        mergers
                                                                                                                                                      0.0031 associated
                                                                                                                                                               ◦
                                                                                                                                                                 ) pairs               which         could     stronglyFigure favour6.     both
                                                                                                                                                                                                                                          Average AGN      andMstar
                                                                                                                                                                                                                                                       number
                                                                                                                                                                                                                                                         mass           formation
                                                                                                                                                                                                                                                                   of galaxies
                                                                                                                                                                                                                                                                 (expressed   in M&$N%  activity.
                                                                                                                                                                                                                                                                                          perThedark
                                                                                                                                                                                                                                                                                      units).    solid matter
                                                                                                                                                                                                                                                                                                       (red) line halo  of specified
                                                                                                                                                                                                                                                                                                                  represents the case for
estimator (Hamilton 1993)                                              bright 24-µm-selected
                                                                                  are instead found in the sources          at Of
                                                                                                               high-z sample.    intermediate-to-high
                                                                                                                                       masses.
                                                                                                                                    these,    only one is at a dis- redshifts are
                                                                                                                                               in general                         to very intense star-forming systems; the ex-                          the high-z sample, while the dashed (green) line is for the low-z sample.
                                                                                                                                               cess of proximity between such galaxies wouldmass                                M (expressed          in M units). The solid (red) line represents the case for
            DD RR                                                      in general tance associated
                                                                                         below 5.4 arcsec.   toUnfortunately,
                                                                                                                 very intense    Key
                                                                                                                                 the two  words:
                                                                                                                                             sources of galaxies:
                                                                                                                                         star-forming         this pair systems; evolution  the
                                                                                                                                                                                                                         eventually
                                                                                                                                                                                                    –ex-galaxies: statistics             – cosmology:&observations – cosmol-
                                                                                                                                                                                                                                         lead to
w(θ ) = 4            − 1,                                               (1)       are unidentified both in the optical and in       the near-IR
                                                                                                                                               gas-rich mergers which could easily trigger enhanced
                                                                                                                                                       bands,    and so                                                the high-z         sample, while the dashed (green) line is for the low-z sample.
                                                                                                                                                                                                                              star formation
             (DR)2                                                     cess of proximity between such galaxies                   ogy:     theory    would
                                                                                                                                               activity   – like
                                                                                                                                                              large-scale
                                                                                                                                                                   eventually
                                                                                                                                                                   the ones observed. structure
                                                                                                                                                                                            leadIn to   of Universe
                                                                                                                                                                                                        passing,    we note – that
                                                                                                                                                                                                                                 infrared:
                                                                                                                                                                                                                                      evidencegeneral.   the lowest possible masses where the sources start appearing), and
                                                                   the pair has to be considered as spurious.
                                                                                                                 high-zfor  an upturn     (although less significative than ours) on scales r "         we note that since $N% is a quantity which is averaged all over the
where DD, RR and DR are the number of data–data, random–   gas-rich mergers
                                                                      The angularwhich       could
                                                                                   correlation        easily
                                                                                               function for the trigger
                                                                                                                           h
                                                                                                                             enhanced
                                                                                                                         sample
                                                                                                                       0.2   −1
                                                                                                                                Mpc
                                                                                                                                   was then
                                                                                                                                       has
                                                                                                                                               star
                                                                                                                                            also
                                                                                                                                                     formation
                                                                                                                                                  been recently  reported by Gilli et al. (2007) for
random and data–random pairs separated by a distance θ.            computed   by  both  including and  excluding   the  possibly   spurious                                                             dark matter haloes more massive than Mmin , in the most extreme
                                                           activitypair.
   The two considered UDS-SWIRE samples have an estimated 5σ
                                                                     likeThethe   ones (θobserved.
                                                                             small-scale                  In passing,
                                                                                             ∼ 0.0015◦ ) results  are their    we
                                                                                                                                by thenote
                                                                                                                       shownsample         z ∼ that
                                                                                                                                       oftwo          evidencesources inthe
                                                                                                                                                1, 24-µm-selected                   lowestfields.
                                                                                                                                                                               the GOODS        possiblecase
                                                                                                                                                                                                         masses     where
                                                                                                                                                                                                             our results imply the  sources
                                                                                                                                                                                                                               that more       start
                                                                                                                                                                                                                                         than one      appearing),
                                                                                                                                                                                                                                                  in two                 and
                                                                                                                                                                                                                                                         of all the structures
flux completeness F                                        for an upturn
                        " 400 µJy. Furthermore, since the whole    horizontal (although       less significative
                                                                              dashes in the right-hand                     than
                                                                                                                          The
                                                                                                        panel of Fig. 4. The    bestours)
                                                                                                                               filled average
                                                                                                                                      circle   onnumber
                                                                                                                                                    scales    rfrom
                                                                                                                                                                  " the
                                                                                                                                                          of galaxies  $N%canonical     hierarchical
                                                                                                                                                                            as a function    of halo merging   scenario,
                                                                                                                                                                                                        with masses  M ∼ 10that
                                                                                                                                                                                                                             13 proved to
                                                                                                                                                                                                                                M& host a high-z, F 24 µm # 400 µJy galaxy.
NIR color selection of high-z gal. populations

                                                             Colour information is also vital for discriminating between objects, and for the
                                                             determination of photometric redshifts, particularly using the 4000Å break as
                                                             it moves through the I, J, & H bands over the range 1
Concluding remarks
• Many EG problems could be solved with a
  deep and LA NIR survey
• Synergy with SMM/Opt/X-ray deep surveys
  will be crucial for z determination and
  selection of high-z objects.
• Synergy with HI surveys will allow to get
  baryonic quantities (the dream of modelers)
• Follow-up (spectra, opt. bands, etc.) of
  discovered high-z galaxies.
You can also read