The Effectiveness of Durian Peel as a Multi-Mycotoxin Adsorbent - MDPI
←
→
Page content transcription
If your browser does not render page correctly, please read the page content below
toxins
Article
The Effectiveness of Durian Peel as a
Multi-Mycotoxin Adsorbent
Saowalak Adunphatcharaphon 1 , Awanwee Petchkongkaew 1 , Donato Greco 2 ,
Vito D’Ascanio 2 , Wonnop Visessanguan 3 and Giuseppina Avantaggiato 2, *
 1    School of Food Science and Technology, Faculty of Science and Technology, Thammasat University,
      99 Mhu 18, Paholyothin road, Khong Luang, Pathum Thani 12120, Thailand;
      s.adunphatcharaphon@hotmail.com (S.A.); awanwee@tu.ac.th (A.P.)
 2    Institute of Sciences of Food Production (ISPA), National Research Council (CNR), Via Amendola 122/O,
      70126 Bari, Italy; donato.greco@ispa.cnr.it (D.G.); vito.dascanio@ispa.cnr.it (V.D.)
 3    Functional Ingredient and Food Innovation Research Group, National Center for Genetic Engineering and
      Biotechnology (BIOTEC), National Science and Technology Development Agency (NSTDA),
      113 Thailand Science Park, Phahonyothin Road, Pathumthani 12120, Thailand; wonnop@biotec.or.th
 *    Correspondence: giuseppina.avantaggiato@ispa.cnr.it; Tel.: +39-080-592-9348

 Received: 16 January 2020; Accepted: 5 February 2020; Published: 8 February 2020

 Abstract: Durian peel (DP) is an agricultural waste that is widely used in dyes and for organic and
 inorganic pollutant adsorption. In this study, durian peel was acid-treated to enhance its mycotoxin
 adsorption efficacy. The acid-treated durian peel (ATDP) was assessed for simultaneous adsorption of
 aflatoxin B1 (AFB1 ), ochratoxin A (OTA), zearalenone (ZEA), deoxynivalenol (DON), and fumonisin
 B1 (FB1 ). The structure of the ATDP was also characterized by SEM–EDS, FT–IR, a zetasizer, and a
 surface-area analyzer. The results indicated that ATDP exhibited the highest mycotoxin adsorption
 towards AFB1 (98.4%), ZEA (98.4%), and OTA (97.3%), followed by FB1 (86.1%) and DON (2.0%).
 The pH significantly affected OTA and FB1 adsorption, whereas AFB1 and ZEA adsorption was
 not affected. Toxin adsorption by ATDP was dose-dependent and increased exponentially as the
 ATDP dosage increased. The maximum adsorption capacity (Qmax ), determined at pH 3 and pH
 7, was 40.7 and 41.6 mmol kg−1 for AFB1 , 15.4 and 17.3 mmol kg−1 for ZEA, 46.6 and 0.6 mmol
 kg−1 for OTA, and 28.9 and 0.1 mmol kg−1 for FB1 , respectively. Interestingly, ATDP reduced the
 bioaccessibility of these mycotoxins after gastrointestinal digestion using an in vitro, validated, static
 model. The ATDP showed a more porous structure, with a larger surface area and a surface charge
 modification. These structural changes following acid treatment may explain the higher efficacy of
 ATDP in adsorbing mycotoxins. Hence, ATDP can be considered as a promising waste material for
 mycotoxin biosorption.

 Keywords: mycotoxins; durian peel; agricultural by-products; biosorption; gastrointestinal digestion
 model; decontamination; equilibrium isotherms

 Key Contribution: Acid treatment of durian peel changes the morphological structure of its surface
 and enhances mycotoxin adsorption efficacy. Acid-treated durian peel is a promising waste material
 for mycotoxin decontamination.

1. Introduction
    Mycotoxins are fungi-derived metabolites capable of causing a dverse effects to both humans
and animals. They are produced by toxigenic fungi, including Aspergillus, Penicillium, Alternaria, and
Fusarium species, under specific temperature and humidity conditions [1–4]. The main mycotoxins

Toxins 2020, 12, 108; doi:10.3390/toxins12020108                                    www.mdpi.com/journal/toxins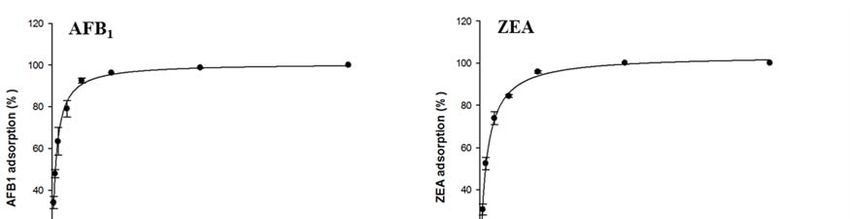
Toxins 2020, 12, 108                                                                                 2 of 17

occurring in food and feedstuffs are aflatoxins, ochratoxins, zearalenone, deoxynivalenol, and
fumonisins [4,5]. Contamination by mycotoxins is common in primary agricultural commodities
such as maize, rice, wheat, cereal products, meat, and dried fruits [5–8]. Multi-mycotoxin
contamination of food and feedstuffs depends on environmental conditions and type of substrate [9].
A multi-mycotoxin-contaminated diet may induce acute mycotoxicosis with several chronic adverse
effects, being mutagenic, carcinogenic, teratogenic, estrogenic, and immunosuppressive [10].
The combined consumption of different mycotoxins may produce synergistic toxic effects [9,11].
Mycotoxin consumption by livestock leads to economic losses for the feed industry and in international
trade [12]. Since mycotoxin contamination cannot be completely prevented in pre-harvesting or
post-harvesting, it is very difficult to avoid in agricultural commodities [5]. Decontamination strategies
therefore play an important role in helping to reduce exposure to mycotoxin-contaminated feed.
Strategies that have been developed for mycotoxin reduction in feedstuffs include physical, chemical,
and biological methods. However, most have considerable limitations in practical applications [13].
The addition of mycotoxin binders (including activated charcoal, aluminosilicates, and agricultural
wastes) to contaminated feed is an innovative and safe approach to counteracting the harmful effects
of mycotoxins to livestock [12,14–17]. Mycotoxin adsorbents have several disadvantages, including
the adsorption of essential nutrients and trace elements, as well as a rather narrow spectrum of action
towards the pool of mycotoxins frequently found in feedstuffs. Therefore, it is very important to
find new low-cost and biosustainable mycotoxin adsorbents that are able to simultaneously bind
the main mycotoxins of zootechnical interest. Recently, the use of agricultural wastes as mycotoxin
biosorbents has been investigated since they have a porous structure and contain a variety of functional
groups, including carboxyl and hydroxyl groups, which may be involved in the binding mechanisms
of mycotoxins [18,19]. In a recent study, [16] compared the ability of different agricultural by-products
to adsorb mycotoxins from liquid media using the isotherm adsorption approach. Grape pomaces,
artichoke wastes, and almond hulls were selected as the best mycotoxin biosorbents, being effective in
adsorbing AFB1 , ZEA, and OTA. Taking into account these findings, the present study evaluates the
efficacy of durian peel waste as an additive for mycotoxin decontamination of feed. Durian Monthong
(Durio zibthinus) is a popular fruit in Thailand and has many consumers. A large amount of durian
peel is thrown away, resulting in social and environmental problems linked to waste disposal. As
durian peel contains cellulose (47.2%), hemicellulose (9.63%), lignin (9.89%), and ash (4.20%), it has
been extensively studied as a fuel and adsorbent of pollutants and heavy metals [20–23]. To the best of
our knowledge, no research has reported reporting the use of durian peel as a multi-mycotoxin binder.
The aim of this study is to assess the efficacy of durian peel as a binder, both untreated and acid-treated,
in adsorbing the mycotoxins of major concern (aflatoxins, ochratoxins, zearalenone, deoxynivalenol,
and fumonisins). The equilibrium isotherm approach was used to study mycotoxin reduction in
liquid media at physiological pH values. In addition, the efficacy of these agricultural by-products in
reducing mycotoxin bioaccessibility was assessed using a static, validated gastrointestinal model.

2. Results and Discussion

2.1. Characterization of Durian Peel
     The surface morphology and elementary composition of DP and ATDP were determined using
SEM–EDS. SEM images showed that acid treatment of DP had the effect of modifying its surface
(Figure 1). More cavities were recorded on the surface of ATDP than DP. The study of Lazim et al. [22]
reported more pores on a DP surface after treatment with sulfuric acid, providing a higher capacity in
the removal of bisphenol A. These findings suggest that a change in the morphological structure of the
DP surface following acid treatment may affect mycotoxin adsorption.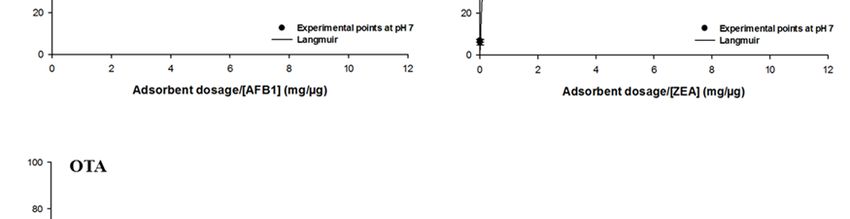
Toxins 2020, 12, 108 3 of 17
Toxins 2020, 12, x FOR PEER REVIEW 3 of 17
Figure 1. SEM images of durian peel (DP) and acid-treated durian peel (ATDP) at 900× and
Figure 1. SEM images of durian peel (DP) and acid‐treated durian peel (ATDP) at 900× and 1500×
1500× magnification. (A,B): DP and ATDP at 900×; (C,D): DP and ATDP at 1500×.
magnification. (A,B): DP and ATDP at 900×; (C,D): DP and ATDP at 1500×.
EDS spectra analysis showed that C and O constitute the major elements of the materials, with
EDS spectra analysis
C as the dominant showed
component (datathat C shown).
not and O constitute the major
These results are inelements
accordance of the materials,
with with
the study of
C as the dominant component ( data not shown ) . These results are in accordance
Charoenvai [21], which classified the major components of DP as cellulose (47%), hemicellulose (10%), with the study of
Charoenvai
lignin (10%),[21], which
and ash classified
(4%). the major
Acid treatment components
affects of DPcomposition
the elemental as celluloseof(47%),
the DPhemicellulose
surface, thus
(10%), lignin
increasing (10%),
the and ashof(4%).
proportion C. TheAcid treatmentgroups
functional affects present
the elemental
on thecomposition
DP and ATDP of the DP surface,
surfaces were
thus increasing the proportion of C. The functional groups present on the
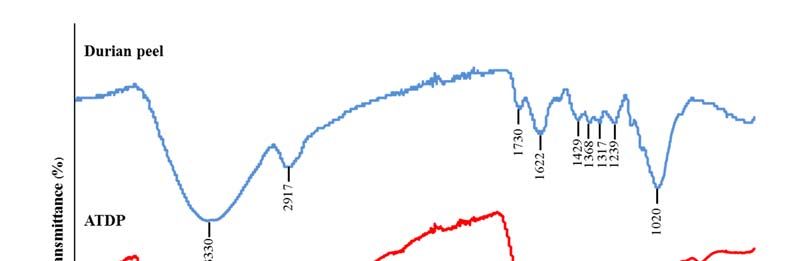
identified by FTIR (Figure 2). The FTIR spectra of DP obtained were similar to those reported byDP and ATDP surfaces
Lazim
were identified
et al. [19]. A firstby FTIR (Figure
intense spectrum 2).band
The FTIR spectra of
was observed at DP
3330obtained were similar to
cm−1 , corresponding to O–H
thosestretching
reported
by Lazim et
vibrations al. H
and [19]. A firstofintense
bonding spectrum
cellulose, pectin, band was observed
and lignin, which areatthe
3330 cm fiber
major
−1 , corresponding
componentsto ofO–H
fruit
stretching vibrations and H bonding of cellulose, pectin, and lignin, which
peel [24,25]. A second peak was observed at 2917 cm−1 , corresponding to C–H stretching vibrations
are the major fiber
components of fruit peel [24,25]. A second peak was observed at 2917 cm−1, corresponding to C–H
of the methyl or methylene groups. Interestingly, no peak vibrations were found in the range at
stretching vibrations of the methyl or methylene groups. Interestingly, no peak vibrations were found
2800–2300 cm−1 , which represent N–H or C=O stretching vibrations of the amine and ketone functional
in the range at 2800–2300 cm−1−1, which represent N–H or C=O stretching vibrations of the amine and
groups. The peak at 1730 cm corresponded to C=O stretching vibrations of the carbonyl group, while
ketone functional groups. The peak at 1730 cm−1 corresponded to C=O stretching vibrations of the
the peaks at 1622 cm−1 were related to the amide band (-CONH2 ). Peaks in the range 1500–1200 cm−1
carbonyl group, while the peaks at 1622 cm−1 were related to the amide band (‐CONH2). Peaks in the
were assigned to strong asymmetric carboxylic groups, methyl groups (bending vibration), aromatic
range 1500–1200 cm−1 were assigned to strong asymmetric carboxylic groups, methyl groups
amines, and C–O stretching vibrations of carboxylic acids [25]. Interestingly, a shift in all peak vibrations
(was
bending vibration), aromatic amines, and C–O stretching vibrations of carboxylic acids [25].
observed in the FTIR spectra of ATDP and DP. In addition, ATDP produced no peaks in the range
Interestingly, −1 a shift in all peak vibrations was observed in the FTIR spectra of ATDP and DP. In
1450–1250 cm . This suggests that modification by acid treatment affected the amine and methyl
addition, ATDP produced no peaks in the range 1450–1250 cm−1. This suggests that modification by
groups in the DP structure, resulting in a change in adsorption features. Ngabura et al. [25] observed
acid treatment affected the amine and methyl groups in the DP structure, resulting in a change in
that acidic groups, carboxyl, hydroxyl, and amides are involved in biosorption by DP. Zeta potential
adsorption features. Ngabura et al. [25] observed that acidic groups, carboxyl, hydroxyl, and amides
values for ATDP and DP differed substantially, with ATDP higher than DP. At pH 3, these values
are involved in biosorption by DP. Zeta potential values for ATDP and DP differed substantially,
were −23.20 mV for ATDP and −2.55 mV for DP. This difference in zeta potential can be explained by
with ATDP higher than DP. At pH 3, these values were −23.20 mV for ATDP and −2.55 mV for DP.
modification of the DP structure, induced by acid treatment. In a previous study [25], acid treatment of
This difference in zeta potential can be explained by modification of the DP structure, induced by
DP affected the physical properties of the material. In our study, ATDP had greater BET pore volumes,
acid treatment. In a previous study [25], acid treatment of DP affected the physical properties of the
pore diameters, and surface area (Table 1). These physical properties create greater adsorption at
material. In our study, ATDP had greater BET pore volumes, pore diameters, and surface area (Table
the surfaces. Ngabura et al. [25] found that hydrochloric acid-modified DP (HAMDP) had a more
1). These physical properties create greater adsorption at the surfaces. Ngabura et al. [25] found that
hydrochloric acid‐modified DP (HAMDP) had a more porous structure with a larger surface areaToxins 2020, 12, 108 4 of 17
Toxins 2020, 12, x FOR PEER REVIEW 4 of 17
porous
than structure with
the pristine peel.a The
larger
BET surface
surfacearea
areathan the pristine
is negatively peel. with
correlated The BET surface area
the nanoparticle is negatively
size, and
the nanoparticle
correlated with thesize of ATDP was
nanoparticle 21‐fold
size, andless
thethan that of DP size
nanoparticle (Table ). The same
of1ATDP was ratio wasless
21-fold observed
than that of
DP when
(Tablecomparing the surface
1). The same areasobserved
ratio was of the ATDPwhenand comparing
DP, with the the
surface area of
surface ATDP
areas of being 21‐fold
the ATDP and DP,
higher than that of DP. This structural modification of the adsorbing surface following acid treatment
with the surface area of ATDP being 21-fold higher than that of DP. This structural modification of the
was confirmed by the SEM–EDS images, which showed a more porous surface on the ATDP. The
adsorbing surface following acid treatment was confirmed by the SEM–EDS images, which showed a
physico‐chemical characterization suggested that the materials have different characteristics and are
more porous surface on the ATDP. The physico-chemical characterization suggested that the materials
expected to differently in mycotoxin adsorption.
have different characteristics and are expected to differently in mycotoxin adsorption.
(A)
(B)
Figure 2. FT-IR spectra of DP (A) and ATDP (B).
Figure 2. FT‐IR spectra of DP (A) and ATDP (B).
Table 1. BET single point method surface area analysis of DP and ATDP.
Table 1. BET single point method surface area analysis of DP and ATDP.
Pore Volume Pore Diameter Surface Area
Adsorbent Nanoparticle
Nanoparticle (nm) Pore Volume3 /g) Pore Diameter Surface Area
Adsorbent (cm (nm) (m2 /g)
(nm) 3(cm /g) (nm) 2 (m /g)
DP DP 3032.45
3032.45 0.004 0.004 7.22 7.22 1.98 1.98
ATDPATDP 142.95
142.95 0.162 0.162 15.46 15.46 41.97 41.97
2.2.2.2. Screening
Screening of of
DP DPand
andATDP
ATDP as
as Multi-Mycotoxin
Multi‐Mycotoxin Adsorbing
AdsorbingAgents
Agents
DP and ATDP at 5 mg/mL dosage (0.5% w/v) were preliminarily tested for their ability to bind
DP and ATDP at 5 mg/mL dosage (0.5% w/v) were preliminarily tested for their ability to bind the
the mixture of five mycotoxins. Adsorption experiments were performed at a constant temperature
mixture of five mycotoxins. Adsorption experiments were performed at a constant temperature of
of 37 °C and media of pH 3 and 7, using 1 mM citrate or 100 mM phosphate buffer. To measure
◦
37 mycotoxin
C and media of pH 3by and 7, using
adsorption ATDP at pH17,
mM citrateconcentrated
a 100‐fold or 100 mM phosphate buffer.was
phosphate buffer To required
measuresince
mycotoxin
adsorption
the ATDP suspension acidified the 1 mM phosphate buffer. As shown in Table 2, adsorption by the
by ATDP at pH 7, a 100-fold concentrated phosphate buffer was required since DP ATDP
suspension
and ATDP depended on the type of mycotoxin and pH of the medium. Maximum mycotoxin ATDP
acidified the 1 mM phosphate buffer. As shown in Table 2, adsorption by DP and
adsorption
depended by DP
on the wasof53%
type for ZEA (pH
mycotoxin and 3),
pH46% for AFB
of the 1 (pH 3),
medium. and 18% for
Maximum OTA (pH 3).
mycotoxin AFB1 and by DP
adsorption
wasZEA
53%adsorption
for ZEA (pHwas 3),
not46%
affected by pH.
for AFB 1
OTA
(pH adsorption
3), and 18% occurred
for OTA mainly
(pH 3).at pH
AFB 1
3, while
and ZEAFB1adsorption
and
DON adsorption was negligible (≤2%). Interestingly, treatment with sulfuric
was not affected by pH. OTA adsorption occurred mainly at pH 3, while FB1 and DON adsorption acid significantly
wasincreased
negligible adsorption of most mycotoxins assayed in the study. The ATDP reduced AFB1 and ZEA by
(≤2%). Interestingly, treatment with sulfuric acid significantly increased adsorption of
more than 98% in media at pH 3 and 7. OTA adsorption by ATDP at pH 3 and 7 was significantly
most mycotoxins assayed in the study. The ATDP reduced AFB1 and ZEA by more than 98% in media
higher than adsorption by DP, being 97% at acid pH and 42% at neutral pH. Acid treatment of DP
at pH 3 and 7. OTA adsorption by ATDP at pH 3 and 7 was significantly higher than adsorption by
also increased FB1 adsorption, but at acidic pH only. At pH 3, FB1 adsorption was 86%, while no
DP,adsorption
being 97%was at acid pH and
observed 42%7.atAcid
at pH neutral pH. Acid
treatment treatment
did not improveofDON
DP also increased
adsorption, FB1 in
which adsorption,
all
butcases
at acidic pH than
was less only.13%.
At pH 3, FB1 adsorption
As previously was
reported [19] 86%, while
, treatment nowith
of DP adsorption wasmodified
sulfuric acid observed theat pH 7.
Acid treatment did not improve DON adsorption, which in all cases was less than 13%. As previously
reported [19], treatment of DP with sulfuric acid modified the physico-chemical properties of the DP
adsorption surface, increasing the binding sites available for mycotoxin adsorption.Toxins 2020, 12, 108 5 of 17
Table 2. Mycotoxin adsorptions by DP and ATDP tested at different pH values (7 and 3) and at 5 mg/mL
of dosage towards a multi-mycotoxin solution containing 1 µg/mL of each toxin. Values are means of
triplicate experiments ± standard deviations.
DP ATDP
Toxin
pH 3 pH 7 pH 3 pH 7
AFB1 46 ± 4 37 ± 2 98.4 ± 0.1 98.4 ± 0.1
ZEA 53 ± 2 52 ± 4 98.4 ± 0.4 99.6 ± 0.2
OTA 18 ± 1 0.7 ± 0.6 97.3 ± 0.1 42.2 ± 0.2
FB1 0 2.3 ± 0.7 86 ± 3 0
DON 0 2±1 2.0 ± 0.8 13 ± 2
2.3. Effect of Medium pH on Mycotoxin Adsorption and Desorption
Medium pH is an important parameter that affects the binding of mycotoxins by adsorbent
materials, by affecting both the charge distribution on the surface of the adsorbents and the degree of
ionization of the adsorbates. This is more important for adsorption processes in which electrostatic
interactions are involved. An effective multi-mycotoxin adsorbent should sequester a large spectrum
of mycotoxins with high efficacy, regardless of the medium pH, and should keep these contaminants
bound along the compartments of a GI tract, where pH values ranging from 1.5–7.5 can be encountered.
The results for pH (Figure 3) confirmed that AFB1 and ZEA adsorption by ATDP was stable within the
GI tract of monogastric animals since 100% of the toxins were adsorbed at pH values ranging from
3 to 9. A desorption study was performed to assess whether a change of pH caused a release of the
sequestered toxins. Mycotoxins were first adsorbed onto ATDP at pH 3, and then the pellet containing
the adsorbed mycotoxins was washed first with a buffer at pH 7 and then with methanol. Washing
solutions were analyzed for mycotoxin release. As shown in Table 3, AFB1 and ZEA adsorption was
100% at pH 3. No release was observed in the pH range from 3 to 7. The organic solvent (methanol)
extracted 34% of the AFB1 and 85% of the ZEA, suggesting stronger binding of AFB1 by ATDP than
by ZEA. OTA or FB1 adsorption and pH were inversely correlated. The adsorption efficacy of ATDP
decreased as the pH increased (Figure 3). As OTA and FB1 hold acid groups in their structure, the pH
of the medium is expected to affect the extent of mycotoxin adsorption [26]. OTA adsorption decreased
from 97% to 28% as the pH was increased from 3 to 9. Similarly, FB1 was adsorbed mainly at pH 3,
falling to 5% at pH above 6. However, despite the strong pH effect observed for OTA and FB1 , ATDP
was effective in retaining the adsorbed fractions after the medium pH was changed from 3 to 7 (Table 3).
The organic solvent extracted half of the adsorbed OTA, while FB1 was poorly desorbed (7%). Overall,
our study suggests that ATDP is highly efficacious in retaining FB1 , AFB1 , and OTA when a strong
solvent is used. DP is an agricultural waste fiber. In addition to cellulose, hemicellulose, and lignin, it
contains phenolic compounds with important biological properties [21]. The specific combination of
these chemical components, and the increased adsorption surface obtained by acid treatment, explains
the mycotoxin adsorption properties of ATDP.
Table 3. Mycotoxin adsorption and desorption from ATDP. Values are means ± standard deviations of
triplicate independent experiments.
Toxin Adsorption (%) Desorption (%)
pH 3 pH 7 Methanol
AFB1 100 0 34 ± 3
ZEA 98.9 ± 0.4 0.8 ± 0.2 85 ± 4
OTA 99.0 ± 0.3 2.0 ± 0.5 48 ± 3
FB1 91 ± 3 1.6 ± 0.3 6.5 ± 0.5Toxins 2020,12,
Toxins2020, 12,108
x FOR PEER REVIEW 66ofof17
17
100
pH 3
90
pH 4
80
pH 5
70
pH 6
adsorption (%)
60
pH 7
50
pH 8
40
pH 9
30
20
10
0
Figure 3. Effect of pH on AFB1 , ZEA, OTA, and FB1 adsorption by ATDP tested at 5 mg/mL
Figure towards
dosage 3. Effect aofmulti-mycotoxin
pH on AFB1, ZEA, OTA, and
solution FB1 adsorption
containing 1 µg/mL by ATDPtoxin.
of each testedValues
at 5 mg/mL dosage
are means of
towards a multi‐mycotoxin
triplicate experiments. solution containing 1 μg/mL of each toxin. Values are means of triplicate
experiments.
2.4. Effect of ATDP Dosage
2.4. Effect of ATDP Dosage
The effect of ATDP dosage on mycotoxin adsorption was investigated using equilibrium adsorption
isotherms. The goal
The effect of was
ATDP to calculate
dosage on themycotoxin
optimal adsorbent
adsorption dosage wasforinvestigated
further adsorption
using tests and to
equilibrium
compare
adsorption theisotherms.
efficacy of The
ATDP goalin was
simultaneously
to calculate binding
the optimal different mycotoxins.
adsorbent dosage As for shown
furtherin Figure 4,
adsorption
AFB
tests1 ,and
ZEA, toand OTA removal
compare the efficacy from ofaATDP
neutralinmedium increased
simultaneously as the dosage
binding increased.
different mycotoxins. Experimental
As shown
values
in Figureadsorption
4, AFB1,ontoZEA,ATDP
and OTA were removal
in the ranges
fromofa 48–100%
neutral mediumfor AFB1increased
, 31–100%as forthe
ZEA, and 0–69%
dosage for
increased.
OTA. No significant
Experimental values FBadsorption
1 adsorption was
onto observed
ATDP were at pH
in 7.
the The
rangesadsorption
of 48–100%plots for
for all
AFB toxins
1, showed
31–100% for
aZEA,
characteristic
and 0–69% L-shape (Figure
for OTA. 4) and wereFB
No significant well fitted by the
1 adsorption wasLangmuir
observedmodel at pH (R 2 > 0.99).
7. The This model
adsorption plots
allowed calculation
for all toxins showedofaboth the theoretically
characteristic L‐shape estimated
(Figure 4) and maximumwere well adsorption
fitted byAds the max and the
Langmuir C50 ,
model
which is theThis
(R2 > 0.99). theoretically-estimated
model allowed calculation adsorbent dosage
of both the to achieve a 50%
theoretically reduction
estimated of the absorbable
maximum adsorption
toxin
Adsmax [26].
and Predicted Adsmaxis values
the C50, which were 101 ± 1% for AFB
the theoretically‐estimated 1 , 104 ± 1%
adsorbent for ZEA,
dosage and 103
to achieve ± 1%reduction
a 50% for OTA
(Table
of the 4). Additionally,
absorbable toxin C[26].
50 values
Predicted listed
Adsin Table
max 4
valuessuggest
were a
101higher
± 1% efficacy
for AFB 1of
, ATDP
104 ± 1% adsorption
for ZEA, of
and
AFB
103 1±and1% ZEA than (Table
for OTA of OTA. 4).ItAdditionally,
should not therefore
C50 valuesbe useful
listed to inincrease
Table 4 the dosage
suggest of ATDP
a higher beyond
efficacy of
6ATDP
mg/mLadsorption
when sequestering
of AFB1 and AFBZEA 1 , ZEA, and
than ofOTA
OTA. from a 1 µg/mL
It should not solution
therefore(Table 4). Intothe
be useful following
increase the
equilibrium
dosage of ATDP isotherm studies,
beyond the optimal
6 mg/mL when adsorbent
sequestering dosages
AFB1,were ZEA,fixed
and inOTAthe from
rangeaof 0.5 to 5 solution
1 μg/mL mg/mL
(Table 4). In
depending onthe
thefollowing
toxin. equilibrium isotherm studies, the optimal adsorbent dosages were fixed in
the range of 0.5 to 5 mg/mL depending on the toxin.
2.5. Equilibrium Adsorption Isotherm
Isotherms are an effective approach to the study of surface adsorption mechanisms, surface
properties, and an adsorbent affinity [16]. Nonlinear regression was used to assess the goodness
of fit and to calculate the parameters involved in the adsorption mechanism (Adsmax , KL ). The
mathematical models, including the Freundlich, Langmuir, and Sips equations, were used to predict
the amount of AFB1 , ZEA, OTA, and FB1 adsorbed by ATDP. The model that met regression analysis
requirements (homogeneity of variance and normality assumptions), providing a lower statistical
error, was used to fit the experimental data (Table 5). The amount of AFB1 , ZEA, OTA, and FB1
adsorbed per unit mass of ATDP increased gradually as the mycotoxin concentration in the working
solution increased. Isotherms showed an exponential relationship and a typical L (Langmuir) shape.
In all cases, regardless of medium pH, the Langmuir model was found to best fit the experimental
adsorption data. This model assumes that adsorption occurs at definite localized sites, which are
identical and equivalent [27]. This implies that the adsorption of AFB1 , ZEA, OTA, and FB1 by ATDP
is homogeneous. As shown in Table 5, AFB1 adsorption by ATDP produced isotherms showing
similar Adsmax values at pH 3 and 7. However, affinity was affected by the pH of the medium. The
KL Langmuir constant, which is related to adsorbent affinity, was 2.5-fold higher at pH 7 than pH 3Toxins 2020, 12, 108 7 of 17
(Table 5). The increase of pH from 3 to 7 induced an increase in the KL value from 0.4 ± 0.1 L/mg
(125 000 ± 31.250 L/mol) to 1.0 ± 0.1 L/mg (312.500 ± 31 250 L/mol). This resulted in an increase in
AFB1 adsorption affinity. Experimental values for AFB1 adsorption in percent varied in the ranges
of 50–84% at pH 3 and 76–100% at pH 7. The predicted values for maximum adsorption capacity
were 12.7 ± 0.9 µg/mg (40.7 ± 2.9 mmol/kg) at pH 3 and 13.0 ± 0.4 µg/mg (41.6 ± 1.3 mmol/kg) at
pH 7 (Table 5). These values were in agreement with experimental results obtained at both pH values
and were consistent with previous reports that AFB1 adsorption by agricultural by-products is not
dependent on medium pH [16,26]. Compared with previous studies of agricultural by-products,
ATDP showed higher AFB1 adsorption. The Langmuir isotherm was also found to be the best model
when studying ZEA adsorption by ATDP (Figure 5 and Table 5). ZEA adsorption was not affected
by the change in medium pH from 3 and 7). The experimental values for ZEA adsorption ranged
from 70% to 86% at pH 3 and 54% to 100% at pH 7. The predicted maximum adsorption capacity
was 5.5 ± 0.3 µg/mg (17.3 ± 0.9 mmol/kg) at pH 3 and 4.9 ± 0.3 µg/mg (15.4 ± 0.9 mmol/kg) at pH 7.
The Langmuir KL parameters were 2.2 ± 0.2 L/mg (700.637 ± 63.694 L/mol) at pH3 and 2.9 ± 0.6 L/mg
(923.567 ± 191.082 L/mol) at pH 7. ZEA is a resorcyclic acid lactone and a hydrophobic compound [28].
It is a weak acid due to the presence of the diphenolic moiety and has a pKa of 7.62 [28]. At the pH
values considered in this study (pH ≤ 7), it should be in protonated, nonionic form. ZEA adsorption by
ATDP may involve hydrophobic interactions occurring at homogeneous adsorption sites with similar
energy, as suggested by the Langmuir KL parameter values. Unlike AFB1 and ZEA adsorption, OTA
adsorption by ATDP was widely affected by pH. The experimental values for OTA adsorption were
47–96% at pH 3 and 46–65% at pH 7. Maximum adsorption capacities calculated at pH 3 and 7 were
18.8 ± 1.5 µg/mg (46.6 ± 3.7 mmol/kg) and 0.26 ± 0.02 µg/mg (0.64 ± 0.05 mmol/kg), respectively. KL
Langmuir values calculated were 1.90 ± 0.21 L/mg (766.129 ± 84.677 L/mol) at pH 3 and 1.30 ± 0.12 L/mg
(524.193 ± 48.387 L/mol) at pH 7. As OTA is an ionizable molecule, a change in pH is expected to
affect adsorption. The decrease in both Adsmax and KL values for OTA adsorption at pH 7 may reflect
by the presence of an anionic form of the toxin, producing repulsion between the OTA molecules
and negative charges on the ATDP surface. In addition, these results suggest that hydrophobicity is
implicated in OTA adsorption. Indeed, OTA was preferentially adsorbed at pH 3 when the uncharged
form was predominant. At pH 7, OTA hydrophobicity decreased, affecting mycotoxin adsorption.
In conclusion, OTA adsorption by ATDP may involve several mechanisms, including electrostatic
forces and hydrophobic interactions, whose roles depend on the pH of the medium. As observed for
OTA, FB1 adsorption was dependent first on pH, then on the degree of ionization of the molecules.
FB1 adsorption was achieved at pH 3 only, since no adsorption was recorded at pH 7 (Figure 5).
The experimental values for FB1 adsorption were in the range 67–100%. The predicted maximum
adsorption capacity was 20.9 ± 1.2 µg/mg (28.9 ± 1.7 mmol/kg) at pH 3 (Table 5). The Langmuir KL
parameter was 1.7 ± 0.4 L/mg (1223.021 ± 287.769 L/mol). It can be concluded that, in acidic aqueous
solutions, FB1 adsorption by ATDP is favoured and occurs mainly by polar non-covalent interactions.
These include electrostatic interactions or hydrogen bonds involving the carboxylic functional groups.
The efficacy of ATDP in removing mycotoxins from liquid media was significantly higher than previous
reports of biosorbents: lactic acid bacteria, yeasts, moulds, and agricultural by-products [16,29–34].
Table 4. The theoretically estimated maximum adsorption (Adsmax ) and inclusion rate of ATDP to
obtain a 50% reduction of the absorbable toxin (C50 ). Adsmax and C50 were calculated by fitting the
data from Figure 4 with the Langmuir isotherm model.
Toxin Adsmax (%) C50 (mg/mL)
AFB1 101 ± 1 0.11
ZEA 104 ± 1 0.19
OTA 103 ± 1 5.77Toxins 2020, 12, 108 8 of 17
Toxins 2020, 12, x FOR PEER REVIEW 7 of 17
Toxins 2020, 12, x FOR PEER REVIEW 9 of 17
Normality failed failed failed passed passed passed failed
Constant
Variance passed passed passed passed passed passed failed
Test
Adsmax 20.89 ±
12.69 ± 0.93 13.02 ± 0.40 5.47 ± 0.28 4.90 ± 0.34 18.82 ± 1.49 0.26 ± 0.02
(±SE) 1.20
1.66 ±
KL (±SE) 0.41 ± 0.05 1.05 ± 0.06 2.17 ± 0.18 2.91 ± 0.61 1.90 ± 0.21 1.30 ± 0.12
0.35
R2 0.9966 0.9980 0.9938 0.9566 0.9970 0.9974 0.9754
SSres 0.2456 0.2394 0.0896 1.2691 0.2609 0.0001 43.4700
Langmuir
Sylx 0.1239 0.1223 0.0706 0.3011 0.1170 0.0019 1.5540
PRESS 0.4548 0.3329 0.111 1.9306 0.2996 0.0001 50.6400
Normality passed passed passed passed passed passed passed
Constant
Variance passed passed passed passed passed passed passed
Test
91.70 ±
qm (±SE) ‐ 11.67 ± 0.75 5.28 ± 0.73 ‐ ‐ ‐
52.45
0.15 ±
As (±SE) ‐ 1.35 ± 0.90 2.38 ± 0.81 ‐ ‐ ‐
0.10
1/n = nH 0.37 ±
‐ 1.08 ± 0.97 1.02 ± 0.08 ‐ ‐ ‐
(±SE) 0.03
R2 ‐ 0.9983 0.9938 ‐ ‐ ‐ 0.9979
Sips
SSres ‐ 0.206 0.0892 ‐ ‐ ‐ 3.8247
Sylx ‐ 0.1172 0.0724 ‐ ‐ ‐ 0.4743
PRESS ‐ 0.3403 0.1242 ‐ ‐ ‐ 4.2181
Normality failed passed ‐ ‐ ‐ failed
FigureFigure 4. Constant
4. Effect Effect of adsorbent
of adsorbent dosageononAFB
dosage AFB11,, ZEA,
ZEA, andandOTA
OTAadsorptions
adsorptions by by
ATDP.
ATDP.Equilibrium
Equilibrium
Variance passed failed ‐ ‐ ‐ failed
adsorption
adsorption isotherms
isotherms were
were obtained
obtained at atconstant
constant temperature
temperature (37
(37°C) and
◦ C) at at
and pHpH7 by
7 testing
by a fixed
testing a fixed
Test
amount
amount of toxin
of toxin (1 μg/mL)
(1 µg/mL) with
with increasing
increasing adsorbentdosages
adsorbent dosages (0.1–10
(0.1–10mg/mL).
mg/mL).
Table 4. The theoretically estimated maximum adsorption (Adsmax) and inclusion rate of ATDP to
obtain a 50% reduction of the absorbable toxin (C50). Adsmax and C50 were calculated by fitting the data
from Figure 4 with the Langmuir isotherm model.
Toxin Adsmax (%) C50 (mg/mL)
AFB1 101 ± 1 0.11
ZEA 104 ± 1 0.19
OTA 103 ± 1 5.77
2.5. Equilibrium Adsorption Isotherm
Isotherms are an effective approach to the study of surface adsorption mechanisms, surface
properties, and an adsorbent affinity [16]. Nonlinear regression was used to assess the goodness of
fit and to calculate the parameters involved in the adsorption mechanism (Adsmax, KL). The
mathematical models, including the Freundlich, Langmuir, and Sips equations, were used to predict
the amount of AFB1, ZEA, OTA, and FB1 adsorbed by ATDP. The model that met regression analysis
requirements (homogeneity of variance and normality assumptions), providing a lower statistical
error, was used to fit the experimental data (Table 5). The amount of AFB1, ZEA, OTA, and FB1
adsorbed per unit mass of ATDP increased gradually as the mycotoxin concentration in the working
solution increased. Isotherms showed an exponential relationship and a typical L (Langmuir) shape.
In all cases, regardless of medium pH, the Langmuir model was found to best fit the experimental
adsorption data. This model assumes that adsorption occurs at definite localized sites, which are
identical and equivalent [27]. This implies that the adsorption of AFB1, ZEA, OTA, and FB1 by ATDP
is homogeneous. As shown in Table 5, AFB1 adsorption by ATDP produced isotherms showing
similar Adsmax values at pH 3 and 7. However, affinity was affected by the pH of the medium. The KL
Langmuir constant, which is related to adsorbent affinity, was 2.5‐fold higher at pH 7 than pH 3
Figure 5. Effect of mycotoxin concentration on AFB1 , ZEA, OTA, and FB1 adsorption by ATDP.
Equilibrium adsorption isotherms were obtained at constant temperature (37 ◦ C) and pH (3 and 7) by
testing a fixed amount of ATDP with increasing toxin concentrations (0.025–7.5 µg/mL).Toxins 2020, 12, 108 9 of 17
Table 5. The isotherm model parameters of mycotoxin adsorption by ATDP calculated at different pH values.
AFB1 ZEA OTA FB1
Parameters
pH 3 pH 7 pH 3 pH 7 pH 3 pH 7 pH 3
Kf (±SE) 3.32 ± 0.05 6.43 ± 0.12 4.66 ± 0.17 3.33 ± 0.04 18.09 ± 0.17 0.17 ± 0.00 11.86 ± 0.14
1/n (±SE) 0.76 ± 0.02 0.67 ± 0.03 0.69 ± 0.02 0.45 ± 0.01 0.79 ± 0.01 0.77 ± 0.02 0.33 ± 0.00
R2 0.9977 0.9892 0.9850 0.9948 0.9997 0.9966 0.9976
SSres 0.1705 1.2987 0.0120 0.1517 0.0272 0.0001 4.3605
Freundlich
Sylx 0.1032 0.2849 0.1097 0.1041 0.0379 0.0022 0.4922
PRESS 0.3656 1.6869 0.2661 0.1668 0.0336 0.0001 4.6588
Normality failed failed failed passed passed passed failed
Constant Variance Test passed passed passed passed passed passed failed
Adsmax (±SE) 12.69 ± 0.93 13.02 ± 0.40 5.47 ± 0.28 4.90 ± 0.34 18.82 ± 1.49 0.26 ± 0.02 20.89 ± 1.20
KL (±SE) 0.41 ± 0.05 1.05 ± 0.06 2.17 ± 0.18 2.91 ± 0.61 1.90 ± 0.21 1.30 ± 0.12 1.66 ± 0.35
R2 0.9966 0.9980 0.9938 0.9566 0.9970 0.9974 0.9754
Langmuir SSres 0.2456 0.2394 0.0896 1.2691 0.2609 0.0001 43.4700
Sylx 0.1239 0.1223 0.0706 0.3011 0.1170 0.0019 1.5540
PRESS 0.4548 0.3329 0.111 1.9306 0.2996 0.0001 50.6400
Normality passed passed passed passed passed passed passed
Constant Variance Test passed passed passed passed passed passed passed
qm (±SE) - 11.67 ± 0.75 5.28 ± 0.73 - - - 91.70 ± 52.45
As (±SE) - 1.35 ± 0.90 2.38 ± 0.81 - - - 0.15 ± 0.10
1/n = nH (±SE) - 1.08 ± 0.97 1.02 ± 0.08 - - - 0.37 ± 0.03
R2 - 0.9983 0.9938 - - - 0.9979
Sips SSres - 0.206 0.0892 - - - 3.8247
Sylx - 0.1172 0.0724 - - - 0.4743
PRESS - 0.3403 0.1242 - - - 4.2181
Normality failed passed - - - failed
Constant Variance Test passed failed - - - failedToxins 2020, 12, 108 10 of 17
2.6. Multi-Mycotoxin Adsorption in Simulated Gastrointestinal Fluid
The aim of this study is to assess whether ATDP, acting as a wide spectrum mycotoxin adsorbent,
shows the same adsorption pattern after simulated gastrointestinal digestion. In vitro digestion models
are successfully used as tools for assessing the bioaccessibility of nutrients and non-nutrients or the
digestibility of macronutrients (e.g., lipids, proteins, and carbohydrates) in food matrices. These
methods mimic physiological conditions in the gastrointestinal tract, taking into account the presence
of digestive enzymes and their concentrations, pH, digestion time, and salt concentration, among
other factors. In vitro assessment of mycotoxin bioaccessibility has been done through a number of
approaches including static and dynamic digestion models, simulating the gastro-intestinal tract of
monogastric animals and humans [35–38]. In the current study, the standardized digestion model
described by Minekus et al. [39], comprising oral, gastric and small intestinal digestion phases, was
used to assess the ability of ATDP to reduce the fraction of mycotoxins in the chyme available for
absorption. For this purpose, a pool of mycotoxins containing AFB1 , OTA, ZEA, and FB1 was subjected
to gastro-intestinal digestion processes in the presence/absence of ATDP and, subsequently, the
liquid fraction of the chyme obtained by centrifugation was analyzed for residual mycotoxin content.
Mycotoxin bioaccessibility, calculated after gastric or intestinal (complete) digestion, was defined as
the ratio between the initial mycotoxin content and the amount determined in the chyme at the end
of the digestion phases. Under our experimental conditions, mycotoxin bioaccessibility was in the
range 96.5–33.5% after gastric digestion and 96.3–39.7% after intestinal digestion (Table 6). For the
mycotoxins tested, bioaccessibility decreased in the following order: AFB1 > FB1 > OTA > ZEA. It
is worthy to note that the low values of ZEA or OTA bioaccessibility after gastrointestinal digestion
were probably due to the formation of aggregates in the complex environment of the gastrointestinal
digestive fluids. For the mycotoxins tested here, bioaccessibility at gastric and intestinal levels did
not differ substantially. Digestion of ATDP in the presence of mycotoxin significantly reduced the
fraction of toxins available for absorption, at both gastric and intestinal levels. Due to the inclusion
of ATDP, mycotoxin bioaccessibility ranged from 25.8% to 0.8% at the gastric level, and from 78.9%
to 4.3% at the intestinal level. These preliminary results suggest that ATDP was more effective in
sequestering mycotoxins under the physiological conditions present in the stomach when the pH was
low. Gastric digestion of ATDP reduced mycotoxin bioaccessibility by 93.6 ± 0.1% for AFB1 , 97.6 ± 0.1%
for ZEA, 96.2 ± 1.0% for OTA, and 67.3 ± 3.7% for FB1 . At the completion of digestion, including
the gastric and intestinal digestion phases, the reduction of AFB1 bioaccessibility by ATDP persisted
(95.1 ± 0.1%). Smaller mycotoxin reductions were recorded at intestinal levels for ZEA (68.9 ± 1.1%),
OTA (10.1 ± 2.6%), and FB1 (2.6 ± 2.7%). Overall findings suggest that AFB1 , ZEA, OTA, and FB1 are
quickly and efficiently sequestered by ATDP in the stomach. During the transit of the chyme from
the stomach to the intestine, AFB1 and ZEA remained bound by ADTP, whereas some OTA and FB1
were released. The change in pH of the gastrointestinal fluids occurring during digestion may be the
main factor driving OTA and FB1 release at the intestinal level. The model used in this study is a static
one, and cannot simulate meal size, peristaltic movement, gastrointestinal transit, or absorption of
digested products or water. However, it is a valid approach to investigating the adsorption/release of
mycotoxins in a complex environment such as the stomach or the intestine.
Table 6. Percentages of AFB1 , ZEA, OTA, and FB1 recovered in the gastrointestinal fluids after simulated
gastric or gastro-intestinal digestion processes. Mycotoxins were digested in the absence (control) or
presence of ATDP. Values are means ± standard deviations of five independent experiments.
Bioaccessibility (%) Bioaccessibility Reduction (%)
Toxin Gastric Phase Intestinal Phase Intestinal
Gastric Phase
Control +ATDP Control +ATDP Phase
AFB1 96.5 ± 0.9 6.3 ± 0.1 96.3 ± 0.8 4.3 ± 0.2 93.6 ± 0.1 95.1 ± 0.0
ZEA 33.5 ± 0.9 0.8 ± 0.1 39.7 ± 1.4 12.4 ± 0.4 97.6 ± 0.1 68.9 ± 1.1
OTA 49.6 ± 0.7 1.9 ± 0.5 43.6 ± 1.3 39.2 ± 1.1 96.2 ± 1.0 10.1 ± 2.6
FB1 78.8 ± 1.9 25.8 ± 2.9 81.2 ± 2.9 78.9 ± 1.9 67.3 ± 3.7 2.6 ± 2.7Toxins 2020, 12, 108 11 of 17
3. Conclusions
Several studies have shown agricultural by-products to be suitable precursor materials for
the effective and suitable removal of contaminants from aqueous media, including mycotoxins.
Unfortunately, most of these biomaterials are unsuitable for adsorption in their raw form and must
be pre-treated to improve their innate adsorption capacities. These pre-treatments include physical
processes (drying, autoclaving, grinding, milling, or sieving) and chemical modification with reagents.
Physico-chemical modification can enhance adsorption by reducing particle size and increasing surface
area. In the present study, chemical activation of DP by sulfuric acid significantly improved surface
area for adsorption, pore size distribution, and total pore volume. Structural characterization showed
more cavities to be present on the surface of the ATDP than the untreated material (DP). C and O
were the major surface elements. In addition, acid treatment changed the functional groups and
charge on the adsorbent surface. These structural changes may explain the higher efficacy of ATDP
than pristine DP in adsorbing mycotoxins. This is the first time that DP has been evaluated for its
efficacy in sequestering mycotoxins. ATDP was found to be more effective than other mycotoxin
biosorbent materials in removing mycotoxins from liquid mediums: lactic acid bacteria, yeasts, molds,
or other agricultural by-products. Biosorption of mycotoxins was investigated by batch adsorption.
Adsorption isotherms indicated that the process is dependent on key operating parameters, including
medium pH, adsorbent dose, and initial mycotoxin concentration. Maximum adsorption capacities
were described by the Langmuir isotherm. Values of Qmax determined at pH 3 and pH 7 were 40.7 and
41.6 mmol kg−1 for AFB1 , 15.4 and 17.3 mmol/kg for ZEA, 46.6 and 0.6 mmol/kg for OTA, and 28.9 and
0.1 mmol/kg for FB1 . DON was not sequestered by the raw or pre-treated agricultural by-product. The
pH of the medium significantly affected OTA and FB1 adsorption, whereas AFB1 and ZEA adsorptions
were not pH-dependent. As a consequence, digestion of ATDP (at 0.5% w/v dosage) in the presence
of a multi-mycotoxin solution containing 1 µg/mL of each toxin (AFB1 , OTA, ZEA, and FB1 ) by a
static, validated gastrointestinal model, significantly reduced the bioaccessibility of all mycotoxins
(>67% reduction) at gastric level. After digestion was completed, including a gastric and an intestinal
step, significant reductions in mycotoxin bioaccessibility were recorded for AFB1 (94%) and ZEA (69%).
These findings suggest that, during transit through the gastro-intestinal tract of a monogastric, most
ingested AFB1 and ZEA can be adsorbed by ATDP and excreted in feces. In contrast, FB1 and OTA
may be adsorbed in the stomach and released into the lumen of the intestine. Taking into account that
most mycotoxins are quickly absorbed at the gastric level or in the upper part of the small intestine,
the results of this study show the potential of ATDP as a multi-mycotoxin biosorbent. Further research
is required to clarify the components of ATDP that are involved in the biosorption of mycotoxins and
to confirm its efficacy in vivo.
4. Materials and Methods
4.1. Reagents and Samples
Solid mycotoxin standards (purity >98%), including aflatoxin B1 (AFB1 ), ochratoxin A (OTA),
zearalenone (ZEA), deoxynivalenol (DON), and fumonisin B1 (FB1 ) were supplied by Sigma-Aldrich
(Milan, Italy). All chemical reagents were purchased from Carlo Erba (Rouen, France), except for sodium
chloride (NaCl) and potassium chloride (KCl), which were purchased from VWR (Leuven, Belgium).
All solvents (HPLC grade) were purchased from J.T. Baker (Deventer, the Netherlands). Water was of
Milli-Q quality (Millipore, Bedford, MA, USA). Digestive enzymes including α-amylase (from human
saliva type IX-A, 1000–3000 U/mg), pepsin (from porcine gastric mucosa, 3200–4500 U/mg), pancreatin
(from porcine pancreas, 4× USP), and bile bovine were supplied by Sigma-Aldrich (Milan, Italy).
Mycotoxin adsorption studies were performed using different media (1 or 100 mmol/L) of different pH:
citrate buffer at pH 3 (1 mM), acetate buffers at pH 4 and 5 (100 mM), and phosphate buffers at pH 6–9
(100 mM). Stock solutions of AFB1 , OTA, ZEA, and DON (1 mg/mL) were prepared by dissolving solid
commercial toxins in acetonitrile. FB1 was prepared in acetonitrile–water (50:50, v/v). Stock solutionsToxins 2020, 12, 108 12 of 17
were stored in the dark at 4 ◦ C. A multi-mycotoxin stock solution containing 200 µg/mL of each toxin
was prepared by mixing equal volumes of mycotoxin stock solutions. This was diluted with buffered
solutions to prepare the mycotoxin working solutions for adsorption experiments. The Monthong
durian peel (DP) used in the study was obtained from a local fruit shop in Bangkok, Thailand. The DP
was washed with water to remove surface-adhered dirt and then cut into small pieces. These were
oven-dried overnight, then, ground into fine powder using a mechanical grinder and passed through
35-mesh (0.5 mm) sieves. Particles smaller than 0.5 mm were collected and treated with sulfuric acid.
The acid-treated material (ATDP) was heated overnight. It was then washed with distilled water to
neutralize any acid residues and heated again. Untreated DP and ATDP, of the same particle size, were
kept in a desiccator until use.
4.2. Physico-Chemical Characterization of DP and ATDP
The surface morphology and elementary composition of the DP and ATDP were investigated
using scanning electron microscopy coupled with energy dispersive X-ray spectroscopy (SEM–EDS)
(SU-5000, HITASHI, Tokyo, Japan). For identification of the chemical functional groups present on
the DP and ATDP surfaces, a Fourier transform infrared spectroscopy (FTIR) (Nicolet 6700 FT-IR
Spectrometer, Thermo Scientific, Waltham, MA, USA) analysis was performed in the spectral range
from 4000 to 400 cm−1 . The particle size and surface charge were measured using mastersizer and
zetasizer instruments (Nano ZS, Malvern, UK). Brunauer–Emmett–Teller (BET) specific surface area,
pore size distribution, and total pore volume were obtained from N2 adsorption–desorption isotherms
using a surface area analyzer (Autosorb-1C, Quantachrome Corporation, Boynton Beach, FL, USA).
Adsorption isotherms were obtained by measuring the amount of N2 adsorbed to the surface of both
biosorbents at 77.26 K. Desorption isotherms were derived by removing the N2 adsorbed through
a gradual pressure reduction. The methods used to characterize the DP and ATDP are reported
elsewhere [25,40,41].
4.3. Multi-Mycotoxin Adsorption Experiments
DP and ATDP efficacy in adsorbing AFB1 , OTA, ZEA, DON, and FB1 was evaluated at pH 3 and 7
using 1 mM citrate buffer and 100 mM phosphate buffer, respectively. Adsorption experiments were
performed following the method of Avantaggiato et al. [26]. Briefly, DP and ATDP (< 500 µm particle
size fraction) were weighed in a 4 mL silanized amber glass vial and suspended with an appropriate
volume of multi-mycotoxin working solution buffered at pH 3 or 7. The suspensions were mixed for
few seconds by vortex and then shaken for 90 min in a thermostatically-controlled shaker (KS 4000,
IKA® -Werke GmbH & Co. KG, Staufen, Germany) at 37 ◦ C and 250 rpm. After incubation, 1 mL of
each suspension was transferred into an Eppendorf tube and centrifuged for 20 min at 18,000× g and
25 ◦ C. Supernatant samples were analyzed for residual mycotoxin content following the HPLC and
UPLC methods described by Avantaggiato et al. [26]. Adsorption experiments were carried out by
adding 5 mg/mL of DP and ATDP to a multi-mycotoxin working solution comprising 1 µg/mL of each
mycotoxin. To study the effect of pH on mycotoxin adsorption onto ATDP, independent experiments
were performed in triplicate at pH values of 3–9, using a 5 mg/mL dosage (corresponding to 0.5%
w/v). To investigate the desorption of mycotoxins from ATDP due to pH change, 5 mg of ATDP were
dissolved with 1 mL of working solution at pH 3, containing 1 µg/mL of each toxin. Samples were
incubated at 37 ◦ C for 90 min in a rotary shaker (250 rpm). After centrifugation, the supernatants were
completely removed and analyzed for residual mycotoxin content to calculate mycotoxin adsorption.
The adsorbent pellets were washed with 1 mL of buffer at pH 7 and shaken for 30 min at 37 ◦ C and
250 rpm. They were centrifuged, and the supernatants analyzed to assess mycotoxin desorption.
This procedure was repeated by washing the pellet with 1 mL of methanol. Desorption studies were
performed in triplicate. Adsorption (pH 3) and desorption (pH 7 and methanol) values were calculated
for each toxin and expressed as percentages.Toxins 2020, 12, 108 13 of 17
4.4. Equilibrium Adsorption Isotherms
Two sets of equilibrium adsorption isotherms were calculated to study the effect of adsorbent
dosage and toxin concentration on simultaneous adsorption of AFB1 , OTA, ZEA, and FB1 . Due to
the inefficacy of ATDP in adsorbing DON from all media used in the preliminary adsorption trials,
DON was excluded from the study. In addition, since FB1 was not adsorbed at pH 7, equilibrium
adsorption isotherms for FB1 were derived only at pH 3. Equilibrium adsorption isotherms matched
to the experimental conditions (90 min equilibrium time, 37 ◦ C, 250 rpm), as used for the preliminary
adsorption experiments. The first set of adsorption isotherms was analyzed in triplicate, at constant pH
7, a fixed amount of toxin (1 µg/mL) with ATDP dosages ranging from 0.005–1% w/v (0.05–10 mg/mL) for
AFB1 , 0.005–1% w/v (0.005–10 mg/mL) for ZEA, and 0.01–1% w/v (0.1–10 mg/mL) for OTA. Adsorption
data were expressed as a percentage of mycotoxin adsorbed and plotted as a function of ATDP dosage.
Mycotoxin adsorption plots were fitted using non-linear regression models. The second set of isotherms
was derived by testing a fixed amount of ATDP with buffered solutions at toxin concentrations from
0.025–15 µg/mL. These isotherms were used to calculate the parameters related to the adsorption
process, including maximum adsorption capacity (Adsmax ) and affinity (KL ). Adsorbent dosages were
set from the preliminary adsorption experiments, using a 0.05% w/v (0.5 mg/mL) adsorbent dosage for
AFB1 , ZEA, and FB1 . A 0.02% w/v (0.2 mg/mL) and a 0.5% w/v (5 mg/mL) dosage were used for OTA
adsorption at pH 3 and 7, respectively. Adsorption isotherms were obtained by plotting the amount of
mycotoxin adsorbed per unit of mass of adsorbent (Qeq ) against the concentration of the toxin in the
external phase (Ceq ) under equilibrium conditions, then fitting using non-linear regression models.
4.5. Simulated Gastrointestinal Digestion
Since the gastrointestinal system is the primary target of mycotoxins, the “protective” effect of
ATDP in reducing AFB1 , OTA, ZEA, and FB1 bioaccessibility (i.e., the amount of mycotoxin that is
released from the food matrix and is available for absorption through the gut wall) was determined by
simulating a gastro-intestinal digestion process. In particular, mycotoxins in the presence or absence
(negative controls) of ATDP were subjected to a simulated gastrointestinal digestion process and,
subsequently, the digestive fluids obtained after gastric and/or intestinal digestion were analyzed
for residual mycotoxin. The standardized digestion model described by Minekus et al. [39] was
used in this study. This model describes a three-step procedure simulating digestive processes in the
mouth, stomach, and small intestine (where most mycotoxin absorption takes place). A schematic
representation of this model is presented in Figure 6. During simulated digestion, samples were
rotated head-over-heels in a thermostatically controlled shaker (BFD53, ©BINDER-GmbH, Tuttlingen,
Germany) at 37 ◦ C for 2 min and 2 h to simulate, respectively, the oral phase and gastric or intestinal
phases. Physiological and enzymatic solutions were prepared as described by Minekus et al. [39].
Simulated digestion started by mixing 5 mL of physiological solution, containing the multi-mycotoxin
solution and ATDP at 5 mg/mL (0.5% w/v), with 3.5 mL of simulated salivary fluid (SSF). Next, 0.5 mL
of salivary α-amylase SSF solution (1500 U/mL) was added, followed by 25 µL of CaCl2 (0.3 M) and
975 µL of water, and thoroughly mixed. The simulated gastric and intestinal solutions were then added
in sequence. After 2 min incubation, simulated gastric juice at pH 3 was added, followed by 7.5 mL
of simulated gastric fluid (SGF), 1.6 mL of porcine pepsin SGF solution (25,000 U/mL), 5 µL of CaCl2
(0.3 M), 0.2 mL of HCl (1 M), and 0.695 mL of water. After 2 h of simulated gastric digestion, intestinal
fluids were added to the gastric chyme to mimic the digestion in the small intestine. Therefore, 20 mL
of gastric chyme was mixed in sequence with 11 mL of simulated intestinal fluid (SIF), 5.0 mL of
a pancreatin SIF solution (800 U/mL), 2.5 mL of bile (160 mM), 40 µL of CaCl2 (0.3 M), 0.15 mL of
NaOH (1 M), and 1.31 mL of water. Before starting intestinal digestion, the pH was adjusted to 7.
Two independent sets of simulated digestion experiments were performed to measure mycotoxin
bioaccessibility at gastric and intestinal levels. The first set of trials was stopped after the gastric
digestion phase. The second set included the gastric and intestinal phases. All experiments, including
negative controls (without ATDP), were performed in quintuplicate. At the completion of digestion,followed by 7.5 mL of simulated gastric fluid (SGF), 1.6 mL of porcine pepsin SGF solution (25,000
U/mL), 5 μL of CaCl2 (0.3 M), 0.2 mL of HCl (1 M), and 0.695 mL of water. After 2 h of simulated
gastric digestion, intestinal fluids were added to the gastric chyme to mimic the digestion in the small
intestine. Therefore, 20 mL of gastric chyme was mixed in sequence with 11 mL of simulated intestinal
fluid (SIF), 5.0 mL of a pancreatin SIF solution (800 U/mL), 2.5 mL of bile (160 mM), 40 μL of CaCl2
Toxins 2020, 12,M),
(0.3 108 0.15 mL of NaOH (1 M), and 1.31 mL of water. Before starting intestinal digestion, the pH 14 of 17
was adjusted to 7. Two independent sets of simulated digestion experiments were performed to
measure mycotoxin bioaccessibility at gastric and intestinal levels. The first set of trials was stopped
the gastric orthe
after intestinal fluids were
gastric digestion centrifuged
phase. The second at 4500 rpm forthe
set included 15 gastric
min and andanalyzed
intestinal by HPLC/UHPLC
phases. All
for residual mycotoxin
experiments, content.
including Prior controls
negative to LC analyses
(without of AFB1were
ATDP), , OTA, ZEA, and
performed FB1 , supernatant
in quintuplicate. At thesamples
completion
were cleaned of digestion,
up using the gastric (IMA)
immunoaffinity or intestinal fluidsprovided
columns were centrifuged at 4500 rpm
by VICAM© for 15 min MA,
(Watertown, and USA):
analyzed by HPLC/UHPLC for residual mycotoxin content. Prior to LC analyses of AFB1, OTA, ZEA,
AflaTest© WB, OchraTest© WB, ZearalaTest© WB, and FumoniTest© WB. Briefly, IMA columns
and FB1, supernatant samples were cleaned up using immunoaffinity (IMA) columns provided by
were attached to a vacuum manifold (Visiprep™ SPE, Sigma Aldrich, Milan, Italy). Then, 500 µL of
VICAM© (Watertown, MA): AflaTest© WB, OchraTest© WB, ZearalaTest© WB, and FumoniTest©
sample supernatants
WB. Briefly, IMA were passed
columns through
were attachedtheto columns
a vacuumat a flow (Visiprep™
manifold rate of approximately one drop per
SPE, Sigma Aldrich,
second. Milan,
Each column was
Italy). Then, 500washed with supernatants
μL of sample 5 mL of phosphatewere passedsaline buffer
through the (PBS)
columns followed
at a flowby rate5 mL of
of approximately one drop per second. Each column was washed with 5
water. AFB1 , OTA, or ZEA were eluted by 2 mL of methanol in a 4 mL silanized amber vial. FB1 was mL of phosphate saline
buffer2(PBS)
eluted using mL followed
of methanolby 5 mL of water.by
followed AFB 1, OTA, or ZEA were eluted by 2 mL of methanol
2 mL of water. Eluates were dried at 50 ◦ C under in a 4 an air
mL silanized amber vial. FB1 was eluted using 2 mL of methanol followed by 2 mL of water. Eluates
stream (nitrogen was used for FB1 ) and the residues were re-dissolved with 250 µL of methanol/water
were dried at 50 °C under an air stream (nitrogen was used for FB1) and the residues were re‐
(20:80, v/v), then with
dissolved vortexed
250 μL for
of 1methanol/water
min and injected into
(20:80, thethen
v/v), LCvortexed
systems.forThe LCand
1 min analysis
injectedwasintoperformed
the
following Greco et al. [16].
LC systems. The LC analysis was performed following Greco et al. [16].
Oral Phase
5 mL physiological solution (containing mycotoxins
+/‐ binder) + 3.5 mL SSF + 0.5 mL salivary amylase
(1500 U mL‐1) + 25 μL CaCl2 (0.3 M) + 0.975 mL water
37°C for 2 min, pH 7
HPLC/UHPLC analysis of mycotoxins content in
Gastric Phase
7.5 mL SGF + 1.6 mL pepsin (25 000 U mL‐1) + 5 μL
CaCl2 (0.3 M) + 0.2 mL HCl (1 M) + 0.695 mL water
gastric and intestinal fluids
37°C for 2 h, pH 3
Intestinal Phase
11 mL SIF + 5 mL pancreatin (800 U mL‐1) + 2.5 mL
bile (160 mM) + 40 μL CaCl2 (0.3 M) + 0.15 mL NaOH
(1 M) + 1.31 mL water
37°C for 2 h, pH 7
Flow6.diagram
Figure 6.Figure of the
Flow diagram of simulated digestion
the simulated digestionmodel proposed
model proposed byby Minekus
Minekus et al.et al. The
[39]. [39].model
The model
consists consists
of a three-step procedure
of a three‐step simulating
procedure the
simulating thedigestive processes
digestive processes in in
thethe mouth,
mouth, stomach,
stomach, and small
and small
intestine. SSF, SGF, and SIF stand for simulated salivary fluid, simulated gastric fluid, and simulated
intestinal fluid, respectively
4.6. Data Calculation and Curve Fitting
Mycotoxin adsorption was measured from the difference between the amount of mycotoxin in the
supernatant of the blank tubes and in the supernatant of the experimental tubes. The quantity present
in the supernatant of the blank tubes was expressed as percentage of adsorption. ATDP was tested from
two sets of equilibrium adsorption isotherms, using the methods reported by Avantaggiato et al. [26].
The first set of equilibrium adsorption isotherms was obtained by plotting the experimental adsorption
data, expressed as percentage of mycotoxin adsorbed (Ads%), as a function of product dosage: Ads%
= f (dosage). These data were transferred to SigmaPlot software (Systat.com, version 12.3) and fitted
using the Langmuir isotherm model. The second set of adsorption isotherms was obtained by plotting
the amount of mycotoxin adsorbed per unit of mass of product Qeq against the concentration of
the toxin in the external phase Ceq , under equilibrium conditions: Qeq = f (Ceq ). These data were
transferred to SigmaPlot and fitted using different mathematical isotherm models (i.e., the Langmuir,
Freundlich, and Sips models), as described by Avantaggiato et al. [26]. Mycotoxin bioaccessibility,You can also read