High performance ozone based advanced oxidation processes catalyzed with novel argon plasma treated iron oxyhydroxide hydrate for phenazopyridine ...
←
→
Page content transcription
If your browser does not render page correctly, please read the page content below
www.nature.com/scientificreports
OPEN High performance ozone based
advanced oxidation processes
catalyzed with novel argon plasma
treated iron oxyhydroxide hydrate
for phenazopyridine degradation
Rasool Pelalak1,2, Zahra Heidari3, Mojtaba Forouzesh3, Eslam Ghareshabani4, Reza Alizadeh3,
Azam Marjani5,6* & Saeed Shirazian7
The present study has focused on the degradation of phenazopyridine (PhP) as an emerging
contaminant through catalytic ozonation by novel plasma treated natural limonite (FeOOH·xH2O,
NL) under argon atmosphere (PTL/Ar). The physical and chemical characteristics of samples were
evaluated with different analyses. The obtained results demonstrated higher surface area for PTL/
Ar and negligible change in crystal structure, compared to NL. It was found that the synergistic
effect between ozone and PTL/Ar nanocatalyst was led to highest PhP degradation efficiency. The
kinetic study confirmed the pseudo-first-order reaction for the PhP degradation processes included
adsorption, peroxone and ozonation, catalytic ozonation with NL and PTL/Ar. Long term application
(6 cycles) confirmed the high stability of the PTL/Ar. Moreover, different organic and inorganic salts
as well as the dissolved ozone concentration demonstrated the predominant role of hydroxyl radicals
and superoxide radicals in PhP degradation by catalytic Ozonation using PTL/Ar. The main produced
intermediates during PhP oxidation by PTL/Ar catalytic ozonation were identified using LC–(+ESI)–MS
technique. Finally, the negligible iron leaching, higher mineralization rate, lower electrical energy
consumption and excellent catalytic activity of PTL/Ar samples demonstrate the superior application
of non-thermal plasma for treatment of NL.
The pharmaceutical wastewaters contain extensive amounts of bio-resistant contaminants that are not effectively
remediated through conventional biological methods such as activated sludge, sequencing batch reactor, biofilm
reactors, etc.1,2. Furthermore, physical processes like adsorption, coagulation or membrane processes are not
favorable because pollutants only transfer from one phase to another that needs more t reatment3–6. In the recent
decay, advanced oxidation processes (AOPs) are of great interest due to their potential to degrade any resistant
contaminants by in-situ generation of active oxidizing agents, good mineralization of pollutants and no extra
waste7–9. Among different types of AOPs, much attention has been paid to the ozone based processes because
of its accessibility, feasibility, high reactivity and purification of final effluent10–12. Ozone with 2.07 V redox
potential destroys organic contaminants through direct oxidation of pollutants and/or indirect mechanisms
by generation free hydroxyl radical (· OH ). Despite many advantages, the ozonation process was restricted by
some drawbacks such as solubility limitation and high cost of ozone generation13. To overcome these limitation,
combined methods are a promising solution which increases the efficiency of process by creating a synergistic
effect, producing more reactive species, increasing the mineralization rate and reducing the reaction t ime11. In
recent years, catalytic ozonation process is one of the most promising AOPs. In this process, the decomposition
of ozone is enhanced by applying a catalyst, leading to formation powerful hydroxyl radicals and other radical
1
Institute of Research and Development, Duy Tan University, Da Nang 550000, Vietnam. 2Faculty of Environmental
and Chemical Engineering, Duy Tan University, Da Nang 550000, Vietnam. 3Chemical Engineering Faculty,
Sahand University of Technology, Sahand New Town, Tabriz 51335‑1996, Iran. 4Physics Faculty, Sahand University
of Technology, Sahand New Town, Tabriz 51335‑1996, Iran. 5Department for Management of Science and
Technology Development, Ton Duc Thang University, Ho Chi Minh City, Vietnam. 6Faculty of Applied Sciences, Ton
Duc Thang University, Ho Chi Minh City, Vietnam. 7Laboratory of Computational Modeling of Drugs, South Ural
State University, 76 Lenin prospekt, Chelyabinsk, Russia 454080. *email: azam.marjani@tdtu.edu.vn
Scientific Reports | (2021) 11:964 | https://doi.org/10.1038/s41598-020-80200-9 1
Vol.:(0123456789)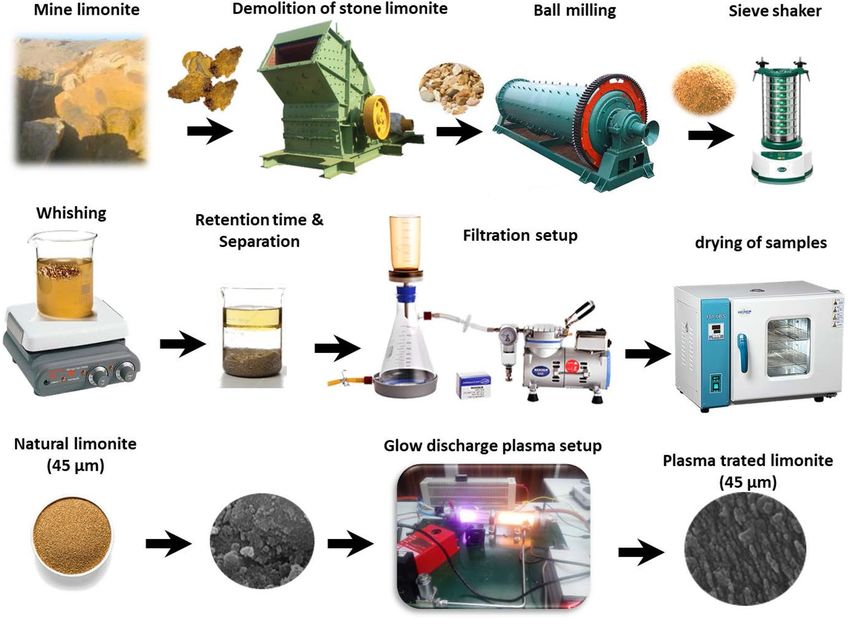
www.nature.com/scientificreports/
Molecular structure C11H11N5·HCl
Molecular weight (g/mol) 249.7
λmax (nm) 430
Melting point (°C) 139
pKa 5.05
Water solubility (g/L) 0.202
Table 1. Characteristics of phenazopyridine hydrochlorid.
species, which is capable to oxidize the most of refractory compounds to more biodegradable and less toxic
intermediates14. Both heterogeneous and homogenous catalytic ozonation processes were applied; however, the
heterogeneous processes is more favorable because of the simplicity of process, ease of catalyst separation and
no secondary pollution15. Nevertheless, mass transfer resistance due to the particle size and few reaction sites
are the main drawbacks of heterogeneous operation which can be solved by using nanostructured materials16.
Numerous catalysts have been used in the literature including metal oxides, activated carbon, natural and syn-
thetic materials17–21. The low-cost and abundant natural iron oxides are available in form of crystalline minerals
such as goethite, ilmenite, limonite, magnetite and h ematite18. Limonite is one of these minerals that is widely
distributed around the globe. Natura limonite (NL) contains fine crystal grains from multiphase mixture with
porous structure and large specific surface area as well as a high surface energy which results in a stronger capa-
bility. The salient property of NL that enhances its catalytic activity is the presence of superficial hydroxyl groups
on its surface which participates in the production of hydroxyl r adicals22. The modification of natural minerals
is an effective way to increase their application, which is done using both physical and/or chemical processes.
Mechanical modification is a simple, inexpensive and efficient method to reduce the size of minerals from
micrometers to nanometers. Furthermore, chemical activation is effective to enhance surface hydroxyl groups
as well as specific surface a rea18,23. From different types of modification methods, non-thermal plasma technique
is one of the newest methods for surface modification. The main feature of plasma technology is environmental-
friendly, cost-effective, quickness, simplicity and ability of various nanostructures p roduction24. Phenazopyridine
hydrochloride (PhP) is a heterocyclic aromatic azo-compound that is used to help with the irritation, pain or
urgency caused by urinary tract i nfections25. Due to the low water solubility (0.202 g/L) and low biodegradabil-
ity, PhP accumulates in the sewages and therefore, treatment of PhP contaminated waters are very i mportant26.
To the best of our knowledge, there is no comprehensive research on non-thermal glow discharge plasma
method for treatment of NL in order to improve the structural properties and catalytic activity of this iron
mineral. Different characterization analysis such as: FESEM, XRD, AAS, TEM, FTIR, BET-BJH, p Hpzc and EDX
confirmed the physical and chemical characteristics of synthesized samples. Moreover, in this research, the
influence of the eco-friendly modified NL was evaluated by degradation of PhP antibiotic through catalytic
ozonation process. For this purpose, the effect of main process parameters such as catalyst dosage, solution pH,
initial contaminant and ozone concentration were investigated on the performance of process. In the follow-
ing sections, the catalyst stability and reusability of as-prepared catalysts, Fe ions release, mineralization and
also assessment of electrical energy consumption were also investigated. By evaluating the effect of organic and
inorganic salts and also, the dissolved ozone concentration the PhP degradation mechanism was proposed. In
addition the LC–( ESI)–MS/MS analysis used to recognize the produced intermediates and by-products during
the PhP degradation by catalytic ozonation using PTL/Ar nanocatalysts. Only few reports have been worked on
PhP oxidation intermediates in ozone based AOPs.
Materials and methods
Materials. NL ore was provided from Tekab iron mine (Est Azerbaijan, Iran). The PhP was used as pharma-
ceutical contaminant which characteristics are given in Table 1. Sodium thiosulfate ( Na2S2O3.5H2O) as ozona-
tion reaction quenching, sodium hydroxide (NaOH) and sulfuric acid ( H2SO4) for pH adjustment, potassium
hydrogen phthalate (C8H5KO4, purity of 99.5%) for TOC calibration and, scavenging agents such as t-butanol
(C4H10O), benzoquinone (BQ), sodium dihydrogen phosphate (NaH2PO4), sodium carbonate (Na2CO3) and
sodium nitrate (NaNO3) were provided from Merck Co. (Germany). Ultrapure water used for all experimental
tests. All reagent used in the AOPs were pure and used as received without any purification.
Preparation of limonite nanostructures. The limonite nanostructures were produced from NL by non-
thermal glow discharge plasma under argon atmosphere. The treatment procedure is schematically presented in
Fig. 1. At first, NL samples were crushed by rod and ball milling to obtain microstructure particles. After sieving,
washing with ultrapure water, filtration and drying at 70 °C, 3 g of the limonite was placed in a Pyrex tube plasma
reactor, which was completely sealed with aluminum bonnets on both s ides12. High-voltage direct current (DC)
supplied by a DC power source was connected by the aluminum bonnets to generate glow discharge plasma.
Argon gas with flowrate of 3 cm3/s was pumped within the reactor to bring the pressure to 50 Pa. The NL plasma-
treated under Ar was denoted as PTL/Ar.
Scientific Reports | (2021) 11:964 | https://doi.org/10.1038/s41598-020-80200-9 2
Vol:.(1234567890)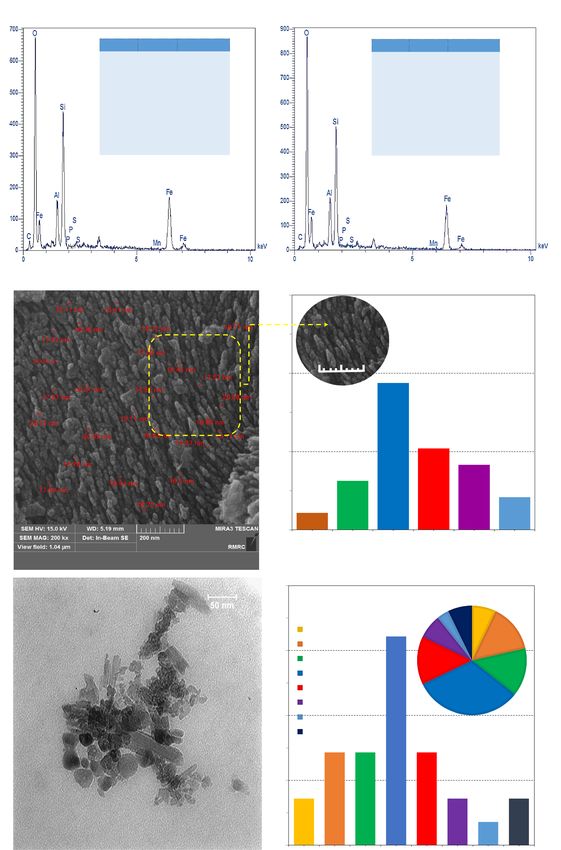
www.nature.com/scientificreports/
Figure 1. Graphic setup of the plasma treatment system for producing PTL/Ar nanostructures.
Characterizations of limonites. The crystalline structure of NL and PTL/Ar samples were evaluated
by X-ray diffraction (XRD) (Siemens D5000 diffractometer, 2θ = 10–80) armed with Cu-Kα (45 kV, 40 mA,
λ = 1.54178 Å). The size and morphology of the NL and PTL/Ar samples were investigated using Field Emission.
Scanning Electron Microscopy equipped with an EDX microanalysis (FESEM; DSM-960A Zeiss, Germany)
and Transmission Electron Microscopy (TEM; LEO 912AB). Fourier Transform Infrared spectra (FTIR) were
conducted in Bruker Tensor 27 (400–4000 1/cm). The specific surface area ( SBET), porosity, pore diameter and
volume of NL and PTL/Ar samples were calculated by physical nitrogen adsorption and desorption experiment
(at 77 K and room temperature, respectively) using Brunauer Emmett Teller (BET) analysis (ChemBET3000,
USA). The Microstructure Distance Measurement software was used to evaluate particle size distribution of the
nanoparticles (Nahamin Pardazan Asia Co., Iran). The atomic absorption spectroscopy (AAS) analyses measured
the concentration of Fe ions released in the aquatic medium (Novaa 400 Analytikjena). The point of zero charge
(pHPZC) was performed by a procedure proposed by Mustafa et al.27. In this method, ten glass bottles containing
40 mL NaNO3 (0.1 M) in ultrapure water with different pH values between 2 and 11 were prepared, each bottles
containing 0.2 g of NL or PTL/Ar. The suspensions stirred for 48 h at 25 ℃. The pHPZC is defined by plotting the
final pH versus initial pH.
Ozone based advanced oxidation processes experiments. Semi-batch experiments of ozonation
based processes were performed in a tubular Pyrex reactor with 4 cm internal diameter and 35 cm in height,
as illustrated in Fig. 2. Ozone was generated using Ozomatic ozone generator (Germany) and through a dif-
fuser entered to the reaction medium. In each experiment, 250 mL solution was prepared containing desirable
concentration of PhP between 30 and 60 mg/L and, catalyst dosage between 0.25 and 1 g/L in deionized water.
Afterward, the solution was treated by chosen different ozone concentration between 7 and 15 mg/L. At different
time of reactions samples were taken from the reactor and quenched immediately with Na2S2O3 (0.01 M). Then,
filtered by a 0.45 µm PTFE filter for further analysis.
Analytical methods. The concentration of PhP at different times of reaction was evaluated at 270 nm
through a UV–Vis spectrophotometer (WPA Lightwave S2000, UK). A VCSH TOC analyzer (Shimadzu, Japan)
was conducted to measure the Total organic carbon (TOC) of samples. The residual ozone concentration in the
solution was evaluated by Indigo colorimetric procedure28.
The degradation percent of PhP and TOC removal were calculated using Eq. (1) where M 0 (mg/L) and M
t
(mg/L) are the concentration/TOC at initial and t (min) time of concentration, respectively.
Scientific Reports | (2021) 11:964 | https://doi.org/10.1038/s41598-020-80200-9 3
Vol.:(0123456789)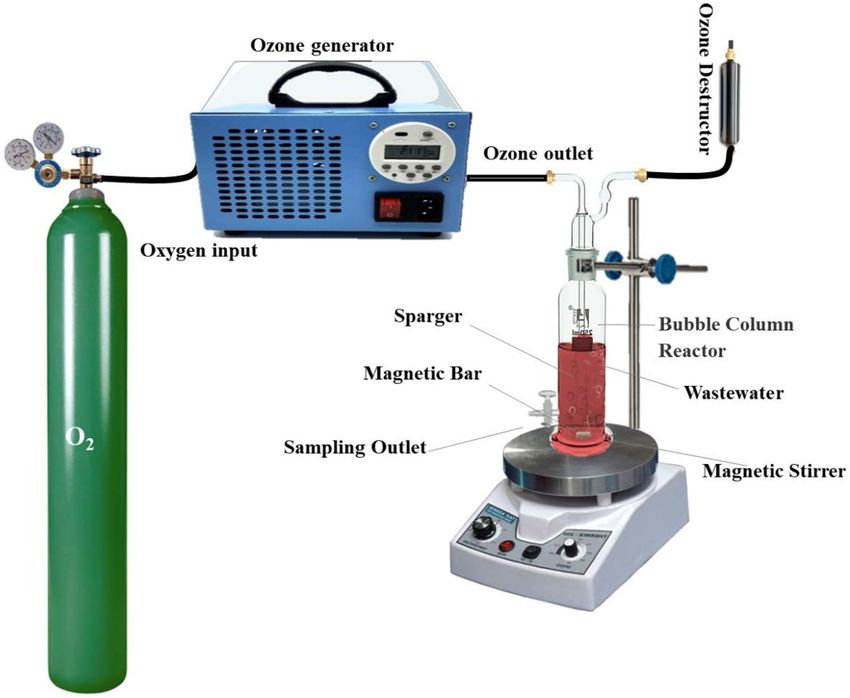
www.nature.com/scientificreports/
Figure 2. Schematic diagram of catalytic ozonation process.
M0 − Mt
(1)
M degradation or removal (% ) = × 100 M represented PhP or TOC
M0
The kinetic rates of reaction were evaluated using pseudo first-order kinetics (Eq. (2)):
C0
ln = kt (2)
C
where C0 and C (mg/L) are the initial and final concentration of PhP, respectively. The time of reaction and the
apparent first-order rate constant are represented by k (1/min) and t (min), respectively.
LC–MS/MS analysis. The liquid chromatography–mass spectrometry (LC-(+ ESI)-MS) technology was
utilized to monitor the produced intermediates and by-products and propose the PhP degradation pathways in
catalytic ozonation by PTL/Ar. The LC–MS/MS analyses were performed using mass spectrum (EMS) scan with
positive mode on a 3200 QTrap mass spectrometer (AB SCIEX, Framingham, USA). The measurements were
carried out at 254 nm in a C18 column (100 Å, 100 mm × 2.1 mm). Pure acetonitrile ( CH3CN, LC–MS grade)
and H2O (30:70) were used as the mobile phase. The LC–MS/MS was scanned in the mass region from 50 to
1000 m/z with sampling period of 0.1 s. The CDL and heating module temperature were both set as 350 °C and
450 °C, respectively.
Results and discussion
Physical and chemical characterizations of limonite. XRD. XRD patterns of the limonite before
and after plasma treatment are presented in Fig. 3. diffraction peaks at 2θ values of 17.79°, 21.24°, 26.34°, 33.24°,
34.68°, 47.25°, 50.63°, 53.24°, and 68.50°, which were associated to the characteristics (020), (011), (021), (031),
(120), (111), (112), (122) and (103) plans. The observations in the XRD patterns of the natural and plasma-
treated samples indicated insignificant changes in the position of the XRD peaks after plasma treatment.
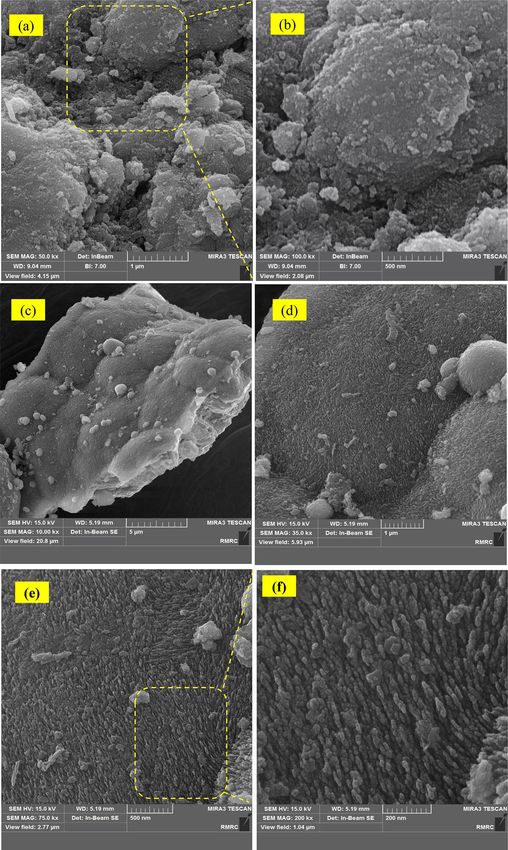
FESEM. FESEM analysis was conducted to investigate the surface morphology of samples. The FESEM images
of NL and PTL/Ar samples with different magnifications are presented in Fig. 4. The bulky structure with various
morphologies was observed in the NL samples (Fig. 4a,b) while smaller size with uniform morphology of PTL/
Ar samples can be clearly seen in Fig. 4c–f. Plasma environment resulted in bombardment of the nanocatalyst
surface, provided more breakups in particles and caused a homogenous distribution. The high-energy of argon
molecules had an important effect in the treatment procedure and provided smoother nanocatalyst particles and
Scientific Reports | (2021) 11:964 | https://doi.org/10.1038/s41598-020-80200-9 4
Vol:.(1234567890)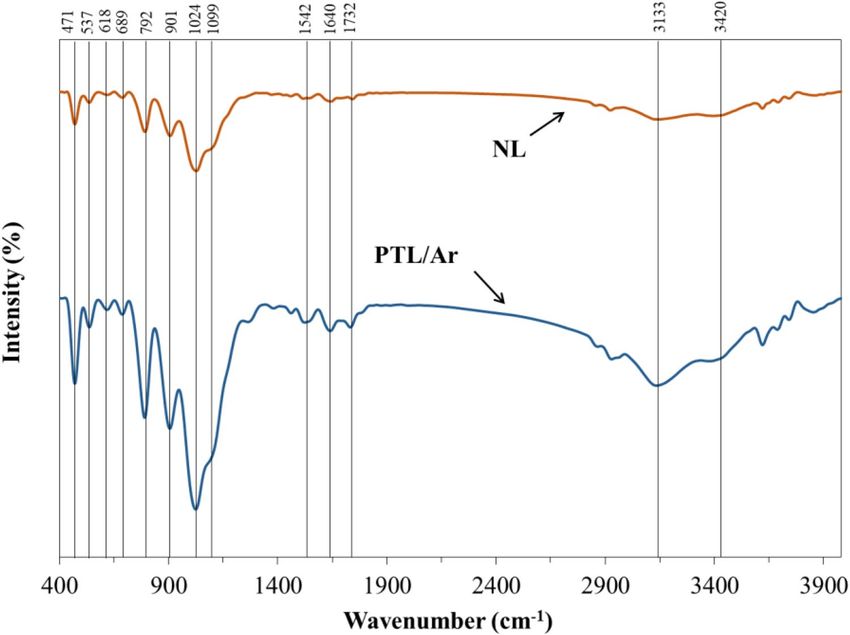
www.nature.com/scientificreports/
Limonite
NL
Intensity (a.u.)
PTL/Ar
Reference Limonite pattern (01-081-0464)
10 20 30 40 50 60 70 80
2ϴ (deg)
Figure 3. The XRD spectra of NL and PTL/Ar.
larger contacting interfaces of α-FeOOH nanocatalysts consequently, the mass transport limitations could be
lower compared to non-treated samples. As the results indicated an improvement in morphological characteris-
tics of limonite samples was observed after plasma-treatment. Moreover, it can be said the smaller particle size,
higher porosity and the rough structure of plasma treated samples will increase the catalytic activity of PTL/Ar.
EDX, TEM and particle size distribution. The results of EDX analysis for the samples before and after plasma
treatment were shown in Fig. 5a,b, respectively. The inset tables of these graphs showed the presence of Fe, O, C
and Si in higher amounts which indicated the purity of the precursors. Moreover, these results proved the pres-
ence of elements were not changed before and after plasma treatment. On the other hand, the plasma treatment
increased the Fe atoms in the surface of nanocatalysts. It can be clearly seen that by increasing the intensity of the
Fe peaks the intensity of C peak in the treated samples were decreased. As a consequence of this reduction the
surface of treated samples made free of carbon impurities. Further studies on PTL/Ar surface morphology were
performed by TEM analysis and the micrograph was shown in Fig. 5e. For detailed analysis, Fig. 5c,d,f illustrated
the diameter size distribution of particles on the surface of PTL/Ar derived from FESEM and TEM micrographs.
The as prepared nanocatalyst has a narrow size distribution. Accordingly, all particles were less than 28 nm in
diameter size. Also, the major portion of the particles is in the range of 15–17 nm (37.5%).
FTIR. The FT-IR spectra of both NL and PTL/Ar samples in the range of 400–4000 cm−1 are shown in Fig. 6.
In both natural and treated samples, adsorption bonds around 1640 and 3420 cm−1 can be related to O–H bond
in water molecules29. Also, the peak around 3650 cm−1 is assigned to OH-groups30. The peaks in the range of
1542 and 1640 cm−1 can be related to vibration mode of the C–H b ond29,31. The peaks in 1732 cm−1 region are
associated with the C=O vibrations. The peaks at about 537 and 471 cm−1 may be related to the tensile vibrations
of the Fe–O bond. Furthermore, the absorption bands at around 792, 901 and 1024 cm−1 are also related to the
stretching mode of the surface Fe-OH groups, which are the most important factor in the formation of surface
hydroxyl groups12. A significant increase in the intensity of Fe-related peaks is observed in the plasma-treated
sample. This phenomenon can be related to the increase in purity as well as the increase in surface iron after
plasma processing. In addition, the vibrations at 792, 901, and 1024 cm−1 also related to Fe-OH surface groups
which significantly increased by plasma treatment. Also, the location of the available peaks is similar for both
samples which confirm that the surface functional groups are the same for NL and PTL/Ar samples.
Textural properties. BET-BJH analysis was performed for determination of the specific surface area, pore
diameter and volume of the raw and treated samples. Figure 7a,b, presented the pore size distribution and N2
adsorption–desorption isotherms for NL and PTL/Ar. As it is obvious both samples showed Type-IV isotherm
behavior (ISO 15,901–2) with a hysteresis cycle, revealing the porous structure with meso–micro cavities. The
obtained results also indicated that the closed pores converted to interconnected open cavities. Also, the H4
type hysteresis can be considered for limonite samples, indicating narrow gap cavities. The textural properties of
NL and PTL/Ar including total pore volume, pore diameter and specific surface area are listed in Table 2. From
Ar adsorption/desorption experiment, limonite has a surface area of 33.37 m2/g which increased to 49.16 m2/g
after plasma treatment. The pore volume of PTL/Ar samples was obtained about 0.039 cm3/g which improved
significantly compared to NL samples (0.023 cm3/g) as a consequence of plasma treatment. This increase in
Scientific Reports | (2021) 11:964 | https://doi.org/10.1038/s41598-020-80200-9 5
Vol.:(0123456789)www.nature.com/scientificreports/
Figure 4. FESEM micrographs of (a, b) NL samples and (c–f) PTL/Ar samples.
Scientific Reports | (2021) 11:964 | https://doi.org/10.1038/s41598-020-80200-9 6
Vol:.(1234567890)www.nature.com/scientificreports/
(a) Line W% (b) Elt Line W%
Ka 8.38 C Ka 4.99
Ka 45.7 O Ka 47.33
Ka 3.32 Al Ka 4.39
Intensity (a.u.)
Intensity (a.u.)
Ka 8.2 Si Ka 10.2
Ka 2.07 P Ka 0.18
Ka 2.73 S Ka 0.25
Ka 0.2 Mn Ka 0.26
Ka 29.4 Fe Ka 32.4
Binding Energy (eV) Binding Energy (eV)
60
(c) (d)
200 nm
40 37.5
Frequency (%)
20.8
20 16.6
12.5
8.3
4.3
0
10-13 13-15 15-17 17-20 20-23 23-25
Surface particle size distribution (nm)
40
(e) (f)
7% 7%
4%
7-10 nm 7% 15%
10-13 nm
30
13-15 nm 14%
15-17 nm 14%
17-20 nm
Frequency (%)
20-23 nm 32%
20 23-25 nm
25-28 nm
10
0
Particle size distribution of PTL/Ar catalyst (nm)
Figure 5. EDX and elemental analysis of (a) NL and (b) PTL/Ar; particle size distribution of PTL/Ar according
FESEM (c, d) and TEM (e, f) analysis.
Scientific Reports | (2021) 11:964 | https://doi.org/10.1038/s41598-020-80200-9 7
Vol.:(0123456789)www.nature.com/scientificreports/
Figure 6. The FT-IR spectra of NL and PTL/Ar.
(a)
(b)
Figure 7. The nitrogen adsorption/desorption isotherms (a) and pore size distribution for NL and PTL/Ar (b).
Scientific Reports | (2021) 11:964 | https://doi.org/10.1038/s41598-020-80200-9 8
Vol:.(1234567890)www.nature.com/scientificreports/
Sample Pore diameter (nm) Pore volume ( cm3/g) SBET (m2/g)
NL 4.83 0.023 33.37
PTL/Ar 3.1 0.039 49.16
Table 2. Structural properties of NL and PTL/Ar.
Figure 8. Determination of point of zero charge for NL and PTL/Ar.
specific surface area results in the generation of more active sites on the surface of the catalyst and consequently,
enhances the performance of catalytic process.
pHPZC determination. The pHPZC was determined by plotting the final pH versus the initial pH. As depicted in
Fig. 8, the p
HPZC of the NL and PTL/Ar were measured 6.4 and 6.7, respectively, indicating successful hydroxyla-
tion of limonite after Ar-plasma treatment. The net surface charge of limonite is zero at p
HPZC. Furthermore, the
surface of limonite positively charged when p Hsolution < pHPZC and negatively charged when pHsolution > pHPZC32.
According to Eq. (3), the protonation of limonite happened when pH of solution was lower than 6.4 and, depro-
tonation was happened when pH of solution was higher than 6.4, according to Eq. (4)12.
FeOH + H+ ↔ FeOH+
2 pHsolution < pHPZC (3)
FeOH + OH− ↔ FeO− + H2 OpHsolution > pHPZC (4)
Oxidation process. Effect of different oxidation processes. The degradation of PhP was evaluated in the
absence and presence of ozonation. Figure 9 shows the comparison of PhP degradation with different processes
including adsorption with NL and PTL/Ar, ozonation, catalytic ozonation using NL and PTL/Ar. As can be seen
from this figure, the adsorption of PhP was 12% on PTL/Ar and 8% on NL after 40 min of treatment. A little
increase in PhP degradation through adsorption on PTL/Ar is attributed to the nanostructured limonite forma-
tion under plasma treatment which increased the specific surface area. In the oxidation processes, O 3/PTL/Ar
showed the most efficient process. The degradation of PhP reached to 58%, 77% and 97% through O3, O3 + NL
and O3 + PTL/Ar, respectively. A sharp increase in PhP degradation in the O3 + PTL/Ar process indicated good
capability of this process toward generation of reactive species. The catalytic performance of limonite is defined
by two mechanisms: 1-presence of hydroxyl groups on the surface and, 2- presence of iron ions in the limonite
structure33. The interaction of ozone and surface hydroxyl groups make a series of chain reactions which causes
to formation of reactive species specially hydroxyl radicals. The proposed mechanism for ozone decomposition
on PTL/Ar surface can be described as Eqs. (5)–(10)34.
PTL − OH + O3 ↔ PTL − OH(O3 )s ↔ PTL − O· + HO3 · (5)
PTL − O· + H2 O → PTL − OH + · OH (6)
HO·3 ↔ H+ + · O−
3 (7)
Scientific Reports | (2021) 11:964 | https://doi.org/10.1038/s41598-020-80200-9 9
Vol.:(0123456789)www.nature.com/scientificreports/
Figure 9. Comparison of PhP degradation efficiency with different oxidation processes ( [PhP]0 = 30 mg/L,
[O3]0 = 11 mg/L, catalyst dosage = 0.75 g/L, pH0 = 6.7).
No Process kapp,PhP (min−1) Correlation coefficient (R2) Synergy factor Reference
1 NL 0.0026 0.952 – This study
2 PTL/Ar 0.0040 0.938 – This study
3 O3 0.0219 0.998 – This study
4 O3 + NL 0.0378 0.995 1.54 This study
5 O3 + H2O2 0.0488 0.988 – This study
6 O3 + PTL/Ar 0.0936 0.959 3.71 This study
35
7 O3 0.072 0.980 –
35
8 TiO2/UV 0.026 0.990 –
35
9 O3 + TiO2/UV 0.084 0.970 2.11
Table 3. The apparent pseudo-first-order rate constants, corresponding linear regression coefficients and
synergy factor of decay PhP by various processes on.
HO·3 → · OH + O2 (8)
Furthermore, plasma removes some impurities and more iron is available on the surface of limonite after
plasma treatment33.
Fe2+ + O3 → FeO2+ + O2 (9)
FeO2+ + H2 O → Fe3+ + · OH + OH− (10)
Moreover, the kinetic study of PhP degradation was studied. From Table 3 pseudo first order kinetics behavior
of PhP degradation can be indicated for different processes. Adsorption on NL and PTL/Ar processes had the
lowest apparent PhP degradation rate constants of 0.0026 and 0.0040, respectively. In contrast, the O 3 + PTL/
Ar process had the highest reaction rate constant due to synergistic effect between ozonation and adsorption
processes. The synergic factor can be calculated from Eq. (11):
k′ catalytic ozonation
synergy factor = (11)
k′ adsorption + k′ ozonation
The rate constants of adsorption by PTL/Ar and sole ozonation processes were 0.004 min−1 and 0.0219 min-1,
3 + PTL/Ar process was 0.0936 min−1. Consequently, the synergy factor value was
respectively, while for O
Scientific Reports | (2021) 11:964 | https://doi.org/10.1038/s41598-020-80200-9 10
Vol:.(1234567890)www.nature.com/scientificreports/
(a) (b)
(c) (d)
Figure 10. The influence of different parameters on the PhP degradation in the O3 + PTL/Ar system (a) ozone
concentration ([PhP]0 = 30 mg/L, catalyst dosage = 0.75 g/L, pH0 = 6.7), (b) initial solution pH ([PhP]0 = 30 mg/L,
[O3]0 = 11 mg/L, catalyst dosage = 0.75 g/L), (c) catalyst dosage ( [PhP]0 = 30 mg/L, [O3]0 = 11 mg/L, pH0 = 6.7),
(d) initial PhP concentration ([O3]0 = 11 mg/L, catalyst dosage = 0.75 g/L, pH0 = 6.7).
calculated at 3.71 which mean significant enhancement was occurred through combination of processes. Fathinia
et al.35 also reported synergy factor for photocatalytic ozonation of PhP by T
iO2 coated on ceramic plates. As
can be seen in Table 3 the highest synergy factor was reported about 2.11 for PhP degradation at the optimized
operating condition which is lower than synergy factor of O3 + PTL/Ar process. This can be explained by higher
ROSs generation in presence of PTL/Ar in ozonation process. As a result, O3 + PTL/Ar process was selected as
the desired catalyst for further catalytic ozonation experiments.
Effect of initial PhP concentration. Figure 10a displayed the effect of initial contaminant concentration on
the degradation of PhP in the O 3 + PTL/Ar process. Experiments were performed at constant PTL/Ar dosage
(0.75 g/L), ozone concentration (11 g/L), pH value (6.7) but at different initial PhP concentrations of 30, 40,
50 and 60 mg/L. The degradation of PhP was decreased from 98 to 71% by increasing its initial concentration
from 30 to 60 mg/L, respectively. The degradation efficiency of PhP depends on the rate of radical generation.
Whiles the oxidant concentration is constant, a competition occurred between the generated intermediates and
byproducts with parent pollutant in reacting with radicals at high initial pollutant c oncentration36. Therefore, the
possibility of ROSs reaction with PhP molecules decreases, which leads to reduction in degradation efficiency of
oxidation process. A similar phenomena was observed by Khataee et al.37 that the degradation of textile dye in
the sono-Fenton/pyrite process was decreased as initial dye concentration increased.
Effect of initial pH. The initial pH of solution is one of the significant parameters in the heterogeneous pro-
cesses. It was stated in the literature that the oxidation process conducted mainly near or on the surface of
catalyst due to the short life-time of free radicals. Therefore, it is desirable that the contaminant not repelled
but attracted to the surface. Considering the pKa of PhP (5.05) and pHPZC of nanocatalysts (6.7), so in the acidic
condition both PhP repelled from the surface. In such condition the surface charge density of the nanocatalyst
become positive while the PhP molecules are in cationic form thus an electrostatic repulsion forces occurred.
On the other hand, in the alkaline condition the negative charge density of surface and anionic form of PhP
molecules hinder the contaminant adsorption and consequent reactions. In the moderate pH as Fig. 10b shows
in the moderate pH value (6.7) the most effective PhP degradation was observed. In this pH value the surface
Scientific Reports | (2021) 11:964 | https://doi.org/10.1038/s41598-020-80200-9 11
Vol.:(0123456789)www.nature.com/scientificreports/
(a)
(b)
Figure 11. (a) Fe release in the O3 + NL and O3 + PTL/Ar processes (b) PhP degradation over 6 cycles in the
O3 + PTL/Ar process ([PhP]0 = 30 mg/L, [O3]0 = 11 mg/L, catalyst dosage = 0.75 g/L, pH0 = 6.7).
of fabricated samples are negative and contrary the PhP molecules are in cationic form. Therefore, there is an
attraction between contaminant molecules and nanocatalyst surface.
Effect of catalyst dosage. The influence of catalyst loading on the performance of oxidation process is demon-
strated in Fig. 10c. As depicted, the degradation efficiency of PhP increased as the initial catalyst dosage ranged
from 0.25 to 1 g/L due to the enhancement in active sites and accordingly, more radical were generated on the
surface of n anocatalyst9. However, no significant difference was observed in the degradation efficiency of PhP
between catalyst dosages of 0.75 and 1 g/L. Therefore, 0.75 g/L was selected as the optimum dosage of PTL/Ar
nanocatalysts for further experiments. In the similar study conducted by Liu et al.38, no noticeable difference was
observed for degradation of p-nitrophenol when limonite dosage changed from 2 to 4 g/L.
Effect of initial ozone concentration. The effect of initial ozone concentration was evaluated over the range of
7–13 mgO3/L at constant pH, PhP concentration and catalyst dosage of 6.7, 30 mg/L and 0.75 g/L, respectively
and the results are presented in Fig. 10d. The results showed that the degradation efficiency raised from 77 to
99% as ozone concentration increased from 7 mg/L to 13 mg/L. A direct relation between pollutant degrada-
tion efficiency and initial ozone concentration is attributed to the production of more reactive species specially
hydroxyl radicals33. It should be noted that the final PhP degradation was the same in the experiments contain-
ing 11, 13 and 15 mgO3/L. Therefore, 11 mg/L ozone concentration was selected as optimum value for further
experiments.
Stability and reusability. The stability of catalyst plays an important role in the long-term operation. For
this purpose, the Fe content released in the solution was analyzed before and after oxidation process by AAS
analysis. The results of Fig. 11a showed that 0.170 mg/L and 0.048 mg/L Fe ions were detected in the O 3 + NL and
O3 + PTL/Ar processes, respectively. Therefore, the plasma treatment significantly decreased the amount of Fe
release to the reaction medium. The improvement in catalyst stability after plasma treatment also was reported
by researchers24,37. In order to investigate the reusability of the catalyst, the performance of PTL/Ar after 6 runs
was evaluated. The results of reusability study were illustrated in Fig. 11b. The efficiency of PhP degradation
decreased from 98% in the first run to 89% in 6th run, indicating no noticeable loss was observed in the PTL/Ar
Scientific Reports | (2021) 11:964 | https://doi.org/10.1038/s41598-020-80200-9 12
Vol:.(1234567890)www.nature.com/scientificreports/
(a)
(b)
Figure 12. Comparison of TOC removal (a) and electrical energy consumption (b) in different oxidation
processes, ([PhP]0 = 30 mg/L, [O3]0 = 11 mg/L, catalyst dosage = 0.75 g/L, [H2O2]0 = mg/L, pH0 = 6.7, P = 69 W for
production of 4 g/h O 3).
activity after 6 runs. The stability of catalyst might be because of the in-situ catalyst regeneration or repulsion of
the detected by-products/reactant into the bulk39.
TOC removal and electrical energy efficiency. The mineralization of PhP oxidation process was evalu-
ated by measuring total organic carbon (TOC). As illustrated in Fig. 12, different ozonation processes were
applied including O 3, O3 + NL, O3 + H2O2 and O
3 + PTL/Ar. The results showed that 37, 50, 60 and 71% of the
TOC was removed in the O3, O3 + NL, O3 + H2O2 and O3 + PTL/Ar processes, respectively. As can be seen the
highest mineralization of PhP was observed in O3 + PTL/Ar process. Comparing the ozonation process in the
presence of NL and PTL/Ar revealed that the plasma treatment of NL highly affect the mineralization of PhP.
In this research, the electrical energy per order (EEO) of the above processes was calculated using Eq. (12)
as follows40:
P × t × 1000
EEO =
(12)
V × log TOC 0
TOCf
where P is the input power (kW) of the system, t is the process time (h), V is the volume of aquatic solution (L),
TOC0 (mg/L) and TOCf (mg/L) are the initial and final total organic carbons, respectively. The EEO values for
degradation of PhP according to optimum condition were calculated and the results are shown in Fig. 12. How-
ever, it seems that the combined processes are not cost-effectiveness but according to Fig. 12a,b the O 3 + PTL/
Ar process had the lowest energy consumption as well as highest TOC removal compared to O3, O3 + NL and
O3 + H2O2 processes. Mehrjouei and co-workers11,41 compared the economic aspects of photocatalytic oxidation,
photo and catalytic ozonation processes for degradation of dichloroacetic acid and oxalic acid and reported that
photocatalytic ozonation represented the highest cost-effectiveness between the investigated processes.
Elucidating the possible reaction mechanism of PhP degradation in catalytic ozonation. Scav-
enging study. Figure 13a,b show the effect of radical scavengers (TBA and BQ) and anionic ions (CO32−, NO3−
and H2PO4−) on the performance of O3 + PTL/Ar process. TBA as free radical scavenger reacts with hydroxyl
radical at a second-order-rate constant (kOH • /TBA = (3.8–7.6) × 108 1/M.s). Also, BQ was used as superoxide
radical scavenger. The concentrations of scavengers were too high in order to sufficiently quench the gener-
Scientific Reports | (2021) 11:964 | https://doi.org/10.1038/s41598-020-80200-9 13
Vol.:(0123456789)www.nature.com/scientificreports/
(a) (c)
(c) (d)
Figure 13. PhP degradation in the O
3 + PTL/Ar system in the presence of different radical scavengers (a)
and CO32− (b), H2PO (c) and NaNO3 (d) ([PhP]0 = 30 mg/L, [scavengers]0 = 10 mM, [O3]0 = 11 mg/L, catalyst
dosage = 0.75 g/L, pH0 = 6.7).
ated radicals instead of reacting with PhP. From Fig. 13a, almost complete PhP degradation was happen in the
blank condition. In the experiment containing BQ, a decline in PhP degradation to 60% is noticed due to the
high reactivity of TBA with hydroxyl radical. In the presence of TBA, strict scavenging was happened and, the
degradation efficiency of PhP was reduced to 38%. The inhibitory effect of scavengers revealed that there are a
few superoxide radicals in the system and, it was concluded that the hydroxyl radical was the main responsible
for PhP degradation. The PhP degradation efficiency was decreased by addition of anionic salts to the solution
medium (Fig. 13b,d). These anionic ions adsorbed on the PTL/Ar surface and occupied the surface active sites.
Furthermore, the produced radicals can be consumed by the mentioned anions according to Eqs. (13)–(15)9:
CO32− + · OH → CO3·− + OH − (13)
NO− · ·
3 + OH → NO3 + OH
−
(14)
H2 PO− · ·
4 + OH → H2 PO4 + OH
−
(15)
Therefore, the rate of radical production was decreased due to the presence of the salts and, carbonate had
the greatest effect.
Dissolved ozone concentration and inorganic nitrogen evaluation. The concentration of dissolved ozone was
evaluated during ozonation and catalytic ozonation (with PTL/Ar) processes and shown in Fig. 14a. As can be
seen in sole ozonation process the concentration of dissolved ozone was improved significantly and then reached
to about 2 mg/L in 40 min. On the contrary in the catalytic ozonation with PTL/Ar lower dissolved ozone
concentration was observed and after 30 min of process the changes were very negligible. The lower dissolved
ozone concentration means higher portion of ozone molecules was decomposed. As a consequence of ozone
decomposition the reactive oxidative species will be generated in the medium and hence the PhP degradation
will be increased. The higher dissolved ozone concentration in the presence of Fe-based natural catalysts was
also reported in previous works12,42. The release of inorganic ions (NO3− and NO2−) from N heteroatoms as a
consequence of PhP bond cleavage in sole and catalytic ozonation is presented in Fig. 14b. As it can be seen
Scientific Reports | (2021) 11:964 | https://doi.org/10.1038/s41598-020-80200-9 14
Vol:.(1234567890)www.nature.com/scientificreports/
(a)
(b)
Figure 14. Dissolved ozone (a) and nitrogen evaluation (b) during ozonation and catalytic ozonation (PTL/Ar)
processes.
O3− and NO2− ions were accumulated in the medium gradually from the beginning of processes. More nitrate
N
ions were created in both processes compared to nitrite ions. Nitrite ion concentration increased at beginning
of processes and followed by a gradual decrease which can be due to conversion to nitrate. Nitrate ions were
formed in a more extent in comparison with nitrite and the concentration was increased over time of reaction.
Furthermore, the amount of NO3− and NO2− ions release was higher in O3 + PTL/Ar process than sole O3. This
means ozonation process in the presence of PTL/Ar nanocatalysts had more degradation efficiency compared to
ozonation process alone. These findings are in consistence with the other researcher c outcomes43.
Analysis of PhP degradation intermediates and products. The produced intermediates and by-products PhP
degradation during catalytic ozonation by PTL/Ar was evaluated by LC–MS analysis. The detected oxidation
intermediates are summarized in Fig. 15. According to the obtained results, the attack of hydroxyl radicals to
the PhP molecule (m/z = 214) can produce intermediate with m/z = 125 (2,3,6-Triaminopyridine) as the result of
N = N band cleavage. In addition the “A intermediate (m/z = 215) can be produced as a result of ·OH attack to N
atom of amine group of PhP. 2,3,6-Triaminopyridine (A) degraded to 3-hydroxy-2,6-diaminopyridine with m/z
of 126 which can furthered degraded to 2,6-diaminopyridine (m/z = 110). The intermediate with m/z of 124 (“B)
was identified as a result of N=N bond cleavage of “A structure. Phenol compound (m/z = 95) was generated due
to hydroxylation of “B bonds. Finally, multiple hydroxylation reactions and bond cleavage occurred and further
reaction of ·OH and other ROSs with different structures led to production of end-products such as H2O, CO2,
and N ions.
Conclusions
In the present research, the beneficial limonite nanocatalysts were prepared by non-thermal glow discharge
plasma under Ar atmosphere. Based on the characterization analyses, the small particle size, highly porous
and rough nanostructure of plasma treated samples will improve the PhP degradation. A comparison between
different degradation processes demonstrated that catalytic ozonation with PTL/Ar due to the higher specific
surface area and total pore volume led to 96.4% degradation and 74% mineralization during 40 and 120 min
of process, respectively. The excellent properties of nanostructures which were achieved by plasma treatment
enhanced the penetration of pollutant molecules and thus improved the catalytic activity of PTL/Ar. The opti-
mum amount of pH value, catalyst loading, initial ozone and contaminant concentration were observed to be
Scientific Reports | (2021) 11:964 | https://doi.org/10.1038/s41598-020-80200-9 15
Vol.:(0123456789)www.nature.com/scientificreports/
Figure 15. Proposed possible degradation pathways of PhP in catalytic ozonation processes using PTL/Ar.
6.7, 0.75 m/L, 11 mg/L and 30 mg/L, respectively. Lower Fe ion release in addition to high reusability and stabil-
ity during the catalytic ozonation process with PTL/Ar can be due to strengthening of the crystalline structure
after plasma treatment in comparison with raw samples. The mineralization and electrical energy consumption
results revealed that, in contrast to the O
3, peroxone and O
3 + NL processes, the O
3 + PTL/Ar process expressed
the highest mineralization and lowest electrical energy consumption under the optimized conditions. The PhP
degradation mechanism was explored by different inorganic and organic scavengers as well as O3 concentra-
tion evaluation which proved that the indirect ozone attack was the dominant degradation pathway. The main
intermediates during PhP oxidation by catalytic ozonation processes using PTL/Ar were identified using LC–MS
technique. Considering the supreme activity and stability of the plasma treated nanocatalyst, it can be concluded
that PTL/Ar has potential for further practical applications.
Received: 9 September 2020; Accepted: 17 December 2020
References
1. Gimeno, O., García-Araya, J. F., Beltrán, F. J., Rivas, F. J. & Espejo, A. Removal of emerging contaminants from a primary effluent
of municipal wastewater by means of sequential biological degradation-solar photocatalytic oxidation processes. Chem. Eng. J.
290, 12–20. https://doi.org/10.1016/j.cej.2016.01.022 (2016).
2. Silva, B. F. et al. Occurrence and distribution of pharmaceuticals in surface water, suspended solids and sediments of the Ebro
river basin, Spain. Chemosphere 85, 1331–1339. https://doi.org/10.1016/j.chemosphere.2011.07.051 (2011).
3. Forouzesh, M., Ebadi, A. & Aghaeinejad-Meybodi, A. Continuous fixed-bed oxidation of metronidazole by the sulfate radi-
cal based process over nitric acid treated granular activated carbon. J. Water Process Eng. 36, 101280. https://doi.org/10.1016/j.
jwpe.2020.101280 (2020).
4. Pelalak, R., Heidari, Z., Soltani, H. & Shirazian, S. Mathematical model for numerical simulation of organic compound recovery
using membrane separation. Chem. Eng. Technol. 41, 345–352 (2018).
5. Soltani, H., Pelalak, R., Heidari, Z., Ghadiri, M. & Shirazian, S. CFD simulation of transport phenomena in wastewater treatment
via vacuum membrane distillation. J. Porous Media 19, 515–526. https://doi.org/10.1615/JPorMedia.v19.i6.30 (2016).
6. Soltani, R. et al. Preparation of COOH-KCC-1/polyamide 6 composite by in situ ring-opening polymerization: synthesis, charac-
terization, and Cd(II) adsorption study. J. Environ. Chem. Eng. 104683 (2020).
7. Zhang, Y. et al. Heterogeneous degradation of organic contaminants in the photo-Fenton reaction employing pure cubic β-Fe2O3.
Appl. Catal. B 245, 410–419 (2019).
8. Klavarioti, M., Mantzavinos, D. & Kassinos, D. Removal of residual pharmaceuticals from aqueous systems by advanced oxidation
processes. Environ. Int. 35, 402–417. https://doi.org/10.1016/j.envint.2008.07.009 (2009).
9. Pelalak, R., Alizadeh, R., Ghareshabani, E. & Heidari, Z. Degradation of sulfonamide antibiotics using ozone-based advanced
oxidation process: Experimental, modeling, transformation mechanism and DFT study. Sci. Total Environ. (2020).
10. Heidari, Z. et al. Degradation of furosemide using photocatalytic ozonation in the presence of ZnO/ICLT nanocomposite particles:
Experimental, modeling, optimization and mechanism evaluation. J. Mol. Liq. https: //doi.org/10.1016/j.molliq .2020.114193 ,11419
3 (2020).
11. Mehrjouei, M., Müller, S. & Möller, D. A review on photocatalytic ozonation used for the treatment of water and wastewater. Chem.
Eng. J. 263, 209–219. https://doi.org/10.1016/j.cej.2014.10.112 (2015).
12. Pelalak, R., Alizadeh, R. & Ghareshabani, E. Enhanced heterogeneous catalytic ozonation of pharmaceutical pollutants using a
novel nanostructure of iron-based mineral prepared via plasma technology: A comparative study. J. Hazard. Mater. 392, 122269
(2020).
Scientific Reports | (2021) 11:964 | https://doi.org/10.1038/s41598-020-80200-9 16
Vol:.(1234567890)www.nature.com/scientificreports/
13. Beltran, F. J., Aguinaco, A., García-Araya, J. F. & Oropesa, A. Ozone and photocatalytic processes to remove the antibiotic sul-
famethoxazole from water. Water Res. 42, 3799–3808 (2008).
14. Sui, M., Sheng, L., Lu, K. & Tian, F. FeOOH catalytic ozonation of oxalic acid and the effect of phosphate binding on its catalytic
activity. Appl. Catal. B 96, 94–100 (2010).
15. Ikehata, K., Jodeiri Naghashkar, N. & Gamal El-Din, M. Degradation of aqueous pharmaceuticals by ozonation and advanced
oxidation processes: a review. Ozone Sci. Eng. 28, 353–414 (2006).
16. Nawrocki, J. & Kasprzyk-Hordern, B. The efficiency and mechanisms of catalytic ozonation. Appl. Catal. B 99, 27–42. https://doi.
org/10.1016/j.apcatb.2010.06.033 (2010).
17. Rajah, Z., Guiza, M., Solís, R. R., Rivas, F. J. & Ouederni, A. Catalytic and photocatalytic ozonation with activated carbon as
technologies in the removal of aqueous micropollutants. J. Photochem. Photobiol., A 382, 111961 (2019).
18. Souza, W. F. et al. Natural and H2-reduced limonite for organic oxidation by a Fenton-lik system: Mechanism study via ESI-MS
and theoretical calculations. J. Mol. Catal. A: Chem. 278, 145–151 (2007).
19. Zhang, T., Li, C., Ma, J., Tian, H. & Qiang, Z. Surface hydroxyl groups of synthetic α-FeOOH in promoting OH generation from
aqueous ozone: property and activity relationship. Appl. Catal. B 82, 131–137 (2008).
20. Heidari, Z., Alizadeh, R., Ebadi, A., Oturan, N. & Oturan, M. A. Efficient photocatalytic degradation of furosemide by a novel
sonoprecipited ZnO over ion exchanged clinoptilolite nanorods. Sep. Purif. Technol. 242, 116800. https://doi.org/10.1016/j.seppu
r.2020.116800 (2020).
21. Pelalak, R., Baniadam, M. & Maghrebi, M. Controllable purification, cutting and unzipping of multi-walled carbon nanotubes
with a microwave method. Appl. Phys. A 111, 951–957. https://doi.org/10.1007/s00339-012-7320-9 (2013).
22. Abe, K., Kurniawan, A., Nomura, T. & Akiyama, T. Effects of reduction on the catalytic performance of limonite ore. J. Energy
Chem. 27, 1489–1495. https://doi.org/10.1016/j.jechem.2017.09.032 (2018).
23. Yan, X., Shao, J., Wen, Q. & Shen, J. Stabilization of soil arsenic by natural limonite after mechanical activation and the associated
mechanisms. Sci. Total Environ. 708, 135118 (2020).
24. Rahemi, N., Haghighi, M., Babaluo, A. A., Jafari, M. F. & Khorram, S. Non-thermal plasma assisted synthesis and physicochemi-
cal characterizations of Co and Cu doped Ni/Al2O3 nanocatalysts used for dry reforming of methane. Int. J. Hydrogen Energy 38,
16048–16061 (2013).
25. C.P. Holstege, I. P. W. E., Encyclopedia of Toxicology, Second Edition, 394–395 (Elsevier, Amsterdam, 2005).
26. Eskandarloo, H., Badiei, A., Behnajady, M. A. & Ziarani, G. M. Ultrasonic-assisted degradation of phenazopyridine with a combi-
nation of Sm-doped ZnO nanoparticles and inorganic oxidants. Ultrason. Sonochem. 28, 169–177. https://doi.org/10.1016/j.ultso
nch.2015.07.012 (2016).
27. Mustafa, S., Dilara, B., Nargis, K., Naeem, A. & Shahida, P. Surface properties of the mixed oxides of iron and silica. Colloids Surf.
A 205, 273–282. https://doi.org/10.1016/S0927-7757(02)00025-0 (2002).
28. Bader, H. & Hoigné, J. Determination of ozone in water by the indigo method. Water Res. 15, 449–456 (1981).
29. Pelalak, R. & Heidari, Z. Lithographically cut multiwalled carbon nanotubes: opening caps, controlling length distribution, and
functionalization. J. Dispersion Sci. Technol. 35, 808–814 (2014).
30. Acisli, O., Khataee, A., Karaca, S., Karimi, A. & Dogan, E. Combination of ultrasonic and Fenton processes in the presence of
magnetite nanostructures prepared by high energy planetary ball mill. Ultrason. Sonochem. 34, 754–762 (2017).
31. Bikiaris, D. et al. Ochre-differentiation through micro-Raman and micro-FTIR spectroscopies: application on wall paintings at
Meteora and Mount Athos, Greece. Spectrochim. Acta Part A Mol. Biomol. Spectrosc. 54, 3–18 (2000).
32. Reymond, J. P. & Kolenda, F. Estimation of the point of zero charge of simple and mixed oxides by mass titration. Powder Technol.
103, 30–36. https://doi.org/10.1016/S0032-5910(99)00011-X (1999).
33. Taseidifar, M., Khataee, A., Vahid, B., Khorram, S. & Joo, S. W. Production of nanocatalyst from natural magnetite by glow discharge
plasma for enhanced catalytic ozonation of an oxazine dye in aqueous solution. J. Mol. Catal. A: Chem. 404, 218–226 (2015).
34. Park, J.-S., Choi, H. & Cho, J. Kinetic decomposition of ozone and para-chlorobenzoic acid (pCBA) during catalytic ozonation.
Water Res. 38, 2285–2292 (2004).
35. Fathinia, M. & Khataee, A. Photocatalytic ozonation of phenazopyridine using T iO2 nanoparticles coated on ceramic plates: mecha-
nistic studies, degradation intermediates and ecotoxicological assessments. Appl. Catal. A 491, 136–154. https://doi.org/10.1016/j.
apcata.2014.10.049 (2015).
36. Forouzesh, M., Ebadi, A. & Aghaeinejad-Meybodi, A. Degradation of metronidazole antibiotic in aqueous medium using activated
carbon as a persulfate activator. Sep. Purif. Technol. 210, 145–151. https://doi.org/10.1016/j.seppur.2018.07.066 (2019).
37. Khataee, A., Gholami, P. & Vahid, B. Heterogeneous sono-Fenton-like process using nanostructured pyrite prepared by Ar glow
discharge plasma for treatment of a textile dye. Ultrason. Sonochem. 29, 213–225. https://doi.org/10.1016/j.ultsonch.2015.09.012
(2016).
38. Liu, H. et al. The functionalization of limonite to prepare NZVI and its application in decomposition of p-nitrophenol. J. Nanopart.
Res. 17, 374. https://doi.org/10.1007/s11051-015-3171-6 (2015).
39. Gholizadeh, A. M., Zarei, M., Ebratkhahan, M., Hasanzadeh, A. & Vafaei, F. Removal of Phenazopyridine from wastewater by
merging biological and electrochemical methods via Azolla filiculoides and electro-Fenton process. J. Environ. Manage. 254,
109802. https://doi.org/10.1016/j.jenvman.2019.109802 (2020).
40. Bolton, J. R., Bircher, K. G., Tumas, W. & Tolman, C. A. Figures-of-merit for the technical development and application of advanced
oxidation technologies for both electric- and solar-driven systems. Pure Appl. Chem. 73, 627–637. https://doi.org/10.1351/pac20
0173040627 (2001).
41. Mehrjouei, M., Müller, S. & Möller, D. Energy consumption of three different advanced oxidation methods for water treatment: a
cost-effectiveness study. J. Clean. Prod. 65, 178–183. https://doi.org/10.1016/j.jclepro.2013.07.036 (2014).
42. Yuan, L., Shen, J., Chen, Z. & Guan, X. Role of Fe/pumice composition and structure in promoting ozonation reactions. Appl.
Catal. B 180, 707–714 (2016).
43. Shahmahdi, N., Dehghanzadeh, R., Aslani, H. & Shokouhi, S. B. Performance evaluation of waste iron shavings (Fe0) for catalytic
ozonation in removal of sulfamethoxazole from municipal wastewater treatment plant effluent in a batch mode pilot plant. Chem.
Eng. J. 383, 383123093 (2020).
Acknowledgements
S. Shirazian gratefully acknowledges the supports by the Government of the Russian Federation (Act 211, con-
tract 02.A03.21.0011) and the Ministry of Science and Higher Education of the Russian Federation (Grant
FENU-2020-0019). Z. Heidari appreciatively acknowledges the Iran Nanotechnology Initiative Council for their
financial supports of this research.
Author contributions
R.P.: Project administration, Data curation, Formal analysis, Conceptualization.Z.H.: Investigation, Writing,
Original Draft preparation, Formal analysis.M.F.: Formal analysis, Validation, Writing-Review.E.G.: Data
Scientific Reports | (2021) 11:964 | https://doi.org/10.1038/s41598-020-80200-9 17
Vol.:(0123456789)www.nature.com/scientificreports/
curation, Validation, Methodology.R.A.: Supervision, Validation, Reviewing.A.M.: Supervision, Validation,
Editing.S.S.: Funding acquisition, Writing-review, Revision.
Competing interests
The authors declare no competing interests.
Additional information
Correspondence and requests for materials should be addressed to A.M.
Reprints and permissions information is available at www.nature.com/reprints.
Publisher’s note Springer Nature remains neutral with regard to jurisdictional claims in published maps and
institutional affiliations.
Open Access This article is licensed under a Creative Commons Attribution 4.0 International
License, which permits use, sharing, adaptation, distribution and reproduction in any medium or
format, as long as you give appropriate credit to the original author(s) and the source, provide a link to the
Creative Commons licence, and indicate if changes were made. The images or other third party material in this
article are included in the article’s Creative Commons licence, unless indicated otherwise in a credit line to the
material. If material is not included in the article’s Creative Commons licence and your intended use is not
permitted by statutory regulation or exceeds the permitted use, you will need to obtain permission directly from
the copyright holder. To view a copy of this licence, visit http://creativecommons.org/licenses/by/4.0/.
© The Author(s) 2021
Scientific Reports | (2021) 11:964 | https://doi.org/10.1038/s41598-020-80200-9 18
Vol:.(1234567890)You can also read