Pleistocene isolation caused by sea-level fluctuations shaped genetic characterization of Pampus minor over a large-scale geographical ...
←
→
Page content transcription
If your browser does not render page correctly, please read the page content below
A peer-reviewed open-access journal
ZooKeys 969: 137–154 (2020)
doi: 10.3897/zookeys.969.52069                           RESEARCH ARTICLE
https://zookeys.pensoft.net                                                                                 Launched to accelerate biodiversity research

   Pleistocene isolation caused by sea-level fluctuations
  shaped genetic characterization of Pampus minor over
          a large-scale geographical distribution

                       Yuan Li1, Cheng Liu1,2, Longshan Lin1,2, Yuanyuan Li1,
                                  Jiaguang Xiao1, Kar-Hoe Loh3

1 Third Institute of Oceanography, Ministry of Natural Resources, Xiamen 361005, China 2 College of Ma-
rine Sciences, Shanghai Ocean University, Shanghai 201306, China 3 Institute of Ocean and Earth Sciences,
University of Malaya, Kuala Lumpur 50603, Malaysia

Corresponding author: Longshan Lin (lshlin@tio.org.cn)

Academic editor: Maria Elina Bichuette | Received 14 March 2020 | Accepted 28 July 2020 | Published 17 September 2020

                               http://zoobank.org/8C8AFE36-BD6F-431D-B4E9-7D80E410D7B7

Citation: Li Y, Liu C, Lin L, Li Y, Xiao J, Loh K-H (2020) Pleistocene isolation caused by sea-level fluctuations shaped
genetic characterization of Pampus minor over a large-scale geographical distribution. ZooKeys 969: 137–154. https://
doi.org/10.3897/zookeys.969.52069

Abstract
The southern lesser pomfret (Pampus minor) is an economically important fish, and its numbers are de-
clining because of overfishing and environmental pollution. In addition, owing to the similarities of its
external morphological characteristics to other species in the genus Pampus, it is often mistaken for grey
pomfret (P. cinereus) or silver pomfret (P. argenteus) juveniles. In this study, the genetic diversity and struc-
ture of 264 P. minor individuals from 11 populations in China and Malaysia coastal waters were evaluated
for the first time, to the best of our knowledge, using mitochondrial cytochrome b fragments. The results
showed that P. minor had moderate haplotype diversity and low nucleotide diversity. Furthermore, two
divergent lineages were detected within the populations, but the phylogenetic structure corresponded
imperfectly with geographical location; thus, the populations may have diverged in different glacial refu-
gia during the Pleistocene low sea levels. Analysis of molecular variation (AMOVA) showed that genetic
variation originated primarily from individuals within the population. Pairwise FST results showed sig-
nificant differentiation between the Chinese and Malaysian populations. Except for the Xiamen popula-
tion, which was classified as a marginal population, the genetic differentiation among the other Chinese
populations was not significant. During the Late Pleistocene, P. minor experienced a population expansion
event starting from the South China Sea refugium that expanded outward, and derivative populations
quickly occupied and adapted to the new habitat. The results of this study will provide genetic informa-
tion for the scientific conservation and management of P. minor resources.

Copyright Yuan Li et al. This is an open access article distributed under the terms of the Creative Commons Attribution License (CC BY 4.0),
which permits unrestricted use, distribution, and reproduction in any medium, provided the original author and source are credited.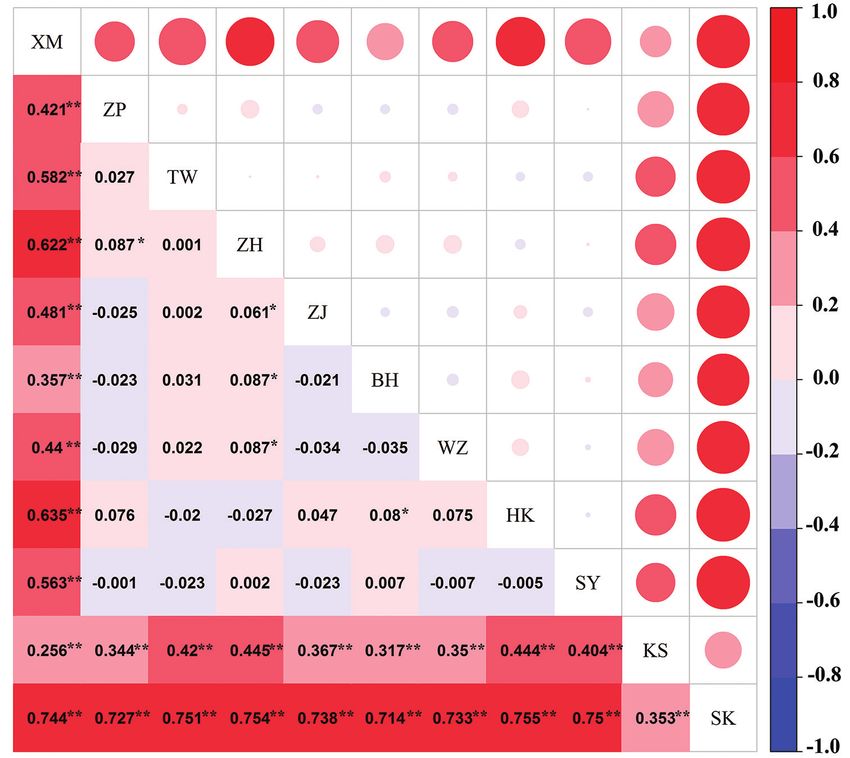
138                         Yuan Li et al. / ZooKeys 969: 137–154 (2020)

Keywords
Cytochrome b, genetic diversity, genetic structure, South China Sea, southern lesser pomfret

Introduction

Because of the rise in fishing pressure, habitat destruction, and global climate change,
understanding the level of marine biological variation and its genetic structure is of
crucial significance to the protection of marine biological resources and genetic diver-
sity (Butchart et al. 2010). Current research on population genetics mainly includes
detecting the level of genetic diversity and population genetic structure within differ-
ent species, estimating the effective population size, and investigating the mechanisms
underlying various evolutionary factors (Ellegren 2014).
     Pampus minor Liu & Li, 1998 is an offshore warm-water pelagic fish classified un-
der the class Actinopterygii, order Perciformes and family Stromateidae. It is a newly
discovered species, distributed primarily south of the mid-southern East China Sea
and along the coast of Southeast Asian countries (Li et al. 2019a). Owing to the simi-
larities in the external characteristics of Pampus species and the small size of P. minor
(adults generally do not exceed 150 mm), this species was consistently mistaken for
grey pomfret (P. cinereus) or silver pomfret (P. argenteus) juveniles in early studies (Liu
and Li 1998).
     The region in which P. minor is distributed experienced a series of glacial-inter-
glacial cycles in the Late Quaternary. During glacial periods, fluctuations in sea levels
led to massive changes in the area and structure of marginal seas (Wang 1999), which
transformed the Western Pacific Ocean into an ideal marine region for studying how
glacial periods affected marine life. We postulate that during the Last Glacial Maxi-
mum (LGM), P. minor was also strongly affected by the Pleistocene glacial period.
Thus, under the harsh environmental conditions of the glacial period, most of the
individuals within its distribution range went extinct, and only a handful of isolated
populations in glacial refugia (such as the South China Sea) survived. As the climate
warmed during interglacial periods, sea levels rose, which led to population expansion;
hence, the corresponding phylogeographic patterns and population genetic structure
may be detected.
     There have been few studies on P. minor thus far, which have only focused on
morphology (Liu and Li 1998; Li et al. 2019a), population genetics (Li et al. 2019b),
and phylogenetics (Cui et al. 2010; Guo et al. 2010; Li et al. 2019a). To the best of
our knowledge, no basic research has been conducted on the status and distribution
of P. minor fishery resources, and there have been no reports analyzing the large-scale
genetic structure of its distribution range. Given the general decline in fishery resourc-
es, P. minor resources have also been shrinking, and there is a need to understand
its genetic diversity, genetic structure, effective population size, and other population
genetic characteristics. These parameters form the basis for formulating strategies for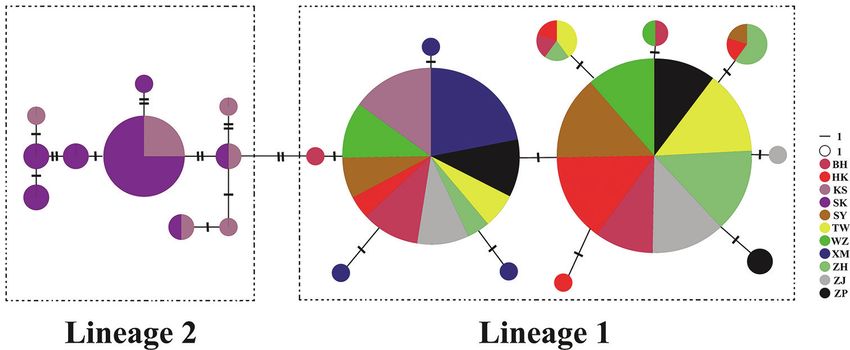
Population genetics and phylogeography of Pampus minor 139
the effective protection and rational exploitation and utilization of marine fishery re-
sources (Funk et al. 2012).
In this study, mitochondrial DNA sequences (cytochrome b, Cytb) were used to
study the genetic diversity, genetic structure, and historical demography of 11 P. minor
populations in China and Malaysia coastal waters. In addition, the effects of pale-
oclimatic, paleo-geological, marine geological, environmental and other factors on
population formation, distribution and expansion routes, as well as genetic exchange,
were revealed. This enabled us to investigate the mechanisms underlying the current
phylogeographic patterns of this species, which can serve as a scientific reference for
fishery management.
Materials and methods
Sample collection
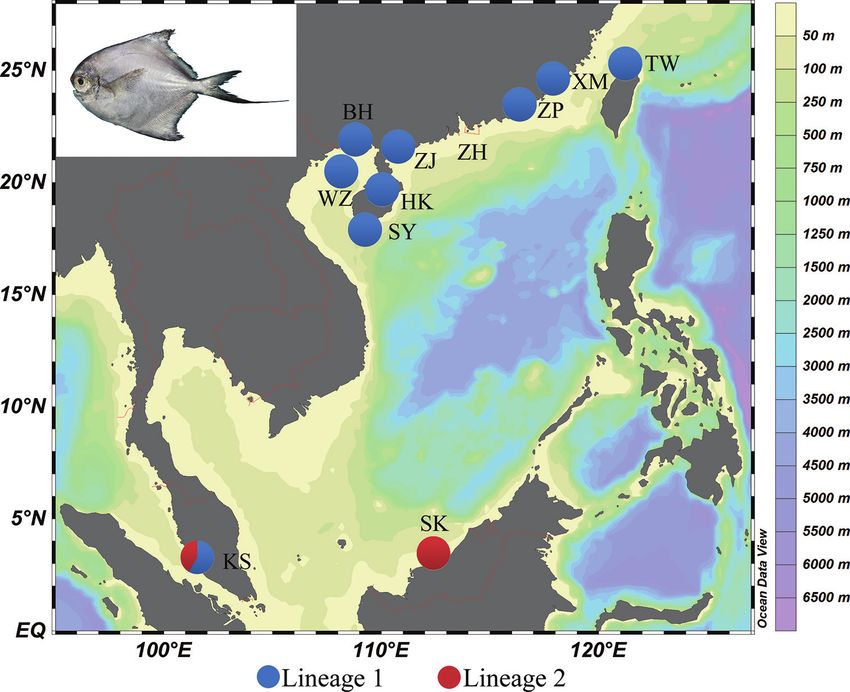
Between May 2016 and December 2017, a total of 264 P. minor individuals from 11
geographical populations along the coasts of China (Xiamen, Zhangpu, Taiwan, Zhu-
hai, Zhanjiang, Beihai, Weizhou Island, Haikou, Sanya) and Malaysia (Kuala Selangor,
Mukah) were collected (Fig. 1, Table 1). To ensure the accuracy of the taxonomy, the
morphological identification of all specimens was based on Liu and Li (1998). A piece
of back muscle tissue was frozen or preserved in 95% alcohol for molecular study.
DNA extraction, amplification, and sequencing
Genomic DNA of P. minor was extracted from muscle tissue using a Qiagen DNeasy
kit. The genomic DNA was assessed by electrophoresis with a 1.5% agarose gel
and qualified samples were stored at 4 °C for PCR amplification. The mtDNA cy-
tochrome b (Cytb) was amplified with the primers L14734: 5’-AACCACCGTTGT-
TATTCAACT-3’ (Inoue et al. 2001) and H15149: 5’-CTCAGAATGATATTTGTC-
Table 1. Information and molecular indices for P. minor based on mitochondrial DNA Cytb sequences.
Country ID Population Number of individuals Date NH NUH h π k
China XM Xiamen Island 24 Apr. 2017 4 3 0.5391±0.1129 0.0007±0.0006 0.2917±0.2500
ZP Zhangpu 24 Apr. 2017 3 1 0.5942±0.0537 0.0016±0.0014 0.6667±0.5303
TW Taiwan 24 Oct. 2017 3 0 0.5072±0.0929 0.0013±0.0012 0.5507±0.4688
ZH Zhuhai 24 Dec. 2016 4 0 0.5326±0.1048 0.0015±0.0013 0.6015±0.4960
ZJ Zhanjiang 24 Dec. 2017 3 1 0.5399±0.0619 0.0014±0.0013 0.5725±0.4805
BH Beihai 24 Nov. 2016 5 1 0.6377±0.0606 0.0019±0.0016 0.7681±0.5824
WZ Weizhou Island 24 Nov. 2016 3 0 0.5543±0.0525 0.0014±0.0013 0.5906±0.4903
HK Haikou 24 Dec. 2016 5 1 0.4855±0.1129 0.0013±0.0012 0.5399±0.4629
SY Sanya 24 Dec. 2016 3 0 0.4891±0.0843 0.0012±0.0011 0.5145±0.4491
Malaysia KS Kuala Selangor 24 May 2016 7 3 0.6341±0.0973 0..49±0.0031 2.0109±1.1731
SK Mukah 24 May 2016 7 4 0.6087±0.1115 0.0038±0.0026 1.5652±0.9669
Total 264 – 22 14 0.6763±0.0189 0.0035±0.0023 1.4385±0.8794
Note: NH, number of haplotypes; NUH, number of unique haplotypes; h, haplotype diversity; π, nucleotide diversity; k, mean number of
pairwise differences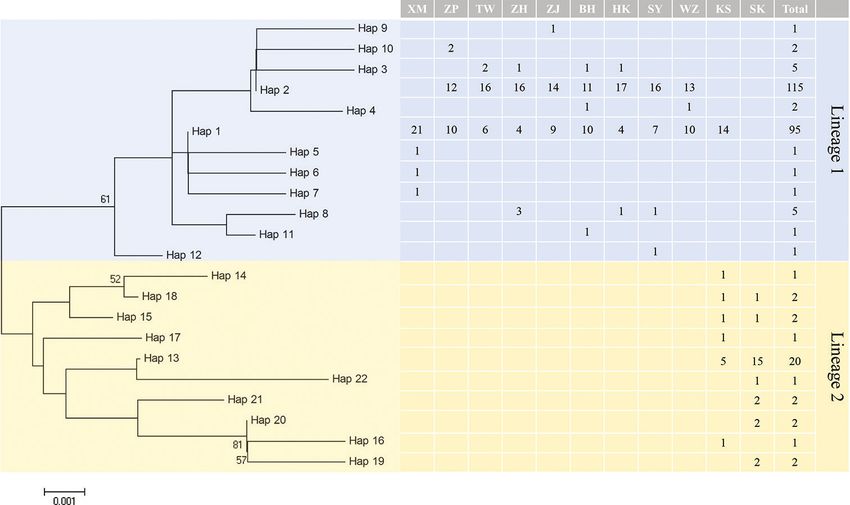
140                          Yuan Li et al. / ZooKeys 969: 137–154 (2020)

Figure 1. Sampling locations of P. minor. Populations are marked by abbreviations that correspond to Table 1.

CTCA-3’ (Ohdachi et al. 1997). All PCR reactions were carried out in a final mixture
of 25 μL: 0.15 μL Taq polymerase, 2.5 μL 10× PCR buffer, 17.5 μL ultrapure water,
2 μL dNTPs, 1 μL of forward primer (5 μM), 1 μL of reverse primer (5 μM), and 1 μL
of template DNA. PCR was carried out by initial denaturation step at 94 °C for 4 min,
then followed by 32 cycles of denaturation at 94 °C for 30 sec, annealing at 50 °C
for 30 sec, and extension at 72 °C for 30 sec, and plus a final extension at 72 °C for
10 min. After purification of the PCR products, both DNA strands were sequenced.
The newly determined Cytb sequences were deposited in GenBank under the accession
numbers (MT303974–MT303978, MF616364–MF616380).

Data analysis
The Cytb sequences were aligned using the DNASTAR (Madison, WI, USA) soft-
ware and manually edited. Haplotypes were defined based on sequence data without
considering sites with gaps using DnaSP ver. 5.00 (Librado and Rozas 2009). Genetic
diversity in each population was accessed as polymorphic sites, haplotype number,
mean number of pairwise differences, haplotype diversity, and nucleotide diversity us-
Population genetics and phylogeography of Pampus minor                  141

ing ARLEQUIN version 3.5 (Excoffier et al. 2005). Analysis of molecular variation
(AMOVA) in ARLEQUIN software was employed to investigate the genetic variation
and test population structure. The MEGA 5.0 (Tamura et al. 2011) was applied to
reconstructed the neighbor-joining (NJ) tree based on the genetic distance among hap-
lotypes, and implemented with 1000 replicates. The relationships of haplotypes by un-
rooted minimum spanning tree (MST) was evaluated via the MINSPNET algorithm
in ARLEQUIN software (Excoffier et al. 2005), and the MST topological structure
was subsequently drawn by hand.
     Both neutrality testing and mismatch distribution analysis were used to infer the his-
torical demography expansions, as implemented in ARLEQUIN. Deviations from neu-
trality, significant negative values of Fu’s Fs and Tajima’s D statistic, were evaluated to ex-
perience population growth and spatial range expansion. A molecular clock-based time
estimate provided an approximate timeframe for evaluating phylogeographical hypoth-
eses. Historical demographic expansions were further tested by nucleotide mismatch dis-
tribution, based on three parameters: θ0, θ1 (θ before and after population growth), and
τ (time since expansion, expressed in units of mutational time) (Rogers and Harpending
1992). The real-time since expansion was computed by the equation τ=2×μ×t, where μ is
the mutation rate for the whole sequence and t is the time since expansion.
     In the present study, a sequence divergence rate of 0.2×10⁻⁷/site/year (Avise 1998;
Sun and Tang 2018) was applied to the Cytb sequences of P. minor. Bayesian skyline
plots were created using BEAST v.8 (Drummond et al. 2012). However, a molecular
clock-based time estimate provided an approximate time frame for evaluating phylo-
geographic hypotheses.

Results
Genetic diversity

A total of 264 sequences were obtained from the 11 P. minor populations. After
manual alignment, a target fragment of 415 bp was obtained, of which there were 19
polymorphic sites, 12 singleton sites, seven parsimony informative sites, and no in-
dels. A+T content (62.32%) was significantly higher than G+C content, thus show-
ing an AT bias.
    A total of 22 Cytb haplotypes were defined in the 264 individuals. The number of
haplotypes in each population ranged from three to seven. The number of haplotypes
shared by two or more populations was eight (36.4%). There were 14 unique haplo-
types (63.6%), and seven populations had unique haplotypes, with the number rang-
ing from one (ZP, ZJ, BH, HK) to four (SK) (Table 1). There were large differences
in the composition and distribution of haplotypes between the Chinese and Malay-
sian populations, with only one haplotype shared between the two. Both the Chinese
(7/12=58.3%) and Malaysian (7/11=63.6%) populations were dominated by unique
haplotypes (Fig. 2). The haplotype with the highest frequency was Hap_2, consisting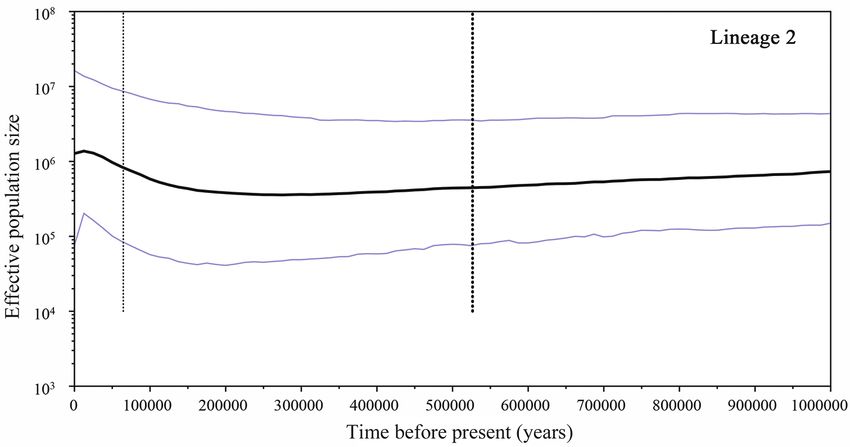
142                        Yuan Li et al. / ZooKeys 969: 137–154 (2020)

Figure 2. Composition and distribution of 22 Cytb haplotypes in the Chinese and Malaysian populations.

of 115 sequences. Hap_1, consisting of 95 sequences, was the only haplotype shared
by the Chinese and Malaysian populations and may be an ancestral haplotype.
     In general, the P. minor populations exhibited moderate haplotype diversity
(0.6763 ± 0.0189) and low nucleotide diversity (0.0035 ± 0.0023). This phenomenon
is usually due to bottleneck effects, resulting in population expansion or rapid popula-
tion growth in small populations, accompanied by the generation of a large number of
new mutations (Avise et al. 1984; Grant and Bowen 1998).

Genetic structure
An NJ tree was constructed based on the 22 P. minor Cytb haplotypes. The results
showed two divergent lineages detected within the populations but with low bootstrap
values. The phylogenetic structure detected corresponded imperfectly to the geograph-
ical locations (Fig. 3). Lineage 1 was composed of 12 haplotypes (230 individuals),
and lineage 2 was composed of ten haplotypes (34 individuals) (Fig. 3). Lineage 1 was
composed of all the Chinese populations and some individuals from Malaysia KS,
whereas lineage 2 was composed entirely of Malaysian populations.
     An unrooted MST was constructed based on the 22 Cytb haplotypes of the Chi-
nese and Malaysian populations (Fig. 4). All sequences exhibited multiple primary
haplotypes, and the other haplotypes were radially distributed around the primary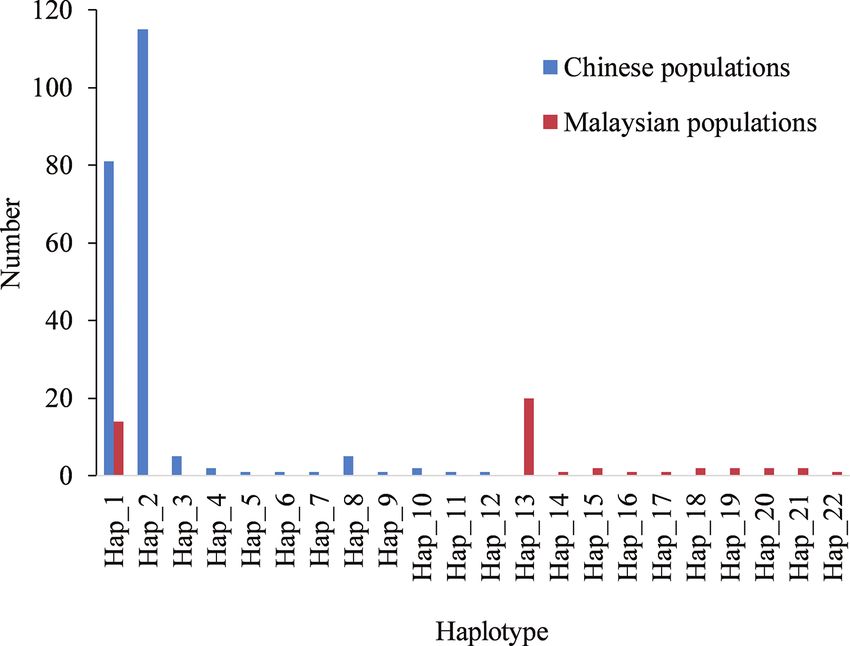
Population genetics and phylogeography of Pampus minor                        143

Figure 3. NJ tree and distribution of Cytb haplotypes among populations for P. minor. Bootstrap sup-
ports of > 50 in 1000 replicates are shown.

Figure 4. Unrooted minimum spanning tree showing the genetic relationships among the Cytb haplo-
types of P. minor. Circle sizes are proportional to haplotype frequency. Perpendicular tick marks on the
lines joining the haplotypes represent the number of nucleotide substitutions.

haplotypes with obvious phylogenetic structures that corresponded to the Chinese and
Malaysian populations.
    Based on the TrN+G model, the net genetic distance between the two haplotype
lineages was 0.006. Based on a mitochondrial Cytb sequence divergence rate of 2% per
million years, the time of divergence between lineages 1 and 2 was approximately 300
thousand years ago (Kya).
144 Yuan Li et al. / ZooKeys 969: 137–154 (2020)
Figure 5. Matrix of pairwise FST values between 11 P. minor populations based on Cytb sequences. * sig-
nificant at p < 0.05 by the permutation test, ** extremely significant at p < 0.01 by the permutation test.
The fluctuation ranges of pairwise FST between populations were relatively large.
The FST values between the Chinese and Malaysian populations were all above 0.25,
and statistical tests indicated significance, thus showing very great differentiation
(Wright 1965) (Fig. 5). The FST values between the Xiamen and other populations were
relatively large, and differentiation was statistically significant. Except for the Xiamen
population, the FST values between the Chinese populations were below 0.15, thus
showing limited differentiation, and most of the statistical tests were not significant.
Some FST values among the P. minor populations were still negative, suggesting that
the level of differentiation within P. minor populations was greater than that among
populations (Aris-Brosou and Excoffier 1996).
AMOVA was used to detect the genetic structure of the populations (Table 2).
First, all P. minor populations were analyzed as one gene pool. The results showed
significant genetic differentiation within each population (ΦST = 0.477, p < 0.01), ac-Population genetics and phylogeography of Pampus minor 145
Table 2. AMOVA analysis of P. minor populations based on mitochondrial Cytb sequences.
Source of variation Sum of squares Percentage Φ statistic p
One gene pool (XM, ZP, TW, ZH, ZJ, BH, WZ, HK, SY, KS and SK)
Among populations 89.92 47.74 ΦST=0.477 0.00
Within populations 99.25 52.26
Two gene pools (XM, ZP, TW, ZH, ZJ, BH, WZ, HK and SY) (KS and SK)
Among groups 64.23 30.74 ΦCT=0.612 0.01
Among populations within groups 25.69 8.04 ΦSC=0.207 0.00
Within populations 99.25 61.23 ΦST=0.693 0.00
Four gene pools (TW) (XM, ZP, ZH, ZJ, BH and WZ) (HK and SY) (KS and SK)
Among groups 67.08 40.30 ΦCT=0.403 0.03
Among populations within groups 22.83 13.95 ΦSC=0.234 0.00
Within populations 99.25 45.75 ΦST=0.542 0.00
Six gene pools (TW) (XM, ZP, ZH and ZJ) (BH and WZ) (HK and SY) (KS) (SK)
Among groups 79.87 42.54 ΦCT=0.425 0.04
Among populations within groups 10.05 8.43 ΦSC=0.147 0.00
Within populations 99.25 49.03 ΦST=0.510 0.00
counting for 52.26% of the variation, whereas genetic differentiation among popula-
tions accounted for only 47.74% of the variation.
To further confirm the genetic structure of the P. minor populations, the 11 popu-
lations were grouped into two, four, and six gene pools based on their geographic dis-
tribution. The results of all groupings showed that the genetic differentiation among
groups was relatively large with statistical significance (p < 0.05), whereas genetic differ-
entiation originating primarily within populations was highly significant (p < 0.01), and
genetic differentiation among populations within groups was also significant (p < 0.01).
Historical demography
Two haplotype lineages were detected in all Chinese and Malaysian populations with
imperfect geographic lineage structures. Due to the significant differentiation among
all populations, the historical demography of the two haplotype lineages was analyzed.
The nucleotide mismatch distribution in all P. minor sequences was unimodal, and
similar results were found in both lineages (Fig. 6). Neutrality test results showed that
the Fu’s FS tests for each lineage and the overall population yielded negative values,
and were statistically significant (p < 0.05). Tajima’s D test for each lineage and the
Table 3. Summary of molecular diversity, neutral test and goodness-of-fit test for P. minor.
Number NH h ± SD л ± SD k ± SD Tajima’s D Fu’s Fs Goodness-of-fit test
D p Fs p τ θ0 θ1 SSD HRI
Lineage 1 230 7 0.5807 ± 0.0016 ± 0.6643 ± -1.378 0.044 -7.647 0.003 0.836 0.011 83022 0.0258ns 0.1889ns
0.0177 0.0013 0.5131
Lineage 2 34 7 0.6524 ± 0.0042 ± 1.7273 ± -0.905 0.189 -3.499 0.030 1.813 0.000 2.601 0.0321ns 0.1151ns
0.0917 0.0028 1.0316
All 264 22 0.6763 ± 0.0035 ± 1.4385 ± -1.379 0.045 -12.923 0.001 1.000 0.000 99999 0.026ns 0.109ns
0.0189 0.0023 0.8794
Note: NH, numbers of haplotypes; h, haplotype diversity; л, nucleotide diversity; k, average number of pairwise differences; ns, p > 0.05146 Yuan Li et al. / ZooKeys 969: 137–154 (2020)
50 60
ALL Lineage 1
40 Observed values 50 Observed values
Frequency
Frequency
Model values 40 Model values
30
30
20
20
10
10
0 0
1 2 3 4 5 6 7 8 9 1 2 3 4 5
Pairwise difference Pairwise difference
40 Lineage 2
Observed values
30
Frequency
Model values
20
10
0
1 2 3 4 5 6 7 8
Pairwise difference
Figure 6. The expected mismatch distributions under a sudden expansion model (solid gray line) and the
observed pairwise difference (black bars) of Cytb haplotypes of P. minor.
overall population yielded negative values, and were all statistically significant, except
for lineage 2. In addition, the SSD and HRI test indices were not significant (p > 0.05)
(Table 3), indicating that there was no significant deviation from the expected distri-
bution under the population expansion model. Therefore, this can be used to analyze
the historical demography of the P. minor populations, implying that this species has
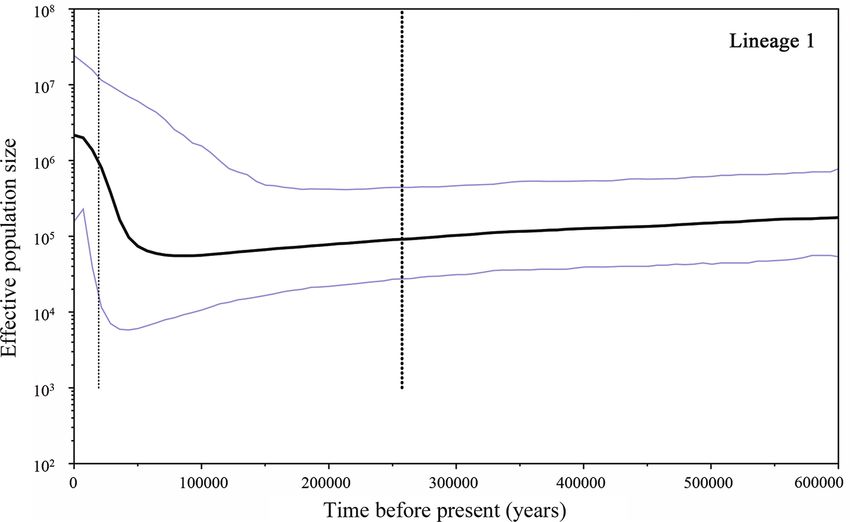
experienced population expansion events. Simultaneously, the Bayesian skyline plot
(BSP) also indicated the same result (Fig. 7).
The τ value of the nucleotide mismatch distribution provides a time point for es-
timating population expansion. The τ value of lineage 2 was 1.813 (95% CI: 0.059–
5.600), which was larger than that of lineage 1 (0.836, 95% CI: 0.572–1.357) (Table 3).
Based on a divergence rate of 0.2×10⁻⁷/site/year and τ, the population expansion time
points of lineages 1 and 2 were estimated to be 101 and 218 Kya, respectively, which
was during the Late Pleistocene. The ratio of θ1 after expansion to θ0 before expansion
is infinite, indicating a sharp increase in the size of the effective maternal population of
P. minor after population expansion. BSPs for lineage 1 and lineage 2 showed that both
lineages have undergone the Late Pleistocene demographic expansion (Fig. 7), which
started at different times. The effective population size of lineage 2 increased slowly,
while the effective population size of lineage 1 increased sharply after the LGM.Population genetics and phylogeography of Pampus minor 147 Figure 7. BSPs showing NefT (Nef = effective population size; T = generation time) changes over time for P. minor based on Cytb sequences. The upper and lower limits of the blue line represent the 95% confidence intervals of highest posterior densities (HPD) analysis. The solid black line represents median estimates of NefT. Discussion Genetic diversity is the basis of both species and ecological diversity, while species and genetic diversity are both the basis of ecosystem diversity. Studies on the genetic diversity of species have attracted increasing attention from domestic and international researchers. The genetic diversity of a species directly affects its adaptation to the en- vironment: the higher its level of diversity, the greater its potential for evolution and
148                     Yuan Li et al. / ZooKeys 969: 137–154 (2020)

the stronger its adaptation to environmental changes, whereas the opposite implies the
possibility of its deterioration or extinction (Rosel et al. 1995).
     Compared to the levels of intraspecific genetic diversity of Cytb gene sequences
in Trachidermus fasciatus (h = 0.97 ± 0.011) (Gao et al. 2013), P. argenteus
(h = 0.775 ± 0.041) (Zhao et al. 2011a), Anguilla mossambica (0.691 ± 0.043)
(Frankowski et al. 2020) and other fishes, the genetic diversity of Chinese and Malaysian
P. minor was at a moderate level. From a historical evolutionary perspective, large
population sizes, environmental heterogeneity and life-history traits that favor rapid
population increases are the main reasons for maintaining high haplotype diversity
in natural populations of marine fishes. Pampus minor is widely distributed in the
mid-southern East China Sea, South China Sea, and the coastal regions of Southeast
Asian countries, indicating that large population sizes may account for the relatively
high levels of haplotype diversity observed in this study. However, little is known
about these life-history traits for P. minor, and further study is needed to examine this
correlation. In any case, the P. minor populations had moderate haplotype diversity
and low nucleotide diversity. Fish populations with this type of diversity pattern may
have experienced historical expansion events, and a population bottleneck followed by
rapid population growth and accumulation of mutations (Grant and Bowen 1998).
     Stepien (1999) suggests that the stable number of shelf fish over the long term
and a large effective population are the causes of its high haplotype diversity. Although
pomfret fishery resources have declined due to overfishing (Jin et al. 2005), the larger
amount of fishery resources and the number of effective populations of P. minor com-
pared to other economic fishes have helped maintain its moderate level of genetic
diversity. In addition, P. minor is a widely distributed species and has a wide dietary
preference. Its spawning grounds exhibit different characteristics according to the dif-
ferent marine regions in which it is distributed, and its habitat conditions are heteroge-
neous (Wu et al. 2012). These life-history traits and the environmental heterogeneity
of P. minor can promote rapid population growth, implying that the natural selection
pressure faced by the population is relatively small, which may have led to the increased
accumulation of genetic mutations and a rich genetic diversity.
     The genetic diversity distribution of a species is not only affected by past historical
events, but also by current evolutionary forces (e.g., migration). The discontinuity of
habitats and the instability of population changes can result in differentiation between
species populations (Stepien 1999). Both the NJ tree and unrooted MST showed two
divergent lineages of P. minor. AMOVA also showed that the genetic differentiation
primarily originated within populations. The time of divergence of the two lineages
was approximately 300 Kya, and the different glacial refugia during Pleistocene low sea
levels may have caused the divergence of the two lineages. Many previous studies have
shown that Pleistocene glaciations are important factors in the genetic differentiation
of many marine organisms (Liu et al. 2007; Shen et al. 2011; Zhao et al. 2011a, b; Wu
et al. 2012; Gao et al. 2013).
     In the Late Quaternary, the global climate experienced a series of glacial-intergla-
cial cycles. In the last 800 Kya, climate fluctuations mainly occurred at intervals of
Population genetics and phylogeography of Pampus minor 149
~100 Kya (Lambeck et al. 2002). The fourth glacial period ended at about 420 Kya
(Petit et al. 1999), which coincided with the time of divergence for the two lineages
of P. minor. With the arrival of the fourth glacial period, the sea level fell by about
120~140 m, and P. minor populations may have become isolated in the South China
Sea refugium. After the glacial period, as sea levels rose, P. minor populations in the ref-
ugium expanded toward the coasts of China and Malaysia. The NJ tree and haplotype
network tree show that Hap_1 was the only shared haplotype between the Chinese
and Malaysian populations, and accounted for a relatively large number of individuals.
This indicated that it was the ancestral haplotype, thus further demonstrating that the
P. minor populations originated from the same refugium.
The protein encoded by the mitochondrial Cytb gene acts as a subunit in com-
plex V of the oxidative phosphorylation pathway (Saraste 1999). Studies have shown
that non-synonymous mutations in the mitochondrial Cytb gene can affect the me-
tabolism- and energy-related selective evolution of animals (Mishmar et al. 2003; da
Fonseca et al. 2008; Xu et al. 2017). In marine fishes, different dimensions of natural
selection between populations may be related to temperature adaptation and aerobic
exercise associated with individual size (Bélanger-Deschênes et al. 2013; Jacobsen
et al. 2016; Zhang et al. 2016). These results have also been validated in studies
of Sebastiscus marmoratus (Xu et al. 2017). Currently, P. minor has a wide thermal
amplitude. After undergoing population expansion, Chinese and Malaysian P. minor
populations were able to adapt to the habitats of different marine regions and with-
stand different natural selection pressures. With the passing of time, many new mu-
tations appeared, and abundant haplotype diversity accumulated to form a unique
haplotype. Lineage 2 was composed entirely of the haplotype of the Malaysian popu-
lation, and in lineage 1, only KS appeared in the ancestral haplotype Hap_1, while
all other haplotypes were from the Chinese populations. In other words, except for
the ancestral haplotype, the remaining haplotypes of the Chinese and Malaysian P.
minor populations have produced substantial differentiation, each accounting for
their unique haplotypes. However, from the current perspective, there was still insuf-
ficient time for ample nucleotide variation to be produced. FST results also showed
that significant genetic differentiation had occurred between the Chinese and Malay-
sian P. minor populations, further validating their respective accumulation of genetic
variation to adapt to their living environments. Due to Malaysia’s low latitude, high
water temperature and greater number of habitats, as well as the effect of the mon-
soon systems, which cause the ocean currents to bring an abundance of plankton as
a richer source of food, there is reduced pressure on the Malaysian P. minor popula-
tion, allowing for the accumulation of more genetic variation, which in turn results
in higher genetic diversity.
An interesting result was found in the Xiamen population, which showed signifi-
cant differentiation from other populations, indicating that the breeding patterns of
P. minor are complex. A second confirmation was performed on the sample sources and
the results of the data analysis to eliminate the possible effects of these factors. Studies
have reported that when P. minor was first discovered, the northern boundary of its150 Yuan Li et al. / ZooKeys 969: 137–154 (2020)
distribution range was in the Xiamen marine region, and its geographical distribution
range was in the waters south of the Taiwan Strait (Liu and Li 1998). Xiamen is in the
northern boundary of the P. minor population distribution range; that is, it is a mar-
ginal population. In studies of adaptive evolution, the marginal populations of species
are more sensitive to environmental changes, exhibit more pronounced population dif-
ferentiation, and genetic polymorphic sites associated with adaptive evolution are more
readily detected (Bridle and Vines 2007). These phenomena have been confirmed in
the Xiamen population, and this result, to some extent, also strongly supports the
analysis of population genetic patterns and population evolution for marginal effects
at a specific spatiotemporal scale of a single species. Xiamen Island is a semi-enclosed
island surrounded by the mainland. Freshwater flows from the southeastern part of the
Jiulong River and the outside are blocked by Jinmen Island, resulting in complex and
variable hydrological environmental factors (Jing et al. 2011). This may also be the
cause of P. minor differentiation in Xiamen.
Based on these results, we speculate that the time during which P. minor expanded
from the refugium to occupy the coastal areas of China and Malaysia was relatively
short. With the passage of time, the Chinese and Malaysian P. minor populations ac-
cumulated sufficient genetic variation to diverge completely. Similar results have been
detected in the genetic structure of Chinese pomfret with similar distributions. The
results of this study on the population genetics of P. minor are consistent with the pro-
posed mesoscale boundary units suggested for the management of the region by Ablan
et al. (2002). The Chinese coastal population should be classified as a north-central
group (encompassing northwestern Taiwan, northern Vietnam, and the northwest-
ern Philippines), and the Malaysian population should be classified as a southwestern
group (comprising southern Vietnam and the eastern coast of mainland Malaysia).
Unfortunately, the genetic diversity of P. minor in coastal China is lower than that
of the Malaysian population, which is directly related to the high fishing pressure in
China’s offshore waters. Therefore, in order to safeguard fishery resources, emphasis
should be placed on the protection of P. minor resources, fishing in coastal P. minor
spawning grounds should be prohibited, and bottom trawling, gillnet and set net
operations should be strictly prohibited. If these measures are taken seriously and
implemented, P. minor resources will gradually recover, and the tragedy of resource
decline of traditional commercial fishes in China, such as the large yellow croaker (La-
rimichthys crocea), small yellow croaker (Larimichthys polyactis), and hairtail (Trichiurus
haumela), will been avoided.
Conclusion
Genetic signature of P. minor in China and Malaysia coastal waters were evaluated. The
results showed that all P. minor had moderate haplotype diversity and two divergent lin-
eages. The phylogenetic structure of P. minor corresponded imperfectly with geographi-
cal location at the Cytb gene level, but significant divergence between Chinese and
Malaysian populations was detected. To get precise phylogeographic structure, morePopulation genetics and phylogeography of Pampus minor 151
sensitive DNA markers such as SLAF, RAD and WGS will be employed and reveal the
adaptive evolution mechanism of this species. Lower haplotype diversity is detected in
China, which further indicated that Chinese fishery resources are facing greater fishing
pressure and more focus is needed on fishery protection and management.
Acknowledgements
The present study could not have been performed without assistance from Drs Bin-
bin Shan, Xiang Zhang, Wentao Niu and Yan Li during the collection of P. minor
specimens. The research was funded by the National Key Research and Develop-
ment Program of China (2018YFC1406302), the National Programme on Global
Change and Air-Sea Interaction (GASI-02-SCS-YDsum/spr/aut), the Bilateral Coop-
eration of Maritime Affairs (2200207), the Scientific Research Foundation of TIO,
MNR (2019017, 2019018) and the University of Malaya, Research University Grant
(TU001-2018). The authors declare no conflicts of interest including the implementa-
tion of research experiments and writing this manuscript.
References
Ablan MCA, McManus JW, Chen CA, Shao KT, Bell J, Cabanban AS, Tuan VS, Arthana IW
(2002) Meso-scale transboundary units for the management of coral reefs in the South
China Sea Area. NAGA, World Fish Center Quarterly 25: 4–9. http://www.worldfish-
center.org/Naga/Naga25-3&4/pdf/NAGA_25no3n4_features_a.pdf
Aris-Brosou S, Excoffier L (1996) The impact of population expansion and mutation rate
heterogeneity on DNA sequence polymorphism. Molecular Biology and Evolution 13:
494–504. https://doi.org/10.1093/oxfordjournals.molbev.a025610
Avise JC (1998) The history and purview of phylogeography: a personal reflection. Molecular
Ecology 7: 371–379. https://doi.org/10.1046/j.1365-294x.1998.00391.x
Avise JC, Neigel JE, Arnold J (1984) Demographic influences on mitochondrial DNA lineage
survivorship in animal populations. Journal of Molecular Evolution. 20: 99–105. https://
doi.org/10.1007/BF02257369
Bélanger-Deschênes S, Couture P, Campbell PGC, Bernatchez L (2013) Evolutionary change
driven by metal exposure as revealed by coding SNP genome scan in wild yellow perch (Per-
ca flavescens). Ecotoxicology 22(5): 938–957. https://doi.org/10.1007/s10646-013-1083-8
Bridle JR, Vines TH (2007) Limits to evolution at range margins: when and why does ad-
aptation fail? Trends in Ecology and Evolution 22: 140–147. https://doi.org/10.1016/j.
tree.2006.11.002
Butchart SHM, Walpole M, Collen B, Van Strien A, Scharlemann JPW, Almond REA, Bail-
lie JEM, Bomhard B, Brown C, Bruno J, Carpenter KE, Carr GM, Chanson J, Chenery
AM, Csirke J, Davidson NC, Dentener F, Foster M, Galli A, Galloway JN, Genovesi P,
Gregory RD, Hockings M, Kapos V, Lamarque J-F, Leverington F, Loh J, McGeoch MA,152 Yuan Li et al. / ZooKeys 969: 137–154 (2020)
McRae L, Minasyan A, Morcillo MH, Oldfield TEE, Pauly D, Quader S, Revenga C,
Sauer JR, Skolnik B, Spear D, Stanwell-Smith D, Stuart SN, Symes A, Tierney M, Tyrrell
TD, Vié J-C, Watson R (2010) Global biodiversity: indicators of recent declines. Science
328: 1164–1168. https://doi.org/10.1126/science.1187512
Cui ZX, Liu Y, Liu J, Luan WS (2010) Molecular identification of Pampus fishes (Perciformes,
Stromateidae). Ichthyological Research 57: 32–39. https://doi.org/10.1007/s10228-009-
0119-9
Da Fonseca RR, Johnson WE, O’Brien SJ, Ramos MJ, Antunes A (2008) The adaptive evolu-
tion of the mammalian mitochondrial genome. BMC Genomics 9: 1–119. https://doi.
org/10.1186/1471-2164-9-119
Drummond AJ, Suchard MA, Xie D, Rambaut A (2012) Bayesian phylogenetics with BEAUti
and the BEAST 1.7. Molecular Biology and Evolution 29(8): 1969–1973. https://doi.
org/10.1093/molbev/mss075
Ellegren H (2014) Genome sequencing and population genomics in non-model organisms.
Trends in Ecology and Evolution 29: 51–63. https://doi.org/10.1016/j.tree.2013.09.008
Excoffier L, Laval G, Schneider S (2005) Arlequin (version 3.0): an integrated software package
for population genetics data analysis. Evolutionary Bioinformatics 1: 47–50. https://doi.
org/10.1177/117693430500100003
Funk WC, McKay JK, Hohenlohe PA, Allendorf FW (2012) Harnessing genomics for de-
lineating conservation units. Trends in Ecology and Evolution 27: 489–496. https://doi.
org/10.1016/j.tree.2012.05.012
Frankowski J, Lübke K, Coke M, Weyl OLF (2020) Genetic variability and demographic his-
tory of Anguilla mossambica (Peters, 1852) from continental Africa and Madagascar. Jour-
nal of Fish Biology 96(5): 1251–1259. https://doi.org/10.1111/jfb.14220
Gao TX, Bi XX, Zhao LL, Li CJ (2013) Population genetic structure of roughskin sculpin Tra-
chidermus fasciatus based on the mitochondrial Cytb sequence. Acta Hydrobiologica Sinica
37:199–207. [in Chinese with English abstract]
Grant WAS, Bowen BW (1998) Shallow population histories in deep evolutionary linages of
marine fishes: Insights from sardines and anchovies and lessons for conservation. Journal
of Heredity 89: 415–426. https://doi.org/10.1093/jhered/89.5.415
Guo EM, Liu Y, Liu J, Cui ZX (2010) DNA barcoding discriminates Pampus minor (Liu et
al. 1998) from Pampus species. Chinese Journal of Oceanology and Limnology 28: 1266–
1274. https://doi.org/10.1007/s00343-010-9917-1
Inoue JG, Miya M, Tsukamoto K, Nishida M (2001) A mitogenomic perspective on the basal tel-
eostean phylogeny: resolving higher-level relationships with longer DNA sequences. Molec-
ular Phylogenetics and Evolution 20: 275–285. https://doi.org/10.1006/mpev.2001.0970
Jacobsen MW, Da Fonseca RR, Bernatchez L, Hansen MM (2016) Comparative analysis of com-
plete mitochondrial genomes suggests that relaxed purifying selection is driving high non-
synonymous evolutionary rate of the NADH2 gene in whitefish (Coregonus ssp.). Molecular
Phylogenetics and Evolution 95: 161–170. https://doi.org/10.1016/j.ympev.2015.11.008
Jin XS, Zhao XY, Meng TX, Cui Y (2005) Biology Resource and Environment in the Bohai Sea
and Yellow Sea. Scientific Press, Beijing. [in Chinese]Population genetics and phylogeography of Pampus minor 153
Jing CS, Zhu XM, Bao XW, Song DH (2011) Three dimensional tidal current numerical simu-
lation based on FVCOM in and around Xiamen Bay. Journal of Applied of Oceanography
30: 103–113. [in Chinese with English abstract]
Lambeck K, Esat T, Potter E (2002) Links between climate and sea levels for the past three mil-
lion years. Nature 419: 199–206. https://doi.org/10.1038/nature01089
Li Y, Zhou YD, Li PF, Gao TX, Lin LS (2019a) Species identification and cryptic diversity in
Pampus species as inferred from morphological and molecular characteristics. Marine Bio-
diversity 49: 2521–2534. https://doi.org/10.1007/s12526-019-00976-6
Li Y, Zhang LY, Loh KH, Feng J, Zheng XQ, Song PQ, Lin LS (2019b) Genetic diversity
comparison of Pampus minor between Chinese and Malaysian populations inferred from
mtDNA Cytb. Pakistan Journal of Zoology 51: 149–157. https://doi.org/10.17582/jour-
nal.pjz/2019.51.1.149.157
Librado P, Rozas J (2009) DnaSP v5: a software for comprehensive analysis of DNA polymor-
phism data. Bioinformatics 25: 1451–1452. https://doi.org/10.1093/bioinformatics/btp187
Liu J, Li CS (1998) A new pomfret species, Pampus minor sp. nov (Stromateidae) from Chi-
nese waters. Chinese Journal of Oceanology and Limnology 16: 280–285. https://doi.
org/10.1007/BF02848735
Liu JX, Gao TX, Wu SF, Zhang YP (2007) Pleistocene isolation in the Northwestern Pacific mar-
ginal seas and limited dispersal in a marine fish, Chelon haematocheilus (Temminck & Schlegel,
1845). Molecular Ecology 16: 275–288. https://doi.org/10.1111/j.1365-294X.2006.03140.x
Mishmar D, Ruiz-Pesini E, Golik P, Macaulay V, Clark AG, Hosseini S, Brandon M, Easley
K, Chen E, Brown MD, Sukernik RI, Olckers A, Wallace DC (2003) Natural selection
shaped regional mtDNA variation in humans. Proceedings of the National Academy of
Sciences 100: 171–176. https://doi.org/10.1073/pnas.0136972100
Ohdachi S, Masuda R, Abe H, Adachi J, Dokuchaev NE, Haukisalmi V, Yoshida MC (1997)
Phylogeny of Eurasian soricine shrews (Insectivora, Mammalia) inferred from the mito-
chondrial Cytochrome b gene sequences. Zoological Science 14: 527–532. https://doi.
org/10.2108/zsj.14.527
Petit JR, Jouzel J, Raynaud D, Barkov NI, Barnola JM, Basile I, Bender M, Chappellaz J, Davis
M, Delaygue G, Delmotte M, Kotlyakov VM, Legrand M, Lipenkov VY, Lorius C, PÉpin
L, Ritz C, Saltzman E, Stievenard M (1999) Climate and atmospheric history of the past
420,000 years from the Vostok ice core, Antarctica. Nature 399: 429–436. https://doi.
org/10.1038/20859
Tamura K, Peterson D, Peterson N, Stecher G, Nei M, Kumar S (2011) MEGA5: molecu-
lar evolutionary genetics analysis using maximum likelihood, evolutionary distance, and
maximum parsimony methods. Molecular Biology and Evolution 28: 2731–2739. https://
doi.org/10.1093/molbev/msr121
Rogers AR, Harpending H (1992) Population growth makes waves in the distribution of
pairwise genetic differences. Molecular Biology and Evolution 9: 552–569. https://doi.
org/10.1093/oxfordjournals.molbev.a040727
Rosel PE, Haygood MG, Perrin WF (1995) Phylogenetic relationships among the true porpois-
es (Cetacea: Phocoenidae). Molecular Phylogenetics and Evolution 4: 463–474. https://
doi.org/10.1006/mpev.1995.1043154 Yuan Li et al. / ZooKeys 969: 137–154 (2020)
Saraste M (1999) Oxidative phosphorylation at the fin de siecle. Science 283: 1488–1493.
https://doi.org/10.1126/science.283.5407.1488
Shen KN, Jamandre BW, Hsu CC, Tzeng WN, Durand JD (2011) Plio-Pleistocene sea lev-
el and temperature fluctuations in the northwestern Pacific promoted speciation in the
globally-distributed flathead mullet Mugil cephalus. BMC Evolutionary Biology 11: 1–83.
https://doi.org/10.1186/1471-2148-11-83
Stepien CA (1999) Phylogeographical structure of the Dover sole Microstomus pacificus: the
larval retention hypothesis and genetic divergence along the deep continental slope of the
Northeastern Pacific Ocean. Molecular Ecology 8: 923–939. https://doi.org/10.1046/
j.1365-294x.1999.00643.x
Sun P, Tang BJ (2018) Low mtDNA variation and shallow population structure of the Chinese
pomfret Pampus chinensis along the China coast. Journal of Fish Biology 92: 214–228.
https://doi.org/10.1111/jfb.13515
Wang P (1999) Response of Western Pacific marginal seas to glacial cycles: paleoceanograph-
ic and sedimentological features. Marine Geology 156: 5–39. https://doi.org/10.1016/
S0025-3227(98)00172-8
Wright S (1965) The interpretation of population structure by F-statistics with special regard
to systems of mating. Evolution 19: 395–420. https://doi.org/10.1111/j.1558-5646.1965.
tb01731.x
Wu RX, Liang XH, Zhuang ZM, Liu SF (2012) Mitochondrial COI sequence variation of
silver pomfret (Pampus argenteus) from Chinese coastal waters. Acta Zootaxonomic Sinica
37: 480–488. [in Chinese with English abstract]
Xu SY, Sun DR, Song N, Han ZQ, Gao TX, Shui BN (2017) Local adaptation shapes pattern
of mitochondrial population structure in Sebastiscus marmoratus. Environmental Biology
of Fishes 100: 763–774. https://doi.org/10.1007/s10641-017-0602-5
Zhang BD, Xue DX, Wang J, Li YL, Liu BJ, Liu JX (2016) Development and preliminary
evaluation of a genomewide single nucleotide polymorphisms resource generated by RAD-
seq for the small yellow croaker (Larimichthys polyactis). Molecular Ecology Resources 16:
755–768. https://doi.org/10.1111/1755-0998.12476
Zhao F, Dong YH, Zhuang P, Zhang T, Zhang, LZ, Shi ZH (2011b) Genetic diversity of silver
pomfret (Pampus argenteus) in the Southern Yellow and East China Seas. Biochemical Sys-
tematics and Ecology 39: 145–150. https://doi.org/10.1016/j.bse.2011.02.002
Zhao F, Zhuang P, Zhang L, Shi ZH (2011a) Population genetic structure of Pampus argenteus
in the Southern Yellow and East China Sea based on the mitochondrial Cytb sequence.
Acta Hydrobiologica Sinica 35: 745–752. [in Chinese with English abstract]You can also read