Assimilation of wind data from airborne Doppler cloud-profiling radar in a kilometre-scale NWP system
←
→
Page content transcription
If your browser does not render page correctly, please read the page content below
Nat. Hazards Earth Syst. Sci., 19, 821–835, 2019
https://doi.org/10.5194/nhess-19-821-2019
© Author(s) 2019. This work is distributed under
the Creative Commons Attribution 4.0 License.

Assimilation of wind data from airborne Doppler cloud-profiling
radar in a kilometre-scale NWP system
Mary Borderies1 , Olivier Caumont1 , Julien Delanoë2 , Véronique Ducrocq1 , and Nadia Fourrié1
1 CNRM   UMR 3589, Université de Toulouse, Météo-France, CNRS, Toulouse, France
2 LATMOS,  IPSL, Université Versailles St-Quentin, CNRS, UPMC, Guyancourt, France

Correspondence: Mary Borderies (mary.borderies@meteo.fr)

Received: 21 August 2018 – Discussion started: 5 September 2018
Revised: 18 February 2019 – Accepted: 2 March 2019 – Published: 17 April 2019

Abstract. The article reports on the impact of the assimila-      implemented to improve the accuracy and timely prediction
tion of wind vertical profile data in a kilometre-scale NWP       of such severe weather. The quality of the predictions de-
system on predicting heavy precipitation events in the north-     pends, among others, on the initial atmospheric state. Sev-
western Mediterranean area. The data collected in diverse         eral studies suggested that the impact of the assimilation of
conditions by the airborne W-band radar RASTA (Radar Air-         wind observations was beneficial for analyses and forecasts
borne System Tool for Atmosphere) during a 45-day period          (Horányi et al., 2015).
are assimilated in the 3 h 3DVAR assimilation system of              Over land, ground-based Doppler precipitation radar data
AROME. The impact of the length of the assimilation win-          are now operationally assimilated in kilometre-scale NWP
dow is investigated. The data assimilation experiments are        systems, since their potential to improve the short-term fore-
performed for a heavy rainfall event, which occurred over         casts has been demonstrated (Montmerle and Faccani, 2009;
south-eastern France on 26 September 2012 (IOP7a) and             Simonin et al., 2014). In clear-air conditions, wind observa-
over a 45-day cycled period. Results indicate that the qual-      tions can be provided by insect-derived Doppler radar mea-
ity of the rainfall accumulation forecasts increases with the     surements (Kawabata et al., 2007; Rennie et al., 2011) or
length of the assimilation window, which recommends using         by Doppler lidars (Weissmann et al., 2012; Kawabata et al.,
observations with a large period centred on the assimilation      2014). To fill the gap in clear-air conditions, radar wind pro-
time. The positive impact of the assimilation of RASTA wind       filers provide vertical profiles of the horizontal wind at a high
data is particularly evidenced for the IOP7a case since re-       vertical resolution. Several studies highlighted the benefit of
sults indicate an improvement in the predicted wind at short-     the assimilation of these data into NWP models to improve
term ranges (2 and 3 h) and in the 11 h precipitation fore-       short-term forecasts (Benjamin et al., 2004; Illingworth et al.,
casts. However, in the 45-day cycled period, the comparison       2015b). However, the main drawback of ground-based radars
against other assimilated observations shows an overall neu-      and radar profilers is that they are only distributed over land.
tral impact. Results are still encouraging since a slight posi-      Because wind observations are too sparse over ocean, at-
tive improvement in the 5, 8 and 11 h precipitation forecasts     mospheric motion vectors (AMVs) are now operationally de-
was demonstrated.                                                 rived using the movement of cloud and water vapour tracers
                                                                  from consecutive satellite images. They provide tropospheric
                                                                  wind data measurements on a global scale with a high tem-
                                                                  poral resolution. Recent studies indicate an overall positive
1   Introduction                                                  impact of the assimilation of AMV data in NWP models
                                                                  on the subsequent forecasts (Deb et al., 2016; Kumar et al.,
The Mediterranean area is frequently subject to heavy precip-     2017). Nevertheless, contrary to most active sensors, AMV
itation events, causing heavy damage and significant human        measurements do not provide wind vertical profile informa-
loss (Ducrocq et al., 2014). Over the last years, numerical       tion but only cloud-top information. Besides, there is an un-
weather prediction (NWP) models have been operationally

Published by Copernicus Publications on behalf of the European Geosciences Union.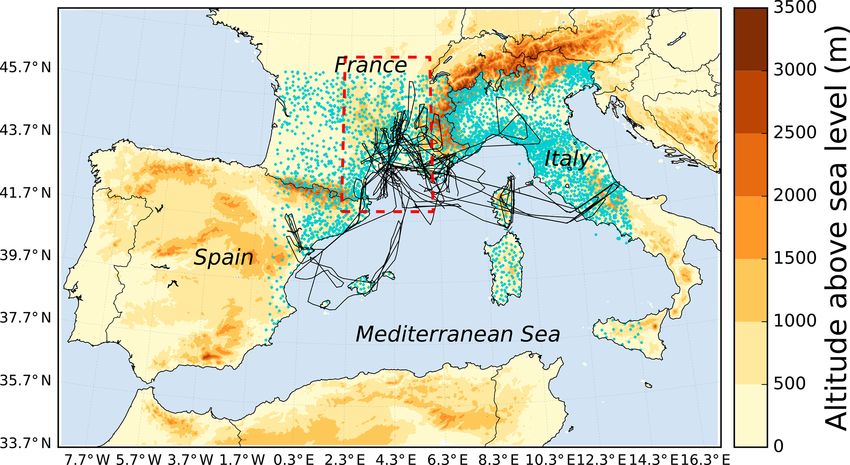
822                           M. Borderies et al.: Assimilation of wind data from airborne Doppler cloud-profiling radar

certainty in the knowledge of the observed cloud-top level        designed for the HyMeX-SOP1, with its 3DVAR assimila-
(Salonen et al., 2015).                                           tion system associated with a 3 h assimilation cycle.
   To fill the gap within the existing observing system, Baker       To assess the potential of RASTA wind data to improve
et al. (2014) highlighted the need for extra wind vertical pro-   short-term forecasts, a series of experiments are first con-
file measurements over ocean to improve the initial condi-        ducted for a heavy rainfall event, which occurred during the
tions for NWP forecasts. This need for new wind measure-          Intensive Observation Period 7a (IOP7a) over south-eastern
ments particularly applies in the Mediterranean region since      France on 26 September 2012. Next, a cycling data assimila-
offshore convective systems, which are responsible for heavy      tion run is conducted over a 45-day period from 24 Septem-
precipitation events, are not well predicted by kilometre-        ber to 5 November 2012 in order to study the impact of
scale NWP models (Duffourg et al., 2016; Martinet et al.,         the assimilation of RASTA wind data in various conditions
2017). In the near future, the Doppler W-band radar on board      during the whole HyMeX-SOP1. This article investigates
the EarthCare satellite mission (scheduled to be launched in      the impact of the choice of the assimilation window in a
middle 2021, Illingworth et al., 2015a) will provide vertical     3DVAR system. Indeed, data from moving platforms, such
profiles of wind data from Doppler radar at a high vertical       as RASTA, have the disadvantage of not being measured si-
resolution over land and over sea for the first time. In the      multaneously at the assimilation time but over the flight leg.
meantime, the WIVERN satellite concept mission carrying a         A small assimilation window constrains the number of as-
conically scanning Doppler W-band radar is also being con-        similated data to those that are nearly valid at the assimi-
ceived (Illingworth et al., 2018). So far, the impact of the      lation time. By contrast, a larger assimilation window leads
assimilation of wind vertical profiles from W-band radar has      to a larger coverage but with observations which might be no
never been investigated.                                          longer valid. Therefore, a sensitivity study to the assimilation
   Airborne Doppler radars have the advantage of collect-         window is performed in this study.
ing a large data set of measurements over land and sea on            This article is organized as follows. In Sect. 2, the air-
very fine scales. Pu et al. (2009) showed that the 3DVAR          borne Doppler W-band radar RASTA and the period of study
assimilation of wind data from airborne Doppler radar re-         are described. The kilometre-scale NWP model AROME-
sults in significant improvement in the intensity and precipi-    WMED with its 3DVAR assimilation system are then pre-
tation forecasts of Hurricane Dennis. Following on, Li et al.     sented in Sect. 3. Following on, the different model simu-
(2014) demonstrated the benefits of the 4DVAR assimilation        lations are detailed in Sect. 4. Finally, the evaluation of the
of the ELDORA X-band radar velocity data in the simulation        different experiments is first focused on IOP7a in Sect. 5,
of Hurricane Nuri’s genesis. The positive impact due to air-      followed by a statistical evaluation over the whole HyMeX
borne Doppler velocity data assimilation for hurricane fore-      SOP1 in Sect. 6.
casts has also been investigated with an ensemble Kalman fil-
ter by Weng and Zhang (2012). So far, this kind of study has
never been done in the Mediterranean area. In addition, the       2     Radar data and period of study
measurements used in the hurricane studies listed above were
collected with side-looking radar (elevation angle ≤ 70◦ ) at     The Doppler W-band radar RASTA is first described in
lower frequencies (X or C bands).                                 Sect. 2.1, and details about the data collected by RASTA dur-
   The primary objective of this article is to evaluate for the   ing the HyMeX first Special Observation Period (SOP1) field
first time the impact of assimilating wind profiles retrieved     campaign are then briefly given in Sect. 2.2.
by airborne W-band radar in a kilometre-scale NWP model.
The current study covers a 2-month period with the airborne       2.1    The Doppler W-band radar RASTA
Doppler W-band radar RASTA (Radar Airborne System Tool
for Atmosphere) during the HyMeX (HYdrological cycle              The airborne cloud radar RASTA is a monostatic Doppler
in the Mediterranean eXperiment, Drobinski et al., 2014)          multibeam antenna system operating at 95 GHz (Bouniol
first Special Observation Period (HyMeX-SOP1, Ducrocq             et al., 2008; Protat et al., 2009; Delanoë et al., 2013). The air-
et al., 2014) over a region of the Mediterranean area prone       craft platform used is the French Falcon 20 research aircraft
to heavy rainfall. The main goal of the HyMeX-SOP1 was            from the SAFIRE unit (Service des Avions Français Instru-
to document the heavy precipitation events that regularly af-     mentés pour la Recherche en Environnement). This unique
fect north-western Mediterranean coastal areas. RASTA is          instrument allows the documentation of the microphysical
a multibeam antenna system (six beams in total) that al-          properties and the three components of the wind field in the
lows the documentation of the three components of the wind        vertical at a high resolution of 60 m and quasi-continuously
field in the vertical at a high resolution of 60 m and quasi-     in time during the flights.
continuously in time during the flights. The current assimi-         The radar RASTA is equipped with six Cassegrain anten-
lation study is performed in a quasi-operational framework,       nas pointing either upward (antennas 1–3) or downward (an-
using a version of the Météo-France operational kilometre-        tennas 4–6). Therefore, RASTA measures the reflectivity and
scale model AROME (named AROME-WMED) specifically                 the radial velocity in three non-collinear directions above and

Nat. Hazards Earth Syst. Sci., 19, 821–835, 2019                            www.nat-hazards-earth-syst-sci.net/19/821/2019/
M. Borderies et al.: Assimilation of wind data from airborne Doppler cloud-profiling radar                                      823

below the aircraft in the clouds. A schematic figure of the
RASTA configuration during the HyMeX-SOP1 is given by
Bousquet et al. (2016), their Fig. 1. The radial velocity mea-
surements are collected at a vertical resolution of 60 m and
a time resolution of 250 ms (i.e. 1.5 s between two measure-
ments of the same antenna). The maximum range is 15 km
with a Nyquist velocity of 7.8 m s−1 (the pulse repetition fre-
quency equals 10 kHz).
   The data processing described by Bousquet et al. (2016) is
applied to RASTA wind observations. First, the exact speed
of the aircraft and the pointing angles are used to rigorously
determine the component related to the aircraft’s movement.
Doppler measurements are then processed by removing the            Figure 1. The Falcon 20 flight paths (black lines) during the
projection of aircraft ground speed along the six antenna          HyMeX first Special Observation Period over the AROME-WMED
                                                                   domain. The altitude of ground above sea level (in metres) is rep-
beams. Next, Doppler velocities are unfolded using an in
                                                                   resented by the coloured gradient. Rain gauges are represented by
situ wind sensor for the first gate and by applying a gate-        the blue markers. The area surrounding the IOP7a case study is in-
to-gate correction for the other gates. In addition to that, the   dicated by the red box.
combination of the three non-collinear beams is used to ver-
ify potential unfolding issues as the retrieval would be lo-
cally inconsistent. For ground-pointing antennas, a check-up       3     Model and data assimilation system
is conducted in order to ensure that ground return veloc-
ities are close to 0 m s−1 . Upward-looking antennas errors        3.1    The AROME-WMED NWP model
are estimated and corrected by ensuring continuity between
the data collected above and below the aircraft. After pro-        This study is conducted with AROME-WMED (Fourrié
cessing, the Doppler velocity of the three downward-looking        et al., 2015), the HyMeX-dedicated version of the Météo-
and upward-looking antennas are combined to retrieve the           France operational kilometre-scale NWP model AROME
horizontal and vertical wind components above and below            (Seity et al., 2011). AROME-WMED, which covers the
the aircraft. More details on the RASTA configuration dur-         entire north-western Mediterranean Basin, was specially
ing HyMeX can be found by Bousquet et al. (2016). The re-          designed for the HyMeX-SOP1 and ran in real time to
trieved horizontal wind components will be assimilated in the      plan the airborne operations in advance, especially in the
3DVAR assimilation system of AROME-WMED.                           mesoscale convective systems. AROME-WMED is based on
                                                                   the AROME-France version operationally employed in 2012:
2.2   RASTA data during the HyMeX first Special                    the deep convection is explicitly resolved and the microphys-
      Observation Period (SOP1)                                    ical processes are governed by the ICE3 one-moment bulk
                                                                   microphysical scheme (Pinty and Jabouille, 1998). AROME-
This study takes advantage of the data collected by RASTA
                                                                   WMED runs at a horizontal resolution of 2.5 × 2.5 km with
during the HyMeX SOP1, which took place from 5 Septem-
                                                                   60 vertical levels, ranging from approximately 10 m above
ber to 5 November 2012 over the western Mediterranean
                                                                   ground level to 1 hPa. Compared to AROME, AROME-
(Ducrocq et al., 2014). The main goal of the SOP1 was
                                                                   WMED covers an extended domain centred on the north-
to document the heavy rainfall events that regularly affect
                                                                   western Mediterranean area. The AROME-WMED domain
north-western Mediterranean coastal areas. During the 2-
                                                                   is displayed in Fig. 1. It has 948 × 628 horizontal grid points,
month campaign, approximately 20 rainfall events were doc-
                                                                   which is equivalent to a horizontal size of 2370 × 1570 km2 .
umented in France, Italy and Spain (Ducrocq et al., 2014).
                                                                   In addition, to increase the observation coverage in the south-
Specifically, the RASTA radar aboard the Falcon 20 collected
                                                                   ern part of the domain, more satellite (AMSU) and ground-
data during 18 flights in and around mesoscale convective
                                                                   based Spanish weather station observations are assimilated
systems in diverse conditions.
                                                                   in AROME-WMED.
   The data collected by RASTA during the SOP1 offer a
wide variety of conditions over land, sea and complex ter-
                                                                   3.2    3DVAR assimilation system
rains. Among all the observed vertical columns over the
SOP1, 72.6 % were collected in stratiform areas, 13.1 % in         AROME-WMED has a three-dimensional variational
clear sky and 14.3 % in convective areas (Borderies et al.,        (3DVAR) data assimilation system (Brousseau et al., 2011)
2018). RASTA flight paths during the HyMeX SOP1 are rep-           associated with a 3 h assimilation cycle. It is based on
resented by the black lines in Fig. 1.                             an incremental formulation (Fischer et al., 2005) and the
                                                                   control variables are temperature, specific humidity, surface
                                                                   pressure, vorticity and divergence. AROME-WMED back-

www.nat-hazards-earth-syst-sci.net/19/821/2019/                              Nat. Hazards Earth Syst. Sci., 19, 821–835, 2019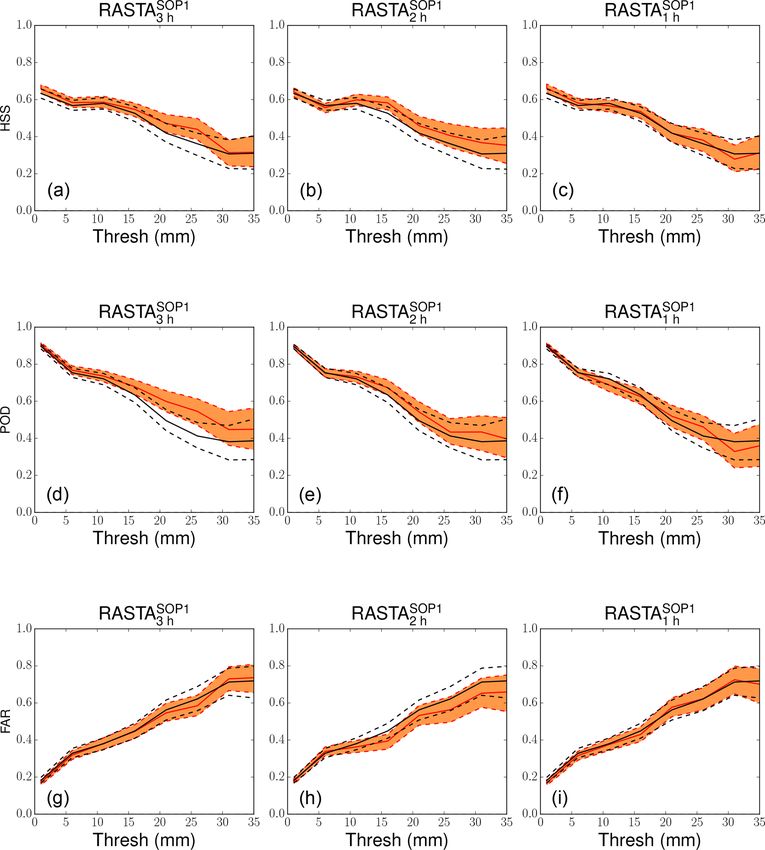
824                           M. Borderies et al.: Assimilation of wind data from airborne Doppler cloud-profiling radar

ground error covariances were computed using a period in
October 2010 characterized by convective systems over the
north-western Mediterranean region (Fourrié et al., 2015).
   Every 3 h an analysis is computed by using all observa-
tions available within a ±1 h 30 min assimilation window and
a 3 h forecast to produce a first guess for the next cycle. The
assimilation system ingests a wide variety of observations
from satellite, ground-based Global Navigation Satellite Sys-
tem (GNSS), aircraft, radiosondes, drifting buoys, balloons
and wind profilers, automatic land and ship weather stations,
and ground-based radars of the French network ARAMIS
(reflectivity and radial velocity).

4     Data assimilation experiments

To assess the potential of RASTA wind data to improve
short-term forecasts of heavy precipitation events, a total of
four experiments is conducted over a 45-day cycled period
during the HyMeX-SOP1. Focus is also made on one of the            Figure 2. Schematic view of the aircraft to represent the data which
most significant episodes which occurred within France dur-        are taken into account to calculate the super-observations. If the d
ing the HyMeX SOP1 campaign on 26 September 2012.                  is larger than 2.5
                                                                                   2 km, the data are not used to calculate the RASTA
                                                                   super-observation. In this configuration, the observation is not used
4.1    RASTA wind data pre-processing                              in cell number 3.

First, “super-observations” are created to reduce observation
and representativeness errors. They are calculated by interpo-
lating RASTA wind data in the model vertical and horizontal        from 00:00 to 21:00 UTC, the 3DVAR assimilation system
resolutions. This interpolation is done by taking the median       of AROME-WMED ingests all RASTA wind data available
value of all data available along the aircraft track within a      during an assimilation window 1t centred on the assimila-
box of 2.5 km length between the two half model levels sur-        tion time T , as if they were valid at the time T . Too large
rounding each model level. Applying a median filter instead        an assimilation window 1t would result in assimilating data
of averaging allows the influence of outliers to be reduced        that are no longer valid at the current assimilation time T ,
due to the difficulty of having high-quality measurements for      especially for convective systems which can evolve quickly
airborne Doppler radar (Bosart et al., 2002). Indeed, after the    in time. On the other hand, it is likely that the impact will be
data processing described in Sect. 2.1, some spurious data         neutral if the assimilation window is too short, because less
were still occasionally present. Using a median filter instead     data are assimilated. Therefore, the impact of the assimilation
of a mean filter helps to reduce the weight that these spuri-      of RASTA wind data is tested with three different assimila-
ous observations can have in the calculation of RASTA wind         tion windows 1t : 3 h (RASTA3 h ), 2 h (RASTA2 h ) and 1 h
super-observations.                                                (RASTA1 h ) centred on the assimilation time T .
   When the aircraft roll and/or pitch angles are too high (i.e.      Finally, four different experimental designs are defined.
if d = sin(θ )×R ≥ 2.5                                             The analyses of the global operational NWP model ARPEGE
                       2 in Fig. 2, with R being the range from
the radar), some data might not be in the same box at a given      are used to initialize the experiments and to provide boundary
range from the aircraft (for instance in the box number 3 in       conditions. In the control (CTRL) experimental design, only
Fig. 2). Therefore, these data are not taken into account.         the observations that are operationally assimilated are taken
   After this pre-processing, to satisfy assumptions about         into account (see Sect. 3.2). The three additional RASTA
observation error covariances, which are supposed to be            experimental designs (RASTA3 h , RASTA2 h and RASTA1 h )
0 m2 s−2 , a thinning is applied to RASTA wind super-              share the same configuration as CTRL but include the as-
observations. One super-observation out of three is then as-       similation of RASTA wind data every 3 h from 00:00 to
similated, which is equivalent to approximately one observa-       21:00 UTC.
tion every 5 to 9 km depending on the aircraft speed.                 Because the Doppler multibeam antenna system of
                                                                   RASTA can retrieve the horizontal wind components (u,
4.2    Experimental set-up                                         v), which are linked to two control variables of AROME-
                                                                   WMED (vorticity and divergence), the assimilation of
RASTA wind data are not measured simultaneously but                RASTA wind data is straightforward and does not require
over the flight leg. Therefore, at each assimilation time T        the use of a radial wind observation operator. Bousquet

Nat. Hazards Earth Syst. Sci., 19, 821–835, 2019                             www.nat-hazards-earth-syst-sci.net/19/821/2019/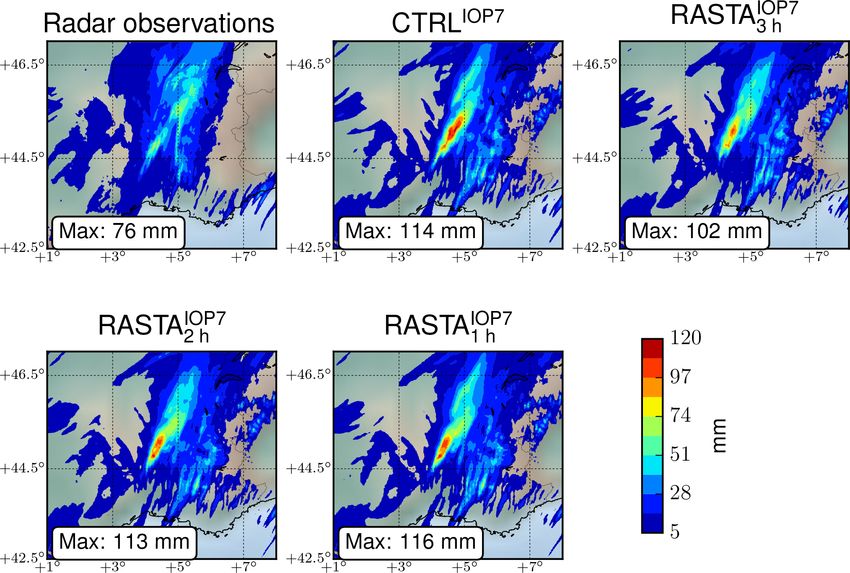
M. Borderies et al.: Assimilation of wind data from airborne Doppler cloud-profiling radar                                   825

et al. (2016) demonstrated that the root-mean-square error of
RASTA wind data vs. ground-based centimetre-wavelength
radars is of the order of 4 m s−1 . They argued that this er-
ror mainly originated from the sampling volume of ground-
based radars being much larger than that of RASTA. In
this study, it has been decided to use the same observa-
tion error as the one used for radiosondes, which increases
with altitude (from ≈ 1.8 m s−1 at 900 hPa to ≈ 2.52 m s−1
at 200 hPa). Finally, in addition to the pre-processing de-
scribed in Sect. 4.1, a quality control is also performed prior
to the assimilation: observations with innovation (observa-
tions − background) greater than a threshold are rejected.
This threshold depends on both the observation and back-
ground errors.
   First, the four different experimental designs are run dur-
ing a 45-day cycled period from 00:00 UTC 24 Septem-
ber 2012, which is the day when the Falcon 20 first flew
during HyMeX-SOP1, to 5 November 2012, after the last
flight. During this period, the different assimilation experi-
ments are named CTRLSOP1 , RASTASOP1     3 h , RASTA2 h
                                                       SOP1 and
         SOP1
RASTA1 h . The number of assimilated data over the cov-
ered period are represented as a function of the pressure level    Figure 3. Number of RASTA horizontal wind data that are assim-
in Fig. 3 for the three RASTA experiments. Table 1 sum-            ilated as a function of pressure for the RASTASOP1       SOP1
                                                                                                                 3 h , RASTA2 h
marizes the different assimilation experiments. The fourth         and RASTA1 h .
column shows the percentage of analyses in which RASTA
wind data were assimilated over the total number of analy-
ses (360) during the 45-day cycled period for the different
RASTA experiments. A larger assimilation window results            5     Results on the case study
in assimilating data more frequently, but the time lag be-
tween the observation time and the analysis time is greater        The impact of RASTA wind data is first illustrated on a heavy
than 1 h. On the other hand, a smaller assimilation window         precipitation event which occurred during the Intensive Ob-
constrains the number of analyses to those for which the ob-       servation Period 7a (IOP7a) on 26 September 2012.
servations are valid near the analysis time. Therefore, the per-
centage of analyses in which RASTA wind data were assim-           5.1    Case description: IOP7a
ilated decreases with the length of the assimilation window
from 9.5 % in the RASTASOP1   3h   experiment to 7.2 % in the      The IOP7a precipitation event is one of the most signifi-
RASTASOP11h    experiment.  Finally, the last column of Table 1    cant episodes that occurred within France during the HyMeX
represents the percentage of RASTA wind data which were            SOP1 campaign (Hally et al., 2014). This case study was lo-
assimilated among the total number of assimilated data (con-       cated over south-eastern France in the area delimited by the
ventional, GNSS, radar, satellite, RASTA, etc.) over the en-       red box in Fig. 1, which has been enlarged in Fig. 4. The
tire AROME-WMED domain (represented in Fig. 1). This               precipitation event consisted of a convective line over the
percentage is quite small because of the already dense ob-         mountainous region and a band of stratiform rainfall over
serving network used in AROME-WMED.                                the Gard and the Ardèche departments. More than 100 mm
   Finally, the four different experimental designs are also       of rain was observed between 00:00 UTC on 26 September
run on a heavy precipitation event which occurred during           and 00:00 UTC on 27 September. A first peak of rainfall ac-
the Intensive Observation Period 7a (IOP7a) on 26 Septem-          cumulation is observed in the morning at 08:00 UTC and a
ber 2012 during the morning. The CTRLIOP7 , RASTAIOP7      3h ,    second one in the late afternoon at 17:00 UTC. This event is
RASTAIOP72h   and RASTA    IOP7 experiments start at 00:00 UTC
                           1h                                      further described by Hally et al. (2014).
on 26 September 2012 and end at 12:00 UTC on 26 Septem-               During the IOP7a, RASTA data were collected during
ber 2012.                                                          Flight 15 between 06:10 and 09:45 UTC. Therefore, RASTA
                                                                   wind data are assimilated for the first time at 06:00 UTC.
                                                                   Since the Falcon 20 took off at 06:10 UTC, the RASTAIOP71h
                                                                   experiment assimilates all the RASTA wind data that are
                                                                   available between 06:10 and 06:30 UTC, as if they were
                                                                   valid at 06:00 UTC. Similarly, the RASTAIOP7           IOP7
                                                                                                             2 h (RASTA3 h )

www.nat-hazards-earth-syst-sci.net/19/821/2019/                               Nat. Hazards Earth Syst. Sci., 19, 821–835, 2019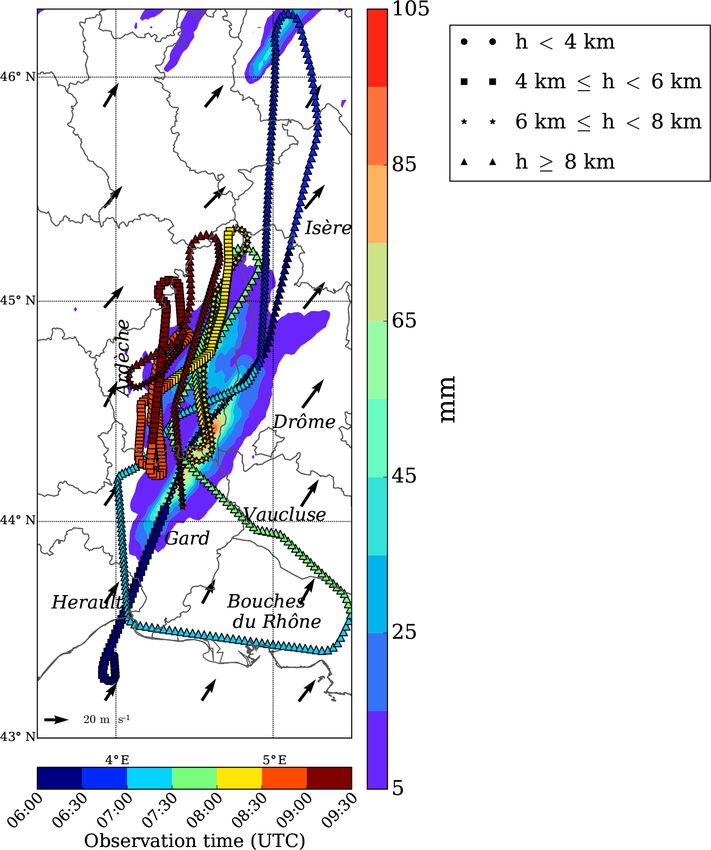
826 M. Borderies et al.: Assimilation of wind data from airborne Doppler cloud-profiling radar
Table 1. Experimental design from 24 September to 5 November 2012.
Experiment Assimilated data 1t RASTA analyses Percentage of assimilated
RASTA data
CTRLSOP1 Conv. + GNSS + radar + satellite – 0 0%
RASTASOP1
3h CTRLSOP1 + RASTA 3h 9.5 % (35 cases out of 360) 4.55 %
RASTASOP1
2h CTRLSOP1 + RASTA 2h 8.9 % (32 cases out of 360) 3.34 %
RASTASOP1
1h CTRLSOP1 + RASTA 1h 7.2 % (26 cases out of 360) 1.9 %
occurred over the Ardèche department. Therefore, the assim-
ilation of RASTA wind data at 06:00 UTC is expected to have
an impact on the forecasts, especially for the first peak of
rainfall accumulation, which occurred in the morning.
5.2 Impact on analyses
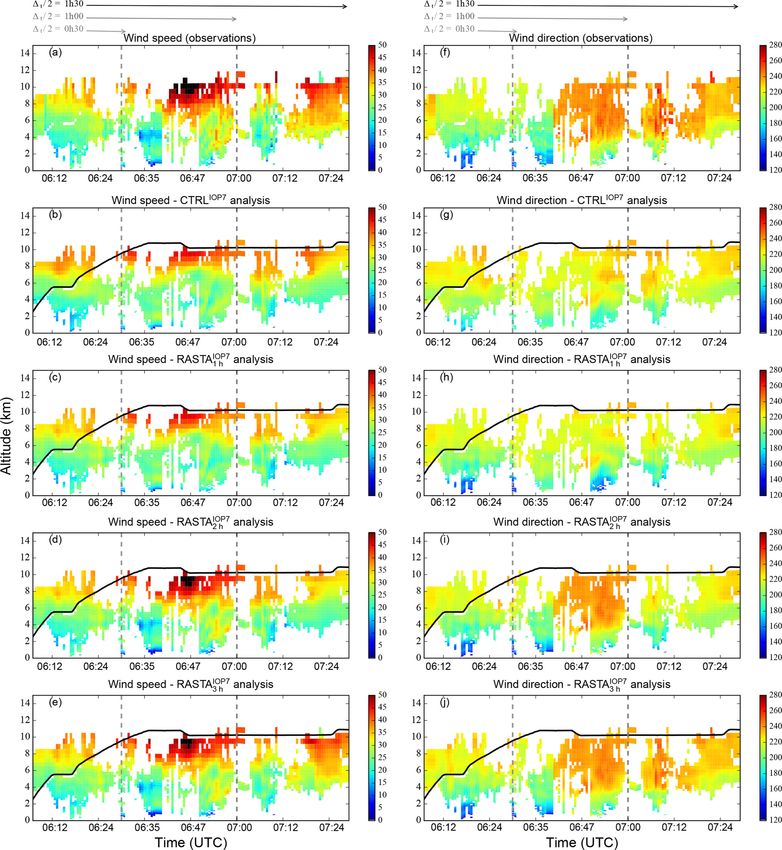
Figure 5 shows (from the top to the bottom) the wind speed
(left panels, a to e) and the wind direction (right panels, f
to j) for the observations, the CTRLIOP7 , the RASTAIOP7 1h ,
the RASTAIOP7 IOP7
2 h and the RASTA3 h analyses. The different
analyses were computed using the same background state.
The three different assimilation windows 1t are delimited
by the vertical lines.
As expected, Fig. 5 indicate a better agreement with the
observations if RASTA wind data are assimilated in terms of
both direction and speed. The RASTAIOP7 IOP7
3 h , RASTA2 h and
RASTAIOP71h experiments assimilate all the observations un-
til 06:30, 07:00 and 07:30 UTC, respectively. These different
time limitations explain the differences in wind and direction
between the different RASTA experiments.
Even though the three RASTA analyses are very simi-
lar to each other within their respective assimilation win-
dows 1t , at 06:30 UTC the RASTAIOP7 3h (panel e) and the
RASTAIOP72h (panel d) experiments exhibit larger velocities
Figure 4. Area under the red box in Fig. 1: 24 h accumulated rain-
at 10 km of altitude than the RASTAIOP7 1h (panel c) exper-
fall observed by weather radar between 00:00 UTC on 26 Septem-
ber and 00:00 UTC on 27 September is represented by the shadings
iment. This discrepancy is explained by the fact that the
(scale on the right). The observation time along the Falcon 20 flight aircraft does not have a rectilinear trajectory and passes
path is indicated by the coloured data points (scale on the bottom). over the same location several times. In particular, Fig. 4
The circle, square, star and triangle markers indicate the aircraft’s shows that RASTA collected data at the same location at
altitude (see legend). Arrows represent the wind direction from the 06:30 and at 07:00 UTC. In such a case, all data are as-
CTRLIOP7 analysis at 06:00 UTC at approximately 4 km of altitude similated as if they were equally valid at the assimilation
(model level 30). time T (06:00 UTC here). This overpass explains why the
RASTAIOP7 IOP7
3 h and the RASTA2 h are slightly different from
IOP7
the RASTA1 h experiment at 06:30 UTC, in terms of both
experiment assimilates RASTA wind data until 07:00 UTC direction and speed. Similarly, there is an overpass of the air-
(07:30 UTC) as if they were valid at 06:00 UTC. craft at 06:15 and at 07:20 UTC. At this location, while the
The observation time along the aircraft flight path is repre- RASTAIOP72h and the RASTAIOP7 1h experiments only assimi-
sented by the coloured data points in Fig. 4. Figure 4 shows late the data available at 06:15 UTC, the RASTAIOP7 3 h experi-
that data were mainly collected in the area where the band ment also assimilates the data collected at 07:20 UTC. How-
of rainfall was located, over the Ardèche and the Gard de- ever, the wind has increased between 06:00 and 07:30 UTC.
partments. In particular, most of the data that are assimilated Hence, the RASTAIOP7 3 h experiment exhibits higher velocity
at the 06:00 UTC analysis (before an observation time of at 06:15 UTC and a different direction (panels e and j) at ap-
07:30 UTC) are located upwind of where the rainfall event proximately 10 km of altitude, compared to the RASTAIOP7 1h
Nat. Hazards Earth Syst. Sci., 19, 821–835, 2019 www.nat-hazards-earth-syst-sci.net/19/821/2019/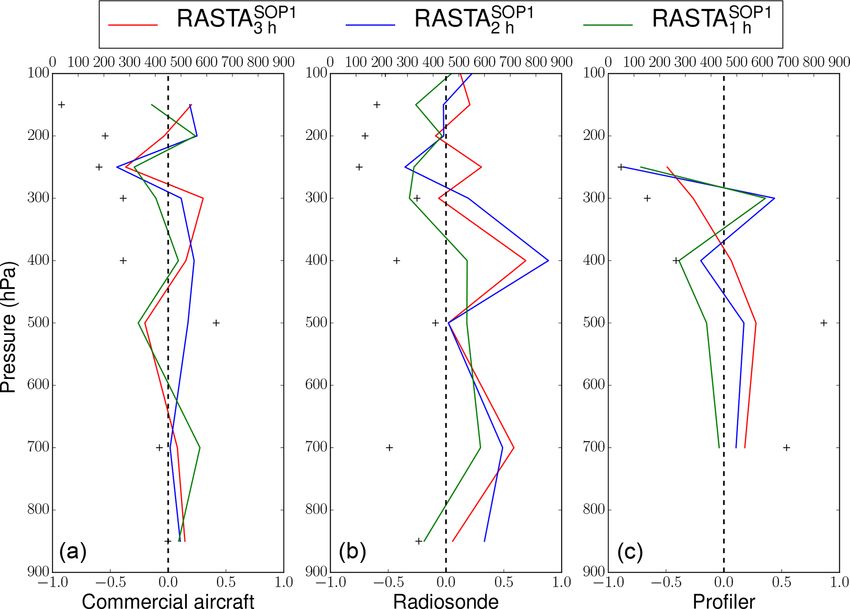
M. Borderies et al.: Assimilation of wind data from airborne Doppler cloud-profiling radar 827
Figure 5. Wind speed (a–e) and wind direction (f–j) for (a, f) the observations, (b, g) the CTRLIOP7 , (c, h) the RASTAIOP7
1 h , (d, i) the
IOP7 IOP7
RASTA2 h and (e, j) the RASTA3 h 06:00 UTC analyses on 26 September 2012 (IOP7a). The three different assimilation windows 1t
are delimited by the vertical lines. The aircraft’s altitude above sea level is represented by the black line.
(panels c and h) and the RASTAIOP7
2 h (panels d and i) experi- pact on the analysis since the increments can reach a value
ments. of approximately 12 m s−1 . The same behaviour is also seen
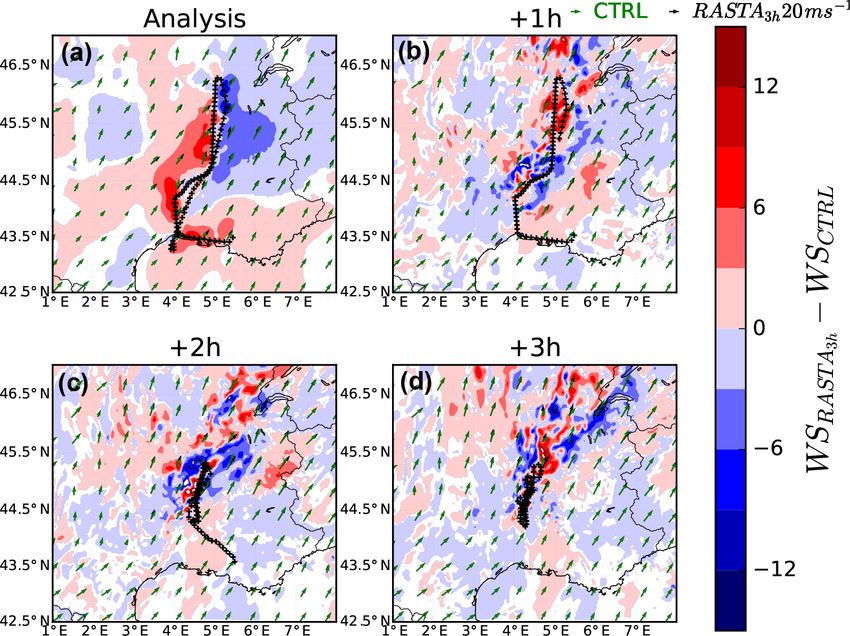
Figure 6a represents the wind speed increments at ap- when RASTA wind data are assimilated with smaller assim-
proximately 4 km of altitude (model level 30) between the ilation windows (1t = 2 h and 1t = 1 h, not shown).
RASTAIOP73h and the CTRLIOP7 analysis. Wind directions
are also indicated by the green (or black) arrows for the 5.3 Verification against RASTA observations
CTRLIOP7 (or RASTAIOP7 3 h ) analysis. The data points assimi-
lated in the RASTAIOP7
3 h experiment until 07:30 UTC are also
Figure 6 (panels b to d) represents the wind speed differences
represented by the black data points. As expected, the anal- of the RASTAIOP7
3 h 1, 2 and 3 h forecasts and the CTRL
IOP7
ysis increments are well localized around the aircraft flight ones. At each forecast term, the black data points indicate
path. The assimilation of RASTA wind data has a large im- the different RASTA locations which are available during a
1 h time window centred on the forecast time (forecast term
www.nat-hazards-earth-syst-sci.net/19/821/2019/ Nat. Hazards Earth Syst. Sci., 19, 821–835, 2019828 M. Borderies et al.: Assimilation of wind data from airborne Doppler cloud-profiling radar
Figure 6. Wind increments between the RASTAIOP73 h and the CTRL
IOP7 experiments for the analysis at 06:00 UTC and for the 1, 2 and 3 h
forecasts at 07:00, 08:00 and 09:00 UTC on 26 September 2012 (IOP7a) at approximately 4 km of altitude (model level 30). The black data
points represent the location of RASTA data within a 1 h time window centred on the forecast term range.
±30 min). Figure 6 shows that, even though the increments
are less organized as the forecast term increases, there is a
noticeable impact of the assimilation of RASTA wind data
on the subsequent forecasts at 07:00, 08:00 and 09:00 UTC.
Besides, some of the most substantial differences are co-
located with RASTA locations (black data points in Fig. 6)
and downstream of these locations.
Figure 7 represents the standard deviation of the wind
speed differences between RASTA observations and each ex-
periment as a function of the forecast term. The standard de-
viations were calculated using all the data available within
a 1 h time window centred on the forecast time (black data
points in Fig. 6). For instance, at 07:00 UTC, the 1 h forecast
of each experiment is compared with the observations avail-
able between 06:30 and 07:30 UTC. Similarly, at 08:00 UTC
(09:00 UTC), the 2 h (3 h) forecast of each experiment are
compared with the observations available between 07:30 and
08:30 UTC (08:30 and 09:30 UTC).
As expected, the major differences between the differ-
ent experiments appear on the analyses. The smallest stan-
dard deviation value is reached with the RASTAIOP7 1 h exper-
iment. Indeed, compared to the CTRL, the standard devia-
Figure 7. Standard deviation of the wind differences between
tion of the wind speed has been reduced by a value close RASTA observations and each experiment (see legend) as a func-
to 1.5 m s−1 . At the analysis time, the standard deviation tion of the forecast term from the 06:00 UTC analysis on 26 Septem-
values were calculated using the observations that were as- ber 2012 (IOP7a).
similated at the 06:00 UTC analysis in the RASTAIOP7 1 h ex-
periment (06:00 UTC + 30 min). As explained in the previ-
ous section, because of the non-rectilinear trajectory of the
Nat. Hazards Earth Syst. Sci., 19, 821–835, 2019 www.nat-hazards-earth-syst-sci.net/19/821/2019/M. Borderies et al.: Assimilation of wind data from airborne Doppler cloud-profiling radar 829
Figure 8. Maps of 11 h accumulated rainfall between 07:00 and 18:00 UTC on 26 September 2012 (IOP7a) for radar observations, the
CTRLIOP7 , RASTAIOP7 IOP7 IOP7
3 h , RASTA2 h , RASTA1 h experiments.
aircraft, the different RASTA analyses are slightly differ- accumulation has been removed from the calculations. Fig-
ent. These differences explain why, when the comparison is ure 8 shows the 11 h accumulated rainfall between 07:00 and
performed against the observations which are available un- 18:00 UTC on 26 September 2012 (IOP7a) for the radar ob-
til 06:30 UTC, the standard deviation increases with the in- servations, CTRLIOP7 , the RASTAIOP7 IOP7
1 h , the RASTA2 h and
creasing length of the assimilation window. Nevertheless, in IOP7
the RASTA3 h experiments.
all three RASTA experiments, the standard deviation is al- In all experiments, the predicted rainfall accumulation
ways reduced in the analyses when RASTA observations are patterns match the observations well. However, the maxi-
assimilated. mum rainfall accumulation is much larger in the CTRLIOP7
At 2 and 3 h term ranges, compared to the CTRLIOP7 , the experiment (114 mm) than the observed one (76 mm). The
assimilation of RASTA wind data leads to a systematic im- RASTAIOP73 h experiment is in much better agreement with the
provement in the standard deviation in the three RASTA ex- observations since the maximum rainfall accumulation has
periments. By contrast, at 1 h term range, results indicate been reduced to a value close to 102 mm. The assimilation
a negative impact of the assimilation of RASTA wind data of RASTA wind data with smaller assimilation windows (2
since the three RASTA experiments exhibit larger standard and 3 h) does not significantly impact the rainfall forecasts.
deviation values. However, this negative impact should be Indeed, the maximum rainfall accumulation is of same order
taken cautiously since there are numerical noises and im- of magnitude in the RASTAIOP7 2 h (113 mm) and RASTA1 h
IOP7
balances in the first 2 h of integration due to spin-up in the experiments (116 mm), compared to the CTRLIOP7 one.
AROME-WMED system (Seity et al., 2011). The results in Fig. 8 indicate a sensitivity to the choice of
Finally, Fig. 7 demonstrates the benefit brought by the as- the assimilation windows. In particular, the best experiment
similation of RASTA wind data. Except at a 1 h term range, is the one for which RASTA observations are assimilated
probably because of spin-up, there is an improvement in the with the larger assimilation window (RASTAIOP7 3 h ). There-
predicted wind speed at all forecast term ranges. Nonethe- fore, in this specific case study, the rainfall accumulation
less, it is hard to rank the different RASTA experiments. forecasts are closer to the observations when more data are
Similar results were also obtained in another case, which oc- assimilated, even though some of them might no longer be
curred over sea on 11 October 2012 (not shown). valid at the assimilation time. This result can also be ex-
plained by the fact that horizontal wind components in mod-
5.4 Impact on rainfall forecasts erately convective clouds are more representative of synoptic
scales and less likely to change as quickly as other meteoro-
The impact of the assimilation of RASTA wind data at logical variables, such as humidity. However, this result may
06:00 UTC is now illustrated on rainfall accumulation fore-
casts. To avoid the spin-up problem, the first hour of rainfall
www.nat-hazards-earth-syst-sci.net/19/821/2019/ Nat. Hazards Earth Syst. Sci., 19, 821–835, 2019830 M. Borderies et al.: Assimilation of wind data from airborne Doppler cloud-profiling radar
be only representative of this specific case study and should available in the area of interest. The comparison with ground-
be taken cautiously. based radar data gives similar results (not shown).
6.2 Impact on rainfall forecasts
6 Statistical study Forecast scores against rainfall measurements are now
calculated over the 35 runs (out of 360) in which
The impact of RASTA wind data assimilation is now as- RASTA data were assimilated with the largest assimi-
sessed over the 45-day cycled period during the HyMeX lation window. The verification is conducted using the
SOP1. Verification is first carried out against other assimi- rain gauge network available from the HyMeX database
lated observations types in Sect. 6.1. Verification is then per- (https://doi.org/10.6096/MISTRALS-HyMeX.904), the lo-
formed against rain gauges observations in Sect. 6.2. cations of which are indicated by the blue markers in Fig. 1.
For the comparisons, model outputs are interpolated to the
6.1 Comparison against conventional observations rain gauge station locations using a linear interpolation.
Model outputs and rain gauge measurements are then aver-
Averaged over the 45-day experiment, the assimilation of aged in boxes of 0.25◦ × 0.25◦ within each RASTA-limited
RASTA wind data does not substantially impact the specific validation area.
humidity and the temperature on both the analyses and the Categorical scores have been calculated: Heidke skill
forecasts. Therefore, because the most significant differences score (HSS), probability of detection (POD) and false alarm
only appear on the zonal (u) and meridional (v) wind com- ratio (FAR). To avoid the spin-up problem, the first hour of
ponents, results are only shown for the wind. Calculations rainfall accumulation has been removed from the calcula-
are not shown for the analyses but only for the 3 h forecasts. tions. The HSS, POD and FAR of the 8 h accumulated rain-
Indeed, since the observations used for the comparisons are fall forecasts for the three RASTA experiments are displayed
all assimilated, the fit to observations is better in CTRLSOP1 in red in Fig. 10 as a function of the rainfall accumulation
than in the RASTA experimental runs. threshold (mm). The scores of the CTRLSOP1 experiment are
Because RASTA wind data are limited in space around also shown in black. The bootstrap confidence intervals are
the Mediterranean area (see black lines in Fig. 1) and de- displayed for each threshold by the dashed lines. The impact
pend on the presence of cloud or precipitation along the air- of the assimilation of RASTA wind data is positive if the red
craft flight path, their assimilation impact is also limited in lines are above (below) the black ones for the HSS and POD
space. Hence, at each assimilation time, a RASTA-limited (FAR).
validation area is employed. It contains the aircraft flight Figure 10 shows that the general pattern is similar for the
path ±0.5◦ both in latitude and longitude. Only the con- three RASTA experiments, which indicates that the choice
ventional observations (commercial aircraft data, radiosonde of the assimilation window does not significantly impact
and profiler) which are available in the RASTA-limited area the subsequent forecasts. Even though the bootstrap confi-
are used for the calculations. Since the assimilation impact dence intervals increase with the threshold, differences with
of RASTA wind data is also limited in time, calculations the CTRLSOP1 experiment are more pronounced at larger
are only performed over the 35 runs in which RASTA wind thresholds in any of the three RASTA experiments. The
data were assimilated with the largest assimilation window. most significant differences appear for the RASTASOP1 3h and
Figure 9 shows the differences in standard deviation error RASTASOP12h experiments, which is consistent with the re-
for 3 h wind forecasts between the CTRLSOP1 experiment sults found for the IOP7a case study in Sect. 5.4. In addition,
and the RASTASOP1 (red), the RASTASOP1 (blue) and the except for the RASTASOP1 1h experiment, the assimilation of
3h 2h
SOP1
RASTA1 h (green) experiments. Negative (positive) differ- RASTA wind data tends to slightly improve the scores above
ences indicate a positive (negative) impact of the assimilation approximately 10 mm.
of RASTA wind data. The total number of observations used It should be noted that this slight positive improvement
for the calculation is represented by the black plus signs in of the heavier rainfall can also be seen for the 5 and 11 h
the top x axis. forecasts (not shown). Finally, the benefit brought by the as-
In general, Fig. 9 indicates that the impact of the assim- similation of RASTA wind data decreases with the forecast
ilation of RASTA wind data on the 3 h forecasts is hard to term range (≥ 11 h forecasts), which is partly explained by
assess. Indeed, compared to commercial aircraft wind obser- the lateral boundary conditions. Indeed, after a few hours,
vations (left panel), the vertical profiles of the standard de- the increments are replaced by inputs from the same coupling
viation demonstrate a neutral impact. However, compared to model.
radiosonde (middle panel) and profiler (right panel) observa-
tions, there is a slight positive to negative impact depending
on the assimilation window, which is probably a deluding
effect due to the small number of conventional observations
Nat. Hazards Earth Syst. Sci., 19, 821–835, 2019 www.nat-hazards-earth-syst-sci.net/19/821/2019/M. Borderies et al.: Assimilation of wind data from airborne Doppler cloud-profiling radar 831
Figure 9. Differences of standard deviation error for 3 h wind forecasts between the CTRLCOP1 experiment and the RASTASOP1 3h (red), the
RASTASOP12h (blue) and the RASTA SOP1 (green) experiments. Negative differences indicate a positive impact of the assimilation of RASTA
1h
wind data. The standard deviation errors are computed for commercial aircraft (a), radiosonde (b) and profiler (c) observations. All the scores
are computed over the 35 runs in which RASTA wind data were assimilated with the largest assimilation window over the RASTA-limited
area. In each panel, the number of observations used for the calculation is represented by the black data plus signs in the top x axis.
7 Discussions and conclusions The positive impact of the assimilation of RASTA wind
data was first evidenced in a case of heavy rainfall, which
This article reports on the first study in which vertical occurred during the Intensive Observation Period 7a (IOP7a)
profiles of wind measured by vertically pointing airborne on 26 September 2012. This case study was selected because
Doppler W-band radar are assimilated in a kilometre-scale the data that are assimilated at the 06:00 UTC analysis are
NWP model. The study was performed in a quasi-operational located upwind from where the heavy rainfall took place.
framework with a special version of the Météo-France oper- Such a configuration is required to study a potential impact
ational kilometre-scale model AROME with its 3DVAR as- of the assimilation of RASTA wind data on the subsequent
similation system. The data were provided by the airborne forecasts. Except at very short-term range (1 h) because of
Doppler W-band radar RASTA during a 45-day period over spin-up, the assimilation of RASTA wind data led to a sys-
a region of the Mediterranean area that is very prone to heavy tematic improvement of the predicted wind at all short-term
rainfall. RASTA is a multibeam antenna system that can re- ranges (2 and 3 h) in any of the three RASTA experiments. It
trieve the three components of the wind fields, which allows could be interesting to repeat the same study with the more
the direct assimilation of the retrieved horizontal wind com- recent operational AROME system because the model spin-
ponents. up has been reduced to less than 1 h (Brousseau et al., 2016).
A sensitivity study for the choice of the assimilation win- Besides, the 11 h accumulated rainfall forecasts are also in
dow was performed. Indeed, RASTA wind data are not mea- much better agreement with the observations. Therefore, this
sured simultaneously at the assimilation time but over the case study demonstrates a positive impact of the assimila-
flight leg. Consequently, at the assimilation time T , the tion of RASTA wind data to better predict this rainfall event.
3DVAR assimilation system of AROME-WMED ingests all Similar results were also obtained for another case which oc-
data available along the aircraft path during the assimilation curred over sea on 11 November 2012 (not shown in this
window 1t , as if they were valid at time T . Therefore, the article).
ability of RASTA wind data to improve short-term forecasts A cycling data assimilation experiment has also been con-
of heavy precipitation events was tested with three different ducted over a 45-day period from 24 October to 5 Novem-
assimilation windows 1t : 3 h (RASTA3 h ), 2 h (RASTA2 h ) ber 2012, for the CTRL experiment and for the three
and 1 h (RASTA1 h ). RASTA data assimilation experiments. The comparisons
www.nat-hazards-earth-syst-sci.net/19/821/2019/ Nat. Hazards Earth Syst. Sci., 19, 821–835, 2019832 M. Borderies et al.: Assimilation of wind data from airborne Doppler cloud-profiling radar Figure 10. HSS (a, b, c), POD (d, e, f) and FAR (g, h, i) of the 8 h cumulated precipitation forecasts vs. rain gauge measurements for the three RASTA experiments (in red) and for the CTRLSOP1 experiment (in black). Calculations were performed over the 35 runs in which RASTA wind data were assimilated with the largest assimilation window. The error bars (dashed lines) represent the 90 % bias-corrected and accelerated (BCa) bootstrap confidence intervals (see Efron and Tibshirani, 1993). against other assimilated observations and rain gauges mea- should be explored over other field campaigns to corroborate surements indicate an overall neutral impact, which is prob- the results of this sensitivity study. Besides, the issue of the ably due to the small percentage of RASTA wind data which length of the assimilation window becomes less important were assimilated among the total number of observations. if the assimilation frequency increases and/or a shorter as- Nevertheless, results of this statistical study are encouraging similation cycle is used, such as in the new AROME system since no major detrimental effect was found and a slight pos- (Brousseau et al., 2016). itive improvement in the 5, 8 and 11 h precipitation forecasts It is probable that low-quality data did pass the quality of heavier rainfall was evidenced. control and were thus assimilated. Zhang et al. (2012) show The sensitivity study to the assimilation window on the the importance of specifying a strong data quality control. IOP7 case study and on the statistical study suggested that Hence, a more efficient data quality control should improve the quality of the rainfall accumulation forecasts increases our results. Finally, another perspective is to assimilate the with the length of the assimilation window. Hence, it seems W-band radar reflectivity jointly with RASTA wind data to preferable to assimilate more data to have larger coverage find out whether modifying the thermodynamic and the dy- by increasing the length of the assimilation window. How- namic state of the model in a consistent way in the ini- ever, results should be taken cautiously since the sensitivity tial state would lead to more significant improvements. In- study was only conducted over 35 analysis cases. More cases deed, Janisková (2015) demonstrated a slight positive im- Nat. Hazards Earth Syst. Sci., 19, 821–835, 2019 www.nat-hazards-earth-syst-sci.net/19/821/2019/
M. Borderies et al.: Assimilation of wind data from airborne Doppler cloud-profiling radar                                               833

pact of the assimilation of W-band space-borne radar us-                 the Global Observing System, B. Am. Meteorol. Soc., 95, 543–
ing a 1D+4DVAR technique. The 1D+3DVAR assimilation                      564, https://doi.org/10.1175/BAMS-D-12-00164.1, 2014.
method that is operationally used to assimilate the radar re-          Benjamin, S. G., Schwartz, B. E., Szoke, E. J., and Koch, S. E.: The
flectivity in AROME (Caumont et al., 2010; Wattrelot et al.,             Value of Wind Profiler Data in U.S. Weather Forecasting, B. Am.
2014) will be employed to assimilate the W-band reflectivity.            Meteorol. Soc., 85, 1871–1886, https://doi.org/10.1175/BAMS-
                                                                         85-12-1871, 2004.
                                                                       Borderies, M., Caumont, O., Augros, C., Bresson, É., Delanoë,
                                                                         J., Ducrocq, V., Fourrié, N., Le Bastard, T., and Nuret, M.:
Data availability. RASTA data and rain gauge data are all avail-
                                                                         Simulation of W-band radar reflectivity for model validation
able from the HyMeX database (https://doi.org/10.17616/R3M34X;
                                                                         and data assimilation, Q. J. Roy. Meteor. Soc., 144, 391–403,
re3data.org, 2018). The simulation data that support the findings of
                                                                         https://doi.org/10.1002/qj.3210, 2018.
this study are available from the corresponding author on reasonable
                                                                       Bosart, B. L., Lee, W.-C., and Wakimoto, R. M.: Procedures to im-
request.
                                                                         prove the accuracy of airborne Doppler radar data, J. Atmos.
                                                                         Ocean. Tech., 19, 322–339, https://doi.org/10.1175/1520-0426-
                                                                         19.3.322, 2002.
Author contributions. This work was carried out by MB as part          Bouniol, D., Protat, A., Plana-Fattori, A., Giraud, M., Vinson, J.-
of her PhD thesis under the supervision of VD and OC. JD pro-            P., and Grand, N.: Comparison of Airborne and Spaceborne 95-
cessed and provided RASTA data. NF provided the files and set            GHz Radar Reflectivities and Evaluation of Multiple Scattering
up that are necessary to run the different assimilation experiments      Effects in Spaceborne Measurements, J. Atmos. Ocean. Tech.,
with AROME-WMED. All co-authors collaborated, interpreted the            25, 1983–1995, https://doi.org/10.1175/2008jtecha1011.1, 2008.
results, wrote the paper and replied to the comments from the re-      Bousquet, O., Delanoë, J., and Bielli, S.: Evaluation of 3D wind
viewers.                                                                 observations inferred from the analysis of airborne and ground-
                                                                         based radars during HyMeX SOP-1, Q. J. Roy. Meteor. Soc., 142,
                                                                         86–94, https://doi.org/10.1002/qj.2710, 2016.
Competing interests. The authors declare that they have no conflict    Brousseau, P., Berre, L., Bouttier, F., and Desroziers, G.:
of interest.                                                             Background-error covariances for a convective-scale data-
                                                                         assimilation system: AROME-France 3D-Var, Q. J. Roy. Meteor.
                                                                         Soc., 137, 409–422, https://doi.org/10.1002/qj.750, 2011.
Special issue statement. This article is part of the spe-              Brousseau, P., Seity, Y., Ricard, D., and Léger, J.: Improve-
cial issue “Hydrological cycle in the Mediterranean                      ment of the forecast of convective activity from the AROME-
(ACP/AMT/GMD/HESS/NHESS/OS inter-journal SI)”. It is                     France system, Q. J. Roy. Meteor. Soc., 142, 2231–2243,
not associated with a conference.                                        https://doi.org/10.1002/qj.2822, 2016.
                                                                       Caumont, O., Ducrocq, V., Wattrelot, É., Jaubert, G., and
                                                                         Pradier-Vabre, S.: 1D+3DVar assimilation of radar reflec-
Acknowledgements. This work is a contribution to the HyMeX               tivity data: a proof of concept, Tellus A, 62, 173–187,
programme supported by MISTRALS, ANR IODA-MED grant                      https://doi.org/10.1111/j.1600-0870.2009.00430.x, 2010.
ANR-11-BS56-0005 and ANR MUSIC grant ANR-14-CE01-                      Deb, S., Kishtawal, C., Kumar, P., Kumar, A. K., Pal, P., Kaushik,
0014. This work was supported by the French national pro-                N., and Sangar, G.: Atmospheric Motion Vectors from INSAT-
gramme LEFE/INSU. The authors acknowledge the DGA (Direc-                3D: Initial quality assessment and its impact on track fore-
tion Générale de l’Armement), a part of the French Ministry of De-       cast of cyclonic storm NANAUK, Atmos. Res., 169, 1–16,
fense, for its contribution to Mary Borderies’s PhD. The authors         https://doi.org/10.1016/j.atmosres.2015.09.010, 2016.
thank SAFIRE for operating the French Falcon 20 research aircraft      Delanoë, J., Protat, A., Jourdan, O., Pelon, J., Papazzoni, M.,
during HyMeX-SOP1. The authors are grateful to Pierre Brousseau          Dupuy, R., Gayet, J.-F., and Jouan, C.: Comparison of Air-
for his technical help. Two anonymous reviewers are also gratefully      borne In Situ, Airborne Radar–Lidar, and Spaceborne Radar–
acknowledged for their comments, which helped to significantly im-       Lidar Retrievals of Polar Ice Cloud Properties Sampled during
prove the quality of the article.                                        the POLARCAT Campaign, J. Atmos. Ocean. Tech., 30, 57–73,
                                                                         https://doi.org/10.1175/JTECH-D-11-00200.1, 2013.
                                                                       Drobinski, P., Ducrocq, V., Alpert, P., Anagnostou, E., Béranger, K.,
                                                                         Borga, M., Braud, I., Chanzy, A., Davolio, S., Delrieu, G., Es-
Review statement. This paper was edited by Eric Martin and re-
                                                                         tournel, C., Boubrahmi, N. F., Font, J., Grubišic, V., Gualdi, S.,
viewed by two anonymous referees.
                                                                         Homar, V., Ivancan-Picek, B., Kottmeier, C., Kotroni, V., Lagou-
                                                                         vardos, K., Lionello, P., Llasat, M. C., Ludwig, W., Lutoff, C.,
                                                                         Mariotti, A., Richard, E., Romero, R., Rotunno, R., Roussot, O.,
References                                                               Ruin, I., Somot, S., Taupier-Letage, I., Tintore, J., Uijlenhoet, R.,
                                                                         and Wernli, H.: HyMeX: A 10-year multidisciplinary program on
Baker, W. E., Atlas, R., Cardinali, C., Clement, A., Emmitt, G. D.,      the Mediterranean water cycle, B. Am. Meteorol. Soc., 95, 1063–
  Gentry, B. M., Hardesty, R. M., Källén, E., Kavaya, M. J., Lang-       1082, https://doi.org/10.1175/BAMS-D-12-00242.1, 2014.
  land, R., Ma, Z., Masutani, M., McCarty, W., Pierce, R. B., Pu,      Ducrocq, V., Braud, I., Davolio, S., Ferretti, R., Flamant, C., Jansa,
  Z., Riishojgaard, L. P., Ryan, J., Tucker, S., Weissmann, M., and      A., Kalthoff, N., Richard, E., Taupier-Letage, I., Ayral, P., Be-
  Yoe, J. G.: Lidar-Measured Wind Profiles: The Missing Link in

www.nat-hazards-earth-syst-sci.net/19/821/2019/                                  Nat. Hazards Earth Syst. Sci., 19, 821–835, 2019
834 M. Borderies et al.: Assimilation of wind data from airborne Doppler cloud-profiling radar
lamari, S., Berne, A., Borga, M., Boudevillain, B., Bock, O., Precipitation, and Radiation, B. Am. Meteorol. Soc., 96, 1311–
Boichard, J., Bouin, M., Bousquet, O., Bouvier, C., Chiggiato, 1332, https://doi.org/10.1175/bams-d-12-00227.1, 2015a.
J., Cimini, D., Corsmeier, U., Coppola, L., Cocquerez, P., Defer, Illingworth, A. J., Cimini, D., Gaffard, C., Haeffelin, M., Lehmann,
E., Delanoë, J., Di Girolamo, P., Doerenbecher, A., Drobinski, V., Löhnert, U., O’Connor, E. J., and Ruffieux, D.: Exploiting
P., Dufournet, Y., Fourrié, N., Gourley, J. J., Labatut, L., Lam- existing ground-based remote sensing networks to improve high-
bert, D., Le Coz, J., Marzano, F. S., Molinié, G., Montani, A., resolution weather forecasts, B. Am. Meteorol. Soc., 96, 2107–
Nord, G., Nuret, M., Ramage, K., Rison, W., Roussot, O., Said, 2125, https://doi.org/10.1175/bams-d-13-00283.1, 2015b.
F., Schwarzenboeck, A., Testor, P., Van Baelen, J., Vincendon, Janisková, M.: Assimilation of cloud information from space-
B., Aran, M., and Tamayo, J.: HyMeX-SOP1: The field cam- borne radar and lidar: experimental study using a 1D+4D-
paign dedicated to heavy precipitation and flash flooding in the Var technique, Q. J. Roy. Meteor. Soc., 141, 2708–2725,
northwestern Mediterranean, B. Am. Meteorol. Soc., 95, 1083– https://doi.org/10.1002/qj.2558, 2015.
1100, https://doi.org/10.1175/BAMS-D-12-00244.1, 2014. Kawabata, T., Seko, H., Saito, K., Kuroda, T., Tamiya, K.,
Duffourg, F., Nuissier, O., Ducrocq, V., Flamant, C., Chazette, P., Tsuyuki, T., Honda, Y., and Wakazuki, Y.: An Assimilation and
Delanoë, J., Doerenbecher, A., Fourrié, N., Di Girolamo, P., Lac, Forecasting Experiment of the Nerima Heavy Rainfa11 with
C., Legain, D., Martinet, M., Saïd, F., and Bock, O.: Offshore a Cloud-Resolving Nonhydrostatic 4-Dimensional Variational
deep convection initiation and maintenance during the HyMeX Data Assimilation System, J. Meteorol. Soc. Jpn., 85, 255–276,
IOP 16a heavy precipitation event, Q. J. Roy. Meteor. Soc., 142, https://doi.org/10.2151/jmsj.85.255, 2007.
259–274, https://doi.org/10.1002/qj.2725, 2016. Kawabata, T., Iwai, H., Seko, H., Shoji, Y., Saito, K., Ishii,
Efron, B. and Tibshirani, R. J.: An Introduction to the S., and Mizutani, K.: Cloud-Resolving 4D-Var Assimila-
Bootstrap, Chapman & Hall/CRC Press, Boca Raton, FL, tion of Doppler Wind Lidar Data on a Meso-Gamma-Scale
ISBN 9780412042317, 456 pp., 1994. Convective System, Mon. Weather Rev., 142, 4484–4498,
Fischer, C., Montmerle, T., Berre, L., Auger, L., and Şte- https://doi.org/10.1175/MWR-D-13-00362.1, 2014.
fănescu, S. E.: An overview of the variational assimila- Kumar, P., Deb, S. K., Kishtawal, C., and Pal, P.: Impact of
tion in the ALADIN/France numerical weather-prediction assimilation of INSAT-3D retrieved atmospheric motion vec-
system, Q. J. Roy. Meteor. Soc., 131, 3477–3492, tors on short-range forecast of summer monsoon 2014 over
https://doi.org/10.1256/qj.05.115, 2005. the south Asian region, Theor. Appl. Climatol., 128, 575–586,
Fourrié, N., Bresson, é., Nuret, M., Jany, C., Brousseau, P., Do- https://doi.org/10.1007/s00704-015-1722-5, 2017.
erenbecher, A., Kreitz, M., Nuissier, O., Sevault, E., Béni- Li, Z., Pu, Z., Sun, J., and Lee, W.-C.: Impacts of 4DVAR assimi-
chou, H., Amodei, M., and Pouponneau, F.: AROME-WMED, lation of airborne Doppler radar observations on numerical sim-
a real-time mesoscale model designed for the HyMeX spe- ulations of the genesis of Typhoon Nuri (2008), J. Appl. Meteo-
cial observation periods, Geosci. Model Dev., 8, 1919–1941, rol. Clim., 53, 2325–2343, https://doi.org/10.1175/JAMC-D-14-
https://doi.org/10.5194/gmd-8-1919-2015, 2015. 0046.1, 2014.
Hally, A., Richard, E., and Ducrocq, V.: An ensemble study Martinet, M., Nuissier, O., Duffourg, F., Ducrocq, V., and Ri-
of HyMeX IOP6 and IOP7a: sensitivity to physical and ini- card, D.: Fine-scale numerical analysis of the sensitivity of
tial and boundary condition uncertainties, Nat. Hazards Earth the HyMeX IOP16a heavy precipitating event to the turbulent
Syst. Sci., 14, 1071–1084, https://doi.org/10.5194/nhess-14- mixing-length parametrization, Q. J. Roy. Meteor. Soc., 143,
1071-2014, 2014. 3122–3135, https://doi.org/10.1002/qj.3167, 2017.
Horányi, A., Cardinali, C., Rennie, M., and Isaksen, L.: The as- Montmerle, T. and Faccani, C.: Mesoscale assimilation of
similation of horizontal line-of-sight wind information into the radial velocities from Doppler radars in a preopera-
ECMWF data assimilation and forecasting system. Part I: The tional framework, Mon. Weather Rev., 137, 1939–1953,
assessment of wind impact, Q. J. Roy. Meteor. Soc., 141, 1223– https://doi.org/10.1175/2008MWR2725.1, 2009.
1232, https://doi.org/10.1002/qj.2430, 2015. Pinty, J. and Jabouille, P.: A mixed-phase cloud parameterization for
Illingworth, A., Battaglia, A., Bradford, J., Forsythe, M., Joe, use in mesoscale non-hydrostatic model: simulations of a squall
P., Kollias, P., Lean, K., Lori, M., Mahfouf, J.-F., Mello, S., line and of orographic precipitations, in: Conf. on Cloud Physics,
Midthassel, R., Munro, Y., Nicol, J., Potthast, R., Rennie, 217–220, Amer. Meteor. Soc Everett, WA, 1998.
M., Stein, T., Tanelli, S., Tridon, F., Walden, C., and Wolde, Protat, A., Bouniol, D., Delanoë, J., O’Connor, E., May, P.,
M.: WIVERN: A new satellite concept to provide global in- Plana-Fattori, A., Hasson, A., Görsdorf, U., and Heymsfield,
cloud winds, precipitation and cloud properties, B. Am. Mete- A.: Assessment of CloudSat reflectivity measurements and
orol. Soc., 99, 1669–1687, https://doi.org/10.1175/BAMS-D-16- ice cloud properties using ground-based and airborne cloud
0047.1, 2018. radar observations, J. Atmos. Ocean. Tech., 26, 1717–1741,
Illingworth, A. J., Barker, H. W., Beljaars, A., Ceccaldi, M., Chep- https://doi.org/10.1175/2009JTECHA1246.1, 2009.
fer, H., Clerbaux, N., Cole, J., Delanoë, J., Domenech, C., Dono- Pu, Z., Li, X., and Sun, J.: Impact of airborne Doppler radar data
van, D. P., Fukuda, S., Hirakata, M., Hogan, R. J., Huener- assimilation on the numerical simulation of intensity changes of
bein, A., Kollias, P., Kubota, T., Nakajima, T., Nakajima, T. Y., Hurricane Dennis near a landfall, J. Atmos. Sci., 66, 3351–3365,
Nishizawa, T., Ohno, Y., Okamoto, H., Oki, R., Sato, K., Satoh, https://doi.org/10.1175/2009JAS3121.1, 2009.
M., Shephard, M. W., Velázquez-Blázquez, A., Wandinger, U., re3data.org: HyMeX, re3data.org – Registry of Research Data
Wehr, T., and van Zadelhoff, G.: The EarthCARE Satellite: The Repositories, https://doi.org/10.17616/R3M34X, 2018.
Next Step Forward in Global Measurements of Clouds, Aerosols, Rennie, S. J., Dance, S. L., Illingworth, A. J., Ballard, S. P.,
and Simonin, D.: 3D-Var Assimilation of Insect-Derived
Nat. Hazards Earth Syst. Sci., 19, 821–835, 2019 www.nat-hazards-earth-syst-sci.net/19/821/2019/You can also read