Influence of uncertain identification of triggering rainfall on the assessment of landslide early warning thresholds - NHESS
←
→
Page content transcription
If your browser does not render page correctly, please read the page content below
Nat. Hazards Earth Syst. Sci., 18, 633–646, 2018
https://doi.org/10.5194/nhess-18-633-2018
© Author(s) 2018. This work is distributed under
the Creative Commons Attribution 4.0 License.

Influence of uncertain identification of triggering rainfall on the
assessment of landslide early warning thresholds
David J. Peres1 , Antonino Cancelliere1 , Roberto Greco2 , and Thom A. Bogaard3
1 Department of Civil Engineering and Architecture, University of Catania, Catania, Italy
2 Dipartimento di Ingegneria Civile Design Edilizia e Ambiente, Università degli Studi della
Campania Luigi Vanvitelli, Aversa (CE), Italy
3 Water Resources Section, Faculty of Civil Engineering and Geosciences,

Delft University of Technology, Delft, the Netherlands

Correspondence: David J. Peres (djperes@dica.unict.it)

Received: 11 September 2017 – Discussion started: 13 September 2017
Revised: 16 January 2018 – Accepted: 19 January 2018 – Published: 1 March 2018

Abstract. Uncertainty in rainfall datasets and landslide in-      1   Introduction
ventories is known to have negative impacts on the assess-
ment of landslide-triggering thresholds. In this paper, we        Thresholds estimating rainfall conditions correlated to land-
perform a quantitative analysis of the impacts of uncertain       slide occurrence are useful for landslide early warning sys-
knowledge of landslide initiation instants on the assessment      tems (Guzzetti et al., 2007; Highland and Bobrowsky, 2008;
of rainfall intensity–duration landslide early warning thresh-    Sidle and Ochiai, 2013). Commonly, thresholds are derived
olds. The analysis is based on a synthetic database of rainfall   by empirical approaches based on the direct statistical anal-
and landslide information, generated by coupling a stochas-       ysis of historical rainfall series and landslide inventories,
tic rainfall generator and a physically based hydrological and    from which a line roughly separating triggering from non-
slope stability model, and is therefore error-free in terms of    triggering conditions is drawn. Among the various thresholds
knowledge of triggering instants. This dataset is then per-       types, precipitation intensity–duration power law thresholds
turbed according to hypothetical “reporting scenarios” that       (hereafter referred to as ID thresholds), introduced by Caine
allow simulation of possible errors in landslide-triggering in-   (1980), have been derived for many regions of the Earth and
stants as retrieved from historical archives. The impact of       are still considered as a valid empirical model (Caracciolo et
these errors is analysed jointly using different criteria to      al., 2017; Gariano et al., 2015; Peruccacci et al., 2017; Ven-
single out rainfall events from a continuous series and two       nari et al., 2014), though they are affected by several theoret-
typical temporal aggregations of rainfall (hourly and daily).     ical and practical limitations (Bogaard and Greco, 2018).
The analysis shows that the impacts of the above uncertainty         Thresholds derived for different geographical areas vary
sources can be significant, especially when errors exceed 1       significantly, and some attempts have been made to find
day or the actual instants follow the erroneous ones. Errors      a rationale underlying this variability by linking thresh-
generally lead to underestimated thresholds, i.e. lower than      old parameters to physio-geographical and climatic features
those that would be obtained from an error-free dataset. Po-      (Guzzetti et al., 2007, 2008). Nevertheless, rainfall and land-
tentially, the amount of the underestimation can be enough to     slide data quality issues, reported in almost all of the papers
induce an excessive number of false positives, hence limiting     on threshold determination, are known to potentially ham-
possible landslide mitigation benefits. Moreover, the uncer-      per the assessment of this link. As reported in many stud-
tain knowledge of triggering rainfall limits the possibility to   ies, the triggering instants available from real landslide in-
set up links between thresholds and physio-geographical fac-      ventories are imprecise. For instance, Guzzetti et al. (2007,
tors.                                                             2008) reported that in a global database of 2626 landslides,
                                                                  the vast majority (68.2 %) had no explicit information on the
                                                                  date or the time of occurrence of slope failure; for most of

Published by Copernicus Publications on behalf of the European Geosciences Union.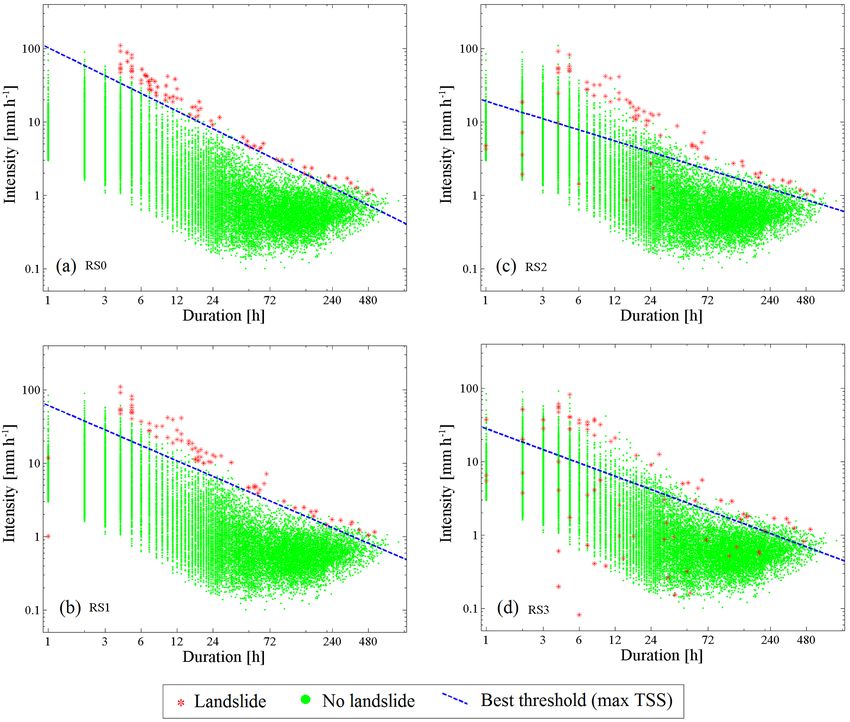
634 D. J. Peres et al.: Landslide early warning thresholds
the remaining events only the date of failure was known,
and more precise information was available for only 5.1 %
of landslides. These issues are confirmed with reference to
an updated dataset of landslides occurred in Italy (Peruccacci
et al., 2017). In their analysis, only information with an ac-
curacy at least of 1 day was retained from the larger avail-
able dataset. Still, for this trimmed dataset, triggering instants
were available with high precision (minute or hour) for only
37.3 % of the data, with the day or part of it available for the
majority (27.6 and 35.1 %, respectively).
Other data artifacts include (i) rainfall measurement delays
related to manual collection of data, (ii) different criteria to
identify rainfall events; (iii) lack of completeness of land-
slide catalogues, and (iv) imprecise location of landslides, or
precipitation measurements available at a significant distance
apart from the location of failure. Though there is general
agreement that these factors affect the accuracy of landslide-
triggering thresholds, a quantification of their influence has
only partially been carried out in the literature. In particular,
to the authors knowledge, only the effect of rain gauge loca-
tion and of the density of rainfall networks (point iv) has been
analysed (Nikolopoulos et al., 2014), showing that the use of
rainfall measured at some distance from debris flow location
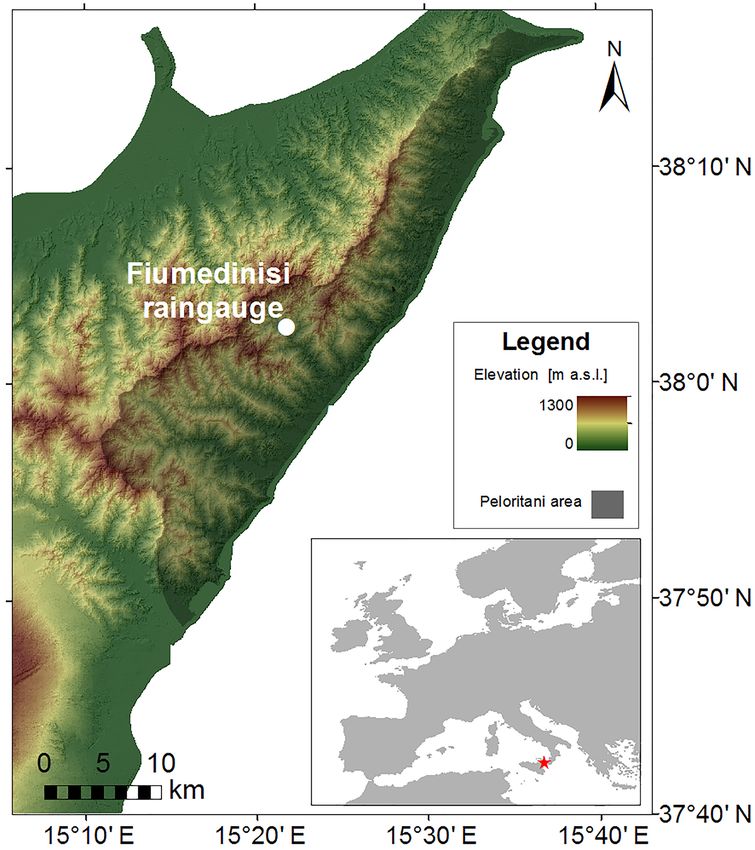
can lead to an underestimation of the triggering thresholds. Figure 1. Location of the Peloritani Mountains area in Sicily, Italy,
Quantitative assessments of the influence of the sources of and of the Fiumedinisi rain gauge.
errors listed above are difficult to be based on observational
datasets, since it cannot be ensured that these are immune of
errors. In this paper we capitalize on the synthetic rainfall– 2 Dataset: generation of synthetic rainfall and
landslide dataset of a preceding study (Peres and Cancelliere, landslide data
2014), to quantify the effects of the imprecise identification
of triggering rainfall on the assessment and performances We refer to the dataset developed in Peres and Cancelliere
of landslide-triggering thresholds. The dataset is in princi- (2014). Here we provide a basic description of the method-
ple “error-free” in the sense that the instants of landslide- ology used for its generation, which includes the following
triggering are exactly known, as well as the triggering rain- steps:
fall time history. We then fictitiously introduce errors in the – Synthetic generation of hourly rainfall time series:
triggering instants and in the rainfall series based on hypo- a seasonal Neyman–Scott rectangular pulses (NSRP)
thetical scenarios of landslide data retrieval and analysis, and stochastic rainfall model (Cowpertwait et al., 1996;
analyse the implications on the accuracy of ID thresholds. Rodríguez-Iturbe et al., 1987a, b) is used for the gen-
The quality of information available in real datasets is gen- eration of 1000 years of hourly rainfall data. The model
erally intermediate of that corresponding to the hypothesized is calibrated on approximately 9 years of hourly obser-
scenarios. These scenarios are combined with different crite- vations from the Fiumedinisi rain gauge located in the
ria for event rainfall identification, and different aggregations area (Fig. 1).
of rainfall data (hourly and daily, and daily in the presence of
a shift due to manual collection of data), so the effects of – Computation of hillslope pressure-head response: a
these other two sources of uncertainty are analysed as well two-state hydrological model is used for the computa-
(items i and ii of the above list). The synthetic data used for tion of pressure head. State 1 and 2 are activated sep-
our analyses are based on characteristic for hillslopes in the arately during rainfall events and during no-rain inter-
landslide-prone region of Peloritani Mountains, in northeast- vals, respectively. Rainfall events are defined as a sec-
ern Sicily, southern Italy. tion of the rainfall series preceded and followed by no
rainfall for a minimum time interval of 24 h. Within
state 1 the TRIGRS-v2 model (Baum et al., 2010)
is applied, which is based on the Richards’ equation
for mono-dimensional vertical infiltration with a Gard-
ner negative exponential soil water characteristic curve.
This is the least simplified form of the Richards’ equa-
Nat. Hazards Earth Syst. Sci., 18, 633–646, 2018 www.nat-hazards-earth-syst-sci.net/18/633/2018/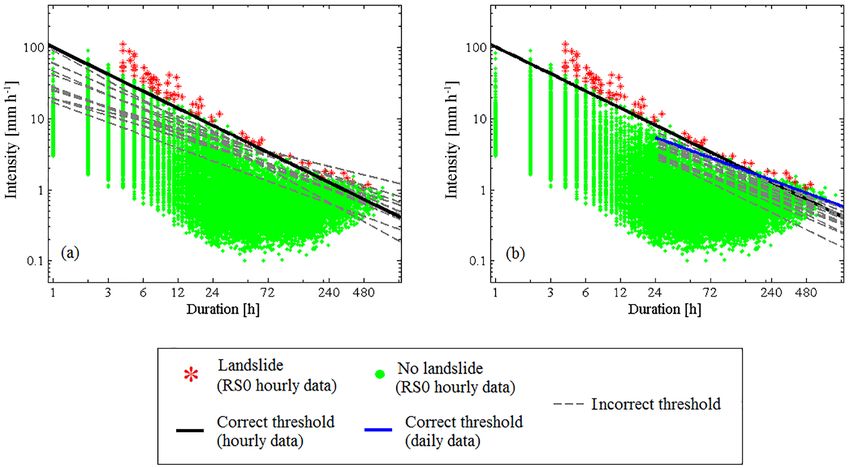
D. J. Peres et al.: Landslide early warning thresholds                                                                                 635

Table 1. Soil and morphological properties of a representative hill-     Table 2. Some characteristics of the ideal Monte Carlo simulation
slope in the Peloritani Mountains area, Sicily, Italy (after Peres and   dataset.
Cancelliere, 2014).
                                                                                 Variable                                     Value
  Variable                                      Units        Value
                                                                                 Number of simulated years                    1000
  Soil friction angle ϕ 0                       ◦                37              Number of rainfall events                   19 826
  Soil cohesion c0                              kPa             5.7              Number of landslide events for τM = 0           81
  Unit weight of soil γs                        N m−3       19 000               (return period)                               12.3
  Saturated soil water content θs               –             0.35               Number of landslide events for τM = 2.75       115
  Residual soil water content θr                –            0.045               (return period)                                 8.7
  Saturated soil hydraulic conductivity KS      m s−1      0.00002
  Saturated soil hydraulic diffusivity D0       m2 s−1     0.00005
  Gardner soil characteristic                   m−1             3.5      et al., 2017). A morphological analysis of the catastrophic
  curve parameter α0 ∗                                                   landslides that occurred on 1 October 2009 has shown that
  Soil depth dLZ                                m                 2
                                                ◦                        a reasonable value of the recession constant for the specific
  Terrain slope δ                                                40
  Basal drainage leakage ratio cD ∗             –               0.1
                                                                         case study area is τM = 2.75 days (Peres and Cancelliere,
                                                                         2014). Nevertheless, for the purposes of this study, we focus
∗ See Baum et al. (2010) for details.                                    our analysis mainly on the hypothetical case of no pressure
                                                                         head memory (τM = 0), so that the main source of uncer-
                                                                         tainty considered in threshold determination is that related
      tion for which an analytical solution has been derived             to identification of triggering rainfall events. In other words,
      so far (Srivastava and Yeh, 1991). A leakage flux at               in the “ideal” simulations described above, the only uncer-
      the soil–bedrock interface is considered, assuming the             tainty present is that of rainfall intra-event intensity variabil-
      vertical hydraulic conductivity of the bedrock strata              ity, which is relatively small, so that a landslide-triggering
      cD = 0.1 times the saturated conductivity KS of the per-           threshold expressed in terms of rainfall duration and intensity
      vious soil layer. Within state 2 a linear reservoir wa-            performs almost perfectly (Peres and Cancelliere, 2014). For
      ter table recession model is activated to simulate sub-            completeness, however, we present a secondary analysis in-
      horizontal drainage and used to compute water table                cluding antecedent rainfall memory with τM = 2.75 days. Ta-
      height at the beginning of the next passage to state 1.            ble 2 shows some characteristics of the 1000-year-long syn-
      A linear reservoir scheme computes a drainage flow                 thetic databases, which do not change among the different
      that depends on the water table level, determining a               scenarios illustrated in the following section.
      negative-exponential decay of pressure head at the bot-
      tom of the regolith layer, with recession constant τM .
  – Derivation of virtual landslide occurrence times: an in-             3     Methodology
    finite slope model to compute the factor of safety FS
    for slope stability is applied. For this schematization,             3.1    Simulation of uncertainty in triggering rainfall
    failure surface coincides with the regolith–bedrock in-                     identification
    terface. The time instants at which a downward crossing
                                                                         As already mentioned, the available triggering instants from
    of FS = 1 occurs are assumed to be the instants at which
                                                                         real landslide inventories are seldom precise. On the other
    landslides are triggered.
                                                                         hand, the instants at which landslides are triggered are known
   The dataset is generated considering soil hydraulic and               exactly (on hourly resolution) for the synthetic series illus-
geotechnical properties shown in Table 1 that can be consid-             trated in previous Sect. 2. We then introduce errors into this
ered representative of hillslopes in the Peloritani Mountains            synthetic dataset by hypothesizing the way such an infor-
landslide-prone area (see Fig. 1). Application to a hillslope            mation may be retrieved from newspapers, and similar re-
of definite characteristics enables us to isolate the impact of          sources (blogs and fire brigade reports), which are the main
triggering rainfall identification uncertainty. Regional deter-          primary sources available to build landslide historical inven-
mination of thresholds also contains factors of uncertainty re-          tories (e.g. Guzzetti and Tonelli, 2004).
lated to the heterogeneity of landslide characteristics. How-               We suppose that only the date of the landslide is reported,
ever, the assessment of this combined uncertainty is out of              with some delay (See Fig. 2). For a landslide to be reported
the scope of our present analysis. The Peloritani area has               on day D, it has to be spotted within a time interval we de-
been affected several times by catastrophic shallow landslide            note as the “observers’ day” D 0 . Then the user of the land-
phenomena in the past, including the 1 October 2009 disas-               slide archive (the analyser), makes an interpretation of the
ter, which has been analysed and described in several studies            available information, i.e. chooses an instant of the reported
(Cama et al., 2017; Schilirò et al., 2015a, b, 2016; Stancanelli         day of landslide occurrence to search backwards for the trig-

www.nat-hazards-earth-syst-sci.net/18/633/2018/                                    Nat. Hazards Earth Syst. Sci., 18, 633–646, 2018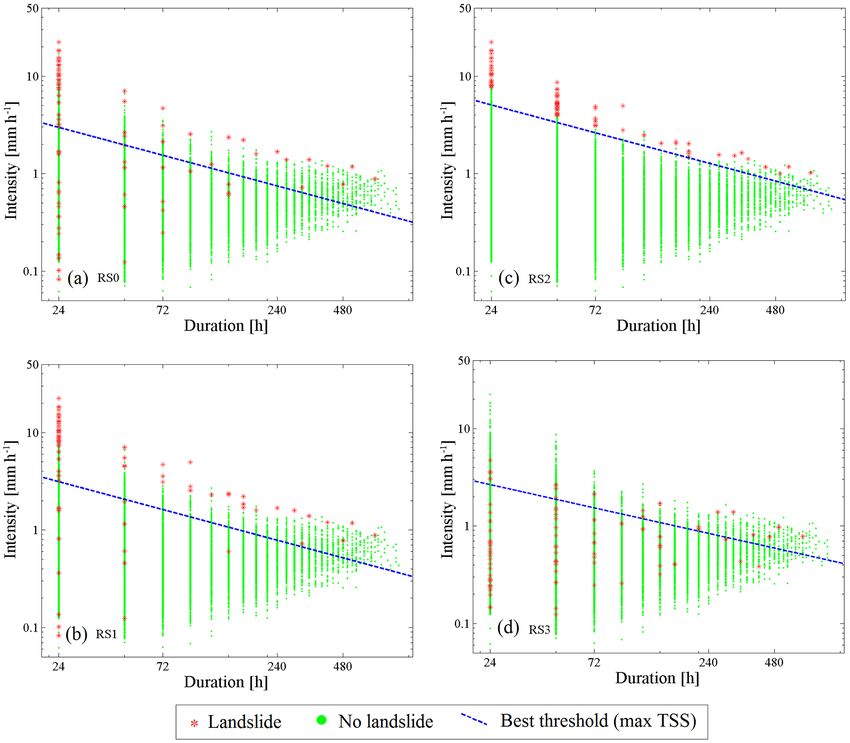
636                                                                              D. J. Peres et al.: Landslide early warning thresholds

                                                                                The two parameters TO and TA can be set to simulate a
                                                                             range of scenarios, for which real situations may represent
                                                                             intermediate cases. We perform our analysis based on four
                                                                             scenarios (which include the “ideal” one), hereafter referred
                                                                             to as landslide information “reporting scenarios” (RS), and
                                                                             illustrated in Fig. 2:

                                                                               – Ideal scenario, RS0 (TO = 0, TA = 0; ei = 0 for all
                                                                                 landslides). This is the error-free scenario (described in
                                                                                 Sect. 2) that is considered for definition of the actual
                                                                                 instants of landslide triggering, ti .
Figure 2. Diagram illustrating simulation of uncertainty in trigger-
ing instants likely present in landslide inventories built from news-          – Small delay reporting, RS1 (TO = 18 h, TA = 24 h; ran-
papers or similar sources. The black numbered circles indicate one               dom in the range 0 ≤ ei ≤ 30 h). A landslide occurring
of the reporting scenarios (RS), which may induce a random error                 within the interval from night hours of D–1 until the
ei = ti0 − ti in landslide-triggering instants. In particular, a landslide
                                                                                 evening of day D (i.e. within the observers’ day D 0 ) will
that occurs within the observers’ day is reported at day D and at-
tributed to the end of the same day (small delay reporting scenario,
                                                                                 be reported at day D. Here we suppose that the analyst
RS1) or to its beginning (anticipated reporting scenario, RS3). It               attributes the landslide at the end of day D (TA = 24 h),
can also be reported at day D + 1 and then attributed to the end of              i.e. searches the triggering event backwards from that
it (large delay reporting scenario RS2). These scenarios can be de-              instant.
scribed in terms of two parameters: TO , the ending hour of the ob-
servers’ day, and TA , the triggering instant, referred to hours 00:00         – Large delay reporting, RS2 (TO = 18 h, TA = 48 h; ran-
of day D, assumed by an analyser who interprets the newspaper-like               dom in the range 0 ≤ ei ≤ 54 h). This scenario is similar
information.                                                                     to the previous, but here larger errors are hypothesized.
                                                                                 We suppose that the landslide occurring during the ob-
                                                                                 servers’ day D 0 is reported on day D + 1, which is also
gering rainfall. In particular, the ith landslide observed at ti                 erroneously assumed by the analyser as the day at which
within the observers’ day D 0 , i.e. hours [TO − 24 h, TO ] of                   the landslide was triggered. The observer then attributes
day D, is assumed by the analyser to be triggered TA hours                       the landslide at the end day D + 1(TA = 48 h). These
after the start of day D (civil day D starts at 00:00). The                      timing errors may also be likely when landslides occur
observer day is made of the hours in which observers can re-                     on weekends.
port a landslide on day D. We assume that the observer day
is given by hours going from 18:00 of day D − 1 to 18:00 of                    – Anticipated reporting, RS3 (TO = 18 h, TA = 0 h; ran-
day D(TO = 18 h); this choice is an attempt to resemble usual                    dom in the range – 18 ≤ ei ≤ 6 h): this case is the same
working hours, and the fact landslides occurring by night                        of RS1, but here the analyst searches backwards for the
may be reported the morning after. The analyser time, TA ,                       triggering event from the beginning of day D, i.e. at
is the instant of landslide triggering as considered by who-                     00:00 (instead of that at 24:00).
ever analyses the data (the “analyser”) to derive landslide-
triggering thresholds, counted from the beginning of day D.                  Within the context of sampling errors, another point is related
This way to process the data introduces a sampling error and                 to the way rainfall data are collected, specifically for daily
a shift between the actual instant at which the generic land-                data manually measured until some decades ago. A signifi-
slide i is triggered, ti , and that assumed by whoever analyses              cant amount of papers derive landslide-triggering thresholds
the data, ti0 . Hence, the error for the ith landslide is given by           using daily rainfall data (Berti et al., 2012; Leonarduzzi et al.,
                                                                             2017; Li et al., 2011; Terlien, 1998). In an ideal situation rain-
ei = ti0 − ti .                                                       (1)    fall intensity should be aggregated from 00:00 to 23:59, i.e.
                                                                             over a civil “calendar day”, as illustrated in Fig. 3. With ref-
These errors are implicitly random, since though ti0 are deter-              erence to manual collection of rainfall data, this requires that
ministically chosen, the actual instant ti varies in an aleatory             rain gauge be read at midnight of each day, which is an un-
fashion according to rainfall time history.                                  comfortable hour. Manual collection of daily data is usually
   A positive error can be in general considered as more                     carried out at easier hours. For instance, in Italy, where the
likely than a negative, since landslides are typically reported              widest source of information is the hydrological bulletins (lo-
some time after they have occurred (Guzzetti et al., 2007,                   cally known as Annali Idrologici), the operator would mea-
2008; Peres and Cancelliere, 2013). This, however, does not                  sure the rainfall collected in the rainfall bucket every day at
exclude the possibility of a significant number of negative                  09:00. Thus, daily rainfall in a given day is the amount of
errors, because of temporal shifts in rainfall data, as will be              rainfall that occurred in the 24 h preceding 09:00 of the same
discussed later.                                                             day. As illustrated in Fig. 3, in this case the reported daily

Nat. Hazards Earth Syst. Sci., 18, 633–646, 2018                                      www.nat-hazards-earth-syst-sci.net/18/633/2018/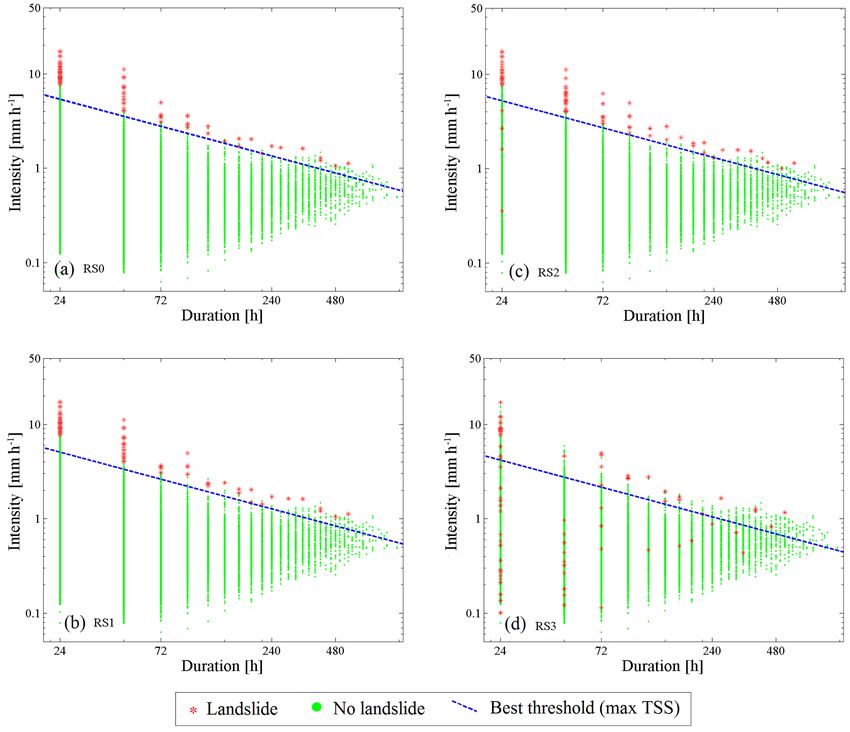
D. J. Peres et al.: Landslide early warning thresholds                                                                                      637

Figure 3. Aggregation of rainfall data from hourly to daily timescale: daily rainfall depths on the top row result from correct aggregation;
those on the bottom row are from shifted aggregation, as occurs for the Italian hydrological bulletins (Annali Idrologici). The shift is due
to manual collection of data in early decades of operation of the monitoring network; the presence of the shift is still continued, in spite of
installation of automatic rain gauges, to preserve homogeneity of the entire historical time series.

Figure 4. Sketch illustrating the algorithm for the identification of triggering and non-triggering rainfall events, and relative parameters smin
and umin . When a landslide is triggered in a dry period, it is attributed to the whole event preceding it; otherwise, only the part of the event
preceding the landslide-triggering instant is considered. For non-triggering rainfall (the first one in the diagram), duration and intensity are
computed considering the entire rainfall event.

rainfall amounts can be dramatically different than the actual             of whether it is associated or not with a landslide. For at-
amounts (see also Caracciolo et al., 2017).                                tributing a rainfall event to a landslide, the cases where the
   Identification of triggering rainfall is uncertain also be-             triggering instant is within a dry or a wet period should be
cause of the different criteria that one can apply to isolate              analysed separately. In the first case, the landslide is associ-
rainfall events from a continuous time series – Table 3 lists              ated with the whole closest event occurring before the land-
a range of criteria adopted in the literature. Here we analyse             slide; in the other case it is associated with the part of the
how the different criteria can impact the identification of trig-          rainfall event occurring before the triggering instant. Auto-
gering rainfall, both in the case that uncertainty in the trig-            matic procedures have the advantage of being objective and
gering instants is present (datasets RS1–RS3) and the case in              reproducible and thus more scientifically sound than subjec-
which it is not (dataset RS0).                                             tive judgement (Melillo et al., 2015; Vessia et al., 2014); nev-
   The automatic procedure we adopt for isolating events is                ertheless, algorithms are suitable to reproduce the latter with
as follows (see diagram in Fig. 4). First, a minimum rain-                 a certain level of fidelity (Berti et al., 2012).
fall threshold smin is applied to all rainfall pulses at the fixed            Finally, triggering rainfall identification uncertainty is
temporal aggregation. This means that from the original se-                simulated by combining the reporting scenarios, different pa-
ries a new one is obtained, where precipitation pulses less                rameters of the rainfall event identification algorithm, and
than smin are replaced by zeros. In the diagram, these pulses              three rainfall aggregation schemes (hourly, daily correct and
are coloured in light grey. Afterwards, rainfall events are sin-           daily shifted). This results in 28 combinations for each reces-
gled out when separated by zero-rain intervals longer than                 sion constant value τM (see Table 4).
umin . This parameter is the most important parameter for
the identification of rainfall events. With the aim of quan-               3.2   Threshold definition, calibration and testing
tifying how the impact of the errors implied by the different                    performance
reporting scenarios changes with rainfall identification crite-
ria, various pairs of smin and umin have been set (see Table 4).           Seventeen different landslide-triggering threshold types
The described algorithm defines the rainfall event regardless              based on rainfall characteristics have been proposed in the
                                                                           literature in the period 1970–2006 (according to the list re-

www.nat-hazards-earth-syst-sci.net/18/633/2018/                                       Nat. Hazards Earth Syst. Sci., 18, 633–646, 2018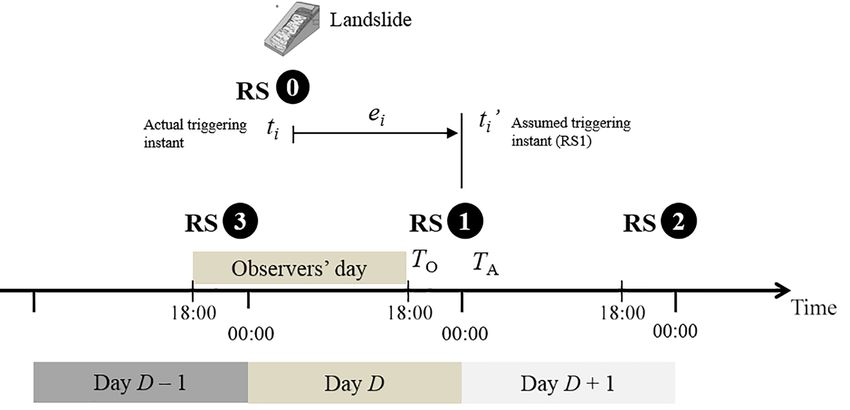
638                                                                                                 D. J. Peres et al.: Landslide early warning thresholds

Table 3. Some rainfall event identification algorithms found in the literature.

               Reference                                Aggregation                                         Algorithm parameters
                                                                             smin                              umin
               Pizziolo et al. (2008)                   daily                5 mm                                1 day
               Berti et al. (2012)1                     daily                2 mm, 1 mm, or 2/3 mm               1 day, 2 days, or 3 days
               Rappelli (2008)                          hourly               1 mm                                12 h
               Melillo et al. (2015);
                                                        hourly               0.2 mm                              3 h, 6 h
               Vessia et al. (2014)2
               Saito et al. (2010)                      hourly               1 mm                                24 h
               Segoni et al. (2014a, b)                 hourly               0                                   umin = 10/36 h selected so that threshold
                                                                                                                 performances were optimized
               Brunetti et al. (2010);
                                                        sub-hourly           0 mm                                2 days (May–Sep), 4 days (Oct–Apr)
               Peruccacci et al. (2017)
               Peres and Cancelliere (2014)             hourly               0.2 mm                              24 h
               Nikolopoulos et al. (2014)               hourly               0.2 mm                              24 h
           1 More precisely “the algorithm scans a rainfall time series and detects the rainfall events using a moving-window technique: a new event starts when the
           precipitation cumulated over DT days exceeds a certain threshold ET , and ends when it goes below this threshold. For instance, if DT = 3 days and
           ET = 2 mm, the rainfall event starts when the cumulative rainfall exceeds 2 mm in 1, 2, or 3 days (that is if 2 mm are exceeded on the first day, the rainfall
           starts at day 1). Then, the rainfall event stops when it rains less than 2 mm in 3 days; the end of the event is defined as the last of the three days in which
           the rainfall is greater than zero”. DT = 3 days and ET = 5 mm were chosen.
           2 The algorithm can be only approximately expressed in terms of s
                                                                                  min and umin . In particular, the algorithm additionally excludes “sub-events” with a
           total event rainfall below a seasonally variable threshold

Table 4. Set-up of the numerical experiments. Each set of algorithm                           time. Earlier works considered lower boundary curves of
parameters is considered for the four hypothesized landslide report-                          the triggering events traced with subjective criteria (Caine,
ing scenarios.                                                                                1980). Then more objective procedures have been then pro-
                                                                                              posed, still based on the triggering events only, such as the
      Aggregation                           Event identification algorithm                    so-called “frequentist” method (e.g. Brunetti et al., 2010).
                                            parameters
                                                                                              More advanced approaches are currently used, and these
      Hourly                                umin = 24 h, smin = 0.2 mm                        are derived from the analysis of both triggering and non-
                                            umin = 12 h, smin = 0.2 mm
                                                                                              triggering events. These procedures are more transparent
                                            umin = 6 h, smin = 0.2 mm
                                                                                              than methods based on triggering events only, as the uncer-
      Daily correct and daily shifted       umin = 1 day, smin = 0 mm                         tainty of the thresholds can be assessed through indices based
      (Italian database)                    umin = 1 day, smin = 5 mm
                                                                                              on the confusion matrix or the receiver-operating character-
                                                                                              istics (ROCs), that is, in terms of the count of true positives
                                                                                              (TP), true negatives (TN), false positives (FP) and false neg-
ported at rainfallthresholds.irpi.cnr.it, last date accessed 15                               atives (FN) (Table 5). More importantly, these methods are
January 2018). In spite of this variety, the most widely used                                 also more robust, since the presence of non-triggering data
threshold is rainfall intensity–duration (ID), as 96 out of                                   points makes the choice of the threshold less sensitive to
125 (about 77 %) thresholds are of this type, if one includes                                 possible errors in the attribution of triggering rainfall event
equivalent rainfall depth–duration (ED) thresholds. There-                                    duration and intensity. Here we use these methods of recent
fore, our analysis adopts this threshold type, which may be                                   application, implicitly assuming that the impact of the un-
defined as follows:                                                                           certainty under analysis is likely to be higher on thresholds
                                                                                              derived from procedures based on triggering rainfall only.
I = αD −β                                                                         (2)
                                                                                                 Best thresholds can be calibrated by maximizing their per-
where I (L T−1 ) is the mean rainfall event intensity, and D                                  formances expressed in terms of suitable metrics. One widely
(T) is the rainfall event duration (both defined according to                                 used metric is true skill statistics (Ciavolella et al., 2016;
scheme of Fig. 4); α, β>0 are respectively the intercept and                                  Peres and Cancelliere, 2014; Staley et al., 2013) originally
slope parameters of the threshold. ED thresholds are equiv-                                   proposed by Peirce (1884):
alent to IDs, since rainfall intensity I is the ratio between                                              TP      FP
event rainfall E (the total depth of a rainfall event) and its                                TSS =             −        .                                                   (3)
                                                                                                         TP + FN TN + FP
duration D; thus, they can be converted into the ID type by
simply subtracting 1 from the exponent of duration.                                           An apparently alternative approach is given by Bayesian
   The procedures for the identification of best threshold pa-                                analysis (Berti et al., 2012). Indeed, this approach can be
rameters have historically increased their complexity over                                    interpreted as a special case of the ROC analysis, since

Nat. Hazards Earth Syst. Sci., 18, 633–646, 2018                                                           www.nat-hazards-earth-syst-sci.net/18/633/2018/
D. J. Peres et al.: Landslide early warning thresholds 639
Table 5. Confusion matrix for evaluation of landslide-triggering thresholds (assumed here to be of the ID type: I = f (D)).
Actual
Landslide No landslide (NEG)
(POS = TP + FN) (NEG = FP + TN)
Predicted Landslide (POS’): I ≥ f (D) true positives, TP false positives, FP
(POS’ = TP + FP)
No landslide (NEG’): I640 D. J. Peres et al.: Landslide early warning thresholds
Figure 5. Scatter plot, in the double-logarithmic rainfall duration–intensity plane, of triggering and non-triggering events for hourly data
and separation algorithm parameters umin = 24 h, smin = 0.2 mm. Thresholds correspond to the maximum performance in terms of true skill
statistic. The plots show outcomes relative to (a) reference RS0, and (b–d) various erroneous reporting scenarios (RS1, RS2, RS3).
threshold corresponds to TSS = 0.49, which reflects the high sates for the smaller intercept α. The effect of anticipating
degree of uncertainty implied by these kinds of data errors. landslide time location (RS3) here also has high impacts on
the thresholds (Fig. 6d).
4.2 Daily data Figure 7 plots the results relative to daily rainfall data af-
fected by a delay in the aggregation interval, as present for
Shallow landslides can be triggered by rainfall events that are instance in Italian datasets, and related to availability of data
only few hours long (Bogaard and Greco, 2016; Highland from non-automatic rain gauges. The impacts of this system-
and Bobrowsky, 2008; Sidle and Ochiai, 2013), and various atic rainfall error can be high (Fig. 7a, b, and d). There is,
studies have shown that the impact of small-scale intra-event however, the possibility that the errors due to rainfall aggre-
rainfall intensity variability can have a significant effect on gation and reporting landslide time interval compensate for
landslide triggering (D’Odorico et al., 2005; Peres and Can- each other, as in the case of scenario RS2 (delayed reporting
celliere, 2014, 2016). Hence, apart from the errors in the of landslides), Fig. 7c (note that this plot is similar to Fig. 6b).
dataset, it is of interest to see how the change from hourly If analysers are aware of the rainfall-aggregation shift, then
to daily data may affect threshold determination. This can be they should correct as much as possible for this error – in this
done by comparing thresholds determined from the hourly specific case by shifting the entire daily rainfall dataset 1 day
and daily datasets. forward.
Figure 6 shows the results of calibration obtained with
correctly aggregated daily rainfall data and smin = 0 and 4.3 Possible effects of rainfall separation criteria and
umin = 1 day. As can be seen from the plots, the impact of antecedent rainfall
delayed reporting of landslides (errors RS1 and RS2) is less
significant than with hourly data. In fact, though α and β are Table 6 shows the results obtained by setting the parameters
lower than those determined from hourly data, the threshold of rainfall event separation algorithms, in the hourly, daily
determined from daily data passes more or less in the same correct, and daily shifted aggregation cases. From the TSS
zone for durations in their range of validity, D>1 day. This values obtained for hourly data, it can be seen that the impact
is because the smaller slope β in the log–log plane compen- of RS1 and RS2 increases with decreasing minimum interar-
Nat. Hazards Earth Syst. Sci., 18, 633–646, 2018 www.nat-hazards-earth-syst-sci.net/18/633/2018/D. J. Peres et al.: Landslide early warning thresholds 641
Figure 6. Scatter plot, in the double-logarithmic rainfall duration–intensity plane, of triggering and non-triggering events for daily data and
separation algorithm parameters umin = 1 day, smin = 0. Thresholds correspond to the maximum performance in terms of true skill statistic.
The plots show outcomes relative to (a) reference RS0 and (b–d) various erroneous reporting scenarios (RS1, RS2, RS3).
Table 6. Threshold calibration results for all simulations, in the case of nulled effects of antecedent precipitation (τM = 0).
RS0 RS1 RS2 RS3
Aggregation umin smin TSS α β TSS α β TSS α β TSS α β
(h) (mm) (mm h−1 ) (mm h−1 ) (mm h−1 ) (mm h−1 )
Hourly 24 0.2 0.99 101 0.80 0.95 61 0.70 0.79 19 0.50 0.49 28 0.60
12 0.2 0.95 60 0.7 0.87 41 0.6 0.69 25 0.5 0.49 47 0.7
6 0.2 0.98 91 0.9 0.73 19 0.4 0.57 27 0.6 0.52 17 0.6
Daily 24 0 0.99 36 0.6 0.99 34 0.6 0.94 35 0.6 0.44 28 0.6
24 5 0.98 60 0.7 0.99 31 0.6 0.9 48 0.7 0.44 27 0.6
Daily (Shifted) 24 0 0.56 20 0.6 0.75 21 0.6 0.99 34 0.6 0.16 13 0.5
24 5 0.54 38 0.8 0.73 62 0.8 0.98 43 0.7 0.14 30 0.7
rival value umin . For RS3, differences obtained with different shorter, and thus it is more likely that a landslide event is
umin are not relevant, since the performances are poor in gen- attributed to only a part of the actual triggering event. In
eral (TSS about 0.5). In the case of daily data, the importance this case the effect of preceding rainfall events cannot be
of different criteria for separating events (values of the mini- neglected in general. In other words, our analysis suggests
mum daily rainfall threshold smin ) is relatively lower than in that the choice of the umin is crucial and must be based on
the hourly data case. Though differences in the TSS are not the timescales of the hydrological processes governing land-
significant, this may not be true for the threshold parameters, slide triggering, in terms of long- and short-term responses
which can vary significantly. In fact, higher thresholds are (Iverson, 2000). This means that the effect of different cri-
obtained from an increase in smin , because of the decrease in teria for rainfall separation is somehow related to that of an-
the number of days counted as rainy. tecedent precipitation. The effects of antecedent precipitation
The behaviour related to hourly data is related to the are specifically taken into account performing Monte Carlo
fact that, by choosing lower umin , events generally become simulations with τM = 2.75 days (results shown in Table 7).
www.nat-hazards-earth-syst-sci.net/18/633/2018/ Nat. Hazards Earth Syst. Sci., 18, 633–646, 2018642 D. J. Peres et al.: Landslide early warning thresholds
Figure 7. Scatter plot, on the double-logarithmic rainfall duration–intensity plane, of triggering and non-triggering events for daily data with
aggregation shift as in the Italian rainfall databases. Separation algorithm parameters are umin = 1 day, smin = 0 mm. Thresholds correspond
to the maximum performance in terms of true skill statistic. The plots show outcomes relative to (a) reference RS0 and (b–d) various
erroneous reporting scenarios (RS1, RS2, RS3).
For this simulation, regardless of the rainfall separation time cific purpose. This might induce modification of the thresh-
interval, the initial water table height measured from the bot- olds in view of the new data, but this is a process whose im-
tom of the soil column is in general greater than zero, becom- plementation may take several years. Hence, with the aim of
ing negligible after a dry interval of 3τM = 3 × 2.75 = 8.5 determining which would be the consequences of building an
days (exponential decay). As can be seen, the results are early warning system with thresholds derived from historical
qualitatively similar to the no-memory case; the main dif- data with errors, Fig. 8 shows a visual comparison between
ference is that lower TSS values are obtained for the added the thresholds determined in the various numerical experi-
uncertainty due to antecedent conditions, and the thresholds ments and the ideal hourly dataset, for results related to the
are lower, since less event rainfall is needed on average to hourly (Fig. 8a) and daily datasets (Fig. 8b). For the sake of
trigger a landslide because of non-zero initial wetness condi- clarity, it may be worthwhile to remember that the dataset of
tions. triggering and non-triggering points has been used in cali-
brating the thresholds only for the RS0 scenario, with hourly
data and umin = 24 h and smin = 0.2 mm (the related thresh-
5 Impact of uncertain identification of triggering old is shown in Fig. 8 as a thick black line). Thus, the other
rainfall on threshold use thresholds are tested against this ideal dataset, which differs
from the one used for their calibration.
Thresholds determined based on historical datasets are then
The plots show that the presence of errors can induce a
meant to be used for early warning systems when, conse-
significant variability of thresholds which is completely un-
quently, more detailed meteorological and landslide monitor-
related to the different characteristics of a site (i.e. the geo-
ing is set up. This means that it is reasonable to hypothesize
morphological, hydraulic, geotechnical and land use charac-
that after thresholds are determined, they are subsequently
teristics). This allows for speculation that a significant part
applied to high-quality datasets, which suffer less from the
of the variability of landslide-triggering thresholds reported
limitations and errors present in datasets used for threshold
in the literature (cf. Guzzetti et al., 2007) may be due to the
calibration, which are generally not conceived for that spe-
Nat. Hazards Earth Syst. Sci., 18, 633–646, 2018 www.nat-hazards-earth-syst-sci.net/18/633/2018/D. J. Peres et al.: Landslide early warning thresholds 643
Table 7. Threshold calibration results for all simulations, when antecedent precipitation memory is present (τM = 2.75 days).
RS0 RS1 RS2 RS3
Aggregation umin smin TSS α β TSS α β TSS α β TSS α β
(h) (mm) (mm h−1 ) (mm h−1 ) (mm h−1 ) (mm h−1 )
Hourly 24 0.2 0.88 45 0.7 0.84 42 0.7 0.73 38 0.7 0.46 28 0.6
12 0.2 0.9 54 0.8 0.81 45 0.7 0.67 17 0.5 0.48 28 0.6
6 0.2 0.91 31 0.6 0.7 29 0.5 0.56 18 0.6 0.51 17 0.6
Daily 24 0 0.91 25 0.6 0.91 25 0.6 0.87 25 0.6 0.47 22 0.6
24 5 0.9 52 0.8 0.9 52 0.8 0.86 24 0.6 0.49 20 0.6
Daily (shifted) 24 0 0.61 21 0.6 0.77 21 0.6 0.9 21 0.6 0.3 9 0.5
24 5 0.6 28 0.7 0.73 40 0.8 0.89 30 0.7 0.29 21 0.7
Figure 8. Comparison of thresholds, calibrated in the various scenarios and event identification parameters, with the correct hourly dataset.
Thresholds determined with (a) hourly and (b) daily data (both correct and with aggregation shift) are distinguished. Correct thresholds are
relative to the following event identification parameters: umin = 24 h, smin = 0.2 mm, and umin = 1 day, smin = 0 mm, for hourly and daily
data, respectively. These plots are representative of how thresholds calibrated with uncertain information of triggering rainfall data may
perform in early warning systems that use high-quality rainfall and landslide monitoring.
sources of uncertainty discussed here. As a consequence, it 6 Conclusions
is challenging to search for links between the variability of
physio-geographical characteristics and that of thresholds, as We have analysed and discussed the possible effects of un-
determined from different sites. certain triggering rainfall identification on the assessment of
The presence of errors in the landslide dataset yields empirical landslide early warning ID thresholds, capitalizing
thresholds that are in general underestimated, i.e. lower than on a synthetic rainfall–landslide dataset generated by Monte
the correct ones. Many thresholds in Fig. 8 are significantly Carlo simulation. To this aim, we have investigated the ef-
lower than the correct ones, and the number of false positives fect of a set of hypothesized scenarios of landslide informa-
can be relatively high and not balanced by true positives. A tion retrieval and interpretation which can induce errors in
good trade-off between correct and wrong predictions is es- the identification of instants of landslide occurrence. More-
sential for the success of an early warning system, since with over, we have analysed how the impact of reasonable sce-
a high number of false alarms the so-called cry-wolf effect narios may vary depending on rainfall aggregation (hourly
may occur, inducing the populations to not take precaution- or daily) and rainfall event identification criteria. Real situa-
ary actions when warnings are issued (Barnes et al., 2007). tions may be a mixture of the considered scenarios, and thus
the impacts are presumably intermediate between the ones
hypothesized.
www.nat-hazards-earth-syst-sci.net/18/633/2018/ Nat. Hazards Earth Syst. Sci., 18, 633–646, 2018644 D. J. Peres et al.: Landslide early warning thresholds
The errors in the time instants can be, in an algebraic monitoring – e.g. rainfall, soil moisture and landslide satel-
sense, positive or negative, according to whether a landslide lite data, as well as landslide data crowdsourcing (Guzzetti et
is reported after its actual occurrence or before, respectively. al., 2012; Strozzi et al., 2013; Wan et al., 2014) – may be a
According to the literature, positive errors are more likely step forward for overcoming these problems. Once accurate
than negative, since a landslide is typically reported some rainfall–landslide data are available, standardized method-
time after its actual occurrence. Our analyses have shown that ologies must be implemented to derive the thresholds in or-
if such errors are limited to less than 30 h (about 1 day), their der to allow their comparisons and to link their variability to
impacts on the threshold may be relatively low; yet if the site-specific landslide susceptibility factors.
delay is higher, impacts can be significant. Negative errors,
though less probable, can also exist, based on how an analyst
interprets the information retrieved from landslide historical Data availability. Rainfall data used for this research are avail-
archives. The impact of these errors can be dramatic, as the able from the Servizio Informativo Agreometeorologico Siciliano
location of triggering events in the logD – logI plane can (SIAS) website (http://www.sias.regione.sicilia.it/, last access: 28
be completely altered. Errors in landslide-triggering instants February 2018).
can lead to triggering events that are shorter than the actual
ones, so that their effect is to induce an incorrect identifi-
Special issue statement. This article is part of the special issue
cation of triggering rainfall for short durations. For higher
“Landslide early warning systems: monitoring systems, rainfall
durations (> 1 day), the location of triggering events seems thresholds, warning models, performance evaluation and risk per-
to be more robust, except when negative errors are present. ception”. It is not associated with a conference.
This behaviour induces a flattening of the ID thresholds (i.e.
a lower slope β) and an underestimation of the position pa-
rameter of the threshold (i.e. a lower intercept α). Acknowledgements. David J. Peres was supported by post-doctoral
The impact of reporting errors can change significantly de- contract on “Studio dei processi idrologici relative a frane superfi-
pending on the algorithm adopted for rainfall event identifi- ciali in un contesto di cambiamenti climatici” (Analysis of landslide
cation. Specifically, a shorter “maximum dryness” interval hydrological processes in a changing climate), at University of
for event separation induces an increase in the impacts of all Catania. Part of the work was developed during his three-month
reporting scenarios. stay as a visiting researcher at the Water Resources Section of
From our analysis no significant impacts seem to be in- TUDelft. The authors thank the two anonymous reviewers for their
duced by the use of daily data; however, it is of fundamental comments, which helped to considerably improve the paper.
importance to check, and correct where possible, for the pres-
Edited by: Luca Piciullo
ence of delays in the rainfall accumulation interval, that is, Reviewed by: two anonymous referees
if precipitation reported for a given day is the total amount
that occurred in a shifted period (e.g. within the 24 h pre-
ceding 09:00 of that day rather than before midnight). Such
a shift affects, for instance, the Italian Hydrological Annual
Reports, which constitute the largest rainfall data collection References
in Italy. The impacts of these shifts are potentially dramatic.
Barnes, L. R., Gruntfest, E. C., Hayden, M. H., Schultz, D. M.,
Overall, the presence of reporting errors in landslide- and Benight, C.: False Alarms and Close Calls: A Conceptual
triggering instants yields underestimated thresholds, making Model of Warning Accuracy, Weather Forecast., 22, 1140–1147,
them less suitable for setting up landslide early warning sys- https://doi.org/10.1175/WAF1031.1, 2007.
tems, as they can lead to a high number of false alarms, gen- Baum, R. L., Godt, J. W., and Savage, W. Z.: Estimating the tim-
erating distrust by populations that are expected to benefit ing and location of shallow rainfall-induced landslides using a
from their implementation. Similar effects have been found model for transient, unsaturated infiltration, J. Geophys. Res.,
as a consequence of rainfall measurement uncertainty on 115, F03013, https://doi.org/10.1029/2009JF001321, 2010.
thresholds (Nikolopoulos et al., 2014). These two sources Berti, M., Martina, M. L. V, Franceschini, S., Pignone, S., Simoni,
of errors – always present in observed datasets – are alone A., and Pizziolo, M.: Probabilistic rainfall thresholds for land-
slide occurrence using a Bayesian approach, J. Geophys. Res.-
enough to generate an uncertainty in threshold assessment
Earth, 117, 1–20, https://doi.org/10.1029/2012JF002367, 2012.
that is of significant magnitude. These results bring us to
Bogaard, T. and Greco, R.: Invited perspectives: Hydrological
the conclusion that the uncertainty inherent in the available perspectives on precipitation intensity-duration thresholds
data can jeopardize the possibility to find a physically based for landslide initiation: proposing hydro-meteorological
rationale underlying the variability of empirical landslide- thresholds, Nat. Hazards Earth Syst. Sci., 18, 31–39,
triggering thresholds across different sites. In other words, https://doi.org/10.5194/nhess-18-31-2018, 2018.
with the quality of current available data, attempts to relate Bogaard, T. A. and Greco, R.: Landslide hydrology: from hydrol-
thresholds to climate and other regional characteristics can ogy to pore pressure, Wiley Interdiscip. Rev. Water, 3, 439–459,
be very difficult. An improvement in landslide and rainfall https://doi.org/10.1002/wat2.1126, 2016.
Nat. Hazards Earth Syst. Sci., 18, 633–646, 2018 www.nat-hazards-earth-syst-sci.net/18/633/2018/D. J. Peres et al.: Landslide early warning thresholds 645 Brunetti, M. T., Peruccacci, S., Rossi, M., Luciani, S., Valigi, D., Leonarduzzi, E., Molnar, P., and McArdell, B. W.: Predictive per- and Guzzetti, F.: Rainfall thresholds for the possible occurrence formance of rainfall thresholds for shallow landslides in Switzer- of landslides in Italy, Nat. Hazards Earth Syst. Sci., 10, 447–458, land from gridded daily data, Water Resour. Res., 53, 6612–6625, https://doi.org/10.5194/nhess-10-447-2010, 2010. https://doi.org/10.1002/2017WR021044, 2017. Caine, N.: The Rainfall Intensity-Duration Control of Shallow Li, C., Ma, T., Zhu, X., and Li, W.: The power-law relationship be- Landslides and Debris Flows, Soc. Swedish Ann. Geogr. Geogr. tween landslide occurrence and rainfall level, Geomorphology, Phys., 62, 23–27, 1980. 130, 221–229, https://doi.org/10.1016/j.geomorph.2011.03.018, Cama, M., Lombardo, L., Conoscenti, C., and Rotigliano, E.: 2011. Improving transferability strategies for debris flow suscep- Melillo, M., Brunetti, M. T., Peruccacci, S., Gariano, S. L., and tibility assessment: Application to the Saponara and Itala Guzzetti, F.: An algorithm for the objective reconstruction of catchments (Messina, Italy), Geomorphology, 288, 52–65, rainfall events responsible for landslides, Landslides, 12, 311– https://doi.org/10.1016/J.GEOMORPH.2017.03.025, 2017. 320, https://doi.org/10.1007/s10346-014-0471-3, 2015. Caracciolo, D., Arnone, E., Lo Conti, F., and Noto, L. V.: Exploiting Murphy, A. H.: The Finley Affair: A Signal Event historical rainfall and landslide data in a spatial database for the in the History of Forecast Verification, Weather derivation of critical rainfall thresholds, Environ. Earth Sci., 76, Forecast., 11, 3–20, https://doi.org/10.1175/1520- 222, https://doi.org/10.1007/s12665-017-6545-5, 2017. 0434(1996)0112.0.CO;2, 1996. Ciavolella, M., Bogaard, T., Gargano, R. and Greco, R.: Is there Nikolopoulos, E. I., Crema, S., Marchi, L., Marra, F., Guzzetti, Predictive Power in Hydrological Catchment Information for Re- F., and Borga, M.: Impact of uncertainty in rainfall es- gional Landslide Hazard Assessment?, Procedia Earth Planet. timation on the identification of rainfall thresholds for Sci., 16, 195–203, https://doi.org/10.1016/j.proeps.2016.10.021, debris flow occurrence, Geomorphology, 221, 286–297, 2016. https://doi.org/10.1016/J.GEOMORPH.2014.06.015, 2014. Cowpertwait, P. S. P., O’Connell, P. E., Metcalfe, A. V., and Peirce, C. S.: The numerical measure of the success predic- Mawdsley, J. A.: Stochastic point process modelling of rain- tions, Science, 4, 453–454, https://doi.org/10.1126/science.ns- fall. I. Single-site fitting and validation, J. Hydrol., 175, 17–46, 4.93.453-a, 1884. https://doi.org/10.1016/S0022-1694(96)80004-7, 1996. Peres, D. J. and Cancelliere, A.: Defining rainfall thresholds for D’Odorico, P., Fagherazzi, S., and Rigon, R.: Potential for lands- early warning of rainfall-triggered landslides: The case of North- liding: Dependence on hyetograph characteristics, J. Geophys. East Sicily, in: Landslide Science and Practice: Global Environ- Res.-Earth, 110, 1–10, https://doi.org/10.1029/2004JF000127, mental Change, vol. 4, edited by: Margottini, C., Canuti, P., and 2005. Sassa, K., 257–263, 2013. Frattini, P., Crosta, G., and Carrara, A.: Techniques for evaluating Peres, D. J. and Cancelliere, A.: Derivation and eval- the performance of landslide susceptibility models, Eng. Geol., uation of landslide-triggering thresholds by a Monte 111, 62–72, https://doi.org/10.1016/j.enggeo.2009.12.004, 2010. Carlo approach, Hydrol. Earth Syst. Sci., 18, 4913-4931, Gariano, S. L., Brunetti, M. T., Iovine, G., Melillo, M., Peruc- https://doi.org/10.5194/hess-18-4913-2014, 2014. cacci, S., Terranova, O., Vennari, C., and Guzzetti, F.: Calibration Peres, D. J. and Cancelliere, A.: Estimating return period of land- and validation of rainfall thresholds for shallow landslide fore- slide triggering by Monte Carlo simulation, J. Hydrol., 541, 256– casting in Sicily, southern Italy, Geomorphology, 228, 653–665, 271, https://doi.org/10.1016/j.jhydrol.2016.03.036, 2016. https://doi.org/10.1016/j.geomorph.2014.10.019, 2015. Peruccacci, S., Brunetti, M. T., Gariano, S. L., Melillo, M., Guzzetti, F. and Tonelli, G.: Information system on hydrolog- Rossi, M., and Guzzetti, F.: Rainfall thresholds for possi- ical and geomorphological catastrophes in Italy (SICI): a ble landslide occurrence in Italy, Geomorphology, 290, 39–57, tool for managing landslide and flood hazards, Nat. Hazards https://doi.org/10.1016/j.geomorph.2017.03.031, 2017. Earth Syst. Sci., 4, 213–232, https://doi.org/10.5194/nhess-4- Pizziolo, M., Del Maschio, L., Gozza, G., and Pignone, S.: Determi- 213-2004, 2004. nazione di soglie pluviometriche per l’innesco di frane in Emilia Guzzetti, F., Peruccacci, S., Rossi, M., and Stark, C. P.: Rain- – Romagna, Geol. dell’Emilia-Romagna, 29, 21–27, 2008. fall thresholds for the initiation of landslides in central Rappelli, F.: Definizione delle soglie pluviometriche d’innesco di and southern Europe, Meteorol. Atmos. Phys., 98, 239–267, frane superficiali e colate torrentizie: accorpamento per aree https://doi.org/10.1007/s00703-007-0262-7, 2007. omogenee, Rapp. per IReR, Milano, 2008. Guzzetti, F., Peruccacci, S., Rossi, M., and Stark, C. P.: The rainfall Rodríguez-Iturbe, I., de Power, B. F., and Valdés, J. B.: intensity-duration control of shallow landslides and debris flows: Rectangular pulses point process models for rainfall: An update, Landslides, 5, 3–17, https://doi.org/10.1007/s10346- Analysis of empirical data, J. Geophys. Res., 92, 9645, 007-0112-1, 2008. https://doi.org/10.1029/JD092iD08p09645, 1987a. Guzzetti, F., Mondini, A. C., Cardinali, M., Fiorucci, F., Santan- Rodríguez-Iturbe, I., Cox, D. R., and Isham, V.: Some Mod- gelo, M. and Chang, K. T.: Landslide inventory maps: New els for Rainfall Based on Stochastic Point Processes, tools for an old problem, Earth-Science Rev., 112, 42–66, Proc. R. Soc. A Math. Phys. Eng. Sci., 410, 269–288, https://doi.org/10.1016/j.earscirev.2012.02.001, 2012. https://doi.org/10.1098/rspa.1987.0039, 1987b. Highland, L. M. and Bobrowsky, P.: The Landslide Handbook – A Saito, H., Nakayama, D., and Matsuyama, H.: Relationship be- Guide to Understanding Landslides, Reston, Virginia, 2008. tween the initiation of a shallow landslide and rainfall intensity- Iverson, R. M.: Landslide triggering by rain infiltration, Water Re- duration thresholds in Japan, Geomorphology, 118, 167–175, sour. Res., 36, 1897–1910, 2000. https://doi.org/10.1016/j.geomorph.2009.12.016, 2010. www.nat-hazards-earth-syst-sci.net/18/633/2018/ Nat. Hazards Earth Syst. Sci., 18, 633–646, 2018
646                                                                          D. J. Peres et al.: Landslide early warning thresholds

Schilirò, L., Esposito, C., and Scarascia Mugnozza, G.: Evalua-         Stancanelli, L. M., Peres, D. J., Cancelliere, A., and Foti, E.: A
   tion of shallow landslide-triggering scenarios through a physi-         combined triggering-propagation modeling approach for the as-
   cally based approach: an example of application in the south-           sessment of rainfall induced debris flow susceptibility, J. Hydrol.,
   ern Messina area (northeastern Sicily, Italy), Nat. Hazards             550, 130–143, https://doi.org/10.1016/j.jhydrol.2017.04.038,
   Earth Syst. Sci., 15, 2091–2109, https://doi.org/10.5194/nhess-         2017.
   15-2091-2015, 2015a.                                                 Stephenson,       D.    B.:    Use     of    the     “Odds      Ratio”
Schilirò, L., De Blasio, F. V., Esposito, C., and Scarascia Mug-           for     Diagnosing       Forecast     Skill,    Weather       Fore-
   nozza, G.: Reconstruction of a destructive debris-flow event            cast.,      15,      221–232,       https://doi.org/10.1175/1520-
   via numerical modeling: The role of valley geometry on flow             0434(2000)0152.0.CO;2, 2000.
   dynamics, Earth Surf. Process. Landforms, 40, 1847–1861,             Strozzi, T., Ambrosi, C., and Raetzo, H.: Interpretation of
   https://doi.org/10.1002/esp.3762, 2015b.                                aerial photographs and satellite SAR interferometry for
Schilirò, L., Montrasio, L., and Scarascia Mugnozza, G.: Prediction        the inventory of landslides, Remote Sens., 5, 2554–2570,
   of shallow landslide occurrence: Validation of a physically-based       https://doi.org/10.3390/rs5052554, 2013.
   approach through a real case study, Sci. Total Environ., 569–570,    Terlien, M. T. J.: The determination of statistical and deterministic
   134–144, https://doi.org/10.1016/j.scitotenv.2016.06.124, 2016.         hydrological landslide-triggering thresholds, Environ. Geol., 35,
Segoni, S., Rosi, A., Rossi, G., Catani, F., and Casagli, N.:              124–130, https://doi.org/10.1007/s002540050299, 1998.
   Analysing the relationship between rainfalls and landslides to de-   Vennari, C., Gariano, S. L., Antronico, L., Brunetti, M. T., Iovine,
   fine a mosaic of triggering thresholds for regional-scale warning       G., Peruccacci, S., Terranova, O., and Guzzetti, F.: Rain-
   systems, 14, 2637–2648, https://doi.org/10.5194/nhess-14-2637-          fall thresholds for shallow landslide occurrence in Calabria,
   2014, 2014a.                                                            southern Italy, Nat. Hazards Earth Syst. Sci., 14, 317–330,
Segoni, S., Rossi, G., Rosi, A., and Catani, F.: Landslides trig-          https://doi.org/10.5194/nhess-14-317-2014, 2014.
   gered by rainfall: A semi-automated procedure to define con-         Vessia, G., Parise, M., Brunetti, M. T., Peruccacci, S., Rossi,
   sistent intensity-duration thresholds, Comput. Geosci., 63, 123–        M., Vennari, C., and Guzzetti, F.: Automated reconstruction of
   131, https://doi.org/10.1016/j.cageo.2013.10.009, 2014b.                rainfall events responsible for shallow landslides, Nat. Hazards
Sidle, R. C. and Ochiai, H.: Landslides: Processes, Prediction, and        Earth Syst. Sci., 14, 2399–2408, https://doi.org/10.5194/nhess-
   Land Use, Water Resources Monograph., 2013.                             14-2399-2014, 2014.
Srivastava, R. and Yeh, T.-C. J.: Analytical solutions for one-         Wan, Z., Hong, Y., Khan, S., Gourley, J., Flamig, Z.,
   dimensional, transient infiltration toward the water table in ho-       Kirschbaum, D., and Tang, G.: A cloud-based global flood
   mogeneous and layered soils, Water Resour. Res., 27, 753–762,           disaster     community      cyber-infrastructure:    Development
   https://doi.org/10.1029/90WR02772, 1991.                                and demonstration, Environ. Model. Softw., 58, 86–94,
Staley, D. M., Kean, J. W., Cannon, S. H., Schmidt, K.                     https://doi.org/10.1016/j.envsoft.2014.04.007, 2014.
   M., and Laber, J. L.: Objective definition of rainfall
   intensity-duration thresholds for the initiation of post-fire de-
   bris flows in southern California, Landslides, 10, 547–562,
   https://doi.org/10.1007/s10346-012-0341-9, 2013.

Nat. Hazards Earth Syst. Sci., 18, 633–646, 2018                                  www.nat-hazards-earth-syst-sci.net/18/633/2018/
You can also read