The Economic Footprint of Homelessness in Metro Denver - Phase One of a Three-Phase Analysis
←
→
Page content transcription
If your browser does not render page correctly, please read the page content below
August 2021

The Economic Footprint of
Homelessness in Metro
Denver
Phase One of a Three-Phase Analysis

Authors: Brenda Dickhoner, Ph.D.
and Lili Valis
Special Thanks
Special thanks to Daniel Griner, Arianne Collopy, and Kelsie Faulds with
University of Colorado Denver’s Inworks for their work to review the economic
analysis methodology and findings of this report. Their insights were valuable in
ensuring the study appropriately estimated the economic footprint of homelessness.

Special thanks to the organizations in the Homeless Leadership Council for
reviewing the expenditure and workforce data.

About the Mike A. Leprino Free Enterprise Fellowship
The Mike A. Leprino Free Enterprise Fellowship was established by Laura Leprino
and Matthew Leprino in honor of the late Mike A. Leprino, who was a pillar in the
Denver community. The son of Italian immigrants, he was a banker, developer and
community servant. Some of the greatest treasures and neighborhoods in our state
were built and funded by Mike. He gave back relentlessly to his state and country,
something that he also instilled in each of his children. No greater defender of free
enterprise and the American dream, Mike is someone who from humble beginnings
built an enviable legacy in Colorado. Thanks to Mike A. Leprino’s legacy, we can all
take a lesson in hard work, the entrepreneurial spirit, and the power of free
enterprise. The Mike A. Leprino Fellowship will focus on issues reflected in the
values and accomplishments of this former pillar of the community.

About the Authors
2021 Mike A. Leprino Free Enterprise Fellow

Brenda Bautsch Dickhoner, Ph.D. has spent the last decade working in
education policy at the national and state level. Most recently, at the Colorado
Department of Education, she developed and implemented policies to ensure all
students have access to a high-quality education. Prior to CDE, Brenda served as an
expert for the Colorado Department of Higher Education on research and policy
related to college access and success. She began her career at the National
Conference of State Legislatures where she advised state legislators in numerous
states on education policy.

Brenda earned a Ph.D. in Public Policy at the University of Colorado Denver School
of Public Affairs and studied political science as an undergraduate at Duke
University.

Lili Valis graduated from the University of Colorado Boulder in 2019 with a B.A. in
Political Science and a minor in Business Administration. She moved to Washington,
D.C. after graduation where she worked in business development. After coming
back to Denver, she joined Common Sense Institute as a Research Analyst before
she will join the United States Air Force through the Officer Training program in
September 2021.

2        August 2021
About Common Sense Institute
Common Sense Institute is a non-partisan research organization dedicated to the
protection and promotion of Colorado’s economy. CSI is at the forefront of
important discussions concerning the future of free enterprise in Colorado and aims
to have an impact on the issues that matter most to Coloradans.

CSI’s mission is to examine the fiscal impacts of policies, initiatives, and proposed
laws so that Coloradans are educated and informed on issues impacting their lives.
CSI employs rigorous research techniques and dynamic modeling to evaluate the
potential impact of these measures on the Colorado economy and individual
opportunity.

Common Sense Institute was founded in 2010 originally as Common Sense Policy
Roundtable. CSI’s founders were a concerned group of business and community
leaders who observed that divisive partisanship was overwhelming policymaking
and believed that sound economic analysis could help Coloradans make fact-based
and common sense decisions.

3        August 2021
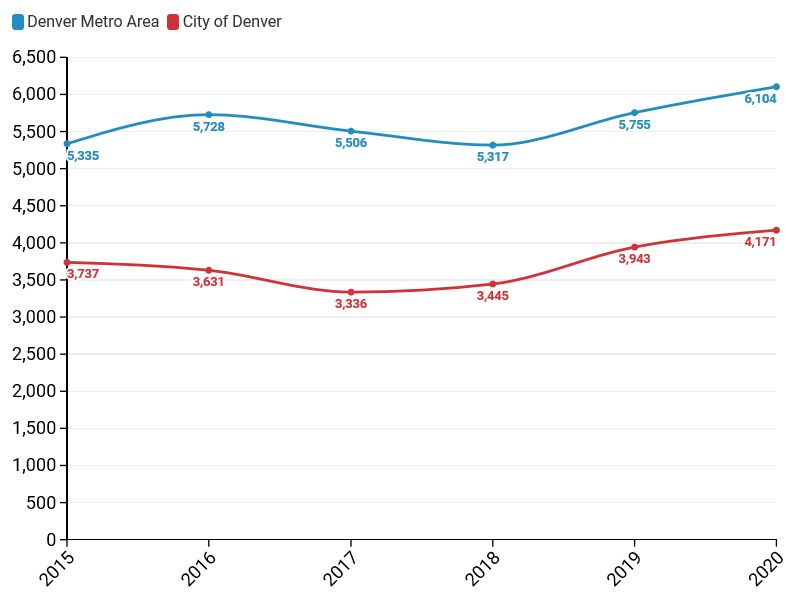
Table of Contents
 Special Thanks ...........................................................................................2
 About the Mike A. Leprino Free Enterprise Fellowship .......................................2
 About the Authors.......................................................................................2
 About Common Sense Institute ....................................................................3
 Introduction ...............................................................................................5
 Project Overview ........................................................................................5
 Key Findings – Phase 1 ................................................................................6
 Homelessness in Metro Denver ................................................................... 10
     Additional Estimates of People Experiencing Homelessness .......................... 14
 Revenue Streams: Homelessness Assistance Programs .................................. 15
     Federal Revenue Streams ....................................................................... 17
     HUD Homelessness Assistance Programs ................................................... 17
     COVID-19 Federal Funding ...................................................................... 19
 Estimated Expenditures Related to Homelessness ......................................... 21
     City of Denver ....................................................................................... 21
     City of Boulder ...................................................................................... 24
     City of Aurora ........................................................................................ 25
     Metro Denver Expenditures ..................................................................... 26
 Workforce Serving People Experiencing Homelessness ................................... 29
 Number of Beds and Units for People Experiencing Homelessness.................... 30
 Conclusion ............................................................................................... 33
 Appendix A: Methodology & Data Notes ....................................................... 34
 Appendix B: Glossary ................................................................................ 35
 Appendix C: Letter from CU Denver Inworks ................................................ 37
 Appendix D: Community Partners ............................................................... 38
 Appendix E: Endnotes ............................................................................... 39
    Appendix F: Expenditures and Workforce Data for Charitable Organizations…... 41

4          August 2021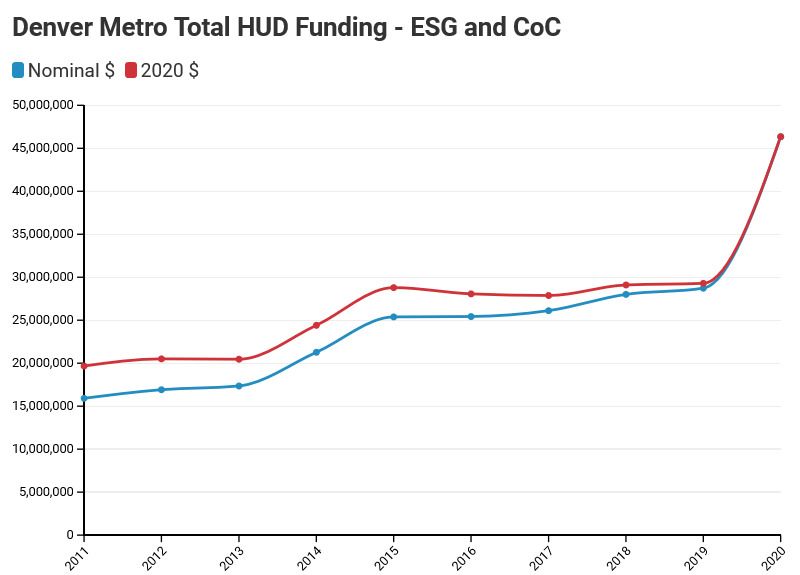
Introduction
Homelessness remains a pressing issue for the Metro Denver region. COVID-19
increased the visibility of the issue with shelters closing due the pandemic and
greater numbers of individuals experiencing homelessness outdoors. Data indicates
that the longer people are unsheltered, the more challenging rehousing becomes.i
Strategies to improve early intervention, rapid rehousing, and permanent
supportive housing are the path forward, as they mitigate the risks to the individual
and society of long-term homelessness. Such strategies must also involve
wraparound services to help some individuals overcome substance abuse, mental
illness, and other trauma. The complexity of the ecosystem surrounding
homelessness and the scarcity of affordable housing in the region makes
implementing these strategies immensely difficult.

Common Sense Institute (CSI) has partnered with several local organizations and
leaders to conduct a three-phase project to understand the many challenges and
types of homelessness. Through a multi-faceted approach, CSI and its partners
hope to identify the systemic issues that contribute to a person’s experience with
homelessness and find the network of people and organizations working to make
change. Bringing clarity and identifying the leverage points in these systems will
support all who seek to tackle this challenge by providing critical information about
where to invest their time, energy, and money to address the homelessness crisis.

Project Overview
Phase 1: Common Sense Institute has partnered with CU Denver, the Downtown
Denver Partnership, Together Denver and other local associations and business
leaders to conduct an economic analysis of the organizations serving individuals
experiencing homelessness within the city of Denver and the broader seven-county
Metro Denver region. The initial phase of the project includes the compilation of
current resources dedicated to the various parts of the homelessness ecosystem for
the purpose of understanding the economic footprint.

Phase 2: In the second phase of the project, CSI is partnering with CU Denver to
engage with the local community and chart drivers and outcomes. We will capture
and map the ways in which each organization impacts various system dynamics. In
addition to providing clarity around the roles of organizations in the ecosystem, this
model will also reveal which factors have outsized impacts and will provide insights
into where additional interventions and investments might address the root causes
of persistent problems and accelerate the positive dynamics within the system.
Through this analysis, CSI and CU Denver will deliver a prioritized set of
recommendations with the goal of maximizing total impact.

Phase 3: CSI and its partners also plan to launch a third phase focused on building
a dynamic online data dashboard that provides data and projections regarding the

5        August 2021
current and future state of homelessness. This dashboard can serve as a continual
touchpoint as the environment changes and will highlight specific areas of needed
focus as they emerge.

This report represents the culmination of the work conducted during Phase 1 of this
project. It is anticipated that Phase 2 and 3 will be released in the early fall of
2021. This report contains several parts: 1) a summary of data on homelessness in
the Metro Denver region; 2) a look at revenue streams that support homelessness
assistance programs; 3) a summary of estimated expenditures spent annually on
shelters, services, emergency response and healthcare for individuals experiencing
homelessness; 4) a look at the workforce and volunteer sector in this ecosystem;
and 5) a summary of data on the availability and utilization of shelter beds.

Key Findings – Phase 1
Homelessness in Metro Denver
      •   The 2020 Point in Time (PIT) count, which provides a snapshot of the
          population experiencing homelessness in the region, counted 6,104
          people experiencing homelessness on Jan. 27, 2020 in Metro Denver
          (covering the counties of Adams, Arapahoe, Boulder, Broomfield, Denver,
          Douglas and Jefferson). 4,171 of those individuals were living within the
          boundaries of the city and county of Denver, representing 68% of the
          region total.ii
      •   The city of Denver saw a 25 percent increase in its homeless population
          between January 2017 and January 2020, and a greater increase is
          expected to be seen because of the devastating impacts of the COVID-19
          pandemic.
             o Due to COVID-19, the 2021 PIT count was not conducted, leaving
                 an unclear picture of how the pandemic has affected the homeless
                 population overall. City of Denver data does show that there was a
                 46% increase in the number of guests at emergency shelters from
                 January 2020 to January 2021.iii
      •   Nearly a quarter of people experiencing homelessness in Metro Denver
          are families with children under 18 (420 families comprising a total of
          1,446 individuals).iv
      •   10 percent of the homeless population in Metro Denver are veterans. v
      •   In Metro Denver, 30 percent of individuals experiencing homelessness
          have a substance abuse concern and 36 percent have a mental health
          concern.
      •   Of those counted in the PIT survey, 22% were newly homeless and 30%
          were chronically homeless.vi

6         August 2021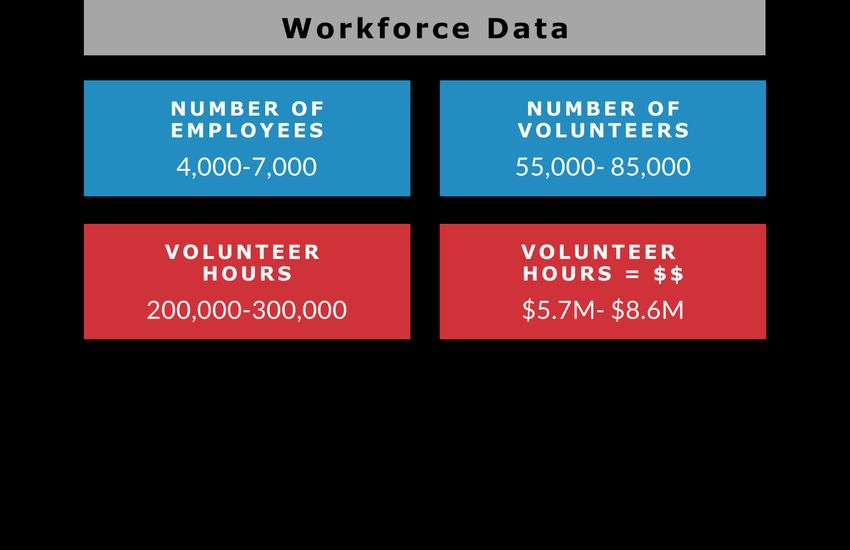
Revenue Streams: Homelessness Assistance Programs
    •   The homelessness ecosystem consists of a complex array of
        organizations, agencies, and funding streams. The U.S. Department of
        Housing and Urban Development (HUD) is the key federal agency working
        on this issue, while states and localities have many different agencies and
        departments working on preventing and resolving homelessness.
    •   In FY 2020, HUD spent $2.777 billion on homelessness assistance
        programs across the country. Of that amount, Colorado received a total of
        $98.3 million across three programs that provide significant support to
        people experiencing homelessness: the Continuum of Care (COC)
        program, the Emergency Solutions Grant (ESG) and the Housing Trust
        Fund (HTF).
           o The CARES Act COVID-19 federal relief package allocated $55.4M
               to the ESG program in 2020; the amount without the CARES Act
               funding for 2020 would have been $42.9 million.
    •   The 2021 American Rescue Plan provided $29.4 million cities and counties
        in Metro Denver for the HOME Investment Partnerships Program.
        According to HUD, these funds are intended to “help communities across
        the country create affordable housing and services for people
        experiencing or at risk of experiencing homelessness.” vii
    •   The state has proposed it will use $550 million in state funds received
        from ARPA for the purpose of affordable housing. It is expected that some
        portion of this will go towards supporting people experiencing
        homelessness.
    •   Lastly, the state-funded Colorado Rescue Plan allocates $15 million to
        hotel rooms for unhoused individuals and $13 million in affordable
        housing projects incentives.viii

Estimated Expenditures: Homelessness Assistance Programs
    •   Within the Metro Denver region, at least $481.2 million is spent annually
        on shelters, services, emergency response and healthcare for individuals
        experiencing homelessness.
           o In comparison, Colorado spends $324.5 million on the statewide
               budget of the Department of Public Safety.
    •   Out of the total estimate of $481.2 million, approximately $434 million is
        spent within the City of Denver, while approximately $15.9 million is
        spent with the City of Boulder and approximately $7.8 million is spent
        within the City of Aurora.
    •   For a population ranging from 4,171 to 10,428, these expenditures
        equate to a range of $41,679 per person to $104,201 per individual
        experiencing homelessness in the City of Denver.

7       August 2021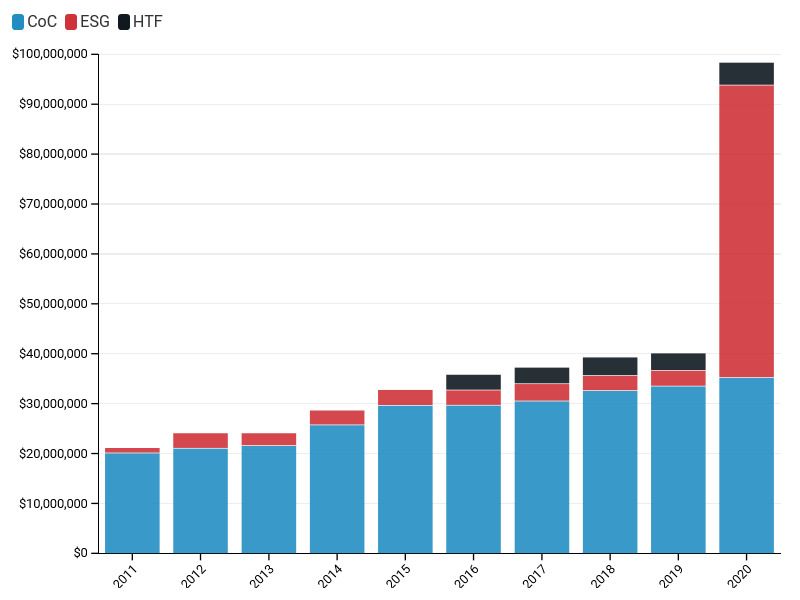
o   In comparison, the per-pupil spending in K-12 schools in Denver
               Public Schools in 2019 was $19,202 for a total school population of
               87,644.
    •   The estimated expenditure amount of $481.2 million does not represent
        the full array of charitable organizations, public agencies, or health care
        and emergency response systems that are dedicated to serving
        individuals experiencing homelessness.
           o This analysis of annual expenditures includes only a partial list of
               municipal agencies engaged on this issue within Denver, Boulder or
               Aurora, and it does not include any city or county agencies in other
               areas of Metro Denver.
           o Although Denver Health costs are included, other regional and local
               hospital and health care costs are not included. For example,
               facilities at the UCHealth Anschutz Medical Campus provide a
               significant amount of uncompensated care to people experiencing
               homeless in Aurora and surrounding communities.ix
           o The estimated $481.2 million in expenditures likely capture some
               revenues flowing from the 2020 Cares Act to organizations in the
               Metro Denver region, given this report focused on FY 2020
               expenditures from charitable organizations. The $481.2 million
               amount, however, does not include COVID-19 federal stimulus
               funding from the American Rescue Plan Act (ARPA), which was
               enacted in March 2021 and provided $29.4 million for the HOME
               Investment Partnerships Program. Additionally, the state has
               proposed to use $550 million of the $3.8 billion in state funds
               received from ARPA for the purpose of affordable housing.x It is
               expected that some portion of this will go towards supporting
               people experiencing homelessness. Colorado has also put state
               funds toward the Colorado Rescue Plan, under which $15 million
               has been allocated to purchasing hotel rooms for unhoused
               individuals and $13 million is allocated for affordable housing
               project incentives.xi

Workforce Serving People Experiencing Homelessness
    •   In Metro Denver, it is estimated that 4,000–7,000 employees work in
        organizations, government agencies, emergency response units or other
        entities that have services or housing dedicated to people experiencing
        homelessness.
    •   The estimated number of volunteers ranges from 55,000 to 85,000 people
        putting in around 200,000–300,000 hours.
    •   The estimated financial value of volunteer hours is $5.7–$8.6 million.

8       August 2021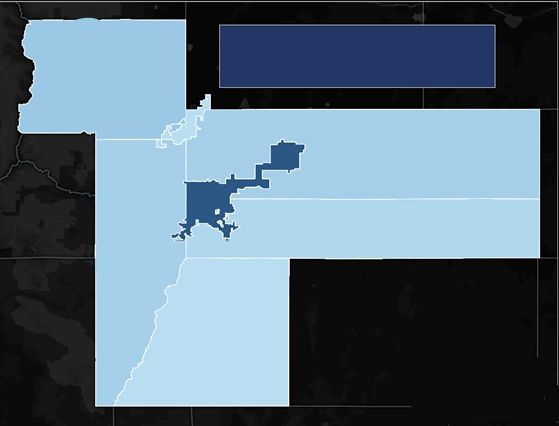
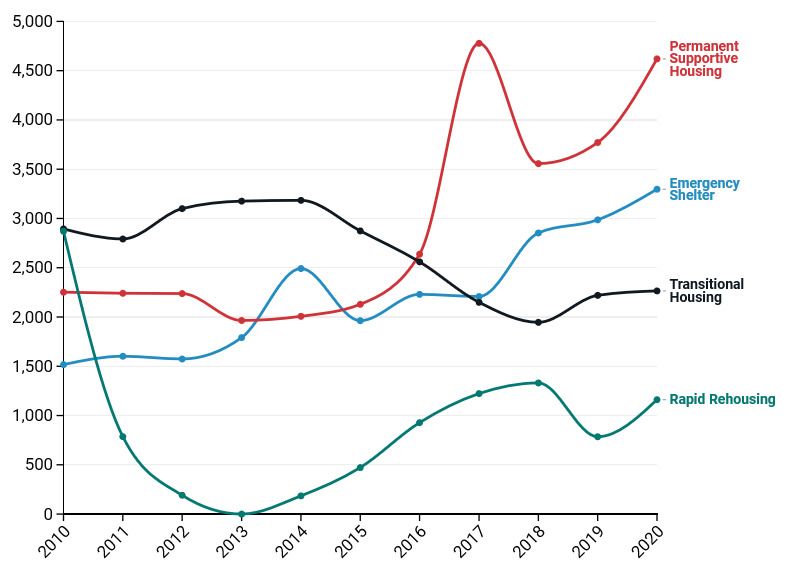
Number of Beds and Units for People Experiencing Homelessness
    •   Over the past 10 years, the number of permanent supportive housing
        beds and emergency shelter beds have increased, while the number of
        transitional housing and rapid rehousing beds have decreased.
    •   Overall, both transitional housing and emergency shelters in Metro
        Denver had beds available during the 2020 Point in Time count.
        Transitional housing was 72 percent occupied and emergencies shelters
        were 82% occupied if including the severe weather beds, or 88%
        occupied if severe weather beds are excluded.xii
           o Data on bed occupancy for permanent supportive housing is not
               available for 2020, but in 2019, there 98 percent of permanent
               supportive housing beds were occupied during the PIT count.xiii
    •   A portion of the available emergency shelter beds are for severe weather
        use only. During extreme weather and emergencies, the City of Denver
        adapts to accommodate people experiencing homelessness. As a city that
        experiences both extreme cold conditions in the winter and hot in the
        summer, Denver has elasticity in the number of shelter beds available.
    •   Additionally, Denver increased the number of shelter beds during the
        onset of the pandemic in spring 2020. The concerted effort to expand the
        availability of beds meant that supply kept pace with, and even, exceeded
        demand as the number of people experiencing homelessness increased
        during COVID-19.xiv

9       August 2021
Homelessness in Metro Denver
The Metro Denver Homeless Initiative (MDHI) conducted a Point in Time (PIT) count
on January 27, 2020, to assess the number of individuals experiencing
homelessness on that night. The count is conducted annually to assess the scope of
homelessness and to provide information to the U.S. Department of Housing and
Urban Development (HUD) for programmatic funding. In the seven-county Metro
Denver region, 6,104 individuals were experiencing homelessness in January
2020.xv Sixty eight percent of these individuals were in the city and county of
Denver (see Figure 1).

Figure 1: Metro Denver Point in Time Count, 2020

     Boulder County
     689                          Total Metro Denver Point in
                                  Time Count, 2020 = 6,104

            Broomfield
            County 26
                            Denver
                            County                    Adams
                            4,171                     County 476

                                                 Arapahoe
             Jefferson                           County 245
             County
             444

                         Douglas             2020 Point in Time Survey
                         County 53
                                             Source: MDHI

In Denver, 4,171 people were identified as experiencing homelessness during the
January 2020 count. The count has been on an upward trend since 2017, with the
number of individuals experiencing homelessness increasing by 25 percent since
that year (see Figure 2).xvi A greater increase in homelessness is expected because
of the devastating impacts of the COVID-19 pandemic. Due to COVID-19, the 2021
PIT count was conducted for housed individuals only, leaving an unclear picture of

10      August 2021
how the pandemic has affected the homeless population overall. City of Denver data does show that there was a 46% increase in the number of guests at emergency shelters from January 2020 to January 2021.xvii Figure 2: Homeless Population Numbers Over Time, PIT Counts Source: U.S. Department of Housing and Urban Development The 2020 Point in Time count also captured data on other individual characteristics and on where everyone slept the night before. Across the Metro Denver region, 48 percent of individuals experiencing homelessness were in emergency shelters (n=2,911), while 26 percent were unsheltered (n=1,632), and 26 percent were in transitional housing (1,561). Denver’s distribution mirrors the regional data. (See the glossary in the appendix for definitions of different housing circumstances.) 11 August 2021
Figure 3: Where People Experiencing Homelessness Stayed in Metro
          Denver, 2020

          Source: MDHI, 2020 PIT.
          Note: Transitional housing includes safe havens.

          Figure 4: Population Experiencing Homeless in Metro Denver, 2020
                                                                                                   Total     % of
                Denver   Adams   Arapahoe   Boulder   Aurora   Broomfield   Douglas   Jefferson   Metro    Total (n=
                                                                                                  Denver    6,104)
  Veterans       479       40       19        53        37         1          0          35        627      10.3%
   Families      247       29       25        55        27         1          7          56        420      24%*
Unaccompanied
 Youth (under    195       14       11        47        18         2          1          8         278      4.5%
   age 25)
   Fleeing
  Domestic       529       35       27        104       35         2          7          55        759      12.4%
  Violence
          Source: MDHI, 2020 PIT
          *420 families comprised of 1,446 individuals makes up 24% of the total PIT count

          Additionally, nearly 10 percent of the homeless population in Metro Denver are
          veterans (see Figure 4). Nearly a quarter of people experiencing homelessness in
          Metro Denver are families with children under 18 (420 families comprising a total of
          1,446 individuals).xviii

          12       August 2021
Thirty percent of the population counted in
the Metro Denver region met the definition Chronic Homelessness
of chronically homeless, while 22 percent People who have experienced
were newly homeless, meaning they had homelessness for at least a year — or
been experiencing homelessness for less repeatedly — while struggling with a
than one year and were experiencing their disabling condition such as a serious
mental illness, substance use disorder,
first episode of homelessness. Other types
or physical disability.
of homelessness include people who are
temporarily experiencing homelessness as
they transition between housing or those who move in and out of homelessness.
In Metro Denver, 30 percent of individuals experiencing homelessness have a
substance abuse concern and 36 percent have a mental health concern.xix
Black/African American and American Indian/Alaskan Native populations are
significantly more likely to be experiencing homelessness than other races. Black
and African American individuals, for example, comprised 23 percent of the
population experiencing homelessness in January 2020, which is 4.4 times higher
than the proportion of Black and African Americans in the general population. These
data highlight significant inequities that must be addressed in the community.
Figure 5: Race and Ethnicity Demographics for Metro Denver, 2020
Source: MDHI, 2020 Point in Time Count Dashboard
13 August 2021Additional Estimates of People Experiencing Homelessness It is difficult to accurately count the number of people experiencing homelessness. The Point in Time (PIT) estimate represents a snapshot of what is happening on a single night in January. The count is conducted annually to provide a basis for federal funding. Organizations providing services to people experiencing homelessness emphasize that the true count of the number of people who experience homelessness at least once in a given year is significantly higher. Key stakeholders recommended multiplying the PIT count by a factor of 2.5 for an annualized count, which would result in an estimated count of 15,260 for Metro Denver. This method for estimating the annual count of people experiencing homelessness is used by Colorado Coalition for the Homeless, St. Francis Center, Urban Peak and other stakeholders. While just an approximation, considering an annual count of people experiencing homelessness is helpful in considering the scope of this issue. MDHI provides another view of the system through their cumulative count of individuals accessing services related to homelessness. This data is captured through their homeless management information system (HMIS). The cumulative count across the Metro Denver region was 31,207 from July 1, 2019–June 30, 2020. These various count systems are not meant to be directly compared as they represent different ways in measuring homelessness; rather, the different count methods are intended to portray a broader view of homelessness in the Metro Denver region.xx Figure 6: Comparison of Different Count Methods for the Metro Denver Region Source: MDHI, State of Homelessness, 2020. 14 August 2021
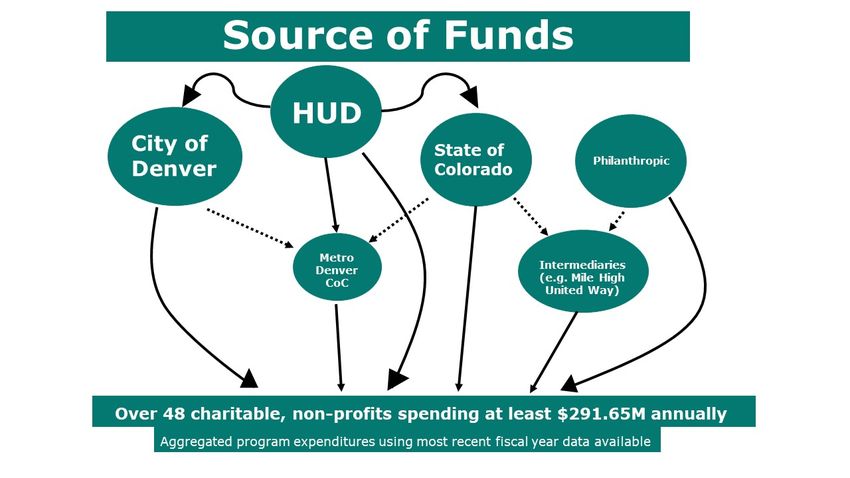
Revenue Streams: Homelessness Assistance Programs
The homelessness ecosystem consists of a complex array of organizations,
agencies, and funding streams. The U.S. Department of Housing and Urban
Development (HUD) is the key federal agency on this issue, while states and
localities have many different agencies and departments working on preventing and
resolving homelessness. Figure 7 displays a visual of the intersecting and
multidirectional funding streams that support the variety of services and activities
needed to support individuals experiencing homelessness. Figure 8 provides a list of
some of the key federal, state, and local agencies and charitable organizations in
the ecosystem. While not an all-inclusive list, Figures 7 and 8 highlight the
complexity and vast array of participants within this ecosystem.

Figure 7: Source of Funds

Note: The Metro Denver CoC (Continuum of Care) is currently the Metro Denver
Homelessness Initiative (MDHI). As the CoC, MDHI coordinates housing and services
funding for people experiencing homelessness.

15       August 2021
Figure 8: Key Entities in the Homelessness Ecosystem
This is not a comprehensive list, but represent key entities in the ecosystemxxi

             Key Federal Agency                       Municipal or Quasi-Governmental entities
                                                       directly serving the homeless population
     •    US. Department of Housing and
          Urban Development                              •    Community Hospitals
                                                         •    Police Departments
    State Level Agencies providing support,              •    Fire Departments
        funding and/or oversight around                  •    Public Health and Environment
                 homelessness                                 Departments
                                                         •    Transportation Departments
      •   Colorado Division of Housing                   •    Human Service Departments
      •   Colorado Department of Human                   •    Housing Authorities
          Services                                       •    Housing Stability Offices
      •   Colorado Department of Public Health           •    Parks and Recreation
          and Environment
      •   Colorado Department of Local Affairs

                        Charities in the Denver Metro Area providing housing
                              and services to the homeless population
•     Almost Home, Inc.            •   Family Homestead             •   Safehouse Denver
•     Archway Housing              •   Family Promise of Greater    •   Safehouse Progressive Alliance
                                       Denver                           for Non-Violence
•     Aurora Mental Health         •   Family Tree, Inc.            •   Second Chance Center
      Center
•     Bayaud Enterprises           •   Growing Home                 •   Senior Support Services
•     Boulder County Housing       •   Jefferson Center for         •   Severe Weather Shelter
      Authority                        Mental Health                    Network
•     Boulder Housing Coalition    •   Jewish Family Service of     •   St. Francis Center
                                       Colorado
•     Boulder Shelter for the      •   Mental Health Center of      •   TGTHR
      Homeless                         Denver
•     Bridge House                 •   Metro Denver Homeless        •   The Action Center
                                       Initiative
•     Catholic Charities of        •   Mile High Ministries         •   The Comitis Crisis Center
      Denver
•     Central Presbyterian         •   Mile High United Way         •   The Delores Project
      Homeless (New Genesis)
•     Colorado Coalition for the   •   Mother House                 •   The Empowerment Program
      Homeless
•     Colorado Homeless            •   Providence Network           •   The Gathering Place
      Families
•     Colorado Village             •   Ready to Work Aurora         •   The Salvation Army
      Collaborative                    (Bridge House)
•     Denver Rescue Mission        •   Rocky Mountain Human         •   Urban Peak
                                       Services - Homes for All
                                       Veterans
•     Emergency Family             •   Sacred Heart House of        •   Volunteers of America
      Assistance Association           Denver
•     Emmaus Housing               •   Safe Shelter of St. Vrain    •   Warren Village
                                       Valley

16          August 2021
Federal Revenue Streams
In FY 2020, the HUD spent $2.777 billion on homelessness assistance programs
across the country. From that amount, Colorado received a total of $98.3 million
across three programs that provide significant support to people experiencing
homelessness: the Continuum of Care (COC) program, the Emergency Solutions
Grant (ESG) and the Housing Trust Fund (HTF). Of that total $98.3 million, $55.4
million was from the CARES Act to help communities address the impact of COVID-
19. Other HUD programs, such as the Community Development Block Grant, focus
on creating and supporting affordable housing, which often benefit individuals who
have recently experienced homelessness or are housing insecure. The CDBG
program also supports the development of homelessness facilities. In total,
Colorado received $120.2 million in FY 2020 for affordable housing and community
development programs. The analysis in this section focuses on the CoC, ESG and
HTF homelessness assistance programs.
HUD Homelessness Assistance Programsxxii
• Continuum of Care (COC): The CoC program is designed to promote
communitywide commitment to the goal of ending homelessness. The
program provides funding for efforts by nonprofit providers, and state and
local governments to quickly rehouse individuals and families experiencing
homelessness, including funding for permanent housing, transitional housing,
supportive services, HMIS, and, in some cases, homelessness prevention.xxiii
The federal funding flows to a regional or local planning body that
coordinates housing and services funding for families and individuals
experiencing homelessness. These entities are responsible for collecting data
around homelessness in their geographic reach.xxiv
• Emergency Solutions Grants (ESG) Program: The ESG program provides
grants to states and localities for street outreach, emergency shelter,
homelessness prevention, rapid re-housing assistance, and HMIS with the
goal of assisting people to quickly regain stability in permanent housing after
experiencing a housing crisis and/or homelessness.
• Housing Trust Fund (HTF): HTF provides grants to states for the
construction, rehabilitation, and preservation of rental homes and for
homeownership for extremely low- and very low-income families, including
homeless families.
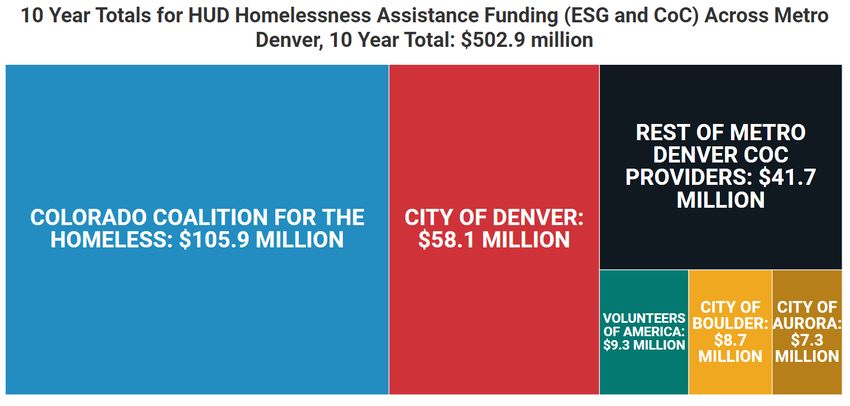
Figures 9 through 11 show awards made to cities, counties, providers and state
agencies for the CoC, ESG and HTF programs. Note that the CARES Act COVID-19
federal relief package allocated $55.4M to the ESG program statewide in 2020; the
amount without the CARES ACT funding for 2020 would have been $42.9 million.
17 August 2021Figure 9: HUD Homelessness Assistance Funding, Statewide Source: U.S. Department of Housing and Urban Development, Awards and Allocations * ESG 2020 funds include $55.4M in CARES Act allocations to the ESG program Figure 10: HUD Homelessness Assistance Funding (ESG and CoC), Denver Metro Region, Adjusting for Inflation 18 August 2021
Source: U.S. Department of Housing and Urban Development, Awards and Allocations
Figure 10 shows that ESG and CoC funding awarded to organizations and
cities/counties in the Metro Denver region hovered around $30 million, adjusted for
inflation, from 2015 to 2019. In 2020, the ESG program received an influx of
funding through the CARES Act for COVID-19 response.

Figure 11 highlights the bigger recipients of federal HUD funding through the ESG
and CoC programs over the past decade. Colorado Coalition for the Homeless
received the largest portion of these federal funds, totaling $105.9 million over the
10 years. The cities of Denver, Boulder and Aurora collectively received $74.1
million over the last decade under these federal programs.

Figure 11: Metro Denver ESG and CoC Funding, 10 Year Totals

Source: U.S. Department of Housing and Urban Development,
https://www.hudexchange.info/grantees/allocations-awards/

COVID-19 Federal Funding
Figures 9 through 11 include federal funding from the CARES Act that flowed
through the 2020 HUD awards. The Metro Denver region also received a significant
amount of funding through the 2021 American Rescue Plan Act (ARPA) that is
intended to directly target homelessness.

The HOME Investment Partnerships Program, for example, received $29.4 million
through ARPA for cities and counties in the Metro Denver region. According to HUD,
these funds are intended to “help communities across the country create affordable
housing and services for people experiencing or at risk of experiencing
homelessness.”xxv Under the program, states have the flexibility to use the funding
to best meet the needs of people experiencing or at risk of experiencing

19       August 2021
homelessness. Funds must be spent by 2030 on activities that could include new
development of affordable housing, tenant-based rental assistance, supportive
services, and acquisition and development of non-congregate shelter units.

Figure 12: 2021 American Rescue Plan Act HOME Investment Partnerships
Program Allocations

Additionally, Governor Polis has dedicated $550 million to affordable housing from
the federal ARPA funds that flowed to Colorado. It is expected some portion of this
would go towards supporting people experiencing homelessness. Lastly, the state-
funded Colorado Rescue Plan allocates $15 million to hotel rooms for unhoused
individuals and $13 million in affordable housing projects incentives.xxvi

20      August 2021
Estimated Expenditures Related to Homelessness
Introduction

Nearly half a billion dollars is spent annually on shelters, supportive services, health
care and public assistance for individuals experiencing homelessness in the Metro
Denver area. Within the city and county of Denver the figure approaches $447
million. These estimates are likely undercounting the full breadth of spending on
this issue. The figures only include financial information that was available and do
not capture the full array of charitable organizations, religious organizations, public
agencies or health care and emergency responders that are dedicated to serving
people experiencing homelessness. This analysis of annual expenditures includes
only a partial list of municipal agencies engaged on this issue within Denver,
Boulder or Aurora, and it does not include any city or county agencies in other
areas of Metro Denver. While Denver Health costs are included, other regional and
local hospital and health care costs are not included. For example, UCHealth
provides a significant amount of uncompensated care to people experiencing
homeless.

While these numbers are not precise, these estimates begin to shed light on the
systemwide resources available to resolving homelessness. There is a growing
demand on public resources and increasing scrutiny on public policy. An
understanding of the existing resources – fiscal, human, and otherwise – can help
launch a conversation about how the Metro Denver region can better connect
individuals and families experiencing homelessness with stable housing and
wraparound support.

This section begins with a look at three major cities in Metro Denver: City and
County of Denver, City of Aurora, and City of Boulder. The numbers reported for
these cities are not comprehensive, but this begins to illuminate the array of
resources that municipalities are dedicating to homelessness. Following the city
profiles is a section on the broader expenditures in the Metro Denver region and
how those expenditures compare to other spending and expenses on a per person
basis.

Further detail on the methodology of this section can be found in Appendix A.

City of Denver
The City of Denver provided data on agency spending from the police and fire
departments, which have staff dedicated to supporting individuals experiencing
homelessness (see Figure 13).

The City of Denver Police Department, for example, has an internal team to assist
with efforts to resolve homelessness. The Homeless Outreach Team works with
numerous city agencies and officials in an effort to keep both the housed and

21       August 2021
unhoused communities safe. Over the last year, the city itself has expanded specific
programs to handle encampment enforcement so the police department is not
solely responsible for every situation or complaint, especially when the complaint is
not about criminal or unlawful behavior. The “Early Intervention Team”, which was
initially designed to be a non-enforcement and outreach-focused team under the
Department of Public Safety, is now transitioning to be under the Department of
Public Health and Environment (DDPHE). The Early Intervention Team, along with
the newly formed Street Enforcement Team, will handle general calls about
encampments that get fielded through 311. The Street Enforcement Team, modeled
from the park ranger system, will have a greater enforcement role through civilian
members who will have the authority to issue citations for numerous violations.
Offenses including unauthorized camping, trespassing, public urination, and
obstruction of public passageways will all be enforced by this team.xxvii

Figure 13: Estimated Annual Expenditures, City of Denver

                                                          Estimated Annual
              Agency/Organization
                                                            Expenditures
                   Denver Health                            $ 175,867,454
             Denver Police Department                         $1,300,000
              Denver Fire Department                           $415,800
          Homelessness Resolution Fund                       $40,000,000
             Charitable Organizations                        $217,040,343
          City/County of Denver Total                      $ 434,623,597
Source: Data provided to CSI from Denver Police and Fire Departments. Denver Health data
found in 2020 Report to the City. Charitable organization spending collected from 990
Forms, annual reports and outreach to organizations.

Other agencies, including DDPHE, the Department of Transportation and
Infrastructure (DOTI), the Department of Human Services and the Department of
Parks and Recreation, also provide services related to homelessness but those
numbers were not available to include in this report. These agencies are investing
in multiple initiatives that contribute to the City of Denver’s efforts on combatting
homelessness. The Wellness Winnie is an example of one such initiative. As a
mobile unit, the Wellness Winnie offers support, assistance, and resources by
providing equitable access to behavioral health and support services.xxviii It is
staffed with mental health counselors and peer navigators who provide essential
supplies for daily living, offering information about resources, behavioral health
screenings and assessments, and active referrals to services (medical, legal, social
services, etc.). Wellness Winnie serves both housed and unhoused individuals.
DOTI helps these efforts with their encampment clean-up programs through their
Division of Solid Waste Management where they are responsible for the removal of

22       August 2021
all trash as well as the cleaning and sanitizing of the public space. DOTI also
created a public restroom project where they have two restroom units, one mobile
and one fixed, that allows all members of the community access to clean facilities.
Denver Health, which provides health care and emergency services to a significant
portion of the homeless population, estimates in its annual report the cost of
providing uncompensated care to individuals experiencing homelessness.xxix This
amount, totaling $175.9 million in 2020, is included in Figure 15.
Figure 14: Recent City of Denver Tax Initiatives
Tax Initiatives Revenue Raised Purpose
2020 – 2021: up to $40 Increased sales and use taxes to fund
Homelessness million annually housing, shelter and services for people
Resolution Fund experiencing homelessness
2018 – Caring 2020: up to $36 Increased sales and use taxes to raise
for Denver million annually revenue to address mental health and
substance abuse needs in Denver
Total: Up to $76 million annually in Denver tax increases
The City of Denver has also recently passed two tax increases that support services
and housing for the homeless population (see Figure 14). The Homelessness
Resolution Fund, approved by voters in 2020, is intended to support housing,
shelter and services for people experiencing homelessness. The Caring for Denver
initiative, passed in 2018, allocates $36 million to the Caring for Denver
Foundation, which is awarding grants to providers addressing mental health and
substance abuse in Denver.xxx Some of the grants awarded by Caring for Denver
are supporting organizations dedicated to serving individuals experiencing
homelessness, such as The Gathering Place. However, the scope of the Caring for
Denver tax revenue is much broader than solely serving the homeless population,
and thus this revenue is not counted in Figure 13 or any of the totals in the report
around expenditures on homelessness.
The other component of spending included in Figure 13 is the amount of spending
by charitable organizations operating within Denver. The estimate of $216.4M
includes spending by organizations in Denver that serve or house individuals
experiencing homelessness. These organizations provide critical support including
case management, shelters and housing, mental health support, rehabilitation
services, and food and clothing. As stated above, this is not a precise accounting
given the complexity of the ecosystem surrounding homelessness and likely
underestimates the amount spent on service and housing for the homeless
population. Because organizations have broader scopes of services than
23 August 2021homelessness assistance, our numbers represent conservative estimates of what is
being spent solely on people experiencing homelessness.
This report does not include expenditures by housing authorities dedicated to
affordable housing. The federal Housing Choice Voucher program provided $220.1
million in funding to housing authorities located in the Metro Denver region in
2020.xxxi Of that, $90.4 million was spent by the Denver Housing Authority. A
certain percentage of people served by the Housing Choice Voucher program self-
identify as chronically homeless. One expert estimates the percentage to be around
30 percent, but that fluctuates depending on the area. Given the uncertainty
around the amount being spent by housing authorities on housing for people
experiencing homelessness, those amounts are not included, except for one grant
for Boulder Housing Authority that was specifically awarded through HUD’s CoC
program for rapid rehousing.
City of Boulder
In May 2021, the City of Boulder approved an 18-month budget of $2.7 million to
implement three potential solutions to combat the current health and safety issues
that are arising due to encampments and unhoused communities living in Boulder
public spaces. Of this 18-month budget, about $1.03 million is allocated to be spent
in the second half of 2021 and $1.63 million is allocated for 2022 calendar year
expenditures.
Figure 15: Estimated Annual Expenditures, City of Boulder
Estimated Annual
City of Boulder
Expenditures
Utilities Department (Internal Clean Up) $130,000
Community Vitality Department (Ambassadors) $372,000
Parks and Recreation Department (Park
$124,000
Rangers)
Police Department $1,002,644
City of Boulder Department Subtotal* $1,628,644
Charitable Organizations in Boulder $14,317,271
City of Boulder Total $15,945,915
*Estimated from approved 2022 city budget
Source: Boulder City Council Minutes from April 27, 2021 and May 11, 2021. Charitable
organization spending collected from 990 Forms, annual reports and outreach to
organizations.
These city-wide proposals include an internal clean-up team and an integrated
presence strategy (see Figure 15). Creating an internal clean-up team within the
24 August 2021city’s utilities department will allow city officials to create a unified approach to
supporting unhoused and housed community and maintain public spaces with a
budget of $130,000 for 2022.xxxii To further assist with this maintenance and
improve public safety, the city also proposed an increased presence of city
ambassadors, park rangers, and Boulder Police officers. Approximately $372,000
will go towards an ambassador pilot program to generate an increased presence,
maintenance, outreach, and education in the downtown and civic areas and include
staff from several city departments. For 2022, $124,000 has been allocated to an
urban ranger pilot program where rangers can serve as city-wide educators,
officers, and medics providing functions as visitor services, protecting park
resources, and enhancing use through education and enforcement. The final
$1,002,644 would go towards increasing police presence during encampment
cleanups happening throughout the city.
City of Aurora
The city of Aurora provided data from their Housing and Community Services
Department that includes what is spent internally on homelessness related services
and staff time expenditures in a given year. The city also provided estimates of
expenditures from the police and fire departments. Neither of those departments
tracks homelessness as a type of call for services, so these figures represent the
departments’ best approximation for number, duration, and level of effort required
to respond to calls for service for people experiencing homelessness.
Figure 16: Estimated Annual Expenditures, City of Aurora
Estimated Annual
City of Aurora
Expenditures
Aurora Police Department $750,000
Aurora Fire Rescue $180,000
Housing and Community Services Department $888,000
City of Aurora Department Subtotal $1,818,000
Charitable Organizations in Aurora $6,002,157
City of Aurora Total $7,820,157
Source: Data provided to CSI from Aurora Police and Fire Departments and the Aurora’s
Department of Housing and Community Services. Charitable organization spending collected
from 990 Forms, annual reports and outreach to organizations.
The Housing and Community Services Department expenditures do not include
money that is delegated to non-profit organizations that also provide services to the
local community. The expenditure estimate of $888,000 per year consists of
$575,000 for the Aurora Flexible Housing Fund and $313,000 for staffing.
25 August 2021The Aurora Flexible Housing Fund is a program that benefits people being served by
the Coalition of the Homeless’ services department. In Spring 2021, the city asked
the community for input and ideas on alternative sheltering options to further serve
people experiencing homelessness within Aurora. The city created a survey for
community members to make comments on options including pallet homes, tents
for safe camping, tiny homes, safe parking lots for those living out of vehicles, and
restroom & shower trailers. The city is compiling survey responses and plans to
work towards producing alternative and expansive programs and resources for
people experiencing homelessness.
Metro Denver Expenditures
Figure 17 sums up the expenditures from our featured cities: Denver, Boulder and
Aurora, and then adds in the remaining spending from charitable organizations in
other cities and counties of Metro Denver. The bulk of the spending falls within the
City of Denver for several reasons. First, Denver is home to many shelters and
services for people experiencing homelessness, and, correspondingly, the city
accounts for nearly 70 percent of the homeless population within the region.
Second, this estimate includes Denver Health costs for providing health care to
people experiencing homelessness, but there are not comparable numbers for other
hospitals in surrounding cities and counting. UCHealth Anschutz Medical Campus,
for example, is a major provider of care for the homeless population in Aurora, but
they do not capture data on homelessness in their records. Third, the size of
Denver relative to the size of other cities and counties means the city receives a
greater share of federal funding, which in turn supports some of these
expenditures.
Figure 17: Metro Denver Estimated Expenditures Related to Homelessness
Total Expenditures within City of Denver
$434,623,597
[Figure 13]
Total Expenditures within City of Boulder
$15,945,915
[Figure 15]
Total Expenditures within City of Aurora
$7,820,157
[Figure 16]
Charitable organizations in other
cities/counties in the Metro Denver $22,804,392
region not included in above counts
Metro Denver Total Expenditures $481,194,061
Note: Metro Denver includes seven counties: Adams, Arapahoe, Boulder, Broomfield,
Denver, Douglas, and Jefferson. Charitable organization spending collected from 990 Forms,
annual reports and outreach to organizations.
26 August 2021The $481.2 million in spending within Metro Denver surpasses the size of some
budgets for state level agencies, including the Departments of Natural Resources,
Local Affairs and Labor and Employment.
Figure 18: Comparative Budgets for State Agencies
2021 Colorado Agency Budgets
Public Health & $560.4M Metro Denver Total
Environment Expenditures on Homelessness
Public Safety $494M
Natural Resources
Local Affairs
$324.5M
$318.5M
$481.2M
Labor & Employment $259.3M
Figure 19 provides ranges of spending per individual experiencing homelessness
using two different counts: the Point in Time (PIT) count and the annualized
estimate which multiplies the PIT count by a factor of 2.5. This range provides a
broad view of the amount of money spent annually within the City of Denver and
within the wider 7-county region on shelters, services, and healthcare for
individuals experiencing homelessness.
Figure 19: Spending on Homelessness Assistance per Person Experiencing
Homelessness
27 August 2021Source: CSI Analysis
Within the City of Denver, the range of spending per person experiencing
homelessness is $41,679 per person to $104,201 per person depending on the type
of count used. In comparison, spending per pupil for K-12 education in Denver
Public Schools is around $19,202.
City of Denver Spending
• $41,679 - $104,201 Per Person Experiencing Homelessness
Comparative Homelessness Assistance Spending:
• $29,000 Local emergency services per chronically homeless individual who
is a “high-utilizer” of services, according to the City of Denver.xxxiii
• $22,000 - $36,000 Permanent Supportive Housing Program for one
individual per year in the Denver Supportive Housing Social Impact Bond
Initiative (Denver SIB).xxxiv
Comparative Denver Metrics
• $19,202 Per Pupil Spending for K-12 Education, 2019xxxv
28 August 2021• $21,156 Average yearly rent for an apartment in Denver, 2021xxxvi • $44,806 Per Capita Income for an individual in Metro Denver, 2019xxxvii • $68,592 Median Household Income in Metro Denver, 2019xxxviii Workforce Serving People Experiencing Homelessness The workforce serving people experiencing homelessness mirrors the complexity of the ecosystem. The workforce includes employees at charitable organizations, health care staff at local hospitals and urgent care centers, emergency responders, government workers, social workers, and counselors, among others. There is also a robust volunteer sector giving their time to this important issue. The following estimates were developed from an analysis of annual reports, 990 Forms, and interviews. Because some of the organizations offer a broader range of services than supporting the homeless population, precise numbers are difficult to obtain from available information. Instead, an estimated range of the workforce and volunteer sector is presented here. In Metro Denver, it is estimated that 4,000 – 7,000 employees work in organizations, government agencies, emergency response units or other entities that have services or housing dedicated to people experiencing homelessness. The number of volunteers ranges from 55,000 – 85,000 people putting in around 200,000-300,000 hours. The financial value of volunteer hours is $5.7 – $8.6 million. Figure 20: Workforce data Source of Financial Value: Independent Sector 29 August 2021
Number of Beds and Units for People Experiencing Homelessness
Over the past 10 years, the number of permanent supportive housing beds and
emergency shelter beds have increased, while the number of transitional housing
and rapid rehousing beds have decreased (see Figure 21).

Figure 21: Number of Beds by Type, Over Time

Source: U.S. Department of Housing and Urban Development; CoC Housing Inventory Count Reports.
Overall, both transitional housing and emergency shelters in Metro Denver had
beds available during the 2020 Point in Time count (see Figure 22). Transitional
housing was 72 percent occupied and emergencies shelters were 82% occupied if
including the severe weather beds, or 88% occupied if severe weather beds are
excluded.xxxix Data on bed occupancy for permanent supportive housing is not
available for 2020, but in 2019, there were 3,167 total permanent supportive
housing beds, of which 3,100 were occupied on the night of the PIT count, for an
occupancy rate of 98 percent.xl

Figure 22: Bed Occupancy, 2020 Point in Time Count

30        August 2021
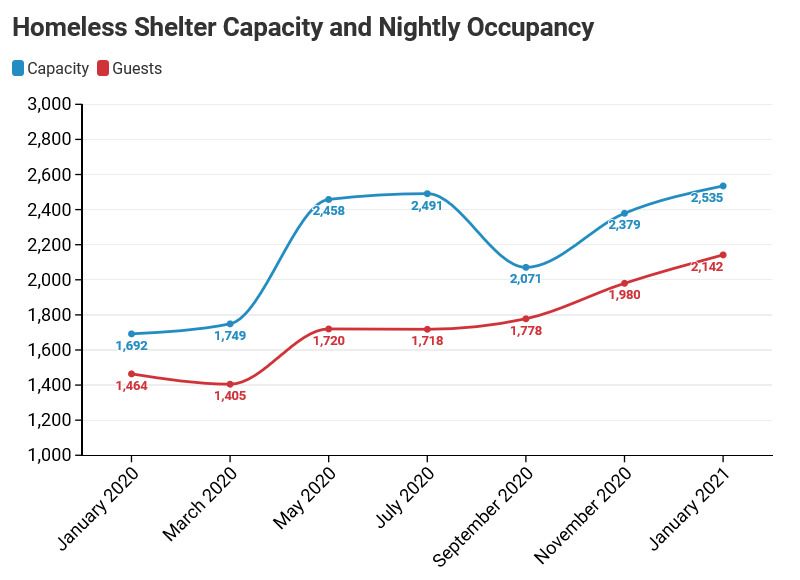
Note: 264 of the available emergency shelter beds are for severe weather shelter only.
Source: MDHI, PIT Regional Report 2020

In Figure 22, 264 of the available emergency shelter beds are for severe weather
use only. During extreme weather and emergencies, the City of Denver adapts to
accommodate its unhoused population. As a city that experiences both extreme
cold conditions in the winter and hot in the summer, Denver has elasticity in the
number of shelter beds available. During these times, the city dispatches Early
Intervention Teams who are responsible for contacting and communicating with the
unsheltered community and encouraging them to move inside. As the Denver
shelters fill to capacity during these severe weather situations, emergency centers
are also created. In the past, facilities including The Lawrence Street Community
Center and The Denver Coliseum were converted to shelters to withstand the influx
of people experiencing homelessness and needing shelter.xli

Denver also greatly expanded the number of beds during the onset of the pandemic
in spring 2020. Figure 23 displays data from the City of Denver’s Department of
Housing Stability and shows the expansion of beds throughout the pandemic. This
concerted effort meant supply kept pace with, and even exceeded, demand as the
number of people experiencing homelessness increased during COVID-19.xlii

31          August 2021
Figure 23: Homeless Shelter Capacity and Occupancy within City of Denver

Source: City of Denver, Department of Housing Stability, “COVID-19 Response Report,”
March 2021, p 4. Note from City of Denver: “Shelter capacity and guest counts only include
congregate shelters until April 19, 2020. Shelter capacity prior to the onset of the pandemic
reflects the number of sleeping spaces facilities could typically accommodate.”

32       August 2021
Conclusion
The Denver Metro region is investing a significant amount of funding – nearly half a
billion dollars annually – to prevent and resolve homelessness. As the number of
people experiencing homelessness continues to rise and as communities recover
from COVID-19, now is a critical time to assess the ecosystem. This report
attempts to understand the fiscal and human resources in the systems surrounding
homelessness. The complexity of entities, funding streams and resources makes
understanding the various and interconnected systems difficult. The data presented
in this report provide a launching point for further inquiry.

The next phase of research in this project will identify factors within the ecosystem
that have an outsized impact and will provide insights into where additional
interventions and investments might address the root causes of persistent problems
and accelerate the positive dynamics within the system. The goal of the
forthcoming research will be to identify key areas for further investment that can
maximize total impact and contribute to the resolution of homelessness in the
Metro Denver area.

                         © 2021 Common Sense Institute.

33      August 2021
Appendix A: Methodology & Data Notes
Methodology
• Focused on City of Denver and Denver Metro Area
• Using HUD definition of “Literal Homelessness”
o An individual or family who lacks a fixed, regular, and adequate nighttime
residence, (i) Has a primary nighttime residence that is a public or private
place not meant for human habitation; (ii) ls living in a publicly or
privately operated shelter (including safe haven or transitional living
program); or (iii) Is exiting an institution where (s)he has resided for 90
days or less and who resided in an emergency shelter or place not meant
for human habitation immediately before entering that institution.
• Reporting “Program Services” expenditures from 990 Forms, the Secretary of
State website, or from organizations who provided financial information to CSI.
The estimates in this report do not count administrative or fundraising expenses.
• Financial data collected from charitable organizations is reported for FY 2020.
• For the purpose of grouping organizations by city for the analysis, we used the
location of the organization’s headquarters. However, if an organization has
headquarters in a city within Metro Denver but also operates outside of the
Metro Denver region, we only counted expenditures within the region as
described in the next section.
Data Notes
The homelessness industry consists of a network of charities and faith-based
organizations who receive the bulk of their revenue through government contracts.
Religious organizations are not required to file a Form 990. Some organizations were
unwilling to participate in the data collection process for this report, including Metro
Denver Homelessness Initiative (MDHI), which is the coordinating body for providers in
the 7-county metro area.
The data from 990 forms do not break down expenditures by city or county. Four
organizations included in our dataset provide services in areas outside of the Metro
Denver region. Catholic Charities, Salvation Army and Volunteer of America provided
specific data on expenditures within the Denver Metro area. For Colorado Coalition of
the Homeless, we used the share of homeless individuals from the Point in Time count
and applied that to an organization’s expenditures. Homeless individuals in Metro
Denver comprise 61 percent of the state’s homeless population according to the Point
in Time survey. Thus, we counted 61 percent of the statewide expenditures from
Colorado Coalition of the Homeless in our reporting.
Several organizations have broad missions and provide a range of services beyond
care and support for the literal homeless. We analyzed annual reports from
organizations to identify which program spending to include. Rocky Mountain Human
34 August 2021You can also read