Stoichiometry of tetragonal and hexagonal Fe xSe: phase relations - IOPscience
←
→
Page content transcription
If your browser does not render page correctly, please read the page content below

Superconductor Science and Technology

PAPER • OPEN ACCESS

Stoichiometry of tetragonal and hexagonal FexSe: phase relations
To cite this article: Mahboobeh Shahbazi et al 2020 Supercond. Sci. Technol. 33 075003

View the article online for updates and enhancements.

                               This content was downloaded from IP address 176.9.8.24 on 13/06/2020 at 07:58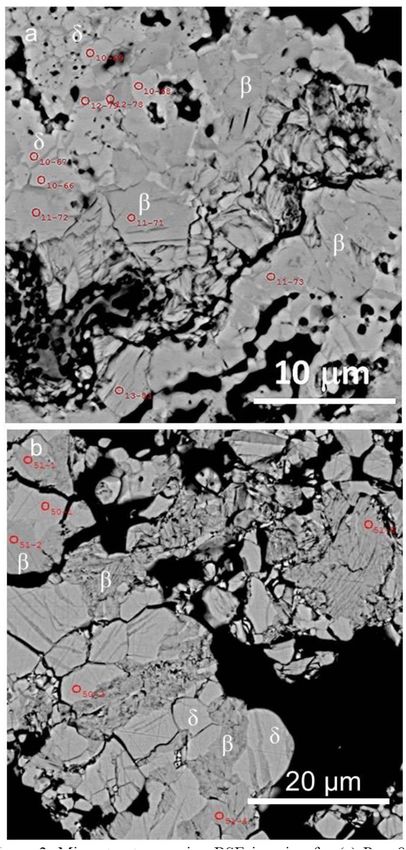
Superconductor Science and Technology
Supercond. Sci. Technol. 33 (2020) 075003 (13pp) https://doi.org/10.1088/1361-6668/ab89ec
Stoichiometry of tetragonal and
hexagonal FexSe: phase relations
Mahboobeh Shahbazi, Henrietta E Cathey and Ian D R Mackinnon
Institute for Future Environments and Science and Engineering Faculty, Queensland University of
Technology, 2 George St., Brisbane QLD 4001, Australia
E-mail: ian.mackinnon@qut.edu.au
Received 8 January 2020, revised 2 March 2020
Accepted for publication 16 April 2020
Published 13 May 2020
Abstract
Precise compositional analyses at spatial resolution 690 ◦ C with
annealing at 420 ◦ C for ∼24 h. We define a modified phase diagram that includes this two phase
field with β-Fex Se and δ-Fex Se for 1.02 < x < 0.90 and a second two phase field with β-Fex Se
and α-Fe for 1.08 < x < 1.02. This revised phase diagram for Fe:Se ∼ 1.0 suggests that the
peretectic transition nominally identified at x = 1.04 is not evident.
Supplementary material for this article is available online
Keywords: iron chalcogenides, stoichiometry, phase diagram, microstructure, superconductivity
(Some figures may appear in colour only in the online journal)
1. Introduction are classified into two groups: iron pnictides and iron chal-
cogenides [3, 5].
Transition metal chalcogenides have received significant Iron chalcogenides have an advantage of lower toxicity
interest in recent years due to their extensive range of applica- and simpler crystal structure compared with iron pnictides
tions in thermoelectrics, solar cells, sensors, magnetic devices, [6, 7]. However, preparing single phase superconducting
batteries, photocatalysts, semiconductors and superconduct- material is challenging. Iron selenides are found in several
ors [1]. The discovery of superconductivity in iron based stable crystalline forms: tetragonal β-Fex Se, hexagonal δ-
compounds [2, 3] has led to intense scrutiny of chalcogen- Fex Se, orthorhombic FeSe2 , hexagonal Fe7 Se8 and mono-
ides including of the basic structural units that make up new clinic Fe3 Se4 [8, 9]. Among these phases, the tetragonal β-
families of superconductors through judicious substitution of Fex Se with PbO structure (space group P4/nmm) transitions to
other elements [4]. Superconducting iron-based compounds a superconductor (SC) with orthorhombic space group Cmma
at ∼8 K [2].
To date, reports on the synthesis of tetragonal β-Fex Se
powders describe a range of heat treatment protocols includ-
ing reacting and annealing at several different temperatures
Original content from this work may be used under the terms
of the Creative Commons Attribution 4.0 licence. Any fur- followed by cooling or quenching to room temperature. For
ther distribution of this work must maintain attribution to the author(s) and the example, experiments by McQueen et al [10] show that
title of the work, journal citation and DOI. product with a high proportion of β-Fex Se (i.e. > 95%) can
1361-6668/20/075003+13$33.00 1 © 2020 The Author(s). Published by IOP Publishing Ltd Printed in the UK
Supercond. Sci. Technol. 33 (2020) 075003                                                                                  M Shahbazi et al

be achieved with extended reaction and annealing times. This               Table 1 summarises key parameters for reactions and the
work employed long reaction times (>3 d) at high temperatures           products of reaction presented in this work. A consistent heat-
(>1000 ◦ C), re-grinding the products and extensive annealing           ing rate of 1.66 ◦ C min−1 (100 ◦ C hr−1 ) is used for many reac-
times (∼2 d) at lower temperatures (300 ◦ C to 400 ◦ C), to             tions and at different reaction temperatures the heating rate
obtain an optimum composition of β-Fe1.01 Se for which the              is held constant for various time periods. A heating rate of
superconducting transition temperature, Tc, is 8.7 K [10].              0.33 ◦ C min-1 (20 ◦ C hr−1 ) is used for Runs 11–15. For all
   In contrast, Grivel [11] demonstrates that short reaction            syntheses, the reactor is cooled to room temperature by radi-
times (e.g. between 1 and 10 h) at temperatures of 400 ◦ C              ant loss consistent with the observation by others [13, 14] that
and 700 ◦ C, influence the proportion of other phases formed            quenching from these temperatures is unnecessary. We estim-
in addition to β-Fex Se, the predominant phase. Long reac-              ate the reactor cools to room temperature within two hours.
tion times up to 100 h reduces the XRD-detectable proportion            Reaction 9 in table 1 is an exception for which the reactor is
of other phases such as α-Fe and δ-Fex Se [11]. In a related            slowly cooled to room temperature over 45 h. All products are
study, Guo et al [12] show that the quenching temperature               placed in the glove box for transfer from the reactor for further
(between 300 ◦ C and 500 ◦ C) results in minimal change in              characterisation.
the lattice parameters of β-Fex Se and has limited affect on Tc ,
(∆ ∼ 0.3 K) .
   Studies on β-Fex Se synthesis and phase relations
                                                                        2.2. Characterisation
[2, 10, 12–14], utilise refinements of bulk high resolution
neutron diffraction data to estimate stoichiometry of the syn-          Polycrystalline samples are characterised by x-ray powder dif-
thesized products. In one case, these diffraction data are sup-         fraction using Co Kα1 radiation in Bragg Brentano geometry
ported by bulk ICP-OES analyses of the synthesized phases               with 0.02 2θ steps and a counting time of 10 s per step using
[12]. However, there are few, if any, studies that correlate            a PANalytical x-ray diffractometer. Diffraction patterns are
structure (i.e. bulk x-ray diffraction and individual grain             refined and indexed using the software program Topas [17];
electron diffraction), microstructure and separately determ-            quantitative estimates of phase abundance in each product are
ined chemical analyses of individual grains from the same               determined by Rietveld refinements using Topas. In general,
syntheses.                                                              phase abundances determined by this technique are within
   In this study, we present correlated phase, microstructural
Supercond. Sci. Technol. 33 (2020) 075003                                                                                                  M Shahbazi et al

                                    Table 1. Selected starting conditions and products+ for FeSe syntheses.

                             Heating                                                                    β              δ
Run           Starting        rate          Tmax        thold       Tanneal         tanneal           Fex Se_        Fex Se_        α-Fe
                              ◦              ◦                       ◦
No            Fe:Se          ( C min− )     ( C)         (h)        ( C)              (h)              (%)            (%)           (%)             Other

1             1.14:1         1.66           750          23          NA                 NA             77             14              9               -
2∗            1.14:1         1.66           750          44          NA                 NA             78             18              5               -
3∗            1.06:1         1.66           750          44          NA                 NA             76             22              2               -
4             1.06:1         1.66           600         200          NA                 NA             78             19              3               -
5             1.06:1         1.66           600          45          NA                 NA             80             17              3               -
6             1.06:1         1.66           600          15          NA                 NA             77             20              3               -
7             1.03:1         1.66           570          15          NA                 NA             79             20              1               -
8             1.03:1         1.66           480          15          NA                 NA             76             23              1               -
9∗∗           1.03:1         1.66           480          15          NA                 NA             75             25              -               -
10∗           1.03:1         1.66           420          10          NA                 NA             72             26              2               -
11∗           0.95:1         0.33           720          24          420                24             58             42              -               -
12∗           1.00:1         0.33           720          24          420                24             81             19              -               -
13            1.01:1         0.33           690          24          420                24             84             16              1               -
14∗           1.02:1         0.33           690          24          420                24             96              3              1               -
15∗           1.03:1         0.33           690          24          420                24             91              8              1               -
16            1.03:1         1.66           410          15          NA                 NA             57             41              2               -
17            1.03:1         1.66           360          10          NA                 NA             57             37             1.5            4.5++
18∗           1.03:1         1.66           330          10          NA                 NA             60             37              3               -
19            1.03:1         1.66           330           5          NA                 NA             27             68              4               -
20            1.03:1         1.66           320           5          NA                 NA             21             75              4               -
21∗           1.01:1         1.66           330           5          NA                 NA             21             73              5               -
22            1.01:1         1.66           300           5          NA                 NA              -             37             10              52#
23             Run           1.66           410          10          NA                 NA             67             32              1               -
                22
24             Run           1.66           380          10          NA                 NA             54             43              2                -
                22
                                                                                   ∗∗
∗ Samples
        used for EPMA study; + based on Rietveld refinements of powder XRD data;        This sample cooled down slowly over 45 h; ++ FeSe2 ; # Fe3 Se4
(40%) +FeSe2 (12%)

wavelength-dispersive spectrometers, secondary and backs-                      In this study, the beam produced by a 15 kV and focused
cattered electron (BSE) detectors, Probe for EPMA [19] and                 30 nA source produces an electron beam-specimen total inter-
xCLent IV software. Spot analyses on chalcogenides are per-                action volume of ∼1 µm as determined using the CASINO
formed using Fe Kα and Se Lα x-ray intensities measured                    program [22] for modelling electron trajectories. However, the
simultaneously on LIFH and TAP analysing crystals, respect-                maximum depth of Fe Kα trajectories is ∼200 µm and that
ively, at 15 kV accelerating voltage, 30 nA beam current, and a            for Se Lα ∼ 600 µm. Given the average aggregate size of
fully focused beam. Pure metal standards are used for calibra-             samples analysed, and the method of sample preparation, sec-
tion and count times of 20 sec (peak and background) are used              ondary x-rays generated from such depths are unlikely. Nev-
on unknowns for both elements. An exponential fit to the back-             ertheless, we estimate the average spot analysis using EPMA
ground positions of Se Lα is used to model the background                  under these conditions is within a 1 µm radius of the beam
intensity under the peak and a linear fit for the background               location. Accompanying BSE and elemental x-ray maps by
under the Fe Kα. Detection limits under these conditions are               WDS used for phase analysis of individual powder particles
0.025 weight percent (wt %) for Fe and 0.032 wt % for Se, with             on the electron microprobe are conducted at 15 kV acceler-
analytical sensitivity of 0.22% relative for both elements at the          ating voltage, 30 nA beam current, focused beam and 40 or
99% confidence level.                                                      80 ms dwell time per pixel in stage mode, using a step size of
   The combined ZAF and ϕρz corrections of the                             200 µm.
Armstrong/Love-Scott quantitative analysis correction pro-                     Acquisition and image processing are obtained using the
cedure [20] along with the LINEMU database [21] of mass                    JEOL EPMA instrument and xCLent IV software. Single-pass
absorption coefficients are used for EPMA data reduction in                maps are acquired simultaneously for back scattered electrons,
the Probe for EPMA software. Analyses with wt % greater                    Kα lines of C and Fe, and Lα for Se. The carbon x-ray signal
than 101.0% or less than 99.0% are rejected during data                    is used in conjunction with BSE images to identify patches of
compilation. In all cases, the wt% element totals average                  conductive resin and to monitor contamination at grain mar-
99% or greater with average standard deviations
Supercond. Sci. Technol. 33 (2020) 075003                                                                                     M Shahbazi et al

the processed images. Thresholds of 20 or 40 counts for carbon             10 h to 200 h) at all temperatures above 420 ◦ C. An increase in
(corresponding to 40 ms or 80 ms dwell times) per pixel are                temperature for the same starting ratio and hold time (e.g. Runs
selected as cut-offs for edge effects, contamination or resin,             7–8), improves yield of β-Fex Se marginally and, within exper-
based on inspection of x-ray counts in smooth grain interiors.             imental error, increases the proportion of hexagonal δ-Fex Se,
Consistent thresholds for Se/Fe in all samples are also defined            presumably due to conversion of excess α-Fe. The amount
that differentiate the two Fex Se phases previously identified by          of α-Fe in the products from these reactions determined by
WDS quantitative spot analysis and BSE contrast. Together                  XRD is very low; sufficient to indicate presence. Examina-
these criteria define ⩾ 99.5% pixels as resin, contaminated                tion of products from reactions with similar Tmax and starting
cracks and edges or Fex Se phases. Phase proportions derived               ratios, suggests that a longer hold time may result in a lower
from the pixels that pass the filtering criteria for Fex Se are            amount of α-Fe (e.g. Runs 1–2; 3–6; 9–10) with concomit-
compared with BSE images.                                                  ant increase in either β-Fex Se or δ-Fex Se. Furthermore, XRD
   Compositions for iron selenides are variously reported in               data for Run 9 show that no α-Fe is present and is likely due
the literature with designations such as Fe1+x Se, Fe1−x Se,               to the very slow cooling rate from 480 ◦ C to room temperature
FeSe1−x , Fex Se in order to designate non-stoichiometry or                (i.e. 45 h).
the presence or absence of defects or vacancies [10, 23]. In                   Formation of β-Fex Se phase is also critically dependent
this work, we use the formalism Fex Se to denote composi-                  on small changes in the ratio of Fe:Se for starting compos-
tion of all synthesized selenide compounds. We convert the                 itions as indicated by Runs 11–15. A maximum yield of
stoichiometry for FeSe compounds reported in the literature                96% β-Fex Se is obtained for Run 14 with starting ratio for
to the same formalism in order to provide consistency to the               Fe:Se = 1.02: 1, Tmax = 690 ◦ C and thold = 24 h, with sub-
narrative.                                                                 sequent in situ annealing at 420 ◦ C for 24 h. Slight changes
   Zero field cooled (ZFC) and field cooled (FC) magnet-                   to the ratio of Fe:Se affects the proportion of final products as
isation curves as a function of temperature are measured at                shown for Runs 11–15 (table 1). For example, Runs 14 and
100 Oe using a Cryogenic Ltd Mini Cryogen-free System                      15 show >90% of β-Fex Se in the final product when sintered
(Cryogenic Ltd, London, UK) with a 5 T magnet. Tc was                      above 690 ◦ C—a significant increase compared with Runs
determined as the intersection of the linearly extrapolated                11–13. Notwithstanding the relative error for Rietveld refine-
M(T) with the M = constant line. For comparison of magnet-                 ments of powder XRD data, we suggest the improved yield for
isation data, we normalised the weight of each sample.                     Runs 14 and 15 are due to the higher Fe ratio of the starting
                                                                           materials.
                                                                               Excess Se in Run 11 results in formation of a higher amount
3. Results                                                                 of δ-Fex Se phase in the final product compared with all other
We present a selection of experimental data to demonstrate                 syntheses in table 1. However, excess iron in the starting
the range of conditions for which high yields of tetragonal                materials is favourable for formation of β-Fex Se. A lower
β-Fex Se may form. Table 1 presents data for reactions that                heating rate for similar reaction conditions, in particular, with
result in formation of β-Fex Se as the major phase in powder               excess iron in starting ratios suggests that less α-Fe is formed
products (e.g. >50%) as well as examples in which β-Fex Se is              in the final product (c.f. Runs 12–15 with Runs 1, 3 and 5).
not the major phase or is not present as determined by XRD                     Products resulting from variations in Tmax for Fe:Se = 1.03
Rietveld refinement. In general, reactions for which β-Fex Se              and 1.01 and differences in the hold time at lower Tmax val-
is the major phase are for maximum temperature, Tmax , above               ues are summarized in table 1. For example, a reduction of
330 ◦ C with a sintering time, thold , for 10 h or more. Reactions         sintering time from 10 h to 5 h for 300 ◦ C < Tmax < 330 ◦ C
that produce β-Fex Se in lesser proportion to δ-Fex Se or other            changes the proportion of β-Fex Se significantly (Runs 17–22).
phases occurs for Tmax ≤ 330 ◦ C with a sintering time, thold ,            However, re-heating Run 22 to 410 ◦ C and 380 ◦ C, respect-
less than 10 h.                                                            ively, results in the formation of β-Fex Se as a predom-
                                                                           inant phase (Runs 23 and 24). Other phases present at
                                                                           Tmax = 300 ◦ C, results in formation of Fe3 Se4 , FeSe2 and
3.1. Iron chalcogenide syntheses                                           α-Fe.

Table 1 describes generic variables that affect the relative pro-
portion of iron selenide products especially β-Fex Se. Table 1
                                                                           3.2. Phase chemistry
provides outcomes for (a) variation in Tmax with different start-
ing ratios, (b) differences in hold time, thold , for similar start-       We list in supplementary information (table S1) average
ing ratios and (c) variation in starting ratios of Fe and Se               compositions from selected phases within aggregates from
for similar Tmax and thold . Table 1 shows that tetragonal β-              thirteen separate reactions in the Fe–Se phase field invest-
Fex Se forms after heating to a wide range of temperatures                 igated. Each average composition, based upon identification
(∼330 ◦ C to ∼750 ◦ C), and a wide range of starting compos-               of the bright and dark regions using BSE images, is determ-
itions (0.95 < x < 1.14).                                                  ined from the number, n, of point (or spot) analyses listed
    Reactions with similar ratios of starting materials (e.g.              in table S1. The 255 separate point analyses obtained by the
Runs 1–2; 3–6; 7–10), show relatively high proportions of tet-             EPMA and compiled in table S1 are a subset of the >300 ana-
ragonal phase (e.g. >70%) over a wide range of hold times (e.g.            lyses undertaken on Fe and FeSe samples. Standard deviations

                                                                       4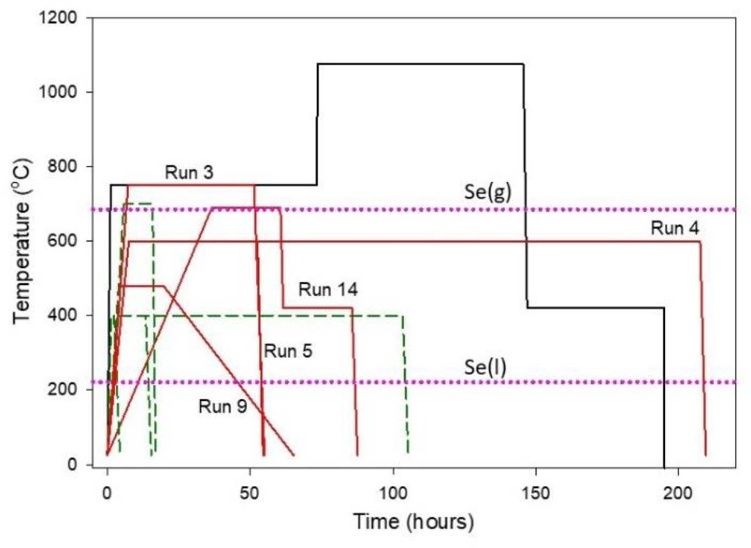
Supercond. Sci. Technol. 33 (2020) 075003                                                                                        M Shahbazi et al

Figure 1. Images of aggregates in polished sections from Run 9: (a) BSE image showing variations in grey scale corresponding to the two
different forms of Fex Se identified by contrast (dark is β-Fex Se; light is δ-Fex Se), (b) corresponding image analysis map of the same area in
figure 1(a) with quantitative estimates of phase proportions (blue: 75%; green: 25%), (c) EBSD of FeSe aggregates showing β-Fex Se (red
colour) and δ-Fex Se (blue colour) and (d) Euler map of the aggregates from the same area with polar orientations showing limited preferred
orientation of grains.

of average analyses are calculated using conventional statist-             75% for β-Fex Se determined by Rietveld refinement of XRD
ics for each image contrast region. Based on these EPMA                    data (table 1). Similar correlations of the bright and dark grey
analyses, the darker image contrast regions of BSE images                  BSE images with relative proportions of δ-Fex Se and β-Fex Se,
are Fe-rich while the brighter image contrast corresponds to               respectively, are observed for samples from other reactions.
Se-rich regions. For bright BSE contrast, Fe concentrations                   The EBSD image and Euler map in figures 1(c) and (d),
vary by ∼2.9 wt% and Se concentrations vary by ∼1.8 wt                     respectively, confirm the crystal orientation and structure of
%. For darker BSE image contrast, Fe concentrations vary by                the sample from Run 9 using known crystallographic data for
∼4.2 wt% and Se concentrations vary by ∼2.3 wt%.                           β-Fex Se and δ-Fex Se. Figure 1(c) shows that the two phases,
                                                                           β-Fex Se and δ-Fex Se are major phases in the product from
                                                                           Run 9. This determination is in good agreement with XRD
3.3. Morphology and microstructure
                                                                           results for this sample (as indicated in table 1) as well as with
Figure 1 shows typical products from Run 9 as polished                     combined WDS mapping and BSE imaging. The Euler map
aggregates using three complementary imaging techniques.                   in figure 1(d) shows that individual grain orientations in this
The BSE image of the products from Run 9 (figure 1(a)) shows               aggregate are, in general, random with limited preferred ori-
that the product aggregates contain two different phases as                entation.
indicated by the bright and dark grey image contrast that typ-                We present further examples of aggregates from Runs 4, 5
ically corresponds to variations in atomic number.                         and 14 in supplementary information (figures S1–S3 (available
   Image analysis of the colour-coded grains in figure 1(b) cal-           online at: https:/stacks.iop.org/SUST/33/075003/mmedia)).
culate relative proportions of 25% for green and 75% for blue              For Runs 14 and 15, we show good agreement between EBSD,
segments. These values compare with 25% for δ-Fex Se and                   WDS mapping and XRD results and tabulate these data for

                                                                       5
Supercond. Sci. Technol. 33 (2020) 075003                                                                                     M Shahbazi et al

                                 Table 2. Relative phase proportions determined by three analytical techniques.

                                    XRD                                         EBSD                              WDS mapping (EPMA)
Run No.            β-Fex Se (%)             δ-Fex Se (%)         β-Fex Se (%)           δ-Fex Se (%)         Dark (%)           Bright (%)

9                        75                     25                    83                    17                    75                 25
14                       96                      3                    99                     1                    97                  3
15                       91                      8                    99                     1                    92                  8

three typical experimental runs in table 2. Based on these data,           4. Discussion
we conclude that the darker BSE image contrast areas corres-
pond to the β-Fex Se phase and that the brighter BSE areas                 The stoichiometry of Fex Se phases in the proximity of
correspond to δ-Fex Se on polished sections as exemplified in              Fe:Se = 1:1 is key to an understanding of superconductivity
figures 1, S1 and S2.                                                      in the chalcogenide suite of materials [2, 10, 23]. In this work,
    Figure 2 compares unannealed samples sintered at 480 ◦ C               we have utilised a different and direct approach to statistic-
for 15 h (Run 8) with that of aggregates that have been sintered           ally determine stoichiometry on an individual grain-by-grain
at 720 ◦ C and then annealed at 420 ◦ C for 24 h (Run 11). In the          basis for the synthesized product(s). The spatial and chemical
latter case, both types of Fex Se phases are larger than phases            precision in this study enables interpretation that complements
sintered for shorter times (e.g. Run 8). However, unlike pre-              similarly precise studies on bulk samples using high resolution
vious studies which have not focussed on microstructure, note              neutron diffraction [10, 13]. We place emphasis on previous
the presence of both β-Fex Se and δ-Fex Se in these images.                studies that have analyzed the composition or stoichiometry
    Figure 3 compares microstructures for samples prepared at              of final products from a reaction rather than an assumed com-
lower temperature and highlights the effect of sintering time.             position based on the ratio of starting materials.
In this case, an additional 5 h sinter substantially increases
grain sizes within aggregates and shows enhanced growth of
                                                                           4.1. Synthesis of Fex Se
β-Fex Se. Critically, for an understanding of phase relation-
ships, both β-Fex Se and δ-Fex Se are present when sintered                Synthesis conditions used in this study are similar to
from starting powders at these lower temperatures, albeit in               that described as LTS (low temperature synthesis) by
different proportions. In addition, nano-scale particles with a            Pomjakushina et al [13] and extend upon conditions described
high brightness BSE signal that surround aggregates and are                by Grivel [11]. Figure 5 shows typical heating and cooling
within void regions (e.g. containing epoxy or remnant Fe), are             profiles for reactions using powdered starting materials of Fe
inferred to be remnant liquid Se that has solidified on cooling.           and Se by McQueen et al [10], Grivel [11] and this work. The
    These high brightness particles are much less abundant, or             liquid and gas phase transition temperatures for elemental Se
absent, in samples prepared at higher temperature with longer              (221 ◦ C and 685 ◦ C, respectively) are also shown as pink dot-
sintering and/or annealing times. Furthermore, at lower sinter-            ted lines in figure 5.
ing temperatures the presence of unreacted Fe can be readily                   The profile representing experiments by McQueen et al
observed using high contrast BSE images (e.g. figure S4, sup-              [10] are described as high temperature syntheses[13] and are
plementary information).                                                   directed at obtaining phase pure β-Fex Se product without δ-
                                                                           Fex Se or α-Fe. In these experiments by McQueen et al [10]
                                                                           and earlier predecessor studies [24], the Se reactant is substan-
3.4. Magnetic measurements
                                                                           tially in the gaseous state. For a range of synthesis conditions
Superconductivity was observed for all samples with pre-                   at lower temperatures, Grivel [11] shows that the predomin-
dominant β-Fex Se phase (e.g. > 70%) within the range                      ant β-Fex Se phase has an iron-rich stoichiometry (i.e. Fe1.01 Se
6.8 K ≤ Tc ≤ 8.2 K as summarised in supplementary inform-                  to Fe1.02 Se). This stoichiometry was determined by large-area
ation (table S2). A selection of β-Fex Se samples have been                (i.e. ∼20 µm2 ) average analysis using an SEM/EDS on pol-
evaluated using magnetic measurements. Figure 4 illustrates                ished samples. In the study by Guo et al [12], the stoichiometry
the temperature dependence of magnetization in both ZFC and                of β-Fex Se that produces maximum Tc was estimated to vary
FC modes at an applied field of 100 Oe for samples from Run                between 1.0 < x < 1.02, for samples with minimal presence of
14. The normal state is characterized by a positive magnetiz-              other phases.
ation that increases with increasing amount of hexagonal δ-                    In this work, we combine sintering and annealing in the one
Fex Se and residual iron phase in as-prepared samples.                     reaction chamber in order to minimize the influence of oxy-
   Samples from Runs 14 and 15 with β-Fex Se phase present                 gen in a two-step grinding/sintering/annealing process [10].
at >90% exhibit superconductivity at Tc = 7.6 K and 7.5 K,                 Exceptions to this approach are Runs 23 and 24 of table 1.
respectively. The Tc values of samples from different synthesis            In these examples, we show that a complex mixture of FeSe
runs are provided in supplementary information (table S2) .                phases synthesized at low temperature, for short sintering peri-
The highest Tc value obtained for these samples is for Run 3               ods (5 h) at 300 ◦ C may be converted to β-Fex Se by re-
at 8.2 K. Samples from this run contain ∼20% δ-Fe0.92(1) Se                sintering at 380 ◦ C or 400 ◦ C for 10 h. Our study departs from
and ∼76% β-Fe1.02(1) Se.                                                   the syntheses by Onar and Yakinci [25], some experiments by

                                                                       6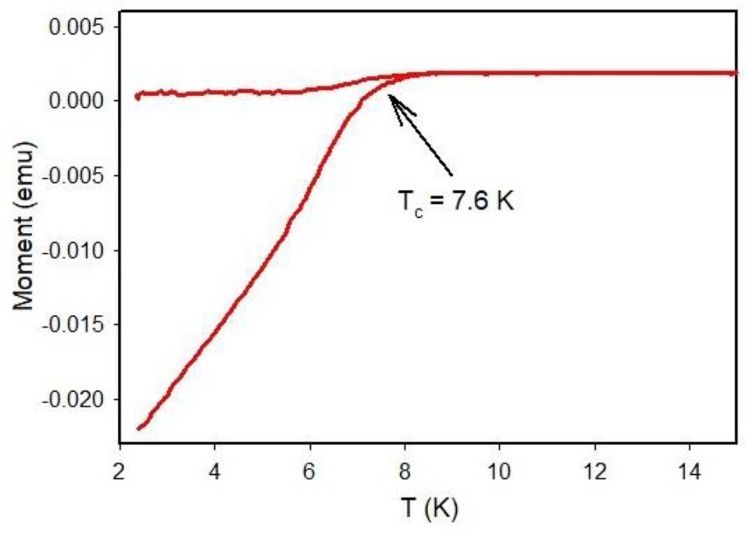
Supercond. Sci. Technol. 33 (2020) 075003                                                                                      M Shahbazi et al

                                                                         Figure 3. BSE imaging for (a) Run 20 sintered at 320 ◦ C for 5 h
                                                                         without annealing and (b) Run 18 sintered at 330 ◦ C for 10 h
                                                                         without annealing. Both β-Fex Se and δ-Fex Se occur with
                                                                         development of larger grains in (b). Note presence of many high
                                                                         brightness, nano-scale particles inferred as Se formed from liquid
                                                                         phase.

Figure 2. Microstructures using BSE imaging for (a) Run 8 sintered
at 480 ◦ C for 15 h without annealing and (b) Run 11 sintered at         also performed syntheses in which starting materials are held
720 ◦ C for 24 h and annealed at 420 ◦ C for 24 h. Red circles           at 1085 ◦ C for 24–48 h with subsequent slow (3 ◦ C hr-1 to
indicate locations for EPMA analyses. Note the larger size and
euhedral definition for grains of both FeSe phases in (b).               1020 ◦ C) and long period (>24 h) cooling regimes to 340 ◦ C
                                                                         prior to quenching. Samples produced by this process resul-
                                                                         ted in proportions of β-Fex Se ranging from 61% to 78% in
Grivel [11] and by Gawrlyk et al [14], in which sintering is             the final product and Tc ranging from 8.5 K to 6.3 K [14]. Of
a two-step process. In these works and this study, reactions             significance is the extensive annealing periods at 340 ◦ C. In
are predominantly below the transition temperature at which              other syntheses, Gawrlyk et al [14] noted that proportions of
elemental Se is a gas.                                                   β-Fex Se in products sintered at 700 ◦ C remained low (52% to
    A recent in situ synchrotron study on similar starting mater-        58%) except for samples sintered at 750 ◦ C with annealing at
ials to this study clearly demonstrates that Se is substantially         340 ◦ C.
in liquid form above 260 ◦ C and reacts with Fe to form                     Similar trends for sintering and annealing temperatures are
FeSe solids at higher temperatures [24]. Gawrlyk et al [14]              evident from the data provided in table S1 (supplementary

                                                                     7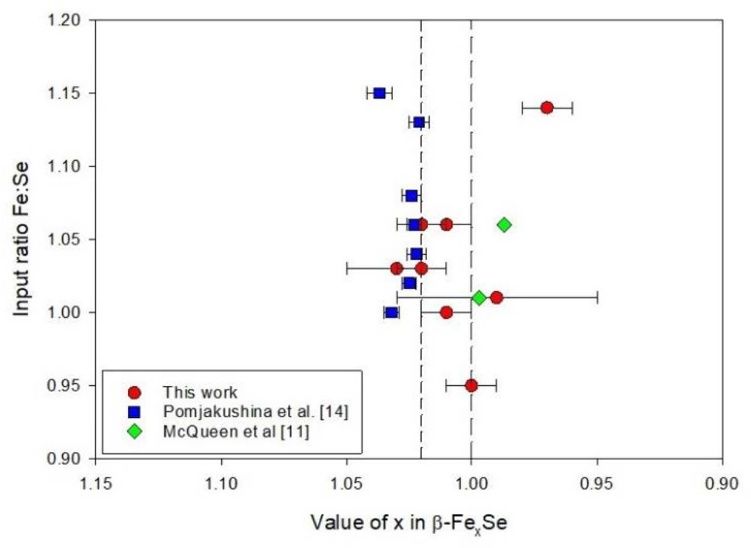
Supercond. Sci. Technol. 33 (2020) 075003                                                                                   M Shahbazi et al

                                                                            Collectively, the data from these syntheses suggests a link
                                                                         between sintering and annealing temperatures to obtain max-
                                                                         imum yield. For example, Pomjakushina et al [13] obtain
                                                                         maximum yield of 98.3(6)% for β-Fe1.02 Se after sintering at
                                                                         700 ◦ C and annealing at 400 ◦ C. On the other hand, using a
                                                                         similar process Gawrlyk et al [14] obtained maximum yield
                                                                         of 96% with sintering and annealing temperatures of 750 ◦ C
                                                                         and 340 ◦ C, respectively. From our syntheses shown in table 1,
                                                                         the maximum yield of β-Fe1.02±0.01 Se occurs at sintering and
                                                                         annealing temperatures of 690 ◦ C and 420 ◦ C, respectively.
                                                                            While the precise conditions for maximum yield of β-
                                                                         Fex Se in a single step process without the presence of any
                                                                         impurity is still elusive, diffusion processes define the Fex Se
                                                                         microstructure and resultant superconducting properties of
                                                                         orthorhombic FeSe. Evidence for the efficacy of diffusion pro-
                                                                         cesses in the formation of β-FeSe is elegantly provided by
Figure 4. Magnetic susceptibility of β-Fex Se from Run14 cooled to       Wang et al [26]. In this work, mm-scale tablets of β-FeSe are
 80%) of β-FeSe. Similar to observations           structures to that observed in figures 1 and 2 of this work
in previous studies [10, 13], excess Fe in the starting composi-         although at different magnifications. Careful attention to their
tion enhances formation of β-Fex Se (Runs 14 and 15; table 2).           BSE images suggests image contrast similar to figure 1(a) may

                                                                     8
Supercond. Sci. Technol. 33 (2020) 075003 M Shahbazi et al
be present, albeit resolution is not high and grain size contrast (a) refined Se occupancy and cell parameters and (b) refined
is indeterminate. cell parameters using Se occupancies assigned by EPMA data
The microstructure of un-annealed samples cooled from shown in table S1 (supplementary information). For method
their sintering temperature as shown in figure 1 and listed (a), we calculated the best fit of diffraction data in two stages
in table 1 show that two phases, β-Fex Se and δ-Fex Se, co- based on the weighted R factor: (i) cell dimension refinements
exist within large aggregates. Similarly, the microstructures while Se occupancy is fixed at 0.95 and at 1.0, respectively and
for annealed samples cooled from a range of sintering temper- (ii) refinement of Se occupancy based on best fit of cell refine-
atures show similar characteristics and clearly show that two ment. These data show a wide range of Se occupancy and Rwp
phases, β-Fex Se and δ-Fex Se, co-exist within large aggregates values as shown in supplementary information (table S5).
and are connected via interfacial boundaries. With a higher For method (b), supplementary information (table S6)
proportion of β-Fex Se determined by XRD (e.g. Run 14; shows the starting Fe:Se ratios for each synthesis, as well as
figure 2), image contrast is consistent across many aggregates the experimentally determined values for Se occupancy using
and the presence of δ-Fex Se is uncommon. EPMA. These refinements show strong correlation of cell
EBSD maps are useful tools to validate microstructural dimensions with reaction temperature for β-Fex Se and also for
interpretations based on image contrast because their charac- the complementary δ-Fex Se phase in the product even when in
ter depends on elastically scattered BSEs that have undergone low abundance. The standard errors determined for δ-Fex Se in
coherent Bragg scattering as they leave the specimen [29, 30]. Run 14 are significantly higher than other refinements due to
Figure 1(c) shows the relative proportions of β-Fex Se (∼70%) the poor XRD signal for this phase (∼3% present; table 1).
and δ-Fex Se (∼30%) in Run 9 based on cell dimensions and Linear regression analysis of the a cell dimension variation
also the orientations of individual grains within the aggreg- with sintering temperature for β-Fex Se gives an R2 = 0.997
ate (figure 1(d)). In this case, grain orientations are randomly and similarly, for δ-Fex Se, R2 = 0.995. In both cases, c axis
defined for either phase of Run 9 in comparison to the Euler refinements show a greater variation with Tmax for which
map for Run 14 (figure S1(d); supplementary information) R2 = 0.81 for β-Fex Se and R2 = 0.85 for δ-Fex Se. The a axes
which shows a higher proportion of preferred grain orienta- for β-Fex Se and δ-Fex Se show opposite trends with sintering
tions for β-Fex Se. temperature (figure S5; supplementary information).
McQueen et al [10] show that the ratio c/a for unit cell
parameters of β-Fex Se correlate with Tc in samples prepared
4.3. Stoichiometry of Fex Se at low temperature or with lower iron content. Samples with
The stoichiometry of FeSe phases and the presence of defects, c/a ∼ 1.464 or above show the highest values for Tc while
vacancies and interstitial ions has been subject to ongoing samples with values near 1.461 (and x = 1.03) do not show
discussion since early phase relation and structural studies superconductivity [10]. The c/a ratios for β-Fex Se samples
by Svendsen [31] and others. As noted by Svendsen [31], shown in table S6 are at or near 1.464 as well as for all ratios
these structures generally show iron vacancies as the Se con- obtained using other formats for XRD refinements noted above
tent increases. Neutron diffraction studies by McQueen et al (tables S3–S5; supplementary information). All β-Fex Se eval-
[10] and Pomjakushina et al [13], clearly demonstrate non- uated in this study using magnetization measurements showed
stoichiometric β-Fex Se occurs in reaction products. a superconducting transition.
Recent TEM and Selected Area Electron Diffraction
(SAED) studies on zero, one and two dimensional β-FeSe
identified three types of iron vacancy ordering in a tetragonal 4.3.2 Elemental Analyses. Similar to spatially precise elec-
lattice [23]. This study also excluded the possibility of order- tron diffraction studies that enable collection of crystallo-
ing of Fe interstitials and Se vacancies in each ordered super- graphic data from individual grains, use of spatially precise
lattice structure. These findings support earlier suggestions EPMA and EBSD data provides clarity on both the compos-
that compositional variations in the FeSe system near 50:50 ition and structure of individual grains in the Fe:Se system.
ratios are predominantly due to iron vacancy ordering [31]. The analyses listed in table S1 (supplementary information)
We use two approaches to estimate the stoichiometry of as well as shown in figures 1–3 and figures S1 and S2 show
FeSe phases in these reaction products. Firstly, for Runs 9, that two distinctive phases form within a narrow composition
11, 12 and 14, additional XRD patterns were obtained using range.
longer collection times and an internal corundum standard for Data on β-Fex Se stoichiometry suggests that even with sub-
calibration of peak positions. These data are used to refine cell stantial differences in starting ratios of Fe:Se as elemental
dimensions and Se occupancy for each FeSe phase identified powders, a tendency to drive the ratio of Fe:Se toward excess
by previous Rietveld analysis. Secondly, for the reactions lis- Fe in the final tetragonal product occurs for syntheses over a
ted in table S1 (supplementary information), detailed EPMA wide range of temperatures with and without annealing. This
analyses provide spatially precise compositions of individual tendency is illustrated in figure 6 in which initial Fe:Se ratios
grains within an aggregate. are plotted on the ordinate for reactions from this work (red
circles) as well as those of McQueen et al [10] (green dia-
monds) and Pomjakushina et al [13] (blue squares) against x.
4.3.1 XRD Refinement. Two refinement methods are eval- The data by McQueen et al [10] and Pomjakushina et al
uated using additional XRD data for Runs 9, 11, 12 and 14: [13] are based on refinements of neutron diffraction (ND) data
9Supercond. Sci. Technol. 33 (2020) 075003 M Shahbazi et al
magnetization is close to zero for samples from Runs 14 and
15, as can be expected from a decreased amount of δ-Fex Se
and residual Fe phases compared to other samples. This out-
come shows that improvement of superconducting properties
is dependent on optimization of reaction time, temperature
and in situ annealing in order to attain an appropriate stoi-
chiometry. Samples that are not annealed at 420 ◦ C show
higher positive background values for magnetization due to
higher levels of magnetic impurity phases.
4.4. Phase boundaries at Fe:Se ∼ 1
According to early studies of the FeSe system, the tetragonal
phase undergoes a peritectoid reaction with formation of δ-
FeSe and iron at 458 ◦ C [31]. A more recent compilation of
Figure 6. Initial ratios of Fe and Se used in syntheses of Fex Se thermodynamic data by Okamoto [9] suggests that the per-
plotted against the final product stoichiometry for reactions by itectoid temperature is either higher than 650 ◦ C or that δ-
Pomjakushina et al [13] (blue squares), McQueen et al [10] (green FeSe completely transforms to β-FeSe. Okamoto [9] encour-
diamonds) and this work (red circles). Error bars based on EPMA aged resolution of this ambiguity for β-FeSe and this has
analyses (this work) and on refined neutron diffraction data by been a consideration of some studies since discovery of the
Pomjakushina et al [13].
orthorhombic SC FeSe [2]. In addition, this early work pro-
posed that the β-FeSe form exists on the Fe-rich side of FeSe
for the β-Fex Se phase only. With few exceptions, Fe:Se start- stoichiometry with a homogeneity range from 49.0 to 49.4
ing ratios varying by up to 20% (either side of Fe:Se = 1.0) will atom% Se [9] (i.e. 51.0 to 50.6 atom % Fe; or ∆x = 0.017).
tend towards formation of β-Fex Se with a variation in estim- Subsequently, a narrow compositional range for β-Fex Se has
ated stoichiometry of less than 4%. This trend emphasises the been proposed by a number of researchers [2, 10, 13, 32].
conclusions by others [10, 13] that the properties of FeSe com- McQueen et al [10] propose that the tetragonal β-Fex Se
pounds are very sensitive to composition and order/disorder. phase is not stable above 455 ◦ C nor below 300 ◦ C [10].
In addition, these data show that a stable equilibrium phase in Instability above 455 ◦ C appears to confirm the suggestion by
this system, with or without the presence of other Fe or FeSe Okamoto [9] and Svendsen [31] that a peritectic transforma-
phases, is β-Fex Se. tion occurs above this temperature. However, experiments by
The heating/cooling profile for Run 14 resulted in the others [11–14, 24] and this study at temperatures up to 750 ◦ C
highest proportion of β-Fex Se in the product at 96% ± 4%. show that β-Fex Se forms above 455 ◦ C. In many cases, forma-
The stoichiometry of this phase determined by EPMA tion of β-Fex Se is accompanied by one other phase (e.g. α-Fe
is Fe1.02±0.01 Se (table S1; supplementary information). or δ-FeSe) at these higher temperatures. Even with secondary
This value is consistent with the optimum composition of phases present, β-Fex Se also results in transformation to the
Fe1.020±0.003 Se (translating to consistent nomenclature) [13] orthorhombic SC form when cooled below 9 K [11, 13] and as
and at Fe1.01±0.02 Se [10] determined using neutron diffraction. shown in this study. The presence of secondary phases such as
However, a substantial difference in the reaction products α-Fe and/or δ-Fex Se influences overall physical properties at
between the study by Pomjakushina et al [13] and this work low temperature but may not extinguish superconductivity.
relates to the proportion and type of secondary, or minor,
phases. Relatively high proportions of α-Fe (up to 12.5%) and
relatively low proportions of δ-Fex Se by Rietveld refinement 4.4.1. Microstructure and FeSe compositions. We show in
are reported [13] in comparison to lower proportions of α-Fe in figure 7 spatially and compositionally precise data for phases
this work. Where the proportions of both α-Fe and δ-Fex Se are obtained from reactions with different sintering temperatures
low [13], β-Fex Se is at the optimum composition noted above. (and times) and with/without annealing as listed in table 1.
Similarly, the optimum yield of β-Fex Se shows an iron-rich Figure 7 shows compositions for hexagonal (yellow circles)
stoichiometry at Fe1.02±0.01 Se in this work. and tetragonal (aqua squares) forms of Fex Se. Figure 7 also
Superconductivity was observed for all samples with identifies reactions that include annealing at 420 ◦ C for 24 h
predominant β-Fex Se phase (e.g. >70%) within the range (dark blue squares and green hexagons) which lie within the
6.8 K ≤ Tc ≤ 8.2 K. The normal state is characterised by a pos- same compositional range as sintered samples without anneal-
itive magnetization that increases with increasing hexagonal ing. Within the errors determined from multiple analyses of
δ-Fex Se and residual iron phase. This contribution is large both phases present in each reaction product, there is a clear
enough to prevent magnetization with negative values to 2 K compositional separation of the β-Fex Se and δ-Fex Se com-
for samples from Runs 1–13. However, samples from Runs ponents. This compositional trend with temperature of forma-
14 and 15 with β-Fex Se as a major phase exhibit supercon- tion, as well as the microstructures (figures 1–3), confirm that
ductivity at Tc = 7.6 K and 7.5 K, respectively. Normal state these phases co-exist within this temperature range.
10Supercond. Sci. Technol. 33 (2020) 075003 M Shahbazi et al
Figure 7. Plot of experimentally determined phase compositions for
the Fe–Se system (this work). Data for this plot are in Supplemental
Information (table S1). For each data point, the relevant Run
number (table 1) is designated ‘Rn’. β-Fex Se is designated by
squares, δ-Fex Se is designated by hexagons.
At these temperatures, β-Fex Se will be stable and, as shown
in figure 7 and by ND studies [13], will adopt a composition
within a very narrow range (±2 atom%). This strong tend-
ency to form β-Fex Se within a narrow composition range,
is consistent with data shown in figure 6. For similar sinter-
ing temperatures (e.g. ∼690 ◦ C), annealing reveals a poten-
tial dependence on starting ratios of Fe:Se, particularly in the
value of x for δ-Fex Se (c.f. Runs 14 and 15). Further data is
required to fully evaluate this aspect of FeSe phase formation.
The precise level and degree of vacancy ordering within β-
Fex Se will then depend on processing conditions such as sin-
tering and annealing temperatures and times. Clearly, slight
variations in processing conditions may give rise to substan-
tial shifts in superconducting properties as previously noted
[11, 23].
4.5. Revised phase diagram
Figure 8 shows extracts from Fe–Se phase diagrams developed
for the region Fe:Se ∼ 1 based on earlier studies and this work.
Both diagrams in figure 8 identify the location of the single
experiment (yellow diamond) undertaken by Grønvold [33]
that suggests a peritectic for β-Fex Se at 457 ◦ C for x = 1.04.
In the same report, Grønvold [33] notes a transformation from
tetragonal FeSe as the major phase to hexagonal FeSe between Figure 8. Phase diagrams for the Fe-Se system: (a) by Okamoto [9]
440 ◦ C and 465 ◦ C for x = 1.08 (i.e. 52 at % Fe). Special care based on early literature; and (b) modified from [13] based on
was taken during these experiments to eliminate loss of ele- syntheses in this study (blue lines). Experimental data points from
ments during a reaction [33]. However, the precise elemental this study (open circles), and the data point for the experiment by
Grønvold [33] at x = 1.04 are shown (yellow diamond).
composition of the equilibrium products is unclear and may be
based on an assumption that the stoichiometry is equivalent to
the ratio of initial starting materials. As noted above, such an
assumption may not be valid. These data define the upper limits of the phase diagram (e.g.
Figure 8(a) is a segment of the phase diagram for Fe-Se con- liquidus boundaries) and, in general, are based on XRD stud-
structed by Okamoto [9] based on calorimetric, Mossbauer and ies of equilibrium reaction products. Detailed analysis of the
crystallographic data on samples synthesised prior to 1990. compilation by Okamoto [9] suggests that few experiments
11Supercond. Sci. Technol. 33 (2020) 075003 M Shahbazi et al
have been performed in the region 500 ◦ C < T < 750 ◦ C for Contrary to earlier studies [10, 12, 13], the data in figure 7
1.5 < x < 0.92 (i.e. 60 at % Fe < x < 48 at % Fe). Key tie suggest that β-Fex Se may also form on the iron-poor side of
lines from the α-Fe end member are identified by experiment the phase diagram. Okamoto [9] notes in the description of
but the vertical boundary for α-Fe and δ-FeSe reproduced in phase boundaries for δ-FeSe, that an unusual eutectoid reac-
figure 8(a) shows limited data [9]. tion at 53.3 atom % Se (i.e. 48.7 atom % Fe) is, in essence,
The experiments by Pomjakushina et al [13] show that β- the transformation of δ-FeSe to β-FeSe + δ-FeSe that occurs
Fex Se forms at 700 ◦ C for 1.037 < x < 1.021 albeit in the at 350 ◦ C. The Se-rich boundary of this two-phase region is
presence of α-Fe and that these β-Fex Se stoichiometries res- shown in figure 8(b) to ∼47 atom % Fe (i.e. ∼53 atom % Se).
ult in a superconducting compound when cooled below 9 K. The data shown in figure 7 for x ∼ 0.90 (i.e. 47.5–47.0 at %
A more recent interpretation of the Fe–Se phase diagram that Fe) at ∼330 ◦ C to ∼750 ◦ C adds support to this earlier inter-
incorporates recent experimental data on β-Fex Se [10, 13] is pretation of the Fe–Se phase diagram [9].
provided for reference in supplementary information (figure Finally, we have no data from this study on the composition
S6). Figure S6 presents two views on the stability field for β- nor microstructure of phases for x > 1.02 and at temperatures
Fex Se when annealed at 400 ◦ C [13] and between 300 ◦ C and below 457 ◦ C. Hence, we propose that this region of the phase
500 ◦ C [10]. These views are the inferred phase boundaries diagram requires further investigation. We also recognise that
by Pomjakushina et al [13] and that determined by McQueen more precise methods of analysis may shed further light on
et al [10]. According to McQueen et al [10], β-Fex Se slowly the specific nature of the peritectic described in early literature
converts to δ-Fex Se below 300 ◦ C. [9, 10, 13, 33].
Data from this study and a recent in-situ experiment using
synchrotron XRD [24], suggests that β-Fex Se forms via other
FeSe phases (e.g. FeSe2, Fe3 Se4 , and hexagonal γ-Fe7 Se8 ) 5. Conclusions
on heating Fe and Se powders from 25 ◦ C to above 300 ◦ C.
Radiant cooling from ∼450 ◦ C does not induce a phase Previous work on the synthesis of β-Fex Se, the precursor
change in the final products formed below 300 ◦ C [24]. Dif- phase that transitions to an orthorhombic SC phase below 9 K,
ferences in structural form of these FeSe compounds at low identified a narrow range of x values for optimum yield (i.e.
temperature may be due to substantial variations in anneal- ∆x = 0.017). In this work, syntheses under non-oxidising con-
ing/cooling times and consequent ordering of interstitials or ditions between 300 ◦ C and 750 ◦ C for a range of Fe:Se ratios
vacancies [10]. of starting elements, show that β-Fex Se forms over a wider
Earlier Mossbauer studies suggest that FeSe alloys with 4 range of x values (i.e. ∆x = 0.06; or ∼1.5 at %) and tem-
to 25 at % Se (i.e. 96 to 75 at % Fe; outside the field of ref- peratures in a two-phase field with δ-Fex Se. A second two-
erence in figure 8(b)) when quenched from 500 ◦ C to 650 ◦ C, phase field for β-Fex Se with α-Fe (∆x ∼ 0.02) at temperatures
are two phase: α-Fe and β-FeSe [34]. This result is consistent >460 ◦ C, and possibly lower, is inferred from previous studies
with the data presented by Pomjakushina et al [13] at 700 ◦ C [13] for ∼1.02 < x < ∼1.04. These syntheses are undertaken at
and would suggest that the extent of β-Fex Se may be greater temperatures that invoke, or are limited by, liquid phase diffu-
than previously identified. Unfortunately, analyses of the final sion of Se evident in microstructures and compositional ana-
product(s) were not undertaken by Jain et al [34]. lyses of individual grains.
Figure 8(b) incorporates the results from experiments lis- The stoichiometry of individual β-Fex Se grains at max-
ted in tables 1 and S1 (supplementary information) and leaves imum yield within the two-phase field is Fe1.02±0.01 Se
open the nature of the phase boundary at ∼770 ◦ C because as determined by EPMA analyses. This stoichiometry for
our data do not extend to higher temperatures. The iron- β-Fex Se is consistent with the optimum composition of
rich boundary β-Fex Se aligns closely with the notional peri- Fe1.020±0.003 Se [13] obtained via similar synthesis methods
tectic point at 457 ◦ C previously identified [10, 31]. For refer- and determined using neutron diffraction. An alternative syn-
ence, we re-plot in supplementary information (figure S7) the thesis method, using higher temperatures and longer anneal-
data from figure 7 with the stoichiometric values for β-Fex Se ing times, determined the optimum stoichiometry for the
determined by Pomjakushina et al [13]. tetragonal phase at Fe1.01±0.02 Se [10] also using neutron dif-
Using the sintering temperature for these data [13] and the fraction. In all previous studies, the presence of secondary
proportions of minor phases present in the final product, we phases such as α-Fe, Fe7 Se8 or δ-Fex Se is documented. In
annotate in figure 8(b) a boundary between the two phase this study, detailed microstructural and compositional ana-
regions at x ∼ 1.02 (i.e. ∼50.5 atom % Fe) where α-Fe lyses of 13 separate syntheses, correlated with phase iden-
becomes a predominant minor phase. We propose a two-phase tification using BSE imaging, show that β-Fex Se forms in
field for β-Fex Se and α-Fe for 457 ◦ C < Tmax < 700 ◦ C for conjunction with δ-Fex Se for 330 ◦ C < Tmax < 750 ◦ C and
x > 1.02 and locate a tentative phase boundary at x = 1.08 0.89 < x < 1.03 with or without annealing above 400 ◦ C. The
(i.e. 52 at % Fe). While we have not explored this region microstructures obtained in this work suggest the formation
of the phase diagram in detail, we suggest that the extent mechanism is via diffusion limited exsolution.
of this β-Fex Se and α-Fe two phase field also extends to Given the importance of the Fe–Se phase diagram to a
lower temperatures (below the 457 ◦ C line) [9]. As shown fundamental understanding of the superconducting properties
in figures 7 and 8(b), the two-phase field for β-Fex Se and δ- of chalcogenides, we suggest that a re-evaluation of phys-
Fex Se is positioned between 1.02 < x < 0.90. ical and chemical characteristics across a broader range of
12Supercond. Sci. Technol. 33 (2020) 075003 M Shahbazi et al
starting compositions and reaction temperatures may be use- [8] Schuster W, Mikler H and Komarek K L 1979 Monatsh.
ful. Key attributes that may benefit from further attention to Chem. 110 1153–70
detail include (i) clarification on the presence/absence of a per- [9] Okamoto H 1991 J. Phase Equilib. 12 383–9
[10] McQueen T M, Huang Q, Ksenofontov V, Felser C,
itectic transition at 457 ◦ C; (ii) extent of a two-phase field for Xu Q Zandbergen H et al 2009 Phys. Rev. B 79 014522
β-Fex Se with α-Fe at higher Fe at % values; (iii) relationship [11] Grivel J C 2017 Ceram. Int. 43 11474–80
of FeSe phases at Tmax < 330 ◦ C with annealing and (iv) nature [12] Guo Z, Zhang H, Han B, Feng X and Yuan W 2015 AIP Adv.
of vacancy ordering with β-Fex Se stoichiometry. 5 027119
[13] Pomjakushina E, Conder K, Pomjakushin V, Bendele M and
Khasanov R 2009 Phys. Rev. B 80 024517
[14] Gawryluk D J, Fink-Finowicki J, Wiśniewski A, Puźniak R,
Acknowledgments Domukhovski V, Diduszko R, Kozłowski M and
Berkowski M 2011 Supercond. Sci. Technol. 24 065011
We are grateful to the Central Analytical Research Facility [15] Shahbazi M, Cathey H E and Mackinnon I D R 2018
within the Institute for Future Environments for access to Materials 11 480
characterization facilities. We appreciate sample preparation [16] Shahbazi M, Cathey H, Danilova N and Mackinnon I D R
2018 Materials 11 1259
skills of Chris East and Don McAuley who persisted with [17] Bruker (2014). DIFFRAC.TOPAS v5 technical reference
technique development and to Natalia Danilova for assistance manual. GermanyBruker AXS, K
with EBSD data collection. Detailed discussions with Prof [18] McCusker L B, Von Dreele R B, Cox D E, Louër D and
Jose Alarco on aspects of this work are greatly appreciated. Scardi P 1999 J. Appl. Crystallogr. 32 36–50
MS is grateful to the Queensland Government for an Advance [19] Probe for EPMA 2019 (available at: https://www.
probesoftware.com/)
Queensland Research Fellowship in partnership with Siemens [20] Armstrong J T 1988 Microbeam Analysis pp 239–46
(Aust.) Pty Ltd. and QUT which partially supported this work. [21] Henke B L, Lee P, Tanaka T J, Shimabukuro R L and
Fujikawa B K 1982 At. Data Nucl. Data Tables 27 1
[22] Drouin D, Couture A R, Joly D, Tastet X, Aimez V and
ORCID iDs Gauvin R 2007 Scanning 29 92–101
[23] Chen T-K et al 2014 Proc. Natl Acad. Sci. 111 63–68
Mahboobeh Shahbazi https://orcid.org/0000-0003-0751- [24] Shahbazi M, Spratt H, Wang A, Brand H E A, Alarco J A and
2829 Mackinnon I D R 2020 Materials, submitted
Henrietta E Cathey https://orcid.org/0000-0003-3220- [25] Onar K and Yakinci M E 2015 J. Alloys Compd. 620 210–16
[26] Wang L, Zong T, Bo Z, Wang B, Tan Q, Xu J and Al. E 2015
2355 IEEE Trans. Appl. Supercond. 25 1–3
Ian D R Mackinnon https://orcid.org/0000-0002-0732- [27] Liu G, Li J and Chen K 2017 Acta Mater. 122 187–98
8987 [28] Goldstein J 2003 Scanning Electron Microscopy and X-ray
Microanalysis (Dordrecht, New York: Kluwer Academic,
Plenum Publishers)
References [29] Inkson B J 2016 Materials Characterization Using
Nondestructive Evaluation (NDE) Methods eds G
[1] Yuan H, Kong L, Li T and Zhang Q 2017 Chin. Chem. Lett. Hübschen, I Altpeter, R Tschuncky and H-G Herrmann
28 2180–94 (Amsterdam: Woodhead Publishing) No. 88 ch. 2 17–43
[2] Hsu F-C et al 2008 Proc. Natl Acad. Sci. 105 14262–4 [30] Zaefferer S, Elhami N N and Konijnenberg P 2012 Phase
[3] Kamihara Y, Watanabe T, Hirano M and Hosono H 2008 Transformations in Steels Vol. 2, eds E Pereloma and D V
J. Am. Chem. Soc. 130 3296–7 Edmonds (Amsterdam: Woodhead Publishing) pp 557–87
[4] Mizuguchi Y, Tomioka F, Tsuda S, Yamaguchi T and [31] Svendsen S R 1972 Acta Chem. Scand. 26 3757–74
Takano Y 2009 J. Phys. Soc. Jpn. 78 074712 [32] Rasche B, Yang M, Nikonow L, Cooper J F K,
[5] Chang -C-C, Wang C-H, Wen M-H, Wu Y-R, Hsieh Y-T and Murray C ADay S J et al 2019 Angew. Chem., Int. Ed.
Wu M-K 2012 Solid State Commun. 152 649–52 (http://doi.org/10.1002/anie.201907426)
[6] Si Q, Yu R and Abrahams E 2016 Nat. Rev. Mater. 1 16017 [33] Grønvold F 1968 Acta Chem. Scand. 22 1219–40
[7] Marchionini B G, Yamada Y, Martini L and Ohsaki H 2017 [34] Jain B K, Singh A K and Chandra K 1978 J. Phys. F: Met.
IEEE Trans. Appl. Supercond. 27 1–7 Phys. 8 2625–30
13You can also read