Ionophore-mediated swelling of erythrocytes as a therapeutic mechanism in sickle cell disease
←
→
Page content transcription
If your browser does not render page correctly, please read the page content below
Ionophore-mediated swelling of erythrocytes as a
therapeutic mechanism in sickle cell disease

by Athena C. Geisness, Melissa Azul, Dillon Williams, Hannah Szafraniec,
Daniel C. De Souza, John M. Higgins, and David K. Wood

Received: March 8, 2021.
Accepted: October 18, 2021.

Citation: Athena C. Geisness, Melissa Azul, Dillon Williams, Hannah Szafraniec,
Daniel C. De Souza, John M. Higgins, and David K. Wood. Ionophore-mediated swelling
of erythrocytes as a therapeutic mechanism in sickle cell disease.
Haematologica. 2021 Oct 28. doi: 10.3324/haematol.2021.278666. [Epub ahead of print]

Publisher's Disclaimer.
E-publishing ahead of print is increasingly important for the rapid dissemination of science.
Haematologica is, therefore, E-publishing PDF files of an early version of manuscripts that
have completed a regular peer review and have been accepted for publication. E-publishing
of this PDF file has been approved by the authors. After having E-published Ahead of Print,
manuscripts will then undergo technical and English editing, typesetting, proof correction and
be presented for the authors' final approval; the final version of the manuscript will then
appear in a regular issue of the journal. All legal disclaimers that apply to the
journal also pertain to this production process.
Ionophore-mediated swelling of erythrocytes as a therapeutic mechanism in sickle cell
disease

Athena C. Geisness1*, Melissa Azul1,2*, Dillon Williams1, Hannah Szafraniec1, Daniel C. De
Souza3, John M. Higgins3,4,5, and David K. Wood1**
1
 Department of Biomedical Engineering, University of Minnesota Twin Cities, Minneapolis, MN
55455
2
Department of Pediatric and Adolescent Medicine, Division of Pediatric Hematology-Oncology,
Mayo Clinic, Rochester, MN 55905
3
    Department of Systems Biology, Harvard Medical School, Boston, MA 02115
4
Department of Pathology, Massachusetts General Hospital, Harvard Medical School, Boston,
MA 02115
5
Center for Systems Biology, Massachusetts General Hospital, Harvard Medical School, Boston,
MA 02115
*Contributed equally as authors
**Correspondence should be addressed to: dkwood@umn.edu

Acknowledgments
       Portions of this work were conducted in the Minnesota Nano Center, which is supported
by the National Science Foundation through the National Nano Coordinated Infrastructure
Network (NNCI) under Award Number ECCS-1542202. We would like to thank National Heart
Lung and Blood Institute for their support under Grant No. and HL132906, and Chhaya Patel
and Hasmukh Patel for assistance with blood sample collection according to IRB protocol
2006P000066/PHS and STUDY0000003. There are no conflicts of interest to disclose.

Word count: 3682       Abstract (235) Text (3678)   Fig (4) Table (1)
Supplementary Files: 1

Contributions
ACG, MA, DW, HS, and DCD performed research and data analysis. ACG, DW, HS, DCD,
JMH and DKW designed the studies. ACG, MA, DW, DCD, JMH and DKW wrote the
manuscript.

Disclosures
The authors have nothing to disclose.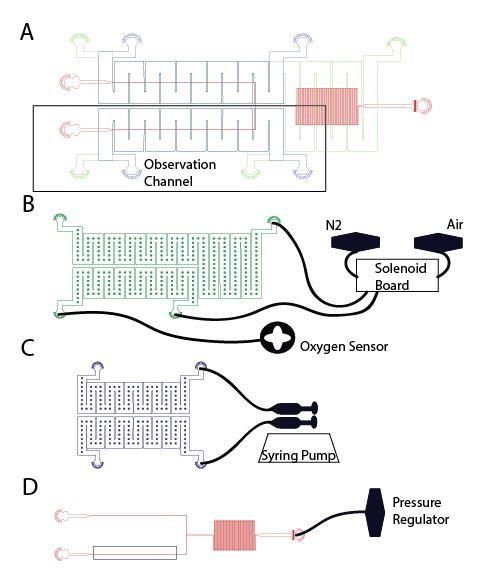
Abstract
         Sickle cell disease (SCD) is characterized by sickle hemoglobin (HbS) which
polymerizes under deoxygenated conditions to form a stiff, sickled erythrocyte. The dehydration
of sickle erythrocytes increases intracellular HbS concentration and the propensity of erythrocyte
sickling. Prevention of this mechanism may provide a target for potential SCD therapy
investigation. Ionophores such as monensin can increase erythrocyte sodium permeability by
facilitating its transmembrane transport, leading to osmotic swelling of the erythrocyte and
decreased hemoglobin concentration. In this study, we treated thirteen blood samples from
patients with SCD with 10 nM of monensin ex vivo. We measured changes in cell volume and
hemoglobin concentration in response to monensin treatment, and we perfused treated blood
samples through a microfluidic device that permits quantification of blood flow under controlled
hypoxia. Monensin treatment led to increases in cell volume and reductions in hemoglobin
concentration in most blood samples, though the degree of response varied across samples.
Monensin treated samples also demonstrated reduced blood flow impairment under hypoxic
conditions relative to untreated controls. Moreover, here was a significant correlation between
the improvement in blood flow and the decrease in hemoglobin concentration. Thus, our results
demonstrate that a reduction in intracellular HbS concentration by osmotic swelling improves
blood flow under hypoxic conditions. Although the toxicity of monensin prevents it from being a
viable clinical treatment, these results suggest that osmotic swelling should be investigated
further as a potential mechanism for SCD therapy.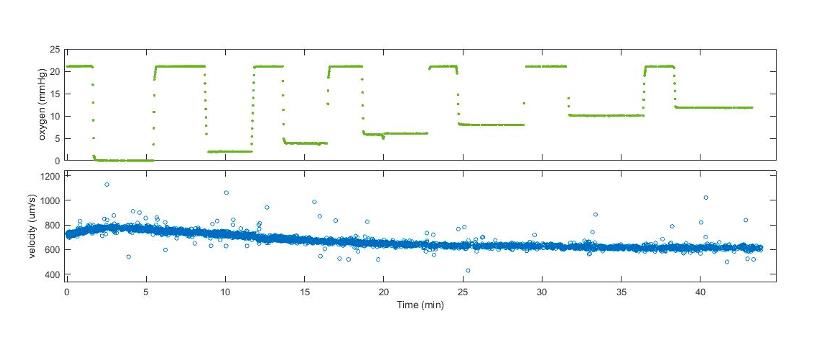
Introduction
        Sickle cell disease (SCD) is an inherited blood disorder that affects approximately
100,000 Americans in the United States and decreases a patient’s life expectancy by 30 years1.
The disease is caused by a genetic mutation in the beta globin gene which produces sickle
hemoglobin (HbS). HbS can polymerize under deoxygenated conditions forming stiff, sickled
red blood cells (sRBC)2. The presence of sRBCs contributes to the key elements of SCD
pathology: hemoglobin polymerization, endothelial dysfunction, sterile inflammation, leading to
overall disruption of blood flow particularly in the microvasculature3. These processes ultimately
give rise to the vast clinical manifestations seen in SCD including vaso-occlusive episodes
(VOE), acute chest syndrome, and stroke. The complex pathophysiology of SCD requires the
development of treatments that target one or more of the molecular disease pathology
mechanisms4-5.
        Given that HbS polymerization is essential in the pathophysiology of SCD, treatments to
prevent HbS polymerization continue to be an area of investigation for therapeutic development6-
8
  . Hydroxyurea, the first drug approved by the Food and Drug Administration (FDA) for the
treatment of SCD, induces production of fetal hemoglobin (HbF), an anti-sickling hemoglobin.
Though available for decades, patients treated with hydroxyurea experience variable clinical
benefit and are subject to ongoing monitoring given its hematologic side effects9. Recently,
another anti-sickling agent, voxelotor, was approved by the FDA for the treatment of SCD.
Voxelotor stabilizes the oxygenated form of HbS by increasing hemoglobin’s oxygen affinity,
preventing polymerization when exposed to deoxygenated conditions10,11. Research is still
ongoing to determine voxelotor’s potential side effects and clinical benefit. In its phase III
clinical trial, patients randomized to receiving voxelotor did experience an increase in
hemoglobin after 6 months of use, but they did not have a reduction in VOEs11. While treatments
that inhibit polymerization such as voxelotor or hydroxyurea have been successful, therapeutics
that target polymerization without affecting hemoglobin oxygen affinity or targeting the
hematopoietic niche may provide similar clinical benefit without the side effects seen with these
drugs.
        An alternative mechanism to inhibit HbS polymerization is the reduction of intracellular
HbS concentration within a sRBC. Small decreases in HbS concentration can lead to slower
polymerization rates that are longer than sRBC capillary transit time8,12. Previous studies to
reduce HbS concentration include using antidiuretic hormone and a low sodium (Na) diet to
reduce plasma osmolality and Na concentration. This caused hypotonic swelling of sRBCs and a
reduction in mean cell hemoglobin concentration (MCHC), ultimately leading to decreased
erythrocyte sickling observed in 3 patients13. However, maintaining the necessary level of
hyponatremia was impractical and results could not be reproduced in later studies14,15. Rather
than decreasing plasma sodium and osmolality as a method to reduce MCHC and HbS
polymerization, increasing intracellular sodium and osmolality may be more feasible. This
produces similar osmotic swelling effects and decreases MCHC without the difficulties of
sustaining low plasma Na concentrations. To study this mechanism and its potential benefit in
SCD, ionophores that increase the erythrocyte permeability to Na, such as monensin, can be used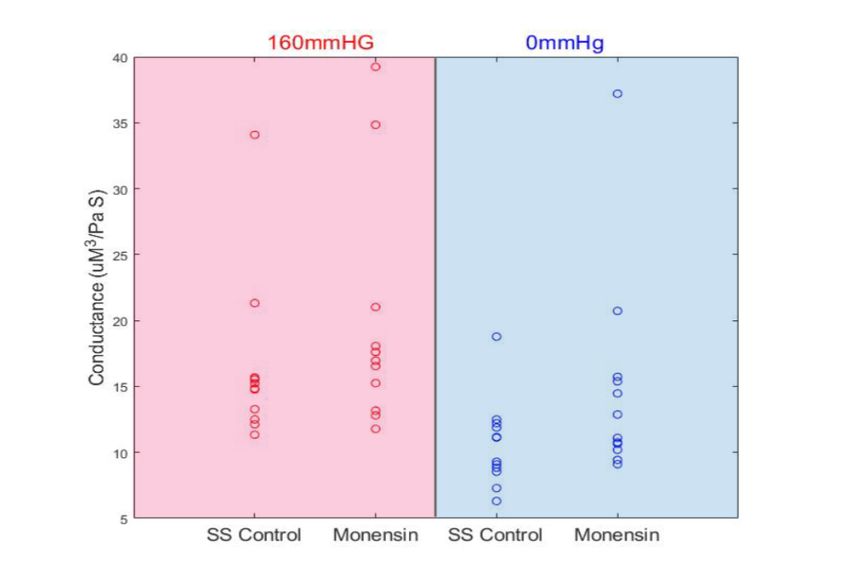
to facilitate intracellular Na transport. Monensin selectively binds to Na+ ions and facilitates its
electrogenic transport across the erythrocyte membrane, creating an osmotic gradient and
causing an influx of fluid intracellularly16-18. Previous work in sRBCs treated with monensin
have demonstrated that monensin is effective at increasing mean corpuscular volume (MCV),
decreasing MCHC, and increasing deformability of sRBCs19-21. These studies provided a basis
for understanding the molecular effects of monensin on RBCs, however they did not examine
how these molecular changes impact the mechanics of RBC flow under physiologic conditions.
         In this study, we use monensin as a model compound to investigate osmotic swelling to
reduce MCHC as a potential mechanism for SCD therapy development. We aim to characterize
the effects of sRBC osmotic swelling and reduced MCHC on sRBC rheologic oxygen
dependence using a microfluidic device designed to recapitulate the physiological environment
of the microvasculature. We compare the rheological response to hypoxia in our microfluidic
device between blood samples treated with monensin and untreated controls. To further quantify
its effect, we correlate MCV, MCHC, and the rheological response to hypoxia. By studying the
effect monensin may have on rheology, we build upon previous monensin studies and are now
able to better capture the complex pathophysiologic changes in blood flow that occur with
deoxygenated conditions in a physiologically relevant system, gaining a more comprehensive
understanding of the potential therapeutic mechanism and its in vivo effects.
Methods
Monensin Treatment
       All study protocols were approved by the Institutional Review Board (IRB). In
preparation for monensin treatment (Fig 1A), RBCs were washed three times by centrifugation in
Buffer A solution (104mM NaCl, 32mM Na2HPO4, 8mM KH2PO4, 5.5mM dextrose, 1g/L BSA;
pH 7.4, 305mOsm) with techniques previously published18. Dextrose and BSA components of
the Buffer A solution were added on the day of experiments. Samples were resuspended in
Buffer A with 0.01% EtOH and 10nM monensin (420701, BioLegend) to achieve 25%
hematocrit (hct) and incubated at 37°C for 12hrs. A concentration of 10 nM monensin was
chosen based on previous studies demonstrating optimal cellular effect without increased
hemolysis19. Preliminary research shows that incubation in Buffer A between 6 and 24hrs limits
RBC swelling in controls to less than 5% MCV. While the effect of 0.01% EtOH on RBCs has
been previously studied to be insignificant22-24, a control resuspended in Buffer A and 0.01%
EtOH was used for each sample in this study. After incubation, the sample was washed with
phosphate buffered saline (PBS) to remove extracellular monensin and resuspended in PBS to
achieve 25% hct prior to rheology measurements. Details of blood sample collection, storage,
and methods of obtaining laboratory values are provided in the supplement.
Data Collection and Analysis
        Device design, fabrication, and experimental set up have been previously published24-26
and is detailed in the supplement. Continuous rheological data were captured using a high-speed
camera (GS3-U3-23S6M-C, FLIR) at a frame rate of 500-600 FPS (frames per second) at 40x
magnification. Blood flow velocity measurements were collected using a contrast detection
algorithm developed in MATLAB based on the Kanade-Lucas-Tomasi algorithm27-29. The
velocity of thousands of contrasting points per frame were identified and averaged to obtain an
average velocity per frame. Representative data in figure 1B demonstrates blood flow velocity
under normoxic and hypoxic conditions for a control and monensin treated sample. Each sample
was exposed to 1 minute of normoxia (160 mmHg) and then 1 minute of hypoxia (0 mmHg).
This oxygenation-deoxygenation cycle was then repeated for a total of 3 cycles. Average steady
state (SS) velocity at normoxia or hypoxia was determined by averaging the velocities of the 3
cycles at each oxygen tension for each sample. The average SS velocity value was used to
determine two velocity metrics used for analysis: velocity response and recovery. Velocity
response is defined by the difference between the average SS velocity at 160mmHg and 0 mmHg
oxygen. The response is normalized by the sample’s average velocity at 160mmHg oxygen
tension (Fig 1C) and indicates the magnitude of velocity reduction during deoxygenation.
Velocity recovery is defined by the difference in velocity response between treatment and the
untreated control and indicates the change in velocity reduction during deoxygenation due to
treatment.
Statistical analysis
A Wilcoxon signed-rank test is used to establish significant difference between control
and treatment groups (n=13) A Pearson’s product moment correlation coefficient is used to
describe the linear correlation (n=13). Significance was defined by a p < 0.05.
Results
MCHC Strongly Correlates with Rheologic Response to Hypoxia
A total of 13 samples from patients with SCD were obtained and used in
experimentation. A summary of corresponding patient demographic, clinical, and baseline
laboratory data are shown in Table 1. Several different sickle cell genotypes were included in
the cohort. When oxygenation was decreased from 160mmHg to 0mmHg, all untreated sickle
samples responded with velocity reduction to a specific steady state velocity. When oxygen
tension was restored back to 160mmHg, blood flow velocity then increased and returned to its
SS velocity prior to deoxygenation. Similar velocity response was replicated with repeated
cycles of deoxygenation. The conductance of each sample at normoxia and hypoxia were
calculated in each treatment condition to ensure non-significant differences in sample
preparation and device variability between experiments (Supplement, Fig S2). In contrast,
oxygen-dependent velocity was not observed in healthy, AA, blood controls (Supplement, Fig
S3a). To identify a parameter which may dictate a sample’s velocity response to hypoxia, we
first determined if MCHC and MCV were independent variables within the thirteen untreated
sickle samples. There was no correlation between MCV and MCHC (Fig 2A, r=-0.008,
p=0.982), as MCHC is maintained between 30-36g/dL within RBCs of varying sizes. These
MCHC values are consistent with low to normal adult MCHC values typically seen in SCD30 and
support previous work demonstrating that native MCV values have no correlation with native
MCHC values in SCD31. This supports that MCV and MCHC are likely independent variables
and may individually influence the rheological response. To determine the influence of thesevariables on samples’ velocity response, we compared MCV or MCHC with each sample’s
velocity response. There is a slight negative relationship between velocity response and MCV
amongst the thirteen untreated samples, though this correlation was not significant (Fig 2B, r=-
0.13, p=0.660). There was, however, a significant positive relationship when correlating velocity
response and MCHC (Fig 2C, r=0.83, p=0.001), as untreated samples with lower MCHCs had
smaller velocity responses when exposed to hypoxia. Collectively, this data corroborates
previous work by others demonstrating that cell volume does not strongly correlate with the
rheological response and rather it is hemoglobin concentration that is strongly correlated with
sample blood flow response32.
Monensin Increases sRBC MCV, Decreases MCHC, and Reduces Hypoxia-induced
Polymerization
To determine the effect of monensin on sRBCs, MCV and MCHC values pre- and post-
treatment were collected of all 13 SCD samples and shown in figures 3A-3B. Overall, the
monensin treated samples had significantly increased MCV (Fig 3A) and decreased MCHC (Fig
3B) when compared to the controls (pcontrols (p
therapeutic development. Using our microfluidic platform, we were able to observe and quantify
monensin’s effect of reduced MCHC on blood flow by measuring rheologic variables in a
dynamic, physiologically relevant system. In our study, we not only found that monensin
decreased MCHC, but we also report that it significantly decreased the sensitivity of SCD blood
flow to hypoxia compared to controls. The velocity recovery with monensin treatment varied
between samples which correlated to the variation in monensin-induced changes in MCHC.
Through the rheological measurements obtained in this study, we provide both novel insight into
the capability of this mechanism in the prevention of vaso-occlusion but also provide findings to
suggest patient response variability.
        While osmotic swelling and increases in MCV is the primary effect of the ionophore
treatment, we found that the magnitude of MCHC reduction is the primary parameter modifying
blood flow response to hypoxia. This is demonstrated by the significant correlation found
between reduction in MCHC and reduction in velocity response (Fig 4C). When comparing
response with MCV, the relationship is not as strongly correlated (Fig 4B). This corroborates
existing studies which demonstrate that polymerization rates are extremely dependent on HbS
concentration6-7. Additionally, we found that in the 4 samples that demonstrated insignificant
change in velocity response when treated with monensin compared to controls (Sample IDs 3, 5,
7, and 10), there was less than a 5% MCHC decrease. It is unclear what caused the observed
patient variability in MCV/MCHC response to monensin, however our data suggests that
decreasing the MCHC by 5% has a significant impact on the sample’s blood flow in hypoxia.
Future studies that examine reduction of MCHC as a mechanism for SCD treatment should use a
minimal threshold in MCHC reduction to guide drug efficacy.
        This study investigated the mechanism of osmotic swelling to decrease intracellular
MCHC thereby decreasing HbS polymerization. Similarly, previous SCD drug trials have
focused on decreasing intracellular MCHC by inhibiting ion channels that are involved in the
pathologic dehydration of sRBCs. Clotrimazole, an inhibitor of the Gardos channel which
contributes to sRBC water loss, demonstrated reduced sRBC dehydration, decreased MCHC, and
mild improvements in hemoglobin when taken by five SCD patients35,36. Patients on Senicapoc,
a similar Gardos channel inhibitor, also experienced significant increases in hemoglobin and
hematocrit in a phase II clinical trial. Despite these promising results, studies involving
Senicapoc were terminated early due to limited efficacy when no significant improvement in the
rate of VOEs were seen in those taking Senicapoc compared to those on placebo37. While
reductions in MCHC may correlate with reductions in polymerization-induced hemolysis and
increased hemoglobin, it does not appear to be as correlated to frequency of VOEs and implies
that hemolysis and vaso-occlusion are distinct, yet intertwined, pathologic mechanisms. Further,
although reductions in MCHC have been shown to decrease rigidity and stiffness of sRBCs38,
over-swelling of sRBCs by exposure to hypotonic solutions has also led to increased vaso-
occlusions in in vitro models39. Therefore, while the mechanism of osmotic swelling has been
beneficial to distinct aspects of SCD pathology, it may not be effective or potentially
problematic. Given that previous compounds have attempted to exploit a similar mechanism
tested in this study but have ultimately proven unsuccessful due to a lack of reduction in VOEs,
the ability to determine how a compound affects blood flow, particularly in deoxygenated
conditions like that of a VOE, is important in predicting its potential clinical success.
Therapeutics that demonstrate improvement in overall blood rheology rather than on a single
SCD pathophysiologic mechanism are likely to provide more benefit in reducing VOE
frequency. By using microfluidic technology in this study, we can characterize the effect of
monensin on velocity response and demonstrate that the mechanism improves rheological
behavior. Although monensin cannot be used as an agent for SCD treatment due to its lethal
complications identified by the OSHA Hazard Communication Standard (29 CFR 1910.1200),
this study motivates development of other compounds that may have similar osmotic swelling
effects on erythrocytes for SCD treatment.
A potential concerning side effect of this treatment mechanism includes increased blood
viscosity due to increased cell volume and hct. With increased viscosity, the potential for VOE is
amplified40. Viscosity, however, is dependent on several factors such as hct, RBC deformability
and aggregation40,41. Previous studies demonstrate with decreased MCHC, sRBC deformability
increases42. Additionally, it has been reported that cell stiffness has a greater influence on blood
viscosity than hct40 and as previously mentioned, monensin treatment has demonstrated
increased sRBC deformability when compared to untreated controls8. Patients treated with
hydroxyurea also experience an increase in MCV without association of worsening outcomes43.
Additionally, although our study does not control for post-monensin increase in hct, we still
demonstrate improved rheological behavior. Therefore, while osmotic sRBC swelling may
increase viscosity, RBC deformability appears to be stronger determining factor in overall blood
viscosity.
Our study is limited by primarily demonstrating correlative relationships with little
experimentation on causation. However, previous work demonstrating increases in RBC
deformability and decreases in sRBC fraction with monensin treatment, support the reduced
rheological response to hypoxia observed in this study. While we demonstrate that decreasing
MCHC by erythrocyte osmotic swelling successfully reduces sRBC oxygen dependent flow, this
study does not capture the complex biological interactions between the many other cellular
components involved in the pathophysiology of SCD. For example, in our experiments, we used
washed red cells rather than whole blood. Previous studies found that monensin had a reduced
effect on sRBCs in the presence of plasma and required significantly increased concentrations to
replicate improved deformability, indicating that the drug likely binds across plasma
constituents19. While using patient plasma may be helpful in determining concentration of
monensin to observe rheological improvement, this study was to demonstrate the efficacy of the
mechanism of MCHC reduction to improve sRBC rheological behavior. Should further studies
exploring this mechanism be conducted, or for future therapeutic development, agents that
specifically target RBC Na permeability by RBC-specific cation channels or transport would be
of priority to reduce effect on other potential cellular components. Additionally, the endothelium
is particularly of interest given that increased RBC deformability has been shown to increase
endothelial adhesion and may contribute to the occurrence of VOEs and clinical severity44,45.
Further studies examining the effect of MCHC reduction on adhesion and inflammation are
needed to assess the potential benefit of this therapeutic mechanism. As discovery of SCD
pathophysiology reveals more intricate biological pathways and multifaceted systemssimultaneously at play, the approach to treatment may require an equally multifaceted, multi-
drug approach. By combining a therapy that reduces MCHC and polymerization with an anti-
adhesion therapy, perhaps further benefit may be achieved. Studies are needed to determine the
advantages of a multi-agent approach, however similar strategies have already been successful in
HIV therapy, cardiology, and oncology.
Conclusion
The reduction of MCHC through osmotic swelling of a sickle erythrocyte can effectively
decrease the rheological dependence on oxygenation. Blood flow velocity measurements within
microfluidic channels, of physiologic dimensions, indicate a strong correlation between MCHC
reduction and reduction of blood flow sensitivity to hypoxia. These relationships may indicate
the potential efficacy of regulating MCHC as a targeted mechanism for SCD therapeutic
development.References
1. Piel FB, Steinberg MH, Rees DC. Sickle Cell Disease. N Engl J Med.
2017;376(16):1561-1573.
2. Barabino GA, Platt MO, Kaul DK. Sickle Cell Biomechanics. Annu Rev Biomed Eng.
2010;12:345-367.
3. Sundd P, Gladwin MT, Novelli EM. Pathophysiology of Sickle Cell Disease. Annu Rev
Pathol. 2019;14:263-292.
4. Riley TR, Boss A, McClain D, Riley TT. Review of Medication Therapy for the
Prevention of Sickle Cell Crisis. P T. 2018;43(7):417-437.
5. Matte A, Zorzi F, Mazzi F, Federti F, Olivieri O, Francheschi LD. New Therapeutic
Options for the Treatment of Sickle Cell Disease. Mediterr J Hematol Infect Dis.
2019;11(1):e2019002.
6. Ferrone FA. Polymerization and Sickle Cell Disease: A Molecular View.
Microcirculation. 2004;11(2):115-128.
7. Hofrichter J, Ross PD, Eation WA. Kinetics and Mechanism of Deoxyhemoglobin S
Gelation: A New Approach to Understanding Sickle Cell Disease. Proc Natl Acad Sci
USA. 1974;71(12):4864-4868.
8. Eaton WA, Bunn HF. Treating Sickle Cell Disease by Targeting HbS
Polymerization. Blood. 2017;129(20):2719-2726.
9. McGann PT, Ware RE. Hydroxyurea for Sickle Cell Anemia: What Have We Learned
and What Questions Still Remain?. Curr Opin Hematol. 2011;18(3):158-165.
10. Oksenberg D, Dufu K, Patel MP, et al. GBT440 Increases Haemoglobin Oxygen
Affinity, Reduces Sickling and Prolongs RBC Half-life in a Murine Model of Sickle Cell
Disease. Br J Haematol. 2016;175(1):141-153.
11. Vichinsky E, Hoppe CC, Ataga AI, et al. A Phase 3 Randomized Trial of Voxelotor in
Sickle Cell Disease. N Engl J Med. 2019;381(6):509-519.
12. Eaton WA, Hofrichter J. Hemoglobin S Gelation and Sickle Cell Disease. Blood.
1987;70(5):1245-1266.
13. Rosa RM, Bierer BE, Thomas R, et al. A study of Induced Hyponatremia in the
Prevention and Treatment of Sickle- Cell Crisis. N Engl J Med. 1980;303(20):1138-1143.
14. Leary M, Abramson N. Induced Hyponatremia for Sickle-cell Crisis. N Engl J Med.
1981;304(14):844-845.
15. Charache S, Walker WG. Failure of Desmopressin to Lower Serum Sodium or Prevent
Crisis in Patients with Sickle Cell Anemia. Blood. 1981;58(5):892-896.
16. Stillwell W. Chapter 19: Membrane Transport. An Introduction to Biological Membranes
2nd Edition. 2016;440-443.
17. Freedman JC. Chapter 4 - Ionophores in Planar Lipid Bilayers. Cell Physiology 4th
Edition. 2012;61-66.
18. Aowicki D, Huczyński A. Structure and Antimicrobial Properties of Monensin A and Its
Derivatives: Summary of the Achievements. Biomed Res Int. 2013;2013:742149.
19. Clark MR, Mohandas N, Shohet SB. Hydration of Sickle Cells Using the Sodium
Ionophore Monensin. A Model for Therapy. J Clin Invest. 1982;70(5):1074-1080.20. Li Q, Henry ER, Hofrichter J, et al. Kinetic Assay Shows That Increasing Red Cell
Volume Could Be A Treatment for Sickle Cell Disease. Proc Natl Acad Sci USA.
2017;114(5):E689-E696.
21. Lu L, Li Z, Li H, Li X, Vekilov PG, Karniadakis GE. Quantitative Prediction of
Erythrocyte Sickling for the Development of Advanced Sickle Cell Therapies. Sci Adv.
2019;5(8):eaax3905.
22. Sonmez M, Ince HY, Yalcin O, et al. The Effect of Alcohols on Red Blood Cell
Mechanical Properties and Membrane Fluidity Depends on Their Molecular Size. PLoS
One. 2013;8(9):e76579.
23. Lee S, Park H. Best-Popescu C, Jang S, Park Y. The Effects of Ethanol on the
Morphological and Biochemical Properties of Individual Human Red Blood Cells. PLoS
One. 2015;10(12):e0145327.
24. Wood DK, Soriano A, Mahadevan L, Higgins JM, Bhatia SN. A Biophysical Indicator of
Vaso-occlusive Risk in Sickle Cell Disease. Sci Transl Med. 2012;4(123):123ra26.
25. Lu X, Wood DK, Higgins JM. Deoxygenation Reduces Sickle Cell Blood Flow at
Arterial Oxygen Tension. Biophys J. 2016;110(12):2751-2758.
26. Valdez JM, Datta YH, Higgins JM, Wood DK. A Microfluidic Platform for Simultaneous
Quantification of Oxygen-dependent Viscosity and Shear Thinning in Sickle Cell Blood.
APL Bioeng. 2019;3(4):046102.
27. Lucas BD, Kanade T. An Iterative Image Registration Technique with an Application to
Stereo Vision. IJCAI. 1981;674-679.
28. Tomasi C, Kanade T. Detection and Tracking of Point Features. Carnegie Mellon
University Technical Report CMU-CS-91-132. 1999 April.
29. Shi J, Tomasi C. Good Features to Track. IEEE Conference on Computer Vision and
Pattern Recognition. 1994;593-600.
30. MCHC Blood Test – Low, High, What does it Mean. actforlibraries.org. 2017.
31. Serjeant G, Serjeant B, Stephens A, et al. Determinants of Haemoglobin Level in Steady-
state Homozygous Sickle Cell Disease. Br J Haematol. 1996:92(1):143-149.
32. Kaul DK, Liu XD. Rate of Deoxygenation Modulates Rheologic Behavior of Sickle Red
Blood Cells at a Given Mean Corpuscular Hemoglobin Concentration. Clin Hemorheol
Microcirc. 1999;21(2):125-135.
33. Di Caprio G, Schonbrun E, Goncalves BP, Valdez JM, Wood DK, Higgins JM. High-
throughput Assessment of Hemoglobin Polymer in Single Red Blood Cells from Sickle
Cell Patients Under Controlled Oxygen Tension. Proc Natl Acad Sci USA.
2019;116(50):25236-25242.
34. Sosa JM, Nielsen ND, Vignes SM, Tanya GC, Shevkoplyas SS. The Relationship
Between Red Blood Cell Deformability Metrics and Perfusion of an Artificial
Microvascular Network. Clin Hemorheol Microcirc. 2014;57(3):275-228.
35. Brugnara C, Gee B, Armsby CC, et al. Therapy with Oral Clotrimazole Induces
Inhibition of the Gardos Channel and Reduction of Erythrocyte Dehydration in Patients
with Sickle Cell Disease. J Clin Invest. 1996;97(5):1227-1234.
36. Brugnara C. Sickle Cell Dehydration: Pathophysiology and Therapeutic Applications.
Clin Hemorheol Microcirc. 2018;68(2-3):187-204.37. Ataga KI, Reid M, Ballas SK, et al. Improvements in Haemolysis and Indicators of
Erythrocyte Survival do not Correlate with Acute Vaso-occlusive Crises in Patients with
Sickle Cell Disease: A Phase III Randomized, Placebo-controlled, Double-blind Study of
the Gardos Channel Blocker Senicapoc (ICA-17043). Br J Haematol. 2011;153(1):92-
104.
38. Evans E, Mohandas N, Leung A. Static and Dynamic Rigidities of Normal and Sickle
Erythrocytes. Major Influence of Cell Hemoglobin Concentration. J Clin Invest.
1984;73(2):477-488.
39. Carden MA, Fay ME, Lu X, et al. Extracellular Fluid Tonicity Impacts Sickle Red Blood
Cell Deformability and Adhesion. Blood. 2017;130(24):2654-2663.
40. Connes P, Alexy T, Detterich, J, Romana M, Hardy-Dessources MD, Ballas SK. The
Role of Blood Rheology in Sickle Cell Disease. Blood Rev. 2016;30(2):111-118.
41. Nader E, Skinner S, Romana M, et al. Blood Rheology: Key Parameters, Impact on
Blood Flow, Role in Sickle Cell Disease and Effects of Exercise. Front Physiol.
2019;10:1329.
42. Chien S. Determinants of Blood Viscosity and Red Cell Deformability. Scand J Clin Lab
Invest. 1981;156:7-12.
43. Ferster A, Vermylen C, Cornu G, et al. Hydroxyurea for Treatment of Severe Sickle Cell
Anemia: A Pediatric Clinical Trial. Blood. 1996;88(6):1960-1964.
44. Hebbel RP, Moldow CF, Steinberg MH. Modulation of Erythrocyte-endothelial
Interactions and the Vaso-occlusive Severity of Sickling Disorders. Blood.
1981;58(5):947-952.
45. Kaul DK, Chen D, Zhan J. Adhesion of Sickle Cells to Vascular Endothelium is
Critically Dependent on Changes in Density and Shape of the Cells. Blood.
1994;83(10):3006-3007.
46. Sakariassen KS, Orning L, Turitto VT. The Impact of Blood Shear Rate on Arterial
Thrombus Formation. Future Sci OA. 2015;1(4):FSO30.Table 1. Patient Demographics and Laboratory Values
Variable N (13)
Genotype
SS 7
SC 2
SB0 3
SB+ 1
Age (years)
Median (range 23-42) 27
Sex
Male 6
Female 7
Hydroxyurea
Yes 12
No 1
Clinical History Median Range
Transfusion* 2 0–4
Hospitalizations* 1 0–2
Laboratory Values
Hematocrit (%) 21.9 13.1 – 24.1
MCV (fL) 101.4 73.0 – 119.3
MCHC (%) 33.3 29.7 – 36.2
HbA (%) 15.8 7.2 – 46
HbS (%) 67.8 38.2 – 86.5
HbF (%) 7.5 0.5 – 21.6
* # of transfusions or hospitalizations within the last yearFigure Legends Figure 1: Data collection and analysis. An overview of methods of sample preparation, data collection, and defining rheological variables used throughout the study. (A) Schematic of the monensin treatment workflow. (B) Representative image of raw velocity data (below) as it relates to oxygen tension (above) from a single SCD patient sample. In the bottom panel of (B), blood flow velocity is compared between monensin treatment (red) and the untreated control (blue). The average oxygenated shear rate during experiments was 355s-1, within physiologic range for channel dimensions46. In this sample, it appears that the velocity at normoxia of the monensin-treated condition is lower than that of the untreated condition. To address the differences in normoxic velocities between treatment conditions, conductance of all 13 samples was calculated to determine if additional variables were present contributing to normoxic velocities (Supplement, figure S3). There were no significant differences in conductance at normoxia between treatment conditions in all samples, indicating velocity differences at normoxia were related to driving pressure. (C) The oxygenated (160mmHg) and deoxygenated (0mmHg) sections of the collected velocity data in (B), normalized by the average oxygenated steady state velocity for the representative sample. The representative single patient data in (C) demonstrates a 13% velocity response for a monensin-treated sample and a 33% response for the untreated control. This corresponds to a velocity recovery of 20% after monensin treatment. Velocity response is calculated using the difference between oxygenated (160mmHg) and deoxygenated (0mmHg) velocities and velocity recovery is calculated by the difference in the control and monensin treated response. Figure 2: Dependent parameter analysis. Correlative data from 13 untreated SCD samples to determine the relationship, if any, between MCV and MCHC and each variable’s relation to sample velocity response. A Pearson correlation coefficient analysis was used to determine the strength of the linear relationship and a two-tailed analysis of the Pearson coefficient was used to determine significance of the correlation. (A) No correlation was identified between MCV and MCHC (r=-0.008, p=0.982), establishing MCV and MCHC as independent variables. (B) MCV as it relates to velocity response. No correlation was identified between MCV values and velocity response (r=-0.13, p=0.660). A slope of -0.001 and -0.1 are found in (A) and (B) respectively. The slope for these figures is provided for clarification of the scale for (A-B). (C) MCHC and velocity response had a significant correlation (r= 0.83, p
Change in MCV and change in MCHC was significantly positively correlated (r=0.91, p
Supplementary to Ionophore-mediated swelling of erythrocytes as a therapeutic
mechanism in sickle cell disease (Effect of osmotic swelling on sickle erythrocytes)

Supplemental Methods
Patient Sample Collection
        Blood samples were collected from patients with SCD or healthy volunteers for AA
controls during routine clinic visits in accordance with protocol 2006P000066/PHS and
STUDY0000003, approved by the University of Minnesota Medical Center Institutional Review
Board (IRB). Baseline laboratory measurements displayed in table 1 and supplementary table 1
were obtained in the clinic on the day of sample collection and values were provided by patients’
medical providers. Blood samples were collected and stored at 4°C in sodium citrate blood
collection tubes. Additional samples (n=3) used for morphology experiments were collected
from patients with SCD and stored in ethylenediaminetetraacetic acid (EDTA). Samples were
stored up to 5 days prior to treatment or experimentation.

Hematologic Parameter Analysis
       After monensin treatment, the sample’s complete blood count (CBC) was analyzed using
a Sysmex XS-1000i hematology analyzer, by the Advanced Research and Diagnostic Laboratory
(ARDL) at the University of Minnesota. Monensin effect on osmotic swelling and intracellular
water content was quantified by measuring MCHC and MCV.

Device Design and Fabrication
         Once samples were prepared and hematologic measurements made, samples were
perfused through a microfluidic device. The construction of similar devices has been described
previously1-3. The device is comprised of three polydimethylsiloxane (PDMS) (Sylgard 184,
Dow Corning) layers: a blood channel, hydration, and gas layer, shown in supplemental figure 1.
Each layer was designed to serve an intended function. The blood layer contains a channel which
splits into a bypass and observation channel each measuring 15µm x 15µm with a length of
10mm (Figure S1a). These dimensions approximate the physiological diameter of some post-
capillary venules within the microvasculature. The bypass channel was used to maintain flow to
prevent packing of RBCs in the observation channel during potential occlusions. Stacked over
the blood layer (Figure S1d) is a 100µm tall hydration layer (Figure S1c), where PBS is perfused
to prevent dehydration of the RBCs during experimentation. The gas channel (Figure S1b) is
150µm in height and lies on top of the previously described two layers. The oxygen permeability
of PDMS in this device has been previously reported3. Each layer is separated by a 100 µm
PDMS membrane.
         Device fabrication involves photolithography techniques and use of negative photoresist
(SU8, MicroChem) to create a silicon wafer master mold for each layer, as described in a
previous publication2. After developing the photoresist, wafers were salinized (448931-10G,
Sigma-Aldrich) to decrease adhesion of the PDMS to the wafer. Each layer was then made by
casting PDMS at an elastomer/curing agent ratio of 10:1 onto each master mold. For the gas
layer, PDMS was cast onto the master mold to achieve a thickness of approximately 5mm. For
the blood and hydration layers, previously described PDMS compression molding technique
created each layer’s individual thickness1-3. The PDMS layers were cured at 75°C for 2hrs. Inlets
and outlets of the device were created using 20-gauge punches. A plasma cleaner was used to
covalently bond each layer together by exposing PDMS surfaces for 2 minutes at a power of
100W. The entire device was then plasma bonded to a microscope glass slide. After plasma
treatment, the devices were dehydrated to ensure secure bonding by placing them on a hotplate
for 15 minutes.
Experimental Setup
Microfluidic devices were mounted on a temperature regulated (37°C) Zeiss Axio
Observer microscope. Specific oxygen tensions were selected and perfused through the gas layer
using a solenoid board and gas mixing system that mixed 160mmHg oxygen gas (21% O2, 5%
CO2, balance N2) with 0mmHg oxygen gas (5% CO2, balance N2). The partial pressure of
160mmHg oxygen is used to replicate ambient oxygen tension. While the physiologic oxygen
tension of the venous circulation is 30-40mmHg, 0mmHg is used to demonstrate extreme
hypoxic conditions to observe maximum sRBC sickling effect. The gas channel that overlays the
bypass channel remained at 160mmHg oxygen, while the gas channel overlaying the observation
channel was cycled between 160mmHg and 0mmHg oxygen at 3-5min intervals until a steady
state (SS) velocity was reached for 1 minute of SS data collection. SS velocity for each oxygen
cycle is defined by the period over which the maximum difference within the velocity values is
less than two standard deviations from the average. At the outlet of the observation and bypass
channel gas ports, a fiber optic oxygen sensor (NeoFox-GT, Ocean Optics) was used to
continuously monitor oxygen tensions throughout the experiment. PBS was perfused through
the hydration layer by a syringe pump (NE-500, New Era Pump Systems) at 500µm/s, to prevent
sRBC dehydration. A pressure regulator (PCD-15PSIG, Alicat Scientific) set to a constant PSI
perfused the blood through the device to achieve an initial velocity of 700µm/s at normoxia,
corresponding to a physiologically relevant venule shear rate of 373s-1.
Quantitative Absorptive Cytometry
Quantitative Absorptive Cytometry (QAC) platform was used as an assay to detect
polymer content and morphological changes induced by monensin-treatment. Three additional
samples from SCD patients were obtained using methods listed above. The hematological data
from these samples are listed in table 1 of this supplement. QAC builds off previous work
published by Di Caprio et al4 to quantify morphology of RBCs in high throughput manner under
variable oxygen tension. The optical absorption proprieties of oxygenated and deoxygenated
hemoglobin are leveraged to quantify the ratio of the two species. Single cell images are
recorded to calculate saturation from the ratio of oxy and dexoyhemoglobin, and the morphology
of the cells is analyzed by a convolution neural net to determine if the cells contain detectable
levels of polymer or if all hemoglobin is soluble.
QAC uses a previously developed microfluidic device in the Di Caprio study4. This
device consists of a blood layer with a 30mm straight channel and a 25mm diffusion section.
There is a 5mm imaging section. The diffusion section has a matrix of pillars to disperse the cells
and is sufficiently long for the cells to reach steady state saturation. The imaging section has 21,
30um channels to image individual cells. The gas layer on this device is a snaked channel that
overlays the diffusion and imaging section.
Samples are prepared with a washing step; 50 ul of the blood sample is added to 200ul of
PBS and spun at 2000 rpm for 2 minutes. A solution of 288 ul of 25 percent 7.4 pH albumin and
12 µl of 20 percent w/v acid blue 9 is added to 10 µL of the pellet to achieve a hematocrit of 3%.
In table S1, the hematologic parameters prior to resuspension are shown. Albumin is used forthis experiment to match the refractive index of the red cells as this is necessary for accurate
measuring of light attenuation.
The optical set up for QAC also builds off of Di Caprio's work. The main principal is red
cells are illuminated with alternating blue LEDS in the Soret band and a constant red LED. In the
Soret Band oxygenated hemoglobin has a peak absorption at 410nm and deoxygenated
hemoglobin has a peak absorption at 430nm. By alternating these two LEDs and capturing
images of the same cell at both wavelengths the mass of oxy and deoxyhemglobin is recorded
and the cell saturation is calculated using each species’ known extinction coefficient. The
constant red LED is used to calculate cell volume. The camera captures images in Bayer RGB
matrix with no color processing, thus the blue pixels of the matrix alternate between the two blue
LEDs and the red pixels capture the constant red light.
Images are captured at a rate of 200fps with each blue LED triggering at 100 fps. Raw
images are converted to uint8 matrices and are separated by red and blue color channels and
resized using MATLAB. A MATLAB script tracks cells and records the intensity of each cell at
410nm and 430 nm then takes the ratio to calculate cell saturation. The cell images for the two
blue LED frames and the red LED frame are combined and the morphology is analyzed by a
ResNet 50 neural net to classify the cell’s hemoglobin as soluble or polymerized.
Data collection proceeds as follows: flow is stabilized for 10 min at 160 mmHg oxygen
tension. After the settling time, 500 frame segments are captured, and the cell saturation is
calculated. This is done several times to ensure the cells have reached steady state saturation.
When steady state is reached 15000 frames are captured. This is repeated for 0, 15, 30, 45, 60,
and 90 mmHg oxygen tensions with 10 minutes between the 160 mmHg and 0 mmHg step and 5
minutes between the rest.References
1. Wood DK, Soriano A, Mahadevan L, Higgins JM, Bhatia SN. A biophysical indicator of
vaso-occlusive risk in sickle cell disease. Sci Transl Med. 2012, 4(123).
2. Lu X, Wood DK, Higgins JM. Deoxygenation Reduces Sickle Cell Blood Flow at
Arterial Oxygen Tension. Biophys J. 2016 110(12), 2751-2758.
3. Valdez JM, Datta YH, Higgins JM, and Wood DK. A microfluidic platform for
simultaneous quantification of oxygen-dependent viscosity and shear thinning in sickle
cell blood. APL Bioeng. 2019, 3(4) 046102.
4. Di Caprio G, Schonbrun E, Goncalves BP, Valdez JM, Wood DK, Higgins JM. High-
throughput assessment of hemoglobin polymer in single red blood cells from sickle cell
patients under controlled oxygen tension. Proc Natl Acad Sci USA. 2019;116(50):25236-
25242.Supplemental Figures S1: Device design and setup. Schematic of microfluidic device used in rheology experiments. (a) The blood channel (red) is split into two venule sized channels: bypass and observation. The middle and top layers contain the hydration channels (blue) and gas channels (green) that separate and overlay the bypass and observation channels in the blood layer distinctly. This enables independent control of oxygen tensions in each bypass and observation channel. The device was designed to overlay each layer with the layer below to enable vertical diffusion of oxygen through the device to the blood channel and prevent the transport of oxygen between the bypass and observation channels. Each layer is accessed using inlet and outlet ports. (b) A solenoid valve attached to compressed gas cylinders containing 95% N2 and 95% air balanced with CO2 were used to control the oxygen tension supplied to the bypass and observation channels. An oxygen sensor, at the outlet of the gas layer’s observation channel, was used to measure the oxygen tension inside the device. (c) PBS is perfused through both hydration channels by a double syringe pump. (d) A pressure regulator connected to the inlet of the blood channel was used to prefuse the blood at the desired oxygenated velocity. Data was collected using a highspeed camera to image a section of the observation channel.
S2: Experimental conductance. The conductance of untreated controls and monensin-treated
samples under oxygenated (160mmHg) and deoxygenated (0mmHg) conditions. A Wilcoxon
signed-rank test was used to determine if there is a significant difference between the control
group and monensin treatment. Conductance was calculated using the blood flow rate and
driving pressure. There was no significant difference between the control and monensin group
during oxygenation, however there was a significant difference under deoxygenation (p < 0.05,
n=13). This indicates differences in initial oxygenated velocities is negligible due to its
dependence on the driving pressure and that differences in deoxygenated velocities are not due to
differences in the initial velocities. The higher conductance points observed in normoxia in this
figure correspond to MCV values of 91.8 fL and 98.3 fL and are within the lower quartile of
MCV values within this study.
A

B                                                        C

S3: AA controls. (a) Representative image of raw velocity data from a single AA patient
sample. Oxygen tension (%) is displayed above in green and velocity (µm/sec) displayed in blue.
Despite various oxygen tensions, there is no velocity response, demonstrating oxygen-
independent velocity. This is in contrast to oxygen-dependent velocity response seen in sickle
samples (Figure 1b). Similar responses were seen when repeated with 2 additional AA samples
tested. (b) Monensin effect on MCV and MCHC in healthy AA blood. There were significant
increases in MCV (p=0.001) and decreases in MCHC (p=0.009) with monensin treatment.
Similar increases in MCV and decreases MCHC were seen in SCD patient samples (Figure 3a-
3b). (c) Summary of velocity response of 3 AA blood samples in the untreated and monensin-
treated conditions. There was no significant change in velocity response between treatment and
control conditions when exposed to hypoxia (p=0.874). A two-tailed paired t-test was used to
determine significance between untreated and monensin-treated groups in all comparisons.
A                                                   B

                                                                               1.1

                                                              Normailzed AUC
                                                                               1.0

                                                                               0.9

                                                                               0.8

                                                                               0.7

                                                                                                  in
                                                                                        ol
                                                                                      tr

                                                                                                 s
                                                                                              en
                                                                                     on

                                                                                             on
                                                                                 C

                                                                                          M
S4. RBC morphology analysis. A) Representative data from one SCD patient sample depicting
the fraction of polymerized cells as a function of oxygen tension with monensin treatment
(black) compared to untreated (gray) using QAC methodology. A lower fraction of polymerized
cells is seen in this sample with monensin treatment compared to untreated, with greatest
differences emerging around 30mmHg. (B) Similar curves to (A) were generated for two
additional SCD samples and the AUC between monensin-treated and their untreated controls
were measured and compared. AUC’s were normalized to the untreated control. Although
monensin-treated samples had smaller AUC’s signifying a lower polymerized fraction, sample
response varied and the difference was non-significant using a paired two-tailed t-test (1.00 vs
0.84, p=0.12).
Table S1. Hematological parameters of samples (HbSS) used in QAC
Condition WBC RBC HGB HCT MCV MCH MCHC PLT
(x10^3/µL) (x10^6/µL) (g/dL) (%) (fL) (pg) (g/dL) (x10^3/µL)
1 Whole Blood 14.8 9.2 26.7 85 34.5
Ethanol control 1.2 0.77 2.1 6.6 85.7 27.3 31.8 5
10 nM Monensin 0.6 0.72 2.1 6.8 94.4 29.2 30.9 0
2 Whole Blood
Ethanol control 3.8 0.87 2.8 7.7 88.5 32.2 36.4 0
10 nM Monensin 4.3 0.99 3.1 9.2 92.9 31.3 33.7 1
3 Whole Blood 8.92 22.8 110.7 33.8
Ethanol Control 0.2 0.5 1.7 5.5 110 34 30.9 0
10 nM Monensin 0.9 1.62 5.8 20.9 129 35.8 27.8 8You can also read