Catch trials in force field learning influence adaptation and consolidation of human motor memory
←
→
Page content transcription
If your browser does not render page correctly, please read the page content below
ORIGINAL RESEARCH ARTICLE
                                                                                                                               published: 21 April 2014
HUMAN NEUROSCIENCE                                                                                                     doi: 10.3389/fnhum.2014.00231

Catch trials in force field learning influence adaptation and
consolidation of human motor memory
Christian Stockinger*, Anne Focke and Thorsten Stein
YIG “Computational Motor Control and Learning”, BioMotion Center, Institute of Sports and Sports Science, Karlsruhe Institute of Technology, Karlsruhe, Germany

Edited by:                               Force field studies are a common tool to investigate motor adaptation and consolidation.
Rachael D. Seidler, University of        Thereby, subjects usually adapt their reaching movements to force field perturbations
Michigan, USA
                                         induced by a robotic device. In this context, so-called catch trials, in which the disturbing
Reviewed by:
                                         forces are randomly turned off, are commonly used to detect after-effects of motor
David W. Franklin, University of
Cambridge, UK                            adaptation. However, catch trials also produce sudden large motor errors that might
Fabrice Sarlegna, Centre National de     influence the motor adaptation and the consolidation process. Yet, the detailed influence
la Recherche Scientifique, France        of catch trials is far from clear. Thus, the aim of this study was to investigate the influence
*Correspondence:                         of catch trials on motor adaptation and consolidation in force field experiments. Therefore,
Christian Stockinger, BioMotion
                                         105 subjects adapted their reaching movements to robot-generated force fields. The test
Center, Institute of Sports and
Sports Science, Karlsruhe Institute      groups adapted their reaching movements to a force field A followed by learning a second
of Technology, Engler-Bunte-Ring 15,     interfering force field B before retest of A (ABA). The control groups were not exposed to
76131 Karlsruhe, Germany                 force field B (AA). To examine the influence of diverse catch trial ratios, subjects received
e-mail: christian.stockinger@kit.edu
                                         catch trials during force field adaptation with a probability of either 0, 10, 20, 30, or
                                         40%, depending on the group. First, the results on motor adaptation revealed significant
                                         differences between the diverse catch trial ratio groups. With increasing amount of catch
                                         trials, the subjects’ motor performance decreased and subjects’ ability to accurately
                                         predict the force field—and therefore internal model formation—was impaired. Second,
                                         our results revealed that adapting with catch trials can influence the following consolidation
                                         process as indicated by a partial reduction to interference. Here, the optimal catch trial
                                         ratio was 30%. However, detection of consolidation seems to be biased by the applied
                                         measure of performance.
                                         Keywords: reaching movements, dynamic perturbation, intermittent practice, variability, interference, internal
                                         model formation, control strategy, robotic manipulandum

INTRODUCTION                                                                     discrepancy between prediction and execution of the movement.
Motor learning is an important attribute of human life which                     When further exposed to this perturbation, subjects’ performance
refers to an improvement in execution of a motor behavior.                       initially improves rapid followed by a slower increase to steady
Thereby, motor learning implies two distinct features: the ability               state close to baseline performance (Shadmehr et al., 2010). This
to acquire new motor skills and the adaptation of existing motor                 kind of fast trial-by-trial reduction of motor errors following
skills to new environmental conditions (Huang and Krakauer,                      an abrupt change in conditions is typically referred to as motor
2009; Krakauer and Mazzoni, 2011; Kitago and Krakauer, 2013).                    adaptation (Haith and Krakauer, 2013). When the dynamic per-
In neuroscience, motor learning has most often been studied                      turbation is removed after adaptation and the subject is reaching
in the context of adaptation of reaching movements. Thereby,                     under unperturbed conditions, hand trajectories are deviated
subjects usually adapt their reaching movements to either kine-                  again. Now, the hand trajectories show after-effects in a direc-
matic perturbations (visuomotor rotations, Krakauer et al., 2005;                tion opposite to the initial deviation of the dynamic perturbation.
prism-induced displacements, Held and Freedman, 1963) or                         This is taken as evidence that the sensorimotor system learned an
dynamic perturbations (robot-induced forces, Shadmehr and                        internal model to specifically counteract the dynamic perturba-
Mussa-Ivaldi, 1994; rotation of body, Lackner and DiZio, 2005;                   tion and did not simply increase arm stiffness (Shadmehr et al.,
attached inertial loads, Krakauer et al., 1999). Here, we want                   2010). To detect adaptation of such an internal model, usually
to focus on motor learning in terms of adaptation of reach-                      error clamp trials or catch trials are interspersed. In error clamp
ing movements to robot-induced forces. Thereby, subjects com-                    trials, movements are constrained to a virtual channel and the
monly interact with a robotic device that applies perturbing                     subjects’ forces against the channel wall are evaluated (Scheidt
forces to the subjects’ hands leading to changed dynamic con-                    et al., 2000). In catch trials, the dynamic perturbation is ran-
ditions of the reaching movements. At the beginning of reach-                    domly and without prior announcement removed (usually in
ing under these changed dynamics, subjects’ hand trajectories                    10–20% of the trials) and subjects reach under null field condi-
are deviated from desired straight hand paths showing a hook-                    tions. This allows detection of after-effects (Brashers-Krug et al.,
ing pattern. This results in a motor error arising from the                      1996; Shadmehr and Brashers-Krug, 1997). In contrast to error

Frontiers in Human Neuroscience                                     www.frontiersin.org                                     April 2014 | Volume 8 | Article 231 | 1
Stockinger et al.                                                                                             Catch trials influence motor learning

clamp trials, catch trials produce large motor errors that are fed       adaptation process and on the consolidation process in force field
back to the subject. As motor adaptation from one trial to the           adaptation. We hypothesized that increasing intermittence dur-
next was shown to be proportional to experienced motor error             ing practice—operationalized with various catch trial ratios of up
(Thoroughman and Shadmehr, 2000; Donchin et al., 2003), it is            to 40%—leads to a poorer performance during adaptation com-
widely accepted that catch trials affect execution of immediately        pared to lower intermittence during practice (e.g., 0% catch trials)
following movement trials (Thoroughman and Shadmehr, 2000;               but facilitates the consolidation process.
Scheidt et al., 2001; Karniel and Mussa-Ivaldi, 2002, 2003; Levy
et al., 2010). However, the influence of catch trials on the overall     MATERIALS AND METHODS
motor adaptation process has not yet been investigated in detail.        SUBJECTS
    Following adaptation, motor memory is transformed from               A total of 110 healthy subjects participated in this study (age
an initially fragile state to a more robust and stable state and         24.3 ± 2.1 years; 46 female, 64 male; 103 right-handed, 7 left-
therewith gains resistance to interference. This time-dependent          handed). They all gave written informed consent and the test-
process is called consolidation and contributes to enhanced retest       protocol was reviewed and approved by the institutional review
performance when exposed to the disturbance a second time                board. All subjects were naive to the experimental procedure
(Robertson et al., 2004; Krakauer and Shadmehr, 2006). In the            (apparatus, paradigm, and purpose of the study) and had no
context of force field experiments, numerous studies were able           known motor deficits or neurological impairments. Handedness
to detect enhanced retest performance of a learned force field           was verified using Edinburgh Handedness Inventory (Oldfield,
A when exposed to this perturbation a second time (savings               1971).
in AA-paradigm) (Brashers-Krug et al., 1996; Shadmehr and                    The subjects were randomly assigned to ten groups, whereas
Brashers-Krug, 1997; Caithness et al., 2004; Overduin et al., 2006;      five control groups (C0, C10, C20, C30, C40) and five correspond-
Focke et al., 2013). Moreover, various studies investigated the          ing test groups (T0, T10, T20, T30, T40) were defined (Table 1).
consolidation process of force field adaptation using an ABA-            To investigate consolidation patterns of motor memory, we con-
paradigm. Thereby, consolidation following adaptation to force           sidered all ten groups separately. To analyze motor adaptation
field A is interfered by learning a second force field B before retest   to force field A during the learning session (day 1), we unified
of A (Brashers-Krug et al., 1996; Shadmehr and Brashers-Krug,            each two corresponding groups (e.g., C10 and T10) as the corre-
1997; Caithness et al., 2004; Focke et al., 2013). Some researchers      sponding control and test groups passed the same experimental
found evidence for consolidation of force field A (Brashers-Krug         procedure on that day. We refer to the union of two such groups
et al., 1996; Shadmehr and Brashers-Krug, 1997), whereas oth-            as the catch trial ratio groups 0, 10, 20, 30, and 40%.
ers did not (Caithness et al., 2004; Focke et al., 2013). Most of            Five subjects were excluded from the analysis because of tech-
these studies used catch trials without taking into account that         nical reasons or lacking ability to adapt to the dynamics.
these change the conditions of practice and may thus consider-
ably influence the consolidation process. Indeed, Overduin et al.        APPARATUS
(2006) showed that subjects are able to consolidate a learned force      Subjects grasped the handle of a robotic device (BioMotionBot;
field A in the ABA-paradigm when catch trials were interspersed          Figure 1A) that could exert forces (Bartenbach et al., 2013).
during adaptation, whereas learning without catch trials did not         The subjects’ arms were not supported and all movements were
lead to consolidation of force field A. Conversely, Focke et al.         restricted to the horizontal plane. Subjects had clear view of their
(2013) failed to confirm this finding for a more complex task, sug-      hand throughout the whole experiment. They received full visual
gesting that not the presence of catch trials per se but the amount      feedback of the targets as well as of the cursor corresponding to
of induced catch trials might be crucial. Thus, consolidation also       the position of the handle on a vertical screen mounted above
seems to be a practice-dependent process in which the effect of          the robotic device. Subjects sat on a chair, which was individ-
catch trials is insufficiently understood and needs to be further        ually adjusted so that they were able to grasp the handle with
investigated.                                                            their dominant hand and comfortable reach all target positions
    Taken together, the detailed influence of catch trials on the        (Figure 1B). This individual seating position was reinstated in all
overall motor adaptation process as well as on the following con-        following practice sessions. Position and force at the handle were
solidation process remains unknown. Research in skill learning           recorded at a sampling rate of 200 Hz.
exhibited that variable practice schedules facilitate consolidation
when learning closed tasks for which the environmental condi-            PROCEDURE
tions are always similar and the movement can be planned in              Task
advance (Shea and Morgan, 1979; Shea and Kohl, 1991; Schmidt             We used an experimental setup similar to that described by
and Lee, 2011). Thereby, higher variability during practice leads        Focke et al. (2013). Subjects were asked to perform accurate
to a poorer performance during learning but to a better perfor-          goal-directed point-to-point reaching movements in the hori-
mance at retest compared to lower variability during practice.           zontal plane with their dominant hand using the robotic device.
Although, the relationship between motor adaptation and skill            Starting from a center point, subjects had to reach for one of
learning is far from clear (Yarrow et al., 2009), similar results        the eight peripheral target points which highlighted in a pseudo-
may occur for motor adaptation and the following consolida-              randomized order. The subsequent movement was initiated from
tion process. Therefore, the aim of our study was to investigate         this point back toward the center point. Therefore, the end point
the influence of different catch trial ratios both on the motor          of each movement was the starting point for the subsequent

Frontiers in Human Neuroscience                              www.frontiersin.org                             April 2014 | Volume 8 | Article 231 | 2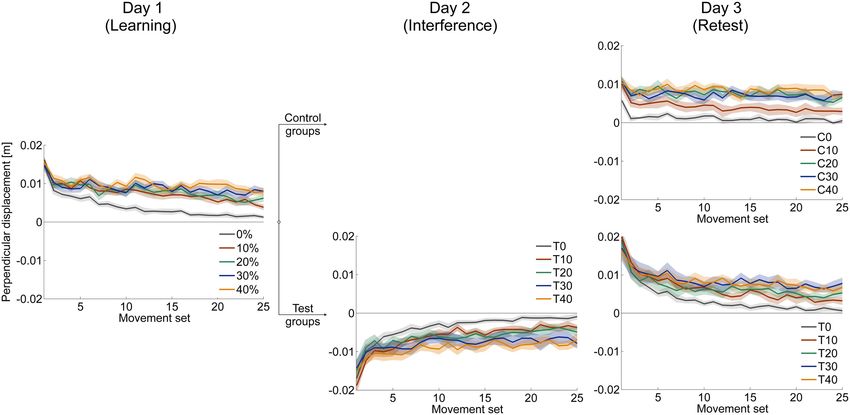
Stockinger et al.                                                                                                                          Catch trials influence motor learning

movement. The peripheral target points were uniformly arranged                             circle around the target appeared. If they moved too slowly, a
on a circle of 10 cm radius around the center point. Targets were                          red circle appeared and when moving too fast, an orange cir-
red circles (1 cm diameter) and the cursor was a white circle                              cle turned up. This visual feedback was provided throughout the
(0.3 cm diameter) appearing on a black background. If a target                             whole experiment to ensure consistent movement speed.
had to be reached, it changed its color from red to yellow. To avoid
target sequence specific phenomena, the target sequence differed                           Experimental design
for each subject.                                                                          To investigate the consolidation process of a learned task A, we
   We defined a set of movements as 16 trials—eight outward                                used an ABA-paradigm whereby the practice sessions were dis-
and eight inward movements—in which each peripheral target                                 tributed over three days with 24 h rest between each session
point occurred exactly once. All learning blocks were constructed                          (Table 1). To determine the adaptation process, we considered the
as concatenation of such movement sets. This ensured the same                              learning block A on day 1.
amount of practice toward each target direction.                                               On day 1, all subjects began with a familiarization block under
   Subjects were requested to perform each movement within                                 null field conditions (F, no disturbing forces) for 25 sets (400 tri-
500 ± 50 ms. Additionally, subjects were told that reaction time                           als; Table 1). After performing this familiarization block, subjects
was not important, i.e., after appearance of the new target they                           were able to perform the movements at the requested speed. We
could wait as long as they wanted before starting the movement.                            did not further analyze this data. After 5 min of rest, subjects per-
Consequently, reaction time was excluded from the requested                                formed a baseline block for six sets (96 trials) under null field
time interval. After completion of each movement, subjects                                 conditions (N). Based on these trials, we calculated baseline tra-
received visual feedback about movement time on the screen. If                             jectories to evaluate null field performance and as reference to
the subjects reached the target within the required time, a green                          movement trials performed under force field conditions. After

Table 1 | Experimental paradigm and classification of subject groups.

Group                                    Catch trial ratio (%)             Subjects                                               Paradigm

                                                                                                Day 1 (Learning)              Day 2 (Interference)               Day 3 (Retest)

Control 0%              (C0)                                                 n = 11                   F N A0                              –                             A0
                                                    0
Test 0%                 (T0)                                                 n = 11                   F N A0                         B0 = −A0                           A0

Control 10%             (C10)                                                n = 11                   F N A10                             –                             A10
                                                   10
Test 10%                (T10)                                                n = 10                   F N A10                       B10 = −A10                          A10

Control 20%             (C20)                                                n = 11                   F N A20                             –                             A20
                                                   20
Test 20%                (T20)                                               n=9                       F N A20                       B20 = −A20                          A20

Control 30%             (C30)                                                n = 11                   F N A30                             –                             A30
                                                   30
Test 30%                (T30)                                                n = 10                   F N A30                       B30 = −A30                          A30

Control 40%             (C40)                                                n = 10                   F N A40                             –                             A40
                                                   40
Test 40%                (T40)                                                n = 11                   F N A40                       B40 = −A40                          A40

F, familiarization block in null field (25 sets, 400 trials); N, baseline block in null field (6 sets, 96 trials); A, clockwise velocity-dependent force field with different ratio
of catch trials and force field trials (25 sets, 400 trials); B, counterclockwise velocity-dependent force field with different ratio of catch trials and force field trials (25
sets, 400 trials).

  FIGURE 1 | (A) Robotic device BioMotionBot. (B) Subject performing the horizontal point-to-point reaching task. The cursor corresponding to the position of
  the handle and the targets were displayed on a screen facing the subject.

Frontiers in Human Neuroscience                                             www.frontiersin.org                                           April 2014 | Volume 8 | Article 231 | 3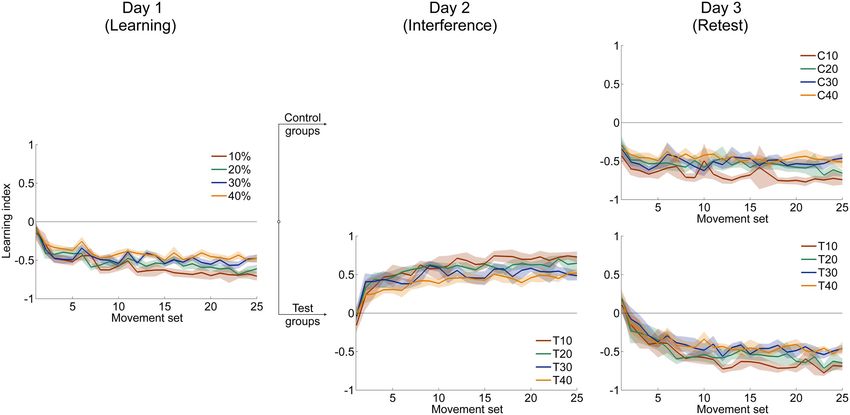
Stockinger et al.                                                                                              Catch trials influence motor learning

another 5 min of rest, subjects performed 25 sets (400 trials) in           We calculated baseline trajectories and baseline velocity
a velocity-dependent clockwise force field A. On day 2 (24 h rest),     profiles for each of the 16 movement directions by respectively
subjects of the test groups (T0, . . . , T40) were exposed to a sec-    averaging corresponding movements of the last five sets recorded
ond interfering velocity-dependent counterclockwise force field         in the baseline block under null field conditions (N) (Stockinger
B = −A for 25 sets. Subjects of the control groups did not attend       et al., 2012).
the laboratory on day 2. On day 3, all subjects were retested for
another 25 sets in force field A.                                       Performance measurement
   During force field adaptation, short breaks of 60 s were             Velocity vector correlation coefficient. To quantify movement
inserted after each five sets. Thereby, subjects could release their    performance under force field conditions, we calculated a velocity
hand from the handle but remained seated. The sessions lasted           vector correlation coefficient. This widely used measure only con-
approximately 60 min on day 1 and approximately 30 min on the           siders force field trials and quantifies motor performance by esti-
subsequent practice days. Subjects were instructed to sleep at least    mating the similarity between the velocity profiles of force field
6 h between the test sessions.                                          movements and corresponding baseline movements (Shadmehr
                                                                        and Brashers-Krug, 1997; Caithness et al., 2004; Overduin et al.,
Forces and catch trials                                                 2006; Stockinger et al., 2012).
Within the force field adaptation blocks, the robotic device gener-
ated a velocity-dependent force field that applied forces perpen-       Perpendicular displacement. To specifically evaluate catch trial
dicular to the direction of movement according to the following         movements, we calculated the signed perpendicular displace-
equation:                                                               ment (PDcatch ) of hand trajectory from the straight line joining
                                                                  start and target point 300 ms after movement start (Shadmehr
                    Fx           cos (θ ) − sin (θ)    ẋ               and Brashers-Krug, 1997; Donchin et al., 2002). This measure
                             =k·                     ·
                    Fz           sin (θ ) cos (θ)      ż               allowed us to gauge both the magnitude and the direction of the
                                                                        deviation. For instance, a subject who adapted to a clockwise-
Here, Fx and Fz are the robot-generated forces; k = 20 Ns/m is          directed force field A will predictively generate additional forces
the force field viscosity; θ denotes the direction of the force field   in counterclockwise direction to cancel out the expected disturb-
(force field A: θ = −90◦ clockwise-directed, force field B: θ = 90◦     ing forces (Shadmehr and Mussa-Ivaldi, 1994). Consequently, we
counterclockwise-directed); ẋ and ż are the components of hand        would expect the perpendicular displacement on a catch trial
velocity in the horizontal plane.                                       to be counterclockwise-directed. We indicate such after-effects
    During force field adaptation, catch trials were pseudo-            appropriate to force field A with negative sign. In contrast,
randomly interspersed without prior announcement. Depending             we indicate after-effects appropriate to force field B with posi-
on the group, catch trials appeared with either 0, 10, 20, 30, or       tive sign.
40% probability. The catch trial ratio is indexed in the name               Moreover, the perpendicular displacement was calculated for
of group and applied force field, respectively (e.g., C10: control      force field trials (PDfield ) to calculate a learning index as described
group adapting to force field A10 with 10% catch trials; Table 1).      in the following paragraph. Other measures of trajectory displace-
Catch trials occurred in outward and inward movements and in            ment (e.g., maximal perpendicular displacement, mean perpen-
some cases occurred one after another. If a catch trial occurred        dicular displacement, perpendicular displacement 200 ms after
toward a specific direction, no force field trial was performed         movement start) yielded qualitatively similar results and are
toward this direction during this set of movements. Catch trials        therefore not presented in this paper.
were induced without replacement such that the number of force
field trials differed between the catch trial groups but the total      Learning index. To relate force field trials and catch trials, we
amount of performed movements retained (400 movements).                 calculated a learning index (LI). This learning index allows quan-
                                                                        tification of force field learning with respect to after-effects during
DATA ANALYSIS                                                           catch trials (Donchin et al., 2002; Overduin et al., 2006). When
Preprocessing                                                           subjects adapt to the force field conditions, trajectories should
All parameters were calculated using the custom-made software           become straight-lined and therefore show gradually decreasing
application ManipAnalysis (Stockinger et al., 2012). Raw data of        perpendicular displacement values in force field trials. However,
hand trajectories were filtered using a fourth-order Butterworth        in catch trials there should be increasing after-effects to the
low-pass filter (6 Hz cut-off frequency). Afterwards, movement          opposite direction with ongoing learning (Shadmehr and Mussa-
velocities were numerically computed using central difference           Ivaldi, 1994). Based on this idea we calculated the learning index
method. Next, data sets were segmented. For position data, move-        as follows:
ment start was defined as the time-point when the cursor left
the starting point and movement termination was marked when                                       PDcatch
                                                                                      LI =                     ∈ [−1, 1]
the cursor reached the target point. For velocity data, move-                              PDfield  + PDcatch
ment onset (or end) was defined as the time at which velocity
exceeded (or fell under) 10% of maximal velocity of that move-          Thereby, PD denotes the perpendicular displacement of hand tra-
ment. Finally, the data sets were time-normalized using cubic           jectory as defined above in either force field trials (PDfield ) or
spline interpolation to make them comparable.                           catch trials (PDcatch ). The learning index was calculated using

Frontiers in Human Neuroscience                             www.frontiersin.org                               April 2014 | Volume 8 | Article 231 | 4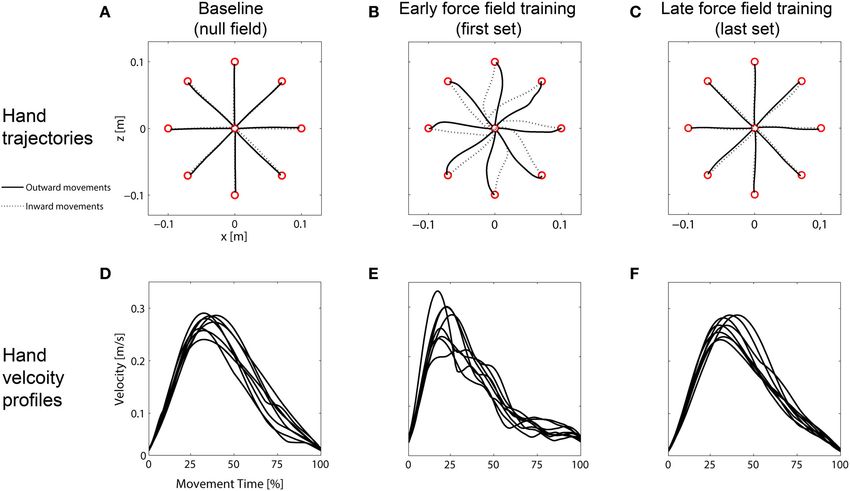
Stockinger et al.                                                                                            Catch trials influence motor learning

perpendicular displacement mean values (PD) of force field and         Statistics
catch trials for each set (16 trials) of movements.                    To test for differences within groups, we used paired t-tests.
    Early in the adaptation period, subjects should show a learn-      Adaptation on day 1 was confirmed by comparing initial and end
ing index near zero because in catch trials small after-effects        performance of the learning session for each group. To check for
and in force field trials large displacements should appear. With      consolidation of force field A of a specific group, we compared ini-
ongoing practice, the absolute value of the learning index should      tial performance of the learning session (day 1) and retest session
increase because after-effects in catch trials increase and devi-      (day 3) of that group.
ations in force field trials decrease (Donchin et al., 2002). A            To test for differences between groups, we conducted One-Way
subject who resists the disturbing forces by increasing the stiff-     ANOVAs with between subject factor group. Hereby, differences
ness of the arm may perform an accurate movement show-                 in initial or end performance were determined. To compare the
ing only small deviations during force field trials. Nevertheless,     degree of adaptation between groups, we considered the differ-
this leads to a low-valued learning index because perpendic-           ence value of initial and end performance in force field A of the
ular displacements are also small in catch trials. Thus, the           learning session (day 1).
learning index is a good measure to quantify force field pre-              To test for differences in consolidation between the pairs of
diction and thus internal model formation (Overduin et al.,            groups, we conducted a Two-Way ANOVA with the between sub-
2006).                                                                 ject factors catch trial ratio (0, 10, 20, 30, 40%) and interference
    The learning index is a relative measure of performance with       (control group, test group). Therefore, we compared the differ-
a theoretical limit of 1 (absolute value). It is signed as the         ence values calculated from initial performance of the learning
numerator includes the signed perpendicular displacement of            session (day 1) and retest session (day 3) between the different
catch trials. This allows distinction of learning the two oppos-       groups. This allowed evaluation of the influence of different catch
ing force fields A and B. Thereby, learning of the clockwise-          trial ratios on the consolidation of force field A with respect to the
directed force field A was indicated with a negative value, whereas    interference of force field B.
learning of the counterclockwise-directed force field B had posi-          To evaluate after-effects, we used one-sample t-tests to com-
tive sign.                                                             pare given mean values to zero.
    The learning index was not calculated for the 0% catch trial           All statistical analyses were conducted using IBM SPSS soft-
groups (C0, T0) as these groups did not receive any catch trials       ware (v.21). All data are presented as mean values and 95% con-
that indicate after-effects.                                           fidence intervals. For all statistical tests, the level of significance
    We conducted the statistical analyses for velocity vector cor-     was a priori set to p = 0.05. If One-Way ANOVAs revealed sig-
relation coefficient, learning index as well as the perpendicular      nificant differences, Bonferroni Post-hoc analysis was used. Effect
displacement. We did this for several reasons. First, velocity vec-    sizes were determined using partial eta squared η2p (small effect:
tor correlation is a well-established and frequently used measure      η2p = 0.01; medium effect: η2p = 0.06; large effect: η2p = 0.14) or
to quantify force field learning (e.g., Shadmehr and Brashers-         Cohen’s d (small effect: d = 0.20; medium effect: d = 0.50, high
Krug, 1997; Caithness et al., 2004; Overduin et al., 2006). This       effect: d = 0.80) (Cohen, 1992). All correlation coefficients were
enables comparison to most former force field studies. Second,         transformed using Fisher z-transform before statistical analyses
velocity vector correlation allowed us to quantify performance         were conducted. All presented data of velocity vector correlation
of the 0% catch trial group which is impossible when using the         refers to the retransformed z-values.
learning index. Third, we additionally used the learning index
based on the perpendicular displacement because it also consid-        RESULTS
ers catch trials and therefore more emphasizes the internal model      The initial performance of the learning session (day 1, first set)
prediction and the direction of force prediction than the velocity     did not differ significantly between the ten groups (One-Way
vector correlation. Furthermore, the perpendicular displacement        ANOVA, factor: group (C0, . . . , C40, T0, . . . , T40)]. This holds
is an intuitively accessible and frequently used measure of motor      for the velocity vector correlation [F(9, 95) = 1.30, p = 0.249],
error (e.g., Shadmehr and Brashers-Krug, 1997; Donchin et al.,         perpendicular displacement [F(9, 95) = 1.58, p = 0.135], and
2002).                                                                 learning index [F(7, 75) = 0.92, p = 0.493]. Furthermore, we
                                                                       found no significant differences in initial (first set) or end perfor-
Difference values. To assess performance changes between two           mance (last set) between corresponding control and test groups
distinct points in time, we calculated the difference value of per-    which received the same amount of catch trials (pairwise inde-
formances between these two points in time. Thereby, increase (or      pendent t-tests). These findings hold for velocity vector corre-
decrease) of performance within the considered period was indi-        lation, perpendicular displacement, and learning index. Thus,
cated with positive (or negative) sign. Using this difference value    we can unify corresponding control and test groups to analyze
we were able to compare performance changes across different           the adaptation process during the learning session (day 1) as
groups.                                                                subjects received the same protocol on that day. Similarly to
   The term “initial performance” always refers to the mean score      the ten separated groups, we found no significant differences in
of the first set of movements (16 trials) within the considered        initial performance of the learning session (day 1) when con-
period. Accordingly, “end performance” always refers to the mean       sidering the five different catch trial ratio groups (One-Way
score of the last set of movements (16 trials) within the considered   ANOVA, factor: catch trial ratio (0%, . . . , 40%); unification of
period.                                                                each two corresponding control and test groups) for velocity

Frontiers in Human Neuroscience                            www.frontiersin.org                               April 2014 | Volume 8 | Article 231 | 5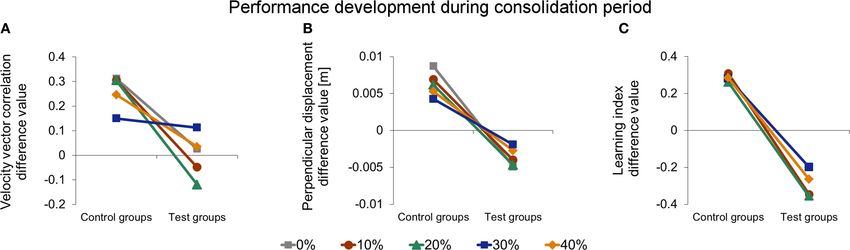
Stockinger et al.                                                                                              Catch trials influence motor learning

vector correlation [F(4, 100) = 1.42, p = 0.234], perpendicular          (p = 0.015), as well as between 10 and 40% catch trial ratio
displacement [F(4, 100) = 1.42, p = 0.222], and learning index           (p = 0.015). For the perpendicular displacement, Bonferroni
[F(3, 79) = 0.68, p = 0.568]. Therefore, we act on the assumption        Post-hoc analysis revealed significant differences between 0 and
that all groups and all catch trial ratio groups started with similar    20% catch trial ratio (p < 0.001), 0 and 30% catch trial ratio
initial conditions.                                                      (p < 0.001), 0 and 40% catch trial ratio (p < 0.001), 10 and
    In the following, we first present results of the adaptation pro-    20% catch trial ratio (p = 0.002), 10 and 30% catch trial ratio
cess of the learning session (day 1) considering the five unified        (p < 0.001), 10 and 40% catch trial ratio (p < 0.001), as well as
catch trial ratio groups. Afterwards, we present results of the con-     between 20 and 40% catch trial ratio (p = 0.024).
solidation of force field A. The test groups were exposed to a               Additionally, we conducted the same analyses comparing the
second interfering force field B on day 2 before retest of force         performance at the time point at which all groups had performed
field A on day 3, whereas the control groups were retested in force      a total of 240 force field trials, i.e., same amount of force field
field A on day 3 without interference. Therefore, in consolidation       trials. We found similar results, i.e., significant worse degree of
analysis, we consider all ten control and test groups separately         adaptation with increasing catch trial ratio for velocity vector
(Table 1). Additionally, we present results of the after-effects         correlation [One-Way ANOVA: F(4, 100) = 3.31, p = 0.014] and
detected during catch trials.                                            perpendicular displacement [One-Way ANOVA: F(4,100) = 13.35,
                                                                         p < 0.001]. Thus, the reported differences between the catch
ADAPTATION                                                               trial ratio groups were not because of the different amount of
Hand trajectories and velocity profiles                                  performed force field trials. Therefore, sensorimotor adaptation,
On day 1, all subjects showed the expected adaptation pattern            as quantified by the velocity vector correlation coefficient and
when exposed to force field A. At the beginning of force field           perpendicular displacement, worsened as the catch trial ratio
adaptation, subjects’ hands were considerably disturbed. This            increased.
resulted in distinctively curved trajectories compared to the null
field condition (Figures 2A,B). The force field disturbance was          Learning index
also indicated by a change in the hand velocity profiles. Under null     To determine the degree of force field learning with respect to
field conditions, subjects produced typical bell-shaped velocity         catch trials, we conducted the same adaptation analyses as above
profiles with a single peak (Figure 2D). At the beginning of force       for the four groups that received catch trials using the learn-
field adaptation, however, subjects’ velocity profiles were notice-      ing index. All four groups improved rapidly at the beginning of
ably disturbed (Figure 2E). With practice, subjects were able to         adaptation (Figure 6, left). This rapid improvement decayed with
counteract the forces resulting in straight-lined trajectories and       ongoing practice and finally reached plateau for all groups. All
velocity profiles similar to those profiles in baseline movements        groups were able to adapt to the force field conditions when con-
(Figures 2C,F).                                                          sidering the learning index. This was exhibited by a significant
                                                                         improvement from first set to last set (paired t-test: p < 0.001 for
Velocity vector correlation coefficient and perpendicular                all four groups).
displacement                                                                 To gauge differences in the improvement of learning index
The time course of velocity vector correlation coefficient and           during adaptation, we compared the difference values (initial
perpendicular displacement demonstrate the progress of adapta-           vs. end of adaptation) of learning index and found signifi-
tion to force field A for all groups (Figure 3, left; Figure 4, left).   cant differences between the four groups [One-Way ANOVA:
Adaptation is illustrated by a distinct improvement of motor per-        F(3, 79) = 2.85, p = 0.043]. Bonferroni Post-hoc analysis revealed
formance during force field learning. Initially, all groups show         significant differences between 10 and 30% catch trial ratio
rapid improvements in performance. With further practice, the            (p = 0.032) as well as between 10 and 40% catch trial ratio
rate of performance improvement decreases. Finally, performance          (p = 0.016) (Figure 7C). These differences also hold, when
output reaches plateau.                                                  evaluating the learning index at the time point at which all
    We statistically confirmed adaptation to force field A for           groups had performed 240 force field trials [One-Way ANOVA:
each catch trial ratio group. Thereby, all groups showed signif-         F(3, 79) = 3.53, p = 0.019]. Therefore, sensorimotor adaptation,
icantly higher end performance compared to the initial perfor-           as quantified by the learning index, worsened as the catch trial
mance (paired t-test: p < 0.001 for all five groups). Moreover,          ratio increased. These results are in accordance to the results
we found differences in the degree of adaptation between                 of velocity vector correlation and perpendicular displacement
the five catch trial ratio groups: The performance improve-              mentioned above.
ment value assessed by subtracting initial performance from
end performance showed significant differences between the               Adaptation to the interfering force field
five groups. All these findings hold for both velocity vec-              On day 2, all test groups were exposed to the interfering force
tor correlation [One-Way ANOVA: F(4, 100) = 6.70, p < 0.001;             field B and followed the same protocol as on day 1, respectively.
Figure 7A] and perpendicular displacement [One-Way ANOVA:                Thus, these groups received different amounts of catch trials.
F(4, 100) = 24.64, p < 0.001; Figure 7B]. For the velocity vector        We found differences in the degree of adaptation to force
correlation, Bonferroni Post-hoc analysis revealed significant dif-      field B between the test groups: The performance improve-
ferences between 0 and 30% catch trial ratio (p = 0.015), 0 and          ment value assessed by subtracting initial performance from
40% catch trial ratio (p = 0.001), 10 and 30% catch trial ratio          end performance showed significant differences between the

Frontiers in Human Neuroscience                              www.frontiersin.org                               April 2014 | Volume 8 | Article 231 | 6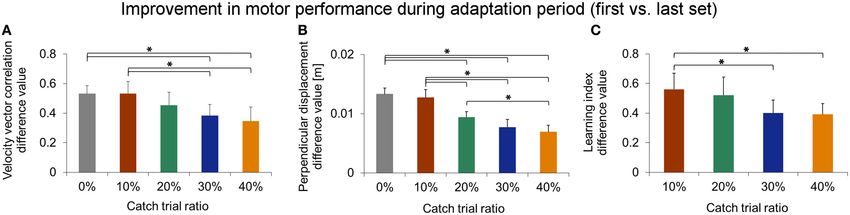
Stockinger et al.                                                                                                                   Catch trials influence motor learning

  FIGURE 2 | Representative mean hand trajectories and mean hand                       the end of force field adaptation (last set). (D) Smooth bell-shaped,
  velocity profiles (outward movements only) of one group. (A)                         single-peak baseline velocity profiles. (E) Disturbed velocity profiles at the
  Straight-lined baseline trajectories. (B) Disturbed trajectories at the beginning    beginning of force field adaptation. (F) Velocity profiles at the end of force
  of force field adaptation (first set). (C) Reshaped straight-lined trajectories at   field adaptation showing bell-shaped, single-peak profiles.

  FIGURE 3 | Mean time courses of velocity vector correlation coefficient              groups were retested in force field A (right). On all three days, subjects were
  for all three days. After learning force field A on day 1 (left), subjects of each   able to adapt to the changed dynamic conditions indicated by increasing
  catch trial ratio group were divided into control and test groups. Test groups       correlation coefficients. All data is presented as mean values ±95%
  adapted to an interfering force field B = −A on day 2 (mid). On day 3, all           confidence intervals.

Frontiers in Human Neuroscience                                           www.frontiersin.org                                       April 2014 | Volume 8 | Article 231 | 7
Stockinger et al.                                                                                                            Catch trials influence motor learning

  FIGURE 4 | Mean time courses of signed perpendicular displacement               disturbance of force field A (force field B). On all three days, subjects were
  300 ms after movement start in force field trials. Positive (negative) values   able to adapt to the changed dynamic conditions leading to decreased errors.
  indicate deviations in clockwise (counterclockwise) direction caused by         All data is presented as mean values ±95% confidence intervals.

  FIGURE 5 | Mean time courses of          after-effects measured by              (force field B). The magnitude of after-effects increases with
  signed perpendicular displacement          during catch trials. Negative        ongoing practice and is least for subjects receiving 30 and 40%
  (positive) values indicate deviations    in counterclockwise (clockwise)        catch trials. All data is presented as mean values ±95%
  direction and therefore after-effects    appropriate to force field A           confidence intervals.

five test groups for all measures [One-Way ANOVA: velocity                        Bonferroni Post-hoc analysis revealed significant differences
vector correlation: F(4, 46) = 7.564, p < 0.001; perpendicular                    between T0 and T30 (p = 0.001), T0 and T40 (p = 0.007),
displacement: F(4, 46) = 11.407, p < 0.001; learning index:                       T10 and T30 (p = 0.002), as well as between T10 and T40
F(3, 36) = 7.561, p < 0.001]. For the velocity vector correlation,                (p = 0.009). For the perpendicular displacement, Bonferroni

Frontiers in Human Neuroscience                                      www.frontiersin.org                                     April 2014 | Volume 8 | Article 231 | 8
Stockinger et al.                                                                                                              Catch trials influence motor learning

  FIGURE 6 | Mean time courses of learning index which relates catch trials and force field trials. Learning of the clockwise-directed force field A is indicated
  with negative values, learning of the counterclockwise-directed force field B has positive sign. All data is presented as mean values ±95% confidence intervals.

Post-hoc analysis revealed significant differences between T0                      group, test group)] analyzing the difference values of initial
and T20 (p = 0.019), T0 and T30 (p < 0.001), T0 and T40                            performances of the learning session and retest of each catch trial
(p = 0.001), T10 and T30 (p < 0.001), as well as between T10                       ratio group (Figure 8A). We found a significant interference effect
and T40 (p = 0.006). For the learning index, Bonferroni Post-hoc                   [F(1, 95) = 65.90, p < 0.001, η2p = 0.41] and a significant inter-
analysis revealed significant differences between T10 and T30                      action between interference and catch trial ratio [F(4, 95) = 5.11,
(p = 0.001) and between T10 and T40 (p = 0.001). Therefore,                        p = 0.001, η2p = 0.18] Thus, in general, exposure to the interfer-
the test groups’ attained level of adaptation to force field B                     ing force field B on day 2 had an effect on the consolidation pro-
decreased with increasing catch trial ratio which is in line with                  cess. However, for different catch trial ratio groups, consolidation
the findings on the adaptation to force field A on day 1.                          progresses differently. Post-hoc analysis (pairwise independent
                                                                                   t-tests between corresponding control and test groups) revealed
CONSOLIDATION                                                                      significant differences between groups C0 and T0 [t(20) = 5.79,
Velocity vector correlation coefficient and perpendicular                          p < 0.001, d = 2.47], C10 and T10 [t(19) = 4.68, p < 0.001,
displacement                                                                       d = 2.06], C20 and T20 [t(18) = 6.27, p < 0.001, d = 2.85] as
As expected, all control groups exhibited savings of force field                   well as between C40 and T40 [t(19) = 2.74, p = 0.013, d = 1.18]
A from learning on day 1 until retest on day 3. This was                           indicating a significant effect of the exposure to the interfering
indicated by a significant increase of the initial performance                     force field B, respectively. However, we found no significant differ-
(mean score of first set) measured by velocity vector correla-                     ences between C30 and T30 [t(19) = −0.02, p = 0.983, d = 0.01].
tion from learning session (day 1) to retest (day 3) of force                      Thus, the consolidation process of subjects receiving 30% catch
field A for all control groups (paired t-test: p < 0.010 for all                   trials was not significantly influenced by the interfering force field
five groups). In particular, we found no significant differences in                B when measured by velocity vector correlation. Taken together,
this increase between the five control groups [One-Way ANOVA:                      for the catch trial ratio groups 0, 10, and 20% the difference val-
F(4, 49) = 2.31, p = 0.073] when comparing the difference value                    ues comparing initial performance of the learning session (day 1)
of initial performance on day 1 and day 3, i.e., the consolidation                 and retest (day 3) differed significantly between control and test
processed similarly for all control groups.                                        groups. Thereby, test groups performed worse. This significant
    The aim of our study was to investigate the influence of                       difference did not appear for a catch trial ratio of 30%. In case
different catch trial ratios on the consolidation process in the                   of a further increase of the catch trial ratio up to 40%, control
ABA-paradigm, in particular on resistance to interference of force                 and test groups showed significant differences again.
field B learning. To assess the influence of catch trials on the                       We conducted the same analyses for the performance val-
consolidation process with respect to the interference of force                    ues assessed by the perpendicular displacement (Figure 8B).
field B, we conducted a Two-Way ANOVA [between subject                             The Two-Way ANOVA (between subject factors: catch trial
factors: catch trial ratio (0, . . . , 40%) and interference (control              ratio [0, . . . , 40%] and interference (control group, test group)]

Frontiers in Human Neuroscience                                       www.frontiersin.org                                      April 2014 | Volume 8 | Article 231 | 9
Stockinger et al. Catch trials influence motor learning FIGURE 7 | Comparison of degree of adaptation between catch degree in force field adaptation with increasing catch trial ratio. trial ratio groups using velocity vector correlation coefficient All data is presented as mean values ±95% confidence (A), perpendicular displacement (B), and learning index (C). intervals; (∗ ) indicates significant differences between catch trial All three performance measures indicate a significantly decreasing ratio groups. FIGURE 8 | Comparison of development in initial performance from significant effect of interference (control, test). For velocity vector correlation learning session (day 1) to retest (day 3) of force field A measured by (A) and perpendicular displacement (B), there is also a significant interaction velocity vector correlation (A), perpendicular displacement (B), and of interference and catch trial ratio, indicating different consolidation learning index (C). Positive values indicate a performance improvement, depending on the catch trial ratio. Thereby, consolidation is least impaired for whereas negative values indicate a decreased initial retest performance 30% catch trial test group. All data is presented as mean values ±95% compared to naive performance. In general, test groups show impaired confidence intervals; (∗ ) indicates significant differences between catch trial consolidation compared to corresponding control groups indicated by a ratio groups. analyzing the difference values of initial performances of the Thus, the consolidation process, as measured by the velocity learning session and retest revealed a significant interference vector correlation, was influenced by catch trials, suggesting most effect [F(1, 95) = 179.21, p < 0.001, η2p = 0.65] and a signif- resistance to interference of force field B for 30% catch trials. icant interaction between interference and catch trial ratio Consolidation, in terms of absence of interference and as quanti- [F(4, 95) = 3.10, p = 0.019, η2p = 0.12]. In general, this indicates fied by the perpendicular displacement, could not be detected for an effect of exposure to force field B and differing consolidation any catch trial ratio. However, the consolidation process was least progresses for the diverse catch trial ratios which is in line with the impaired for 30% catch trial ratio suggesting partial resistance to findings of the velocity vector correlation. In contrast, Post-hoc interference. analysis (pairwise independent t-tests), showed significant differ- ences between all corresponding control and test groups, respec- Learning index tively [0%: t(20) = 7.96, p < 0.001, d = 3.39; 10%: t(19) = 7.13, We also considered the progress of learning index from the learn- p < 0.001, d = 3.12; 20%: t(18) = 6.10, p < 0.001, d = 2.71; ing session (day 1) to the retest session (day 3). All control groups 30%: t(19) = 4.28, p < 0.001, d = 1.86; 40%: t(19) = 4.49, showed significantly higher initial learning index values at retest p < 0.001, d = 1.97]. Therefore, exposure to force field B sig- than at the learning session (paired t-test: p < 0.015 for all four nificantly impaired the consolidation process of all test groups. groups). In particular, we found no significant differences in this However, this impairment depended on the catch trial ratio and increase between the four control groups when comparing the was least for the 30% catch trial ratio test group compared to its difference value of initial performance on day 1 and day 3 [One- control group (Figure 8B). Way ANOVA: F(3, 39) = 0.08, p = 0.970], i.e., the consolidation Frontiers in Human Neuroscience www.frontiersin.org April 2014 | Volume 8 | Article 231 | 10
Stockinger et al. Catch trials influence motor learning
processed similarly for all control groups. This is in accordance compared to constant practice but facilitates consolidation.
to the findings of the velocity vector correlation and perpen- Against the background of these hypotheses, we separately dis-
dicular displacement. However, the Two-Way ANOVA [between cuss the results on motor adaptation (section Catch Trials
subject factors: catch trial ratio (10, . . . , 40%) and interference Influence Internal Model Formation and Motor Performance
(control group, test group)] revealed only a significant effect of During Adaptation) and consolidation (section Consolidation
interference [F(1, 75) = 129.59, p < 0.001, η2p = 0.63; Figure 8C) Depends on Catch Trial Ratio and Performance Measure). Finally,
but no significant interaction between interference and catch trial we relate our results to findings from research on skill learning
ratio [F(3, 75) = 0.59, p = 0.625, η2p = 0.02]. Therefore, exposure (Section Comparison of Motor Adaptation and Skill Learning).
to force field B had a significant influence on the consolidation
process for all considered catch trial ratios. Thus, in contrast to CATCH TRIALS INFLUENCE INTERNAL MODEL FORMATION AND
the results of velocity vector correlation and perpendicular dis- MOTOR PERFORMANCE DURING ADAPTATION
placement, the catch trial ratio had no significant influence on Our results on motor adaptation showed that increased inter-
the consolidation process as quantified by the learning index. mittence by interspersed catch trials lead to poorer performance
during adaptation. We assume that the catch trial induced
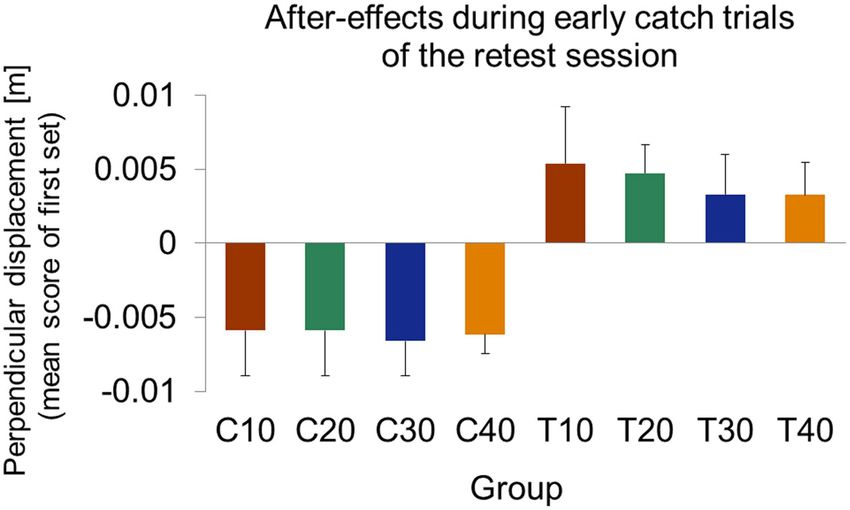
AFTER-EFFECTS intermittences impair the ability to form an internal model
Figure 5 illustrates after-effects of force field adaptation in catch and therewith impair accurate compensation for the dynamic
trials that occurred during all sessions. For all catch trial ratio perturbation.
groups, after-effects are initially small but increase with ongo- In accordance to former studies (e.g., Shadmehr and Mussa-
ing practice and reach plateau. At the end of each day, the Ivaldi, 1994), our results showed that all groups were able to adapt
catch trial groups’ after-effects differed significantly in magnitude to the changed dynamic conditions induced by the disturbing
(One-Way ANOVAs: p ≤ 0.001 for all three days). Thereby, with force field (Figures 3, 4, 6). Though, the degree of adaptation
increasing catch trial ratio, subjects showed significantly smaller depended on the amount of induced catch trials. This finding
after-effects. holds for all considered performance measures (Figures 3, 4, 6).
To investigate after-effects of force field B adaptation onto Overduin et al. (2006) did not find an influence of catch trials on
retest of force field A, we considered catch trials at the begin- the performance development during adaptation. But they solely
ning of the retest session (day 3). We calculated the mean values compared 0 and 20% catch trial ratio groups using the velocity
of perpendicular displacements in catch trials of the first set of vector correlation. However, we tested a wider range of catch trial
movements. This allowed us to quantify the magnitude and the ratios and performance measures demonstrating that, in gen-
direction of after-effects. Comparison of after-effects based on eral, motor adaptation depends on the catch trial ratio. These
only the first catch trial, which occurred for all groups on the third differences in the degree of adaptation are not attributed to the
or fourth trial, lead to similar results. different amount of performed force field trials but seem to be
At the beginning of the retest session, all control groups distinctively caused by the catch trial induced intermittences.
showed significant negative mean perpendicular displacements We assume that subjects of different catch trial ratio groups
[one-sample t-test vs. zero; C10: t(10) = −3.72, p = 0.004; C20: had formed internal models of different quality. As mentioned
t(10) = −3.73, p = 0.004; C30: t(10) = −5.58, p < 0.001; C40: above, the learning index is a good measure of force field pre-
t(9) = −9.38, p < 0.001; Figure 9]. Thus, subjects of all control diction (Donchin et al., 2002; Overduin et al., 2006). Subjects
groups started retest of force field A with a force field prediction receiving less catch trials (10, 20%) demonstrated learning curves
appropriate to force field A. We found no significant differences of that suggest better force field prediction compared to the 30%
these after-effects between the control groups [One-Way ANOVA: and 40% catch trial ratio groups (Figure 6, left). Accordingly,
F(3, 39) = 0.65, p = 0.578]. the higher learning index for low catch trial groups contributes
The test groups, however, all showed significant positive per- to an appropriate internal model formation that enables accu-
pendicular displacements in catch trials at the beginning of rate movement generation using a feed forward control strategy
retest [one-sample t-test vs. zero; T10: t(9) = 2.74, p = 0.023; (Donchin et al., 2002; Overduin et al., 2006; Franklin et al.,
T20: t(8) = 4.87, p = 0.001; T30: t(9) = 2.37, p = 0.042; T40: 2008). In contrast, the learning index values of the catch trial
t(10) = 2.90, p = 0.016; Figure 9]. Thus, subjects of all test groups ratio groups 30% and 40% suggest an impaired ability to form
started retest of force field A with a force field prediction appro- an appropriate internal model. This would cause inaccurate pre-
priate to force field B. We found no significant differences of diction of perturbing forces and require reaction using muscular
these after-effects between the test groups indicating similar after- co-contraction to perform the movement (Overduin et al., 2006).
effects of force field B adaptation onto retest of force field A Maybe, subjects receiving a high amount of catch trials relied
[One-Way ANOVA: F(3, 36) = 0.68, p = 0.542]. more on an impedance control strategy by increasing arm stiff-
ness (Schabowsky et al., 2007). Former research already proposed
DISCUSSION coexistence of forward model prediction and impedance con-
Our study was designed to investigate the influence of catch trials trol strategy (Takahashi et al., 2001; Osu et al., 2003; Milner and
on the overall motor adaptation process as well as on the follow- Franklin, 2005). Since we tested adaptation using various catch
ing consolidation process. We hypothesized that increasing inter- trial ratios, we propose that the ability to form an appropri-
mittence during practice—operationalized with various catch ate internal model changes gradually with altered conditions of
trial ratios—leads to a poorer performance during adaptation practice. This might explain the order of attained performance
Frontiers in Human Neuroscience www.frontiersin.org April 2014 | Volume 8 | Article 231 | 11Stockinger et al. Catch trials influence motor learning
between the various catch trial ratios showing strongest resistance
to interference for 30% catch trial ratio. However, for this mea-
sure, there was no complete resistance to the interference caused
by force field B for any test group. Furthermore, we did not
find consolidation when considering the learning index suggest-
ing a disruption of the consolidation process when adapting to
an interfering force field B, regardless of the induced amount of
catch trials (Figure 8C).
To our best knowledge, Overduin et al. (2006) provided the
only study which also considered both the velocity vector corre-
lation and the learning index. They observed consolidation for
subjects receiving 20% catch trials for both measures. Shadmehr
and Brashers-Krug (1997) also used catch trials (approx. 17%)
and found consolidation within the ABA-paradigm. However,
FIGURE 9 | Mean values of signed perpendicular displacement in catch
trials of the first movement set at retest of force field A (day 3). All
they only computed velocity vector correlation coefficients. The
control groups show significant negative after-effect values indicating fact that we detected a reduced interference on the consolida-
predictive force compensation appropriate to force field A. Test groups tion process using this measure merely for a higher catch trial
show significant positive after-effect values indicating predictive force ratio of 30% might be explained by the higher complexity of our
compensation appropriate to force field B. All data is presented as mean
reaching task. In contrast to the mentioned studies, we did not
±95% confidence intervals.
support the subjects’ arms. This results in more degrees of free-
dom within shoulder and elbow joints to be controlled and thus
level according to the amount of induced catch trials which is in an increased task complexity. Maybe, an increase of the catch
reasonable as with increasing catch trial ratio the interferences trial ratio up to 30% further emphasized its positive effects on
and the uncertainty increase which prevents the sensorimotor the consolidation process, compensated for our increased task
system of accurately predicting the disturbing forces (Takahashi complexity, and therewith facilitated consolidation. However, a
et al., 2001; Osu et al., 2003; Franklin et al., 2008). In con- further increase of catch trial ratio up to 40% seems to impair
trast, internal model formation is more emphasized for subjects consolidation as it increases uncertainty about the task.
receiving constant force field perturbations. For such constant The missing detection of consolidation as measured by the
perturbations, it was previously assumed that appropriate inter- perpendicular displacement and learning index might be due
nal model formation is the main reason for high movement to a lower sensitivity of these measures compared to the veloc-
performance at the end of the learning session (Shadmehr et al., ity vector correlation. In this connection it is noteworthy that
2010). Overduin et al. (2006) also detected a trend toward a difference
between their 20% catch trial control and test groups which, how-
CONSOLIDATION DEPENDS ON CATCH TRIAL RATIO AND ever, turned out not to be statistically significant. It remains the
PERFORMANCE MEASURE question, why there should be a differing sensitivity between the
For the consolidation process following motor adaptation, we considered measures. The underlying computations offer a pos-
found differing results for the considered performance mea- sible explanation because the measures are based on different
sures suggesting a different sensibility to detect consolidation. types of information. The perpendicular displacement and the
Considering the velocity vector correlation, we found that the learning index depend on positional data. The velocity vector cor-
consolidation process can be positively influenced by catch tri- relation, however, uses velocity data and therefore also considers
als. When subjects learned a second interfering task in-between, temporal factors. Moreover, the velocity vector correlation is a
consolidation was least impaired for a catch trial ratio of 30%. similarity measure which compares fielded movements to base-
This was demonstrated by a similar performance development line movements recorded under null field conditions, whereas the
during the consolidation period of corresponding control and test perpendicular displacement and the learning index are measures
groups for 30% catch trial ratio (Figure 8A). For lower catch trial of difference.
ratio (0, 10, 20%), however, consolidation was impaired when Irrespective of methodological factors, the question remains,
learning an interfering second task as indicated by significant dif- why test groups revealed differences in the reduction of inter-
ferences in the consolidation between corresponding control and ference that impaired the consolidation process. Former stud-
test groups. Similarly, for 40% catch trial ratio such significant ies that investigated consolidation in ABA-paradigms discussed
difference in the consolidation between control and test group anterograde interference effects that might have avoided detec-
occurred. Therefore, learning with an optimal amount of catch tion of consolidation (Brashers-Krug et al., 1996; Shadmehr and
trials seems to make the subsequent consolidation process more Brashers-Krug, 1997; Caithness et al., 2004). Anterograde inter-
resistant to interference compared to learning without catch trials ference describes the influence of the interfering force field B
or learning with an immoderate amount of catch trials. For the onto the recall of force field A. Therefore, anterograde interfer-
perpendicular displacement, we also found an influence of catch ence might cover the consolidation of force field A (Robertson
trials on the consolidation process (Figure 8B). We detected dif- et al., 2004). We were able to detect anterograde interference
ferences in the degree of impairment of the consolidation process for all test groups that received catch trials by considering the
Frontiers in Human Neuroscience www.frontiersin.org April 2014 | Volume 8 | Article 231 | 12You can also read