Timing matters: sonar call groups facilitate target localization in bats
←
→
Page content transcription
If your browser does not render page correctly, please read the page content below
ORIGINAL RESEARCH ARTICLE
                                                                                                                             published: 12 May 2014
                                                                                                                      doi: 10.3389/fphys.2014.00168

Timing matters: sonar call groups facilitate target
localization in bats
Ninad B. Kothari 1† , Melville J. Wohlgemuth 1† , Katrine Hulgard 2 , Annemarie Surlykke 2 and
Cynthia F. Moss 1*
1
    Auditory Neuroethology Lab, Psychology, University of Maryland, College Park, MD, USA
2
    Biology, University of Southern Denmark, Odense, Denmark

Edited by:                                To successfully negotiate a cluttered environment, an echolocating bat must control the
Silvio Macias, Havana University,         timing of motor behaviors in response to dynamic sensory information. Here we detail
Cuba
                                          the big brown bat’s adaptive temporal control over sonar call production for tracking
Reviewed by:
                                          prey, moving predictably or unpredictably, under different experimental conditions. We
Paul Faure, McMaster University,
Canada                                    studied the adaptive control of vocal-motor behaviors in free-flying big brown bats,
Lutz Wiegrebe,                            Eptesicus fuscus, as they captured tethered and free-flying insects, in open and cluttered
Ludwig-Maximilians-Universität            environments. We also studied adaptive sonar behavior in bats trained to track moving
München, Germany
                                          targets from a resting position. In each of these experiments, bats adjusted the features of
*Correspondence:
                                          their calls to separate target and clutter. Under many task conditions, flying bats produced
Cynthia F. Moss, Department of
Psychology, University of Maryland,       prominent sonar sound groups identified as clusters of echolocation pulses with relatively
Biology-Psychology Building, RM.          stable intervals, surrounded by longer pulse intervals. In experiments where bats tracked
2123M, College Park, MD 20742,            approaching targets from a resting position, bats also produced sonar sound groups, and
USA
e-mail: cynthia.moss@gmail.com
                                          the prevalence of these sonar sound groups increased when motion of the target was
                                          unpredictable. We hypothesize that sonar sound groups produced during flight, and the
† Co-first authors with equal
                                          sonar call doublets produced by a bat tracking a target from a resting position, help the
contributions.
                                          animal resolve dynamic target location and represent the echo scene in greater detail.
                                          Collectively, our data reveal adaptive temporal control over sonar call production that allows
                                          the bat to negotiate a complex and dynamic environment.

                                          Keywords: echolocation behavior, sonar call timing, active sensing, spatial perception, target tracking

INTRODUCTION                                                                      the big brown bat, Eptesicus fuscus, with the goal of advancing
How do animals process, organize and retrieve information from                    our understanding of the environmental and task conditions that
a rich and complex environment? Furthermore, how is this infor-                   influence the bat’s control over the timing and grouping of calls.
mation integrated with motor programs to support perceptually-                        When the big brown bat is hunting and searching for prey
guided behaviors? The active sensing system of the echolocating                   in an open habitat, long, shallow FM (frequency modulated)
bat presents an opportunity to address these questions. The                       signals facilitate target detection by concentrating sound energy
bat produces ultrasonic signals and uses information carried by                   in a narrow frequency band over an extended period of time.
echoes to detect, localize and discriminate objects in the envi-                  During target approach and interception, the bat emits broad-
ronment. It is well established that echolocating bats adapt the                  band vocalizations that support target localization in azimuth,
duration, spectrum, directional aim and timing of sonar signals                   elevation and range, as each frequency band in the echo provides
in response to information extracted from echoes (Griffin, 1958;                  a time marker for its arrival at the bat’s ears (Moss and Schnitzler,
Jen and McCarty, 1978; Petrites et al., 2009; Moss and Surlykke,                  1995; Surlykke and Moss, 2000). In addition, the FM bat actively
2010). Past research has considered the functional importance                     adjusts the duration of signals to avoid overlap of sonar emissions
of adaptive control of bat sonar call parameters (pulse duration,                 and echoes, and modifies sonar call intervals to receive echoes
interval, spectrum, and beam aim) in the context of behav-                        from one sonar emission before producing the next (Kalko, 1995;
ioral tasks, such as prey capture and obstacle avoidance, and the                 Wilson and Moss, 2004; Surlykke et al., 2009b).
environment in which the bat operates, e.g., open space, forest                       The bat’s adjustments of sonar signal repetition rate and dura-
edge, or within dense vegetation (Griffin et al., 1960; Kalko and                 tion are tied to target range; however, echolocation call parame-
Schnitzler, 1989, 1993; Simmons et al., 1979; Surlykke and Moss,                  ters also depend on the bat’s azimuth and elevation relative to a
2000; Siemers and Schnitzler, 2004; Moss et al., 2006; Jones and                  selected prey item, and most importantly, its plan of attack. If a
Holderied, 2007). Layered on the adaptive changes in sonar signal                 bat approaches an insect, flies past it and returns to intercept it,
parameters is the temporal patterning of calls, but the functional                the temporal patterning of the bat’s signals are distinctly different
importance of this behavior is not well understood. Here, we                      from those produced by the bat if it flies directly to attack the prey
compare the global temporal patterning of sonar vocalizations                     (Moss and Surlykke, 2001; Moss et al., 2006). Thus, the temporal
in different situations from both field and laboratory studies of                 patterning of the bat’s echolocation signals provide explicit data

www.frontiersin.org                                                                                                       May 2014 | Volume 5 | Article 168 | 1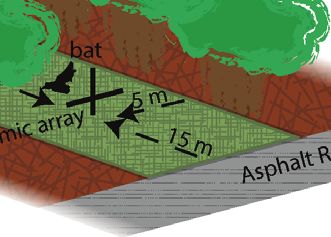
Kothari et al.                                                                                                    Bat sonar signal timing control

on its adaptive motor commands to actively probe objects in the         bat sonar calls, including wing beat, background clutter, target
auditory scene.                                                         motion, and bat flight trajectory. We hypothesize that for more
    In more challenging behavioral contexts, the bat produces           demanding spatio-temporal localization tasks, the echolocating
clustered groups of vocalizations, previously termed sonar “strobe      bat actively adjusts the timing of calls to increase the reliability
groups,” because three or more signals within such a group typi-        and/or resolution of spatial and temporal information acquired
cally have relatively stable pulse intervals (5% tolerance), and are    from echoes.
flanked by calls with larger intervals (Moss et al., 2006). Here we
refer to these call groups as sonar sound groups, to include the        METHODS
production of two, as well as three or more calls emitted in clus-      Audio recordings were taken from echolocating big brown bats,
ters, surrounded by longer pulse intervals (1.2 times the mean          behaving in the lab and the field, and the focus here is on the
interval within the call cluster). For call pairs, or doublets, it is   timing of sonar call production. Microphone and data acquisi-
not relevant to consider the stability of call intervals, and hence     tion systems were specific to the field and lab studies and are
the term “strobe” would not apply. Petrites et al. (2009) and           detailed below. Previously, Moss and Surlykke (2001) and Moss
Hiryu et al. (2010) have defined “strobe groups” slightly differ-       et al. (2006) defined sonar sound groups as clusters of three or
ently. However, the basic concept of a group of sounds with near        more vocalizations which occur with a near constant PI (within
constant pulse intervals, surrounded by calls with larger intervals     5% error with respect to the mean PI of the sound group), and
remains the same.                                                       are flanked by calls with a larger PI at both ends (at least 1.2
    A previous study of the vocal behavior of echolocating bats fly-    times larger). We refer to the property of sound groups flanked
ing in environments with acoustic clutter reported that big brown       by calls with larger PI at both ends as meeting an Island Criterion
bats produce pairs of vocalizations, or sound doublets, flanked         (see Figures 1C,D). The terminology Island Criterion refers to
by calls with longer intervals (Hiryu et al., 2010). Furthermore,       the temporal isolation of sonar sound groups within the ongoing
these pairs of vocalizations showed specific and reliable differ-       stream of sonar vocalizations. Additionally, we term the near con-
ences between the frequency content of individual calls. The big        stant PI within a sound group as meeting a Stability Criterion (see
brown bat altered the frequency of the second vocalization in the       Figure 1D). Since the Stability Criterion cannot be defined for
doublet with respect to the first, and it was hypothesized that such    sonar call doublets which are pairs of sonar sounds produced with
spectral adjustments permit the disambiguation of echo cascades         a short PI compared with surrounding calls, sonar sound doublets
from the first and second vocalization in the pair. The change in       are characterized solely by the Island Criterion (see Figure 1C).
frequency across vocalizations in a sonar sound doublet suggests        The Island Criterion was used in the current study, to character-
that the bat combines echo information from the first and sec-          ize a broader scope of temporal call patterning, and we collectively
ond calls to represent a complex environment. In this way, the bat      refer to clustered signals as Sonar Sound Groups. Hence, sonar
may be integrating echo information over a sequence of acoustic         sound groups with three or more clustered sonar sounds satisfy
snapshots (see Moss and Surlykke, 2001).                                both the Island Criterion and the Stability Criterion, whereas the
    Other studies of bats foraging in the laboratory have high-         sonar sound doublets only satisfy the Island Criterion.
lighted the temporal patterning of sonar calls produced by bats.
Moss and Surlykke (2001) and Moss et al. (2006) reported that           FIELD RECORDINGS
the prevalence of sonar sound groups was greater when the big           Field recordings of E. fuscus were taken at two different sites
brown bat foraged close to background clutter than in the open          (Figure 2; sites A and B). Recordings at site A were carried out
room. They observed that bats tended to produce sonar sound             in the months of August and September of 1999, when bats
groups when selecting a target, changing the direction of the           were commuting from a roost in Rockville, MD, U.S.A. The bats
flight path, or when the bats were in close proximity to obstacles.     emerged from their roost which was a small opening in the roof
These observations led to the hypothesis that sonar sound groups        of a town house. The opening faced a group of trees, and a hand
have immediate consequences for the bat’s perception of space           held ultrasound microphone was used to record the vocalizations
and are used in planning a flight trajectory that requires a more       as the bats flew out (Figure 2A). Further details of the methods
detailed and updated estimate of target localization (Moss and          and the site of the 1999 field recordings are reported in Surlykke
Surlykke, 2001; Moss et al., 2006). These ideas demand a more           and Moss (2000). Recordings were made at Site B in the month of
complete investigation, and in this article, we further consider the    May, 2013. Site B was located at Lake Artemesia, MD and can be
echolocating bat’s temporal control of sonar calls to represent the     briefly described as a rectangular open space (approximately 15×
environment in a variety of habitats and behavioral contexts.           30 m) flanked by a baseball field and a deserted road on either
    Here we compare echolocation behaviors in several distinct          end of its longer dimension and a thicket of trees and a small
studies of the big brown bat (E. fuscus) from both the field and        creek on opposites sides of its narrower dimension (Figure 2B).
the laboratory, and under different environmental and task condi-       The setup at Site B consisted of 9 G.R.A.S. ¼ microphones placed
tions. We re-examine data from our previously published studies         in a cross-shaped array, 6 on a horizontal line and 2 above and
(Surlykke and Moss, 2000; Moss and Surlykke, 2001; Ghose and            1 below the center microphone forming a 4 microphone verti-
Moss, 2006; Moss et al., 2006; Ghose et al., 2009; Surlykke et al.,     cal line. The horizontal microphones were placed from left to
2009b), along with newly collected data. Our focus is on the            right at 0, 1.36, 2.70, 3.60, 4.50, and 6.11 m and the vertical
bat’s temporal control over sonar call production, and we con-          microphones (with the 4th microphone at 3.60 m as center) were
sider a variety of factors that may contribute to the timing of         placed 2.85 and 1.15 m above and 0.57 m below the horizontal

Frontiers in Physiology | Integrative Physiology                                                            May 2014 | Volume 5 | Article 168 | 2
Kothari et al.                                                                                                                                Bat sonar signal timing control

                             A

                             B

                             C             Doublet                                        D    Triplets and higher order call groups
                                       PIn-1             PIn+1                                            PIn-1                     PIn+2

                                                 PIn                                                                PIn PIn+1

                                           Island Criterion                                                       Island Criterion

                             [                   ]         [
                              PIn * 1.2 ≤ PIn-1 AND PIn * 1.2 ≤ PIn+1
                                                                              ]                   [  μ * 1.2 ≤ PIn-1
                                                                                                                       ]        [
                                                                                                                           AND μ * 1.2 ≤ PIn+2   ]
                                                                                                              Stability Criterion
                                                                                                (Only for sound groups with more than 2 calls)

                                                                                                 [   abs(μ - PIn)
                                                                                                         μ          ] [&
                                                                                                                                        ]
                                                                                                                            abs(μ - PIn+1)
                                                                                                                                 μ
                                                                                                                                           < T

                                                                                                      Where μ = (PIn + PIn+1) (mean PI)
                                                                                                             T = 0.05 (Tolerance)

  FIGURE 1 | Sonar sound groups. (A) A sonar call sound stream from a bat                 a stable PI within the call group (Stability Criterion). The stable PI is indicated
  tracking a tethered meal worm following the Simple Motion (SM) trajectory.              here as the mean (µ) and the PI is considered stable if all the PIs within the
  (B) Doublets and Triplet sound groups. (C) A doublet is identified by the PI of the     group are within a tolerance of ±5% (T) of the mean PI. Also, the PI of the calls
  calls at either end of the doublet being at least 1.2 times larger than the PI of the   at either end should be at least 1.2 times the mean PI of the calls in the sound
  doublet (Island Criterion). (D) Higher order sonar sound groups are identified by       group (Island Criterion). Here the example given is of a triplet sound group.

line. The amplified (Avisoft power modules) sounds were digi-                             (Figures 2C–E). The bat’s echolocation signals were recorded
tized, Avisoft USGH 1216 at 300 kHz sampling rate and stored on                           with two Ultrasound Advice microphones positioned on the floor
a laptop computer. We recorded 4 s files, 2 s pre-trigger and 2 s                         and digitized with an IoTech 512 Wavebook at a sample rate of
post-trigger. Triggering occurred when a feeding buzz was heard                           240 kHz/channel. Only the data 3 s prior to the time when the
on a D240x Peterson bat detector. The microphones were cali-                              bat captured or hit the tethered mealworm were analyzed and
brated before and after each recording session with a GRAS 42                             presented here.
AB sound calibrator.
                                                                                          Bats taking tethered insects in the laboratory under different clutter
RECORDINGS FROM FREE FLYING E. FUSCUS IN THE LABORATORY                                   conditions
Here we describe three different experiments, in which flying                             Bats were trained to take mealworms from a tether in an open
bats captured stationary (tethered mealworm) and moving insect                            (uncluttered) flight room. Clutter was introduced by an artificial
(free-flying praying mantises) targets in a closed laboratory flight                      houseplant, resembling a fern, approximately 80 cm in diameter
room, and in some studies in the presence of obstacles. The                               and 50 cm high, hanging from the ceiling at the same elevation as
data presented here have been analyzed to examine and com-                                the tethered mealworm. Trials were run with the tethered insects
pare the bat’s production of sonar sound groups under a variety                           presented in an open room and at different distances from the
of conditions. In all of these laboratory studies, bats flew freely                       vegetation, ranging from 10 to 40 cm. The setup is shown in
in a large flight room, with walls and ceiling lined with acous-                          Figure 2C. For more details, refer to Moss et al. (2006).
tic foam (Sonex 1), and a carpeted floor. Two high speed Kodak
MotionCorders (240 frames/s) or Photron video cameras (250                                Obstacle avoidance task and prey capture in the laboratory
frames/s) recorded the bat’s flight behavior under IR illumina-                           A mist net was used to divide the flight room into two partitions.
tion, and the stereo video data were used to reconstruct the                              One side of the room was further subdivided with a mist net to
bat’s 3D flight path within a calibrated volume in the room                               create two sub-compartments. A tethered mealworm was hung

www.frontiersin.org                                                                                                                     May 2014 | Volume 5 | Article 168 | 3
Kothari et al. Bat sonar signal timing control
A Row of Townhomes
B
Baseball
Field
35 m
bat
Hand-Held
Microphone
5m
15 m
Road
Commuting Bat
alt
Asph
camera 2 camera 1
C D
calibrated sp partition net
ace
target camera 1 camera 2
plant bat A
B target
mic 1
A -> D
bat
mic 2
mic 2
mic 1
MOTION CAPTURE CAMERAS
E 6.4 Meters Camera 1 F 250k
PULSE
MICROPHONE
th 0.5k
pa
BAT ECHO PULSE
m TWO TARGET
an ECHO PATHS
tis
7.3 Meters
MICROPHONE
mantis
release point ROTARY MOTORS FOR
MOVING TARGETS
Camera 2
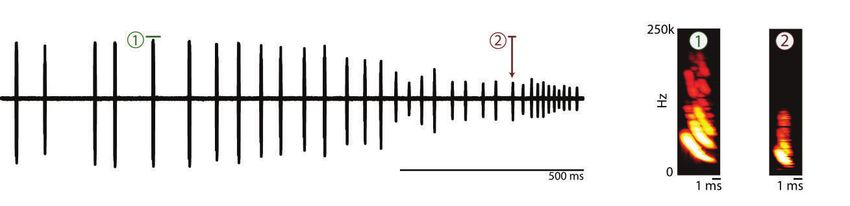
FIGURE 2 | Field and laboratory experimental setups. (A) Schematic of the room was portioned as shown into three sections. The mealworm was hung in
Rockville, MD field site. Bats were exiting from behind a slatted vent near the one of the two smaller sections on the right end of the room, and the bat flew
roof on the side of a town home. This town home was at the end of a row of through either hole “A” or hole “B” do catch the mealworm. Behavioral
town homes that opened up onto a small field with a few trees. The bats’ measurements as described above (i.e., flight path, vocalizations, beam shape)
vocalizations were recorded as they flew out of the house and onto the field. were collected. (E) Top-down view of the laboratory setup for the flying mantis
(B) Layout of the Lake Artemesia, MD field site. The recording site was a experiment. The mantis was released from a platform, and the bat was
narrow corridor of grass between trees, bounded at one end by a baseball field released by the researcher elsewhere in the room. Two cameras recorded the
and at the other by a paved road. The bats were recorded with a microphone 3D flight path, while microphones on the floor and walls (round marks) recorded
array placed at the road-end of the corridor. (C) Laboratory setup for catching the sonar vocalizations, and beam shape, respectively. (F) Schematic of the
tethered mealworms in the presence of clutter. The clutter was a fern-like setup for the platform tracking experiment. A bat is trained to sit on a platform
artificial plant hung from the ceiling, and mealworms were tethered to the and track a tethered mealworm that is moved in the range axis with a computer
ceiling at varying distances from the plant. Two cameras in the corners of the controlled set of rotary stepper motors. The bats’ vocalizations and returning
room capture 3D flight trajectory data, while microphones on the floor recorded echoes are recorded by ultra-sonic microphones in front and underneath the
sonar vocalizations. (D) Experimental setup for the net-hole experiment. The bat, respectively. Motion capture cameras collect ear and head movement data.
randomly in either of the two sub-compartments, and bats were the insect continued to fly when the bat produced ultrasonic sig-
trained to search for the tethered mealworm, and then fly through nals which would otherwise trigger a dive response by the mantis.
an opening in the mist net to collect its food reward in the sub- This experiment enabled us to study the sonar call production
compartment where it was presented (as shown in Figure 2D). behavior of bats in an insect-tracking task. For more details, refer
This task forced the bat to find the food reward behind the mist to Ghose and Moss (2006) and Ghose et al. (2009).
net and negotiate the obstacle (opening in the net) to collect
the reward, hence requiring goal-oriented behavior in a complex LAB RECORDINGS OF E. FUSCUS TRACKING A TARGET WHILE RESTING
environment (For further details, see Surlykke et al., 2009b). ON A PLATFORM
Big brown bats (E. fuscus) were trained to sit on a platform and
Pursuit and capture of free-flying insects in the laboratory track a moving food reward (mealworm—Figure 2F). The food
Bats were trained to capture a freely flying praying mantis. reward was tethered and suspended from a rectangular loop of
Figure 2E shows the experimental setup with an example bat and fishing line with pulleys on 3 corners, and a rotary servo motor
mantis trajectory. The bat was released from different locations (Aerotech BMS60 brushless, slot-less rotary servo motor attached
in each trial while the mantis was released from the same loca- to an Ensemble MP10 motor controller) on the fourth corner
tion. The hearing of the praying mantis was impaired by applying that drove the fishing line in either direction (see Figure 2F). The
Vaseline to its midline ear (Triblehorn et al., 2008), and therefore rotary stepper motor was programmed via a computer interface
Frontiers in Physiology | Integrative Physiology May 2014 | Volume 5 | Article 168 | 4Kothari et al. Bat sonar signal timing control through Matlab (2012a), controlling the velocity, acceleration, parameters of the Simple Motion and two Complex Motions are deceleration, and the distance the food reward traveled. This shown in Table 1. method engaged the bat in naturalistic sonar tracking behavior, The main focus of this experiment was to test the hypoth- while also allowing the experimenter precise control over the tar- esis that the big brown bat actively produces clustered sonar get motion with respect to the bat, which is not possible in free sound groups to resolve spatial location when target trajectory is flight studies. This setup moved the target along the range axis uncertain. In order to introduce target motion uncertainty, trial on a straight line toward the bat. Because the bats were rest- types (CM1, CM2, and SM) were randomized. Within the ran- ing on the platform, the timing of calls would be coordinated dom presentation of trajectory types, a sequence of CM (1 or 2) with respiration but not influenced by wing beat (Wong and followed by two or three SM trials, was presented. All analysis Waters, 2001; Wilson and Moss, 2004; Koblitz et al., 2010). Bat was performed on entire trials of the sequence of CM and SM sonar vocalizations were collected using two Ultrasound Advice trials. UM3 microphones (M1 and M2 in Figure 2F) and were dig- itized using a National Instruments A/D PCI card interfaced ANALYSIS METHODS with Matlab (2012a). Two high speed infrared Phantom Miro Recorded sonar vocalizations were analyzed using custom written cameras and 3 infrared Vicon Motion tracking cameras were Matlab routines. Examples of a doublet and triplet sound groups used to track the head and pinnae movements of the bats. The are shown in Figure 1 and the criteria to identify sonar sound Aerotech Servo motors, audio capture, high speed video and groups is illustrated. Individual details of the analysis for each Vicon motion tracking cameras were all synchronized using the experiment are given below. a single TTL trigger pulse generated via the Matlab-National Instruments A/D interface. Data analysis from the high speed FLIGHT TRAJECTORY ANALYSIS video and Vicon motion tracking systems is not presented here. In the field at site B, the 3D position of free-flying bats was com- Initial stages of this task involved clicker training to condition puted based on arrival time differences at the nine microphones in the bat to associate a sound with the delivery of a food reward; the array using cross-correlation and then computing the position the experimenter then slowly moved the food reward by hand based on the sound emission times and triangulating (Surlykke while the bat used echolocation to track its position. Once the bat et al., 2009a). The 3D position of the bat in the laboratory was learned to track the food reward using echolocation, the insect calculated by using a calibrated region of overlap from the two was hung from the fishing line and initially moved small dis- high speed video recordings (Moss et al., 2006). tances with the rotary stepper motor system. As the bat learned the task, the total target distance was increased to 2.5 m. During ANALYSIS OF SONAR SIGNALS PRODUCED BY BATS training, a single type of target motion was used: The target The emitted sounds were analyzed using custom Matlab software started at a distance of 2.5 m, accelerated at a rate of 7 m/s2 , trav- to relate sound features, i.e., pulse timing, duration, and interval, eled a distance of approximately 2 m with constant velocity of to the bat’s 3D position and distance to targets and obstacles. For 4 m/s (mimicking the approximate flight velocity of a bat dur- more details of the sonar vocalization analysis in bat flight experi- ing the approach phase (Hayward and Davis, 1964) and then ments, please refer to Ghose and Moss (2006); Moss et al. (2006); decelerated at a rate of 5 m/s2 . We refer to this motion as Simple Ghose et al. (2009), and Surlykke et al. (2009b). Motion (SM). The end of the trial was marked when the teth- ered mealworm reached the bat. The bat would generally take RESULTS the mealworm in the mouth and in the event it missed, the TEMPORAL CONTROL OF ECHOLOCATION SIGNALS PRODUCED BY bat was then rewarded by hand. Additionally, catch trials were BATS IN THE FIELD introduced, where the mealworm was stopped before it reached Comparing bat echolocation patterns in the field and lab allows the bat to make sure that the bats were not just echolocating one to evaluate natural and artificial constraints on behavior. at random. Most trained bats would stop echolocating as soon Here we report on the natural sonar behavior of big brown bats as the mealworm stopped. The movement of the target with in the field as they (i) commuted from a roost (Site A) or (ii) for- respect to the stationary bat is shown in Figure 3A. Figure 3B aged (Site B). Vocalizations recorded in the late evening when shows an example sonar recording of a bat tracking a mealworm. bats emerged from their roost were classified as “commuting Sonar call spectrograms of an approach call (marked red) and sonar calls.” After bats flew out of their roost, they flew mainly in a feeding buzz call (marked by green) are also shown. As pre- one direction and showed no circling around the roost area. No viously demonstrated by Aytekin et al. (2010), well-trained bats feeding buzzes were recorded in this setting, indicating that bats actively adapt sonar PI according to the distance of the target were not foraging immediately after flying out of their roost. Big (see Figure 3C). Once the bat became skilled at the SM track- brown bats are generally known to fly to foraging sites away from ing task, two novel types of target motion were introduced to their roosts, where they find a high density of prey. The roost- the bat. We refer to these target motions as Complex Motions ing sites are often found in locations, which are safe for the bats 1 and 2 (CM1 and CM2, respectively). In the novel complex and their young, such as man-made structures, caves, mines as motion trajectories, the target first moved toward the bat, after well as tree cavities (Brigham and Fenton, 1986; Agosta, 2002). which it oscillated back and forth before finally reaching the bat. Vocalizations recorded at foraging sites were classified as “for- The target displacement relative to the stationary bat is shown aging sonar calls.” The bat’s flight and acoustic behavior during in Figure 3A (Complex 1–red, Complex 2–black). The different foraging was distinct from that observed in commuting animals. www.frontiersin.org May 2014 | Volume 5 | Article 168 | 5
Kothari et al.                                                                                                                                               Bat sonar signal timing control

                             A

                          Target Distance (m)
                                                  2.5                                                                            Simple Motion
                                                                                                                                 Complex Motion 1
                                                                                                                                 Complex Motion 2

                                                   00                 2000                 4000                                        6000
                                                                             Time (msec)

                            B

                            C                      8 Pulse Duration                          180
                                                     Pulse Interval
                          Pulse Duration (msec)

                                                                                                   Pulse Interval (msec)

                                                   6
                                                                                             120

                                                   4

                                                                                             60
                                                   2

                                                   0                                    0
                                                    0      30 60 90 120 150 180
                                                            Target Distance to Bat (cm)

  FIGURE 3 | Platform experiment. (A) Distance vs. time for each type of target              shown in (A) moving in the simple motion trajectory. Right, spectrograms of
  motion of the tethered mealworm. The blue line represents simple motion in                 the pulses highlighted by the red and green boxes on the left demonstrating the
  only one direction, while the red and black lines are the more complicated,                stereotyped changes in duration and frequency that are correlated with target
  back-and-forth motions. (B) Left, example oscillogram of a sequence of                     distance. (C) Quantification of changes in pulse duration and pulse interval as a
  vocalizations produced by a bat tracking a tethered mealworm in the setup                  bat tracks a moving target on the setup shown in (A).

Table 1 | Motion parameters for each type of target motion a bat was presented with for the platform tracking experiment.

Trial type                                        Forward velocity       Backward velocity                                 Acceleration       Deceleration             Total motion time

Simple motion                                           4 m/s                     NA                                          7 m/s2             5 m/s2                   1.8 s (approx.)
Complex motion 1                                        4 m/s                   3.5 m/s                                      10 m/s2            10 m/s2                  5.3 s (approx.)
Complex motion 2                                        4 m/s                   3.5 m/s                                      10 m/s2            10 m/s2                  5.5 s (approx.)

Foraging bats typically circled in a restricted area, following a                            while it was foraging at site B. Figure 4B shows the correspond-
relatively stereotyped trajectory, in contrast to the commuting                              ing sonar pulse interval (PI) plot. Each marked point (in blue) on
trajectories which were straight in one direction. Many recordings                           the PI plot and the 3D trajectory in Figures 4A,B shows a sonar
at site B contained terminal buzzes, indicating that the bats were                           vocalization. Sonar sound groups are marked in red (doublets)
actively hunting. Figure 4A shows a typical trajectory of a bat                              and black (sound groups with several sonar calls) solid circles

Frontiers in Physiology | Integrative Physiology                                                                                                     May 2014 | Volume 5 | Article 168 | 6
Kothari et al. Bat sonar signal timing control
A B
C D
E
FIGURE 4 | Sonar sound groups under varying conditions. (A) One trial (shown in black squares) qualified as a sound group by our definition. The
plotted in 3D from the Lake Artemesia field site. The bat’s flight path is low (around 120 ms) and high (around 240 ms) PIs correspond to emitting
shown in blue, and timing of the vocalizations with blue dots. Black dots a call per wing beat or only for every second wingbeat respectively.
highlight vocalizations in a 4 call sound group, calls marked in red are Sometimes the bats skipped two wingbeats and PI became even longer,
2-call sound groups (sonar call doublets). The microphone array is shown around 350 ms. (D) Number of sound groups uttered per trial for the
in black. (B) Time vs. pulse interval for the trial shown in (A). As in (A), commuting bats at Rockville, MD; and the hunting bats of Lake
P.I.’s marked with black are 4 call sound groups, and those with red dots Artemesia, MD. (E) Average number of sound groups per trial in the four
are sonar call doublets. (C) Time vs. pulse interval for the recordings of laboratory flight experiments (clutter, nethole, mantis, open room). Green
commuting bats at Rockville, MD. Only one sequence of vocalizations errorbars denote the standard error, blue the standard deviation.
on each plot. The first 3 black solid circles in Figure 4B (and red solid circles in Figure 4A are the doublet vocalizations). The
corresponding 4 black solid circles Figure 4A) indicate a sound sonar sound groups with two calls (red) and four calls (black)
group, which consists of four calls in a series. Similarly the first have been marked in different colors for illustration purposes.
and second red solid circles are doublets (and the corresponding Figure 4C shows the PI plots of sound recordings at Site A when
www.frontiersin.org May 2014 | Volume 5 | Article 168 | 7Kothari et al. Bat sonar signal timing control
the bats were flying out of their roosts and commuting. Sonar p < 0.05
A 7 B 7
sound groups were rarely observed in commuting bats (see one Bat A Bat B
exception marked by black squares) and no feeding buzzes were
6 6
recorded at site A. Figure 4D compares the mean number of
Number of sound groups/sec
Number of sound groups/sec
sonar sound groups recorded when the bats were commuting 5 5 p < 0.05
and foraging (mean of 4.5 ± 1.5 sonar sound groups when the
bats were foraging). All of the recordings at site B were approxi- 4 3.9 4
mately 4.2 s. The recordings at site A were shorter and of variable 3.5
length as the bats flew straight out and did not circle around the 3 3
roosting site. 2.5
2 2
FLYING BATS PRODUCE SONAR SOUND GROUPS UNDER DIFFERENT 1.5
CONDITIONS IN THE LAB 1 1
Here we compare the timing of calls produced by big brown bats
across several conditions in the laboratory. Figure 4E shows the 0 0
SM CM SM CM
mean number of sound groups produced by the bat in the final Trial Type Trial Type
3 s of flight before a successful or failed attempt to capture the tar-
get (tethered mealworm or a flying praying mantis), in the open FIGURE 5 | Sound groups during simple and complex target motions.
room, in the presence of clutter (plant) or with obstacles (nets) in (A) Bat A sound group usage for simple and complex target motion trials.
Blue box represents the middle 50% of the data, red bar is the median.
the environment. Successful attempts are the trials in which the
Black bars detail the range of the data, and red dots are outliers. (B) Same
bat took the mealworm off the tether or captured the free-flying as in (A), but for Bat B.
(deafened) mantis. Failed attempts are trials in which the bat pro-
duced the terminal buzz and hit the insect but either dropped
it or failed to take it off the tether. The mean number of sonar for the CM trials, which was significantly greater than the median
sound groups per trial (3 s of data prior to the time of capture of of 3.5 for the SM trials (p < 0.05 Mann-Whitney U-test). The
the target) increased with an increase in complexity of the envi- median of the number of sonar sound groups produced per unit
ronment and the task. In the open room task, bats produced an time (seconds) for Bat B was 2.5 in the CM trials, which was sig-
average of 7.4 ± 2.1 sonar sound groups per trial. When clutter in nificantly greater than the median of 1.5 in the SM trials (p < 0.05
the form of an artificial plant was introduced to the environment, Mann-Whitney U-test). Moreover, in instances when several SM
the average number of sonar sound groups increased to 8.0 ± 2.4 trials were presented in sequence, the number of sonar sound
sonar sound groups per trial. In the task where the bats tracked groups produced by the bat decreased as trial-to-trial target tra-
and captured a freely flying praying mantis, the mean number jectories became more predictable (data not shown). Box plots
of sonar sound groups was, 9.3 ± 1.8 sonar sound groups per show the spread of the data.
trial. And finally, in the dual task of obstacle avoidance (net hole)
and prey capture, the mean number of sonar sound groups was Comparison of call group parameters across different conditions
9.7 ± 4.7 sonar sound groups per trial. All numbers reported here In addition to producing sonar calls, as presented in Figures 4, 5,
are per trial. bats actively adjusted other sonar signal temporal parameters.
Here we compare pulse intervals of sonar sound groups across
Bat tracking an erratically moving target while resting on a different experimental conditions (Figure 6A). As noted above,
platform commuting bats do not produce sound groups and therefore no
Field, net, plant and free-flight insect capture experiments all data from recordings at field site A is included here. The average
show that bats produce sonar call groups under conditions of sound group PI (Pulse Interval) for bats flying under conditions
clutter or dynamic target trajectory. Here we extend this work to of clutter was 35.4 ± s.e.m. of 7.2 ms. Average sound group PI
explicitly test the hypothesis that bats actively control the timing for bats performing in the net hole and mantis experiments was
of calls and produce an increased number of sonar call groups 25.1 ± s.e.m. of 2.8 ms and 29.8 ± s.e.m. of 6.9 ms respectively.
under conditions of target trajectory uncertainty. When the bat captured tethered mealworms in the open room
condition, the average sound group PI was 33.6 ± s.e.m. of 6.2 ms.
Increase in sound group doublets and triplets with increase in When the bat tracked tethered meal worms from a resting posi-
uncertainty in target position tion on a platform, the average sound group PI was 44.7 ± s.e.m.
Box plots showing the number of sonar sound groups produced of 0.5 ms. In field site B, the average sound group PI was 118.2 ±
by bats tracking a target in the CM and SM trial sequences are dis- s.e.m. of 8.2 ms. Many of these pairwise comparisons of PI in dif-
played in Figures 5A,B for two bats, Bat A and Bat B, respectively. ferent environments were significantly different from one another
Both bats showed a significant decrease in the number of sonar (Table 3). To summarize, PI’s of experiments in the large flight
sound groups in the sequence of SM trials, as the predictability of room were comparable, but significantly less than the mean PI of
the target position increased in repeated SM trials, as compared sonar sound groups produced by bats in the platform experiment,
to randomly introduced CM trials. The median number of sonar while bats hunting in the field produced sonar sound groups
sound groups produced per unit time (seconds) for Bat A was 3.9 with the largest PI’s. The net hole experiment in the large flight
Frontiers in Physiology | Integrative Physiology May 2014 | Volume 5 | Article 168 | 8Kothari et al. Bat sonar signal timing control
Table 2 | Number of sounds, 2, 3 or more than 3, calls contained in
A 250 S.D. sound groups for each experimental condition.
S.E.
Mean Pulse Interval (msec)
200 Clutter Net Mantis Open Platform Field-
hole capture space foraging
150
N=2 77.5 82.5 83.9 72.9 89.5 78.7
100
115 108 78 100 572 84
N=3 20 16.4 16.1 22 10.5 12.8
N≥4 2.5 1.1 0 5.1 0 8.5
50
Sample size 10 10 10 8 91 10
0 (trials)
Nethole Mantis Open Clutter Platform Field
Room Hunting
Values in percentages. For example, 89.5% of sound groups for the platform
B experiment were sound groups with 2 calls (doublets).
1
No of calls
Sound Groups
Proportion of
0.75 within a sound
group that the experimental condition with the highest proportional use
n>3
0.50 of sonar sound groups was in the task in which the bat tracked a
n=3
0.25 n=2 target moving back and forth (Complex Motion trials) from the
platform. All foraging flight experiments in the laboratory and
0
Nethole Mantis Open
Room
Clutter Platform Field
Hunting
the field showed very similar sonar sound group production.
C
0.6 S.D. DISCUSSION
S.E. *
0.5
0.0004 0.0004 < 0.0001 < 0.0001 < 0.0001
By comparing the echolocating bat’s temporal control of sonar
Sonar Sound Groups
vocalizations in both field and laboratory settings, it is evident
Porpotion of Calls in
0.4
that bats increase the production of sonar sound groups when
0.3 faced with challenging tasks, e.g., tracking and capturing a target
with an unpredictable trajectory or taking prey in the presence of
0.2
clutter. We found that when bats are foraging in the field, they
0.1 produce sonar sound groups during the approach stages of insect
0
capture, well before the terminal buzz, presumably because they
Nethole Mantis Open
Room
Clutter Platform Field
Hunting
require higher spatio-temporal localization accuracy to position
(SM/CM)
an insect with a potentially erratic flight path. In contrast, when
FIGURE 6 | Sound group parameters across conditions. (A) Mean pulse the bats are commuting from a roost to a foraging site, almost no
interval time for sound groups in each experimental condition. Standard sonar sound groups were recorded. These results parallel those
error in green, standard deviation in blue. The mean P.I. for bats hunting in found in the lab. When the bat is flying in an open flight room,
the field is significantly greater than all other experiments. Refer to Table 3 comparatively few sonar sound groups are produced; but when
for a pairwise comparison of the mean sonar sound group PI between
the bat is catching tethered insects in the presence of acoustic clut-
conditions. (B) Proportion of 2, 3, or ≥3 call sound groups produced in each
experimental condition. (C) Proportion of sounds produced by the bats in ter, there is an increase in the production of sonar sound groups.
sonar sound groups as compared to the total number of sounds produced Furthermore, in the net hole experiment, where the bat had to
under different behavioral conditions. Standard error in green, standard shift its attention between an opening in the net and a more dis-
deviation in blue. tant tethered insect, there was a large increase in the production
of sonar sound groups. Lastly, we found that when the bat is
tracking erratically moving prey items, either from a resting posi-
room resulted in the shortest sonar sound group PI’s, presumably tion on a platform or catching a flying insect on the wing, the
because the room was partitioned into smaller quadrants for this prevalence of sonar sound groups increased significantly. Taken
experiment. Figure 6B compares the mean number of sounds in together, these results provide further evidence that bats actively
sound groups across the different conditions. Table 2 summarizes produce sonar sound groups when faced with challenging spatial
the proportion of time the bat produced sonar sound groups with tasks.
2, 3, or more than 3 sonar calls (N = 2, N = 3 or N > 3 respec- It has been well documented that bats actively adjust a number
tively). Our data also indicates that on average bats produce sonar of call parameters (sonar beam direction, frequency, intensity,
sound groups with more calls (N ≥ 3) in the field compared to duration, and interval) as they perform echolocation tasks in
the laboratory. diverse settings (Schnitzler and Kalko, 2001; Ghose and Moss,
In one further set of analysis, we examined the bat’s propor- 2003; Moss et al., 2006; Surlykke and Kalko, 2008; Chiu et al.,
tional use of sonar sound groups across laboratory tasks and 2009; Surlykke et al., 2009a,b; Aytekin et al., 2010; Brinkløv et al.,
field conditions. For this analysis, we compared the proportion 2010; Mantani et al., 2012; Jakobsen et al., 2013; Ratcliffe et al.,
of sonar pulses the bat’s produced as part of sonar sound groups 2013). The overarching goal of the current report is to re-examine
compared to the total number of sounds produced by the bat dur- the hypothesis that temporal patterning of sonar vocalizations is
ing each behavioral condition (Figure 6C). This analysis shows central to the bat’s success at navigating and intercepting prey
www.frontiersin.org May 2014 | Volume 5 | Article 168 | 9Kothari et al. Bat sonar signal timing control
under complex laboratory and field conditions and to develop behavior, indicating that temporal patterning of sonar vocaliza-
insight in to the perceptual consequences for the bat’s produc- tion is a strategy employed by the big brown bat to improve its
tion of sonar sound groups. In the sections below we attempt spatio-temporal resolution of an uncertain target’s position.
to shed light on some of the basic questions regarding sonar
sound groups: (1) Do sonar sound groups have behavioral sig- DE-COUPLING SONAR SOUND GROUPS FROM WING BEAT STROKES
nificance? (2) Under what circumstances do bats produce sound The production of sonar calls can be energetically expensive and
groups? (3) How does the bat adapt its sonar behavior to differ- hence coupling sonar calls with the upstroke of the wing beat
ent environmental or clutter boundaries? (4) How might sonar cycle, and therefore coinciding with exhalation (Suthers et al.,
sound groups perceptually sharpen spatio-temporal localization 1972) can help reduce the energy cost of sonar vocalizations
in bats? The answers to these questions will help us to advance (Speakman et al., 1989; Speakman and Racey, 1991). A previous
our understanding of temporal processing in spatial perception study by Moss et al. (2006) examined the relation between sonar
by sonar in bats. call production and wing beat. The results indicate that for sonar
vocalizations of freely flying bats in the laboratory, calls with pulse
DO BATS ACTIVELY PRODUCE SOUND GROUPS TO ENHANCE intervals larger than 70 ms were coupled to the upstroke of the
INFORMATION CARRIED BY ECHO RETURNS? wingbeat, but for PIs shorter than 70 ms, call timing occurred
One of the first and very important questions one must ask when across different phases of the wingbeat cycle (see Moss et al.,
examining the temporal patterning of sonar signals is whether call 2006, for more details). In this earlier study, however, analysis
clustering has functional significance for the animal. In this con- included only measurements of the peak and trough of the bat’s
text, we emphasize that the definition of sonar sound groups is wing beat cycle. Because the bat’s wing beat can show asymme-
arbitrary and defined by the researcher (see Moss et al., 2006), tries in the up/down stroke excursion, it is important to look more
and should be updated as we learn more about sonar behavior closely at the relation between sonar sound group production and
to capture information that has behavioral relevance. Relevant wing beat.
to this point, we note that the average PI of sound groups in Koblitz et al. (2010) examined emission times of sonar sound
the field are much longer (115 ms) than in any condition in the groups and their coupling with different phases of wing beat in
lab (25–37 ms), which suggests that the environmental conditions the big brown bat. Their results indicate that the emission of sonar
directly influence the intervals of sonar sound groups used for sound groups has a tri-modal distribution. The first call of the
spatial perception. sound group occurs at the end of the down stroke, the center of
The data we have presented here provides evidence that bats the sound group occurs when the wings are horizontal and the last
actively produce sonar sound groups under task conditions that call of the sound group occurs at the end of the upstroke. In this
require spatio-temporal accuracy in tracking and figure ground study the bats were trained to fly across a room without any obsta-
segregation. Figure 4B shows that in the field when bats emerge cles or acoustic clutter. In future research, it would be interesting
from their roosts and are commuting to another site, they pro- to analyze the relation between the sonar sound group emission
duce very few sonar sound groups. Feeding buzzes were never patterns and wing beat when a bat is performing complex flight
observed in this situation, indicating that the bats were not maneuvers.
actively engaged in searching or tracking prey as they emerged In the experiment reported here in which bats tracked a mov-
from their roosts, and we infer that spatial localization require- ing target from a stationary position on a platform, sonar sound
ments were low. In contrast, actively foraging bats produce a groups were prominent (Figure 5). Obviously, wing beat is com-
significantly greater number of sonar sound groups as they engage pletely absent in bats echolocating from a platform; however, bats
in goal-oriented tasks. would be expected to coordinate their sonar call production with
One way to test the functional importance of a behavior is respiration to optimize on energy consumption. We have not
to modify certain environmental parameters and then observe measured the respiration of bats while they perform the track-
the animal’s responses. The bat’s echolocation behavior in the ing task on the platform, and this could be investigated in future
platform target tracking experiment reported here serves to experiments.
illustrate how the bat actively produces sonar sound groups
when it encounters uncertainty in the trajectory of the target SPATIALLY-GUIDED BEHAVIOR
(see Figure 5). The complex target trajectories (CM trials) were The data presented in this report suggest that echolocating bats
designed to have multiple back and forth motion (Figure 3A— increase sonar sound group production in the context of spatially
red and black motion trajectories). A bat introduced to CM challenging behaviors. When a bat is flying in an open room in the
trials for the first time would experience uncertainty in the tar- laboratory, sonar sound group production is relatively low. When
get’s spatio-temporal position compared to the simple motion the bat is navigating through obstacles, however, sonar sound
target trajectory on which the bat was initially trained. When groups are produced as the bat inspects each opening in a net
the bat tracked the target moving with the CM trajectory it through which it can fly to gain access to a food reward. This com-
increased the number of sound groups produced per unit time parison suggests that sound group production is not used solely
(seconds) (Figure 5) as compared to when the bat tracked the in the context of hunting, but is also employed when the bat is
target with repeated SM trajectories. This experiment there- negotiating obstacles. These laboratory results are consistent with
fore provides direct evidence that changing the complexity and data from field recordings. Furthermore, bats hunting in the field
uncertainty of the moving target changes the bat’s echolocation sometimes, but not always, produce sound groups just prior to
Frontiers in Physiology | Integrative Physiology May 2014 | Volume 5 | Article 168 | 10Kothari et al. Bat sonar signal timing control
the buzz phase, indicating that this call pattern may be important in cluttered environments must be able to discriminate between
for target capture. By contrast, bats commuting in a familiar envi- acoustic clutter resulting from vegetation and their desired tar-
ronment produce very few sound groups. This comparison offers gets. Our results (Figure 4) indicate that in the experiments when
another demonstration of how a bat increases sound group pro- bats had to capture tethered mealworms placed near an artificial
duction during goal-directed behaviors, but not during routine plant or in the experiment in which bats were required to localize
commuting flight. Furthermore, considering that sonar sound an insect behind an opening in a mist net, the animals increased
group production increases under challenging conditions (i.e., the rate of sonar sound group production.
spatial navigation around obstacles, insect capture), we provide
evidence that sonar sound groups are used actively by bats when Bats scale the PI of sonar sound groups according to the
they attempt to gather more detailed information about the loca- boundaries of their immediate environment
tion of objects in the environment. This idea is supported by the Modulating PI can be an effective strategy to avoid mixing of
finding that bats used sonar sound groups most frequently when calls and echoes from distant clutter, which may represent the
it tracked the complex motion of the target from a resting position effective boundary of the bat’s active space. A survey of field site
on a platform. The complex motion tracking condition may cap- B indicates that a bat following a stereotypical flight trajectory
ture some of the target uncertainty a bat encounters in the field as would on average be at a distance from the boundaries (thicket of
it pursues insects engaged in evasive maneuvers. trees) that is approximately four times the distance from bound-
aries (walls, ceiling and floor) in the laboratory. The average PI
TEMPORAL CONTROL OVER SONAR CALLS VARIES WITH TASK AND (Figure 6A) of all the sonar sound group recordings from field
ENVIRONMENTAL COMPLEXITY site B is about 185 ± 27 ms. This scales well with the boundaries
In this article we have presented evidence of temporal clustering of the foraging site. In the laboratory study of the bat resting on
of sonar calls when bats are engaged in a variety of tasks, both the platform and tracking an erratically moving target, the dis-
in the lab and the field, when they are flying freely or tracking tance of the bat from the far wall was 5 m. To allow sufficient
an unpredictably moving target from a stationary position on time for an entire echo stream to arrive from objects distributed
the platform. An important question that arises is whether bats along a range axis of 5 m, a bat would wait 30 ms before produc-
vary the properties of sonar sound groups across different envi- ing its next call in the sound group, and the average PI would be
ronmental conditions and task complexities. In this section we maintained above 30 ms (Figure 6A). A comparison of the sound
compare and further analyze the data presented in Figure 6 to group PI’s when the bat is stationary on the platform and tracking
show that bats indeed modify sonar sound group parameters with a moving target to the sound group PI’s produced by the bat when
environment and task conditions. Most noteworthy are the differ- it is flying under different conditions in the laboratory offers
ences in the prevalence of sound group production, the number strong evidence that bats adjust the PI of their sound groups to
of sounds in a group, and the pulse interval of calls in a group, all the boundaries of their immediate environment (Figure 6A and
of which appear to be related to the uncertainty of the target tra- Table 3). A closer examination of the average distance of the bat
jectory, figure-ground segregation, and the environment in which from the boundaries in each of these experiments (platform com-
the bat echolocates. pared to the laboratory flight experiments) reveals that in the prey
tracking experiment, the bat on the platform is approximately 5 m
Prevalence of sonar sound groups changes according to from the wall, while in the laboratory flight experiments, the bat
uncertainty of target trajectory typically flies through the middle of the room with an average dis-
Sonar call groups were produced by bats as they foraged in the tance of less than 3 meters from the nearest wall (see Figure 2 for
field and the laboratory. Our interpretation of this result is that schematics of each experimental flight room). From the labora-
the bat increases sound group production to more accurately tory to the field, the boundaries of the environment increased by
resolve the location of the insect from the clutter. This inter- a factor of 4, which is approximately the same factor by which the
pretation is further corroborated by the laboratory studies that PI is scaled. Our data suggests that the bat tends to cluster its calls
placed different demands on the bat’s spatial localization by sonar. when it is actively tracking an object of interest, and the PI of the
Specifically, when a bat tracked a moving prey item from a rest- sound group is adjusted by the bat according to the environment
ing position on a platform, its sonar sound group production in which it operates.
increased when the target trajectory was unpredictable. When the A recent study by Hiryu et al. (2010) showed that under
insect moved toward the bat with a simple and already familiar extreme clutter conditions in which the bat reduced its PI to below
velocity path, the bat produced very few sonar sound groups. In that set by the environmental boundary (also referred to as the
contrast, when the bat tracked an insect that moved back and “outer window,” see Wilson and Moss, 2004), it employs a dif-
forth with changing velocities and directions, sonar sound group ferent strategy to disambiguate echo streams between two calls
production increased significantly (see Figure 5A). This result within a sonar sound group. In their study, the bat shifted fre-
suggests that the echolocating bat actively controls the timing of quencies of calls within a sonar call doublet to enable assignment
its calls to track an erratically moving target. between calls and cascades of echoes in a highly cluttered envi-
ronment. In most settings, bats adjust the pulse interval of sonar
Sonar sound groups help bats separate figure and ground sound groups to avoid overlap of echo streams. However, under
Eptesicus fuscus has been observed hunting near vegetation extreme clutter conditions, bats shift frequencies of calls within
(Simmons et al., 2001). To be successful foragers, bats hunting sound groups to disambiguate echo streams (Hiryu et al., 2010).
www.frontiersin.org May 2014 | Volume 5 | Article 168 | 11Kothari et al. Bat sonar signal timing control
Table 3 | p-values for pairwise, two-tailed T -tests performed on the applies to a bat navigating a complex maze or when the environ-
sonar sound group PI data reported in Figure 6A. ment is full of acoustic clutter and many objects are reflecting
echoes. In all of these contexts, sampling information from the
Field Platform Open room Mantis Net
environment is simplified by stable temporal timing of sensory
hunting hole
updates.
ClutterKothari et al. Bat sonar signal timing control Hiryu, S., Bates, M. E., Simmons, J. A., and Riquimaroux, H. (2010). FM echolo- Simmons, J. A., Fenton, M. B., and O’Farrell, M. J. (1979). Echolocation and pursuit cating bats shift frequencies to avoid broadcast-echo ambiguity in clutter. Proc. of prey by bats. Science 203, 16–21. doi: 10.1126/science.758674 Natl. Acad. Sci. U.S.A. 107, 7048–7053. doi: 10.1073/pnas.1000429107 Speakman, J. R., Anderson, M. E., and Racey, P. A. (1989). The energy cost of Jakobsen, L., Brinkløv, S., and Surlykke, A. (2013). Intensity and directionality of echolocation in pipistrelle bats (Pipistrettus pipistrellus). J. Comp. Physiol. A 165, bat echolocation signals. Front. Physiol. 4:89. doi: 10.3389/fphys.2013.00089 679–685. doi: 10.1007/BF00610999 Jen, P. H.-S., and McCarty, J. K. (1978). Bats avoid moving objects more successfully Speakman, J. R., and Racey, P. A. (1991). No cost of echolocation for bats in flight. than stationary ones. Nature 275, 743–744. doi: 10.1038/275743a0 Nature 350, 421–423. doi: 10.1038/350421a0 Jones, G., and Holderied, M. W. (2007). Bat echolocation calls: adaptation and Surlykke, A., Boel Pedersen, S., and Jakobsen, L. (2009a). Echolocating bats emit a convergent evolution. Proc. Biol. Sci. 274, 905–912. doi: 10.1098/rspb.2006.0200 highly directional sonar sound beam in the field. Proc. Biol. Sci. 276, 853–860. Kalko, E. K. V. (1995). Insect pursuit, prey capture and echolocation in pipe- doi: 10.1098/rspb.2008.1505 stirelle bats (Microchiroptera). Anim. Behav. 50, 861–880. doi: 10.1016/0003- Surlykke, A., Ghose, K., and Moss, C. F. (2009b). Acoustic scanning of natural 3472(95)80090-5 scenes by echolocation in the big brown bat, Eptesicus fuscus. J. Exp. Biol. 212, Kalko, E. K. V., and Schnitzler, H.-U. (1989). The echolocation and hunting behav- 1011–1020. doi: 10.1242/jeb.024620 ior of Daubenton’s bat, Myotis daubentoni. Behav. Ecol. Sociobiol. 24, 225–238. Surlykke, A., and Kalko, E. K. V (2008). Echolocating bats cry out loud to detect doi: 10.1007/BF00295202 their prey. PLoS ONE 3:e2036. doi: 10.1371/journal.pone.0002036 Kalko, E. V., and Schnitzler, H.-U. (1993). Plasticity in echolocation signals of Surlykke, A., and Moss, C. F. (2000). Echolocation behavior of big brown bats, European pipistrelle bats in search flight: implications for habitat use and prey Eptesicus fuscus, in the field and the laboratory. J. Acoust. Soc. Am. 108, detection. Behav. Ecol. Sociobiol. 33, 415–428. doi: 10.1007/BF00170257 2419–2429. doi: 10.1121/1.1315295 Koblitz, J. C., Stilz, P., and Schnitzler, H.-U. (2010). Source levels of echoloca- Suthers, R. A., Thomas, S. P., and Suthers, B. J. (1972). Respiration, wing- tion signals vary in correlation with wingbeat cycle in landing big brown bats beat and ultrasonic pulse emission in an echo-locating bat. J. Exp. Biol. 56, (Eptesicus fuscus). J. Exp. Biol. 213, 3263–3268. doi: 10.1242/jeb.045450 37–48. Mantani, S., Hiryu, S., Fujioka, E., Matsuta, N., Riquimaroux, H., and Watanabe, Triblehorn, J. D., Ghose, K., Bohn, K., Moss, C. F., and Yager, D. D. (2008). Free- Y. (2012). Echolocation behavior of the Japanese horseshoe bat in pursuit of flight encounters between praying mantids (Parasphendale agrionina) and bats fluttering prey. J. Comp. Physiol. A Neuroethol. Sens. Neural. Behav. Physiol. 198, (Eptesicus fuscus). J. Exp. Biol. 211, 555–562. doi: 10.1242/jeb.005736 741–751. doi: 10.1007/s00359-012-0744-z Wilson, W.W., and Moss, C. F. (2004). “Sensory-motor behavior of free-flying Moss, C. F., Bohn, K., Gilkenson, H., and Surlykke, A. (2006). Active listen- FM bats during target capture,” in Advances in the Study of Echolocation in ing for spatial orientation in a complex auditory scene. PLoS Biol. 4:e79. doi: Bats and Dolphins, ed J. A. Thomas (Chicago, IL: University of Chicago Press), 10.1371/journal.pbio.0040079 22–27. Moss, C. F., and Schnitzler, H.-U. (1995). “Behavioral studies of auditory informa- Wong, J. G., and Waters, D. A. (2001). The synchronisation of signal emis- tion processing,” in Hearing by Bats, eds A. N. Popper and R. R. Fay (New York, sion with wingbeat during the approach phase in soprano pipistrelles NY: Springer), 87–145. (Pipistrellus pygmaeus). J. Exp. Biol. 204, 575–583. Available online at: Moss, C. F., and Surlykke, A. (2001). Auditory scene analysis by echolocation in http://www.ncbi.nlm.nih.gov/pubmed/11171308 bats. J. Acoust. Soc. Am. 110, 2207. doi: 10.1121/1.1398051 Moss, C. F., and Surlykke, A. (2010). Probing the natural scene by echolocation in Conflict of Interest Statement: The authors declare that the research was con- bats. Front. Behav. Neurosci. 4:33. doi: 10.3389/fnbeh.2010.00033 ducted in the absence of any commercial or financial relationships that could be Petrites, A. E., Eng, O. S., Mowlds, D. S., Simmons, J. A., and DeLong, C. M. (2009). construed as a potential conflict of interest. Interpulse interval modulation by echolocating big brown bats (Eptesicus fuscus) in different densities of obstacle clutter. J. Comp. Physiol. A Neuroethol. Sens. Received: 19 December 2013; accepted: 11 April 2014; published online: 12 May 2014. Neural. Behav. Physiol. 195, 603–617. doi: 10.1007/s00359-009-0435-6 Citation: Kothari NB, Wohlgemuth MJ, Hulgard K, Surlykke A and Moss CF (2014) Ratcliffe, J. M., Elemans, C. P. H., Jakobsen, L., and Surlykke, A. (2013). How the Timing matters: sonar call groups facilitate target localization in bats. Front. Physiol. bat got its buzz. Biol. Lett. 9:20121031. doi: 10.1098/rsbl.2012.1031 5:168. doi: 10.3389/fphys.2014.00168 Schnitzler, H.-U., and Kalko, E. K. V. (2001). Echolocation by insect-eating bats. This article was submitted to Integrative Physiology, a section of the journal Frontiers Bioscience 51:557. doi: 10.1641/0006-3568(2001)051[0557:EBIEB]2.0.CO;2 in Physiology. Siemers, B. M., and Schnitzler, H.-U. (2004). Echolocation signals reflect niche dif- Copyright © 2014 Kothari, Wohlgemuth, Hulgard, Surlykke and Moss. This is an ferentiation in five sympatric congeneric bat species. Nature 429, 657–661. doi: open-access article distributed under the terms of the Creative Commons Attribution 10.1038/nature02547 License (CC BY). The use, distribution or reproduction in other forums is permitted, Simmons, J. A., Eastman, K. M., Horowitz, S. S., O’Farrell, M. J., and Lee, D. N. provided the original author(s) or licensor are credited and that the original publica- (2001). Versatility of biosonar in the big brown bat, Eptesicus fuscus. Acoust. Res. tion in this journal is cited, in accordance with accepted academic practice. No use, Lett. Online 2, 43. doi: 10.1121/1.1352717 distribution or reproduction is permitted which does not comply with these terms. www.frontiersin.org May 2014 | Volume 5 | Article 168 | 13
You can also read