THE ACCELERATION OF RENEWABLES DELIVERED IN 2019 - Encouraging renewable energy in Australia - Clean ...
←
→
Page content transcription
If your browser does not render page correctly, please read the page content below

THE ACCELERATION
OF RENEWABLES
DELIVERED IN 2019
Encouraging renewable energy in Australia
Contact details:
Published by the Clean Energy Regulator
ISSN 2202–0047
© Commonwealth of Australia 2020
This work is licensed under the Creative Commons Attribution 3.0 Australia Licence. To view a copy of this
licence, see http://creativecommons.org/licenses/by/3.0/au.
The Clean Energy Regulator asserts the right to be recognised as author of the original material in the
following manner.
© Commonwealth of Australia (Clean Energy Regulator) 2020
Acknowledgements
This report reflects the efforts of many people. Special thanks to the staff of the Clean Energy Regulator and
the external contributors.
This report has been prepared in accordance with the requirements of section 105 of the Renewable Energy
(Electricity) Act 2000. The data is accurate as at 31 March 2020. For up-to-date figures, please refer to the
Clean Energy Regulator website.
Statements made by third parties in the report do not necessarily reflect the views and opinions of the
Clean Energy Regulator.
Contact:
General enquiries:
Mail GPO Box 621
Canberra ACT 2601
Phone 1300 553 542 if calling within Australia
+61 2 6159 3100 if calling from overseas
13 14 50 translating and interpreting service
133 677 TTY service
1300 555 727 speak and listen service
Email enquiries@cleanenergyregulator.gov.au
Website www.cleanenergyregulator.gov.au
Enquiries about this report:
Manager, Communications and Contract Centre
Clean Energy Regulator
02 6159 3100
Photo acknowledgements:
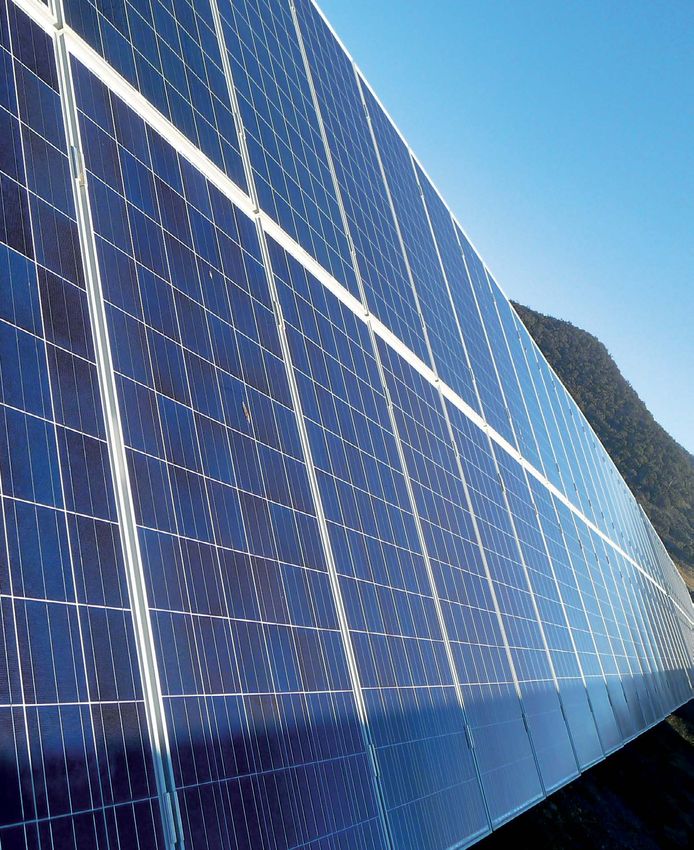
Front cover: Solar Farm, Nyngan, NSW. Photo: Clean Energy Regulator.
Back cover: Wind turbines at Macarthur Wind Farm Victoria. Photo: Powering Australian Renewables Fund.
THE ACCELERATION
OF RENEWABLES
DELIVERED IN 2019
Encouraging renewable energy in Australia

                                            INTRODUCTION   1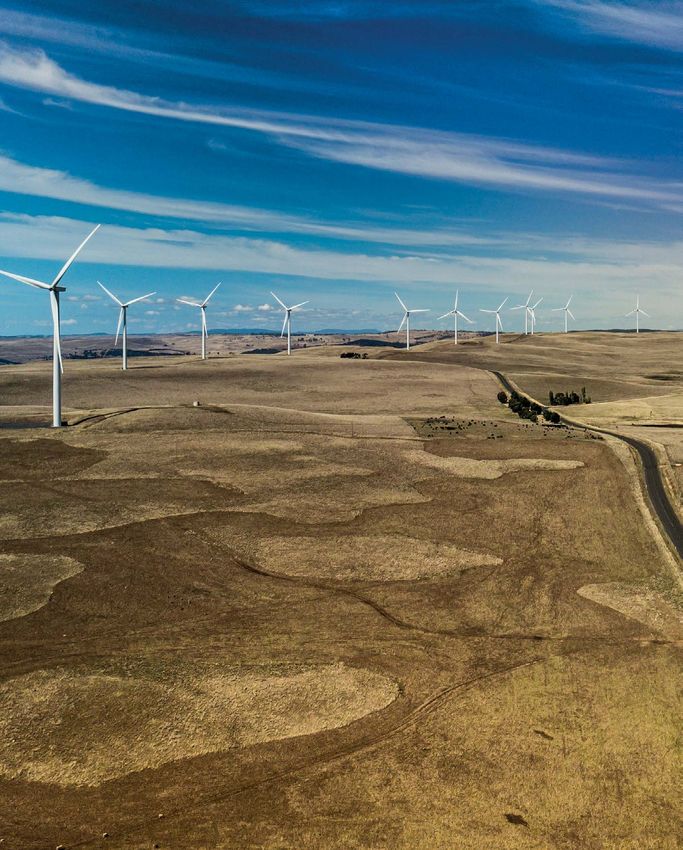
Letter of transmittal

The Hon Angus Taylor MP
Minister for Energy and Emissions Reduction
Parliament House
Canberra ACT 2600

Dear Minister

I am pleased to submit the 2019 Renewable Energy Administrative Report – The acceleration of
renewables delivered in 2019.

The report is submitted for presentation to the Parliament in accordance with section 105 of the
Renewable Energy (Electricity) Act 2000.

The report covers the operations of the Renewable Energy (Electricity) Act 2000 for the 2019
calendar year and the annual statement and supporting information about progress towards
meeting the 2020 Large-scale Renewable Energy Target.

Yours sincerely

David Parker AM
Chair, Clean Energy Regulator
12 August 2020

     2            THE ACCELERATION OF RENEWABLES DELIVERED IN 2019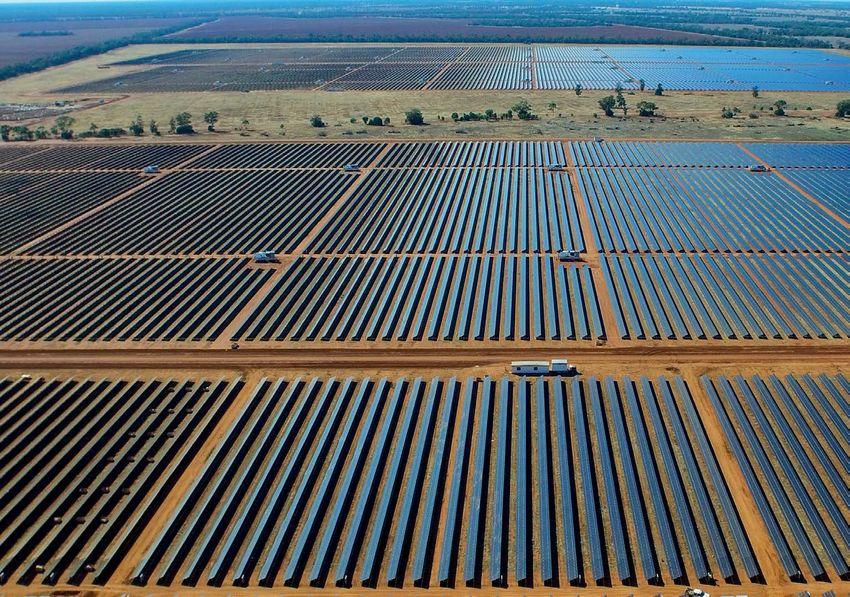
Contents

Letter of transmittal                                                                       2

Chair’s foreword                                                                           4

2019 Annual Statement – Large-scale renewables investment
   continues beyond the 2020 target                                                         5
   Overall findings                                                                         5
   Capacity                                                                                 5
   Certificate prices                                                                       6
   Liability                                                                                6
   Household electricity prices                                                             6
   Looking forward                                                                          6
Outcomes for 2019                                                                          8

Chapter 1: Year in Review                                                                  11
  Australia’s renewable energy acceleration                                                12
  Large-scale capacity increases ahead of the target                                       14
  Small-scale investment continues to grow                                                 15
  Carbon abatement accelerates                                                             16
  Power purchase agreements drive investment in new renewables                             16
  Off-grid solar PV systems                                                                17
  Voluntary large-scale generation certificate demand grows                                19
  Legislated demand                                                                        20
  Addressing challenges in transmission to enable a higher penetration of renewables       22
  The future for renewables                                                                24
Chapter 2: Evolution of distributed energy resources                                       25
  Residential solar PV installation trends                                                 26
  Mid-scale commercial and industrial solar PV, wide scale uptake                          28
  Batteries integrate into the grid                                                        30
Chapter 3: Maintaining the integrity of the renewable energy
  target in a growing market                                                               33
  Inspections program                                                                      34
  Innovating for efficient and effective participation in the scheme                       35
Appendices, Glossary and Index                                                             39
   Appendix A: The year in numbers                                                         40
   Appendix B: Shortfall list                                                              43
   Glossary                                                                                44
   Index                                                                                   46

                                                               INTRODUCTION            3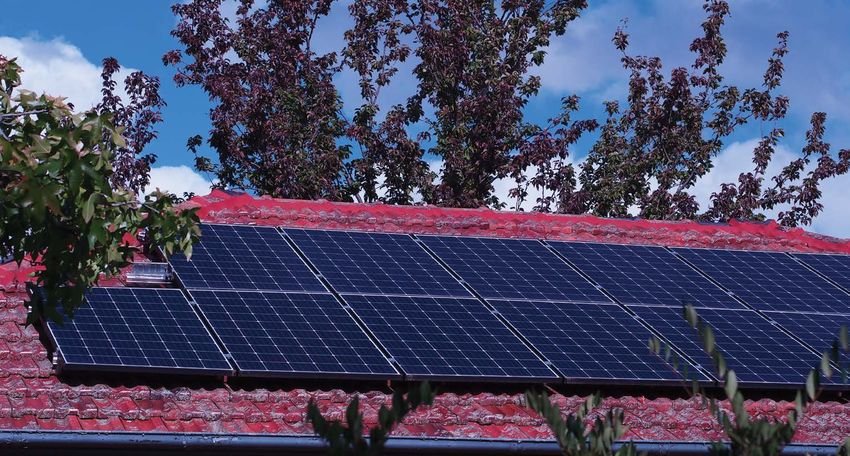
Chair’s foreword                                        the large-scale generation certificate claim
                                                                         processes making it easier and faster for new
                 In 2019, a major milestone was                          participants to participate in the scheme.
                 achieved for renewable energy
                 in Australia. There was enough                          Australia is on track to increase total
                 capacity delivered to guarantee                         renewable generation to 30 per cent by the
                 that the Large-scale Renewable                          end of 2020. New renewables investment is
                 Target of 33,000 gigawatt hours                         now driven primarily by commercial factors
                 of additional renewable energy                          and increasingly by corporations entering
                 will be met.                                            into power purchase agreements to both
                                                                         hedge electricity prices and meet their own
This milestone was met ahead of schedule                                 emissions reduction goals.
and represents the hard work of a growing
and dynamic renewables industry.                                         Although the statutory large-scale target
                                                                         will be met in 2020, the Renewable Energy
Across Australia a total of 6.3 gigawatts of                             Target framework will continue to provide a
additional renewable energy capacity was                                 transparent mechanism to demonstrate use
delivered in 2019, up 24 per cent from 2018.                             of renewable energy and achievement of
Large-scale capacity1 grew by 4.1 gigawatts                              emission abatement goals to their consumers
and small-scale solar Photovoltaics (PV) by                              and supply chain.
2.2 gigawatts. By the end of 2019, over 33
gigawatts of renewable energy capacity1 had                              The market keeps surprising on the upside,
been delivered. This additional capacity took                            innovating with technology and business
the total share of renewables in the National                            models, however current transmission
Electricity Market to 25 per cent by the end                             constraints in Australia’s electricity grid need
of 2019.                                                                 to be addressed with a coordinated response.
                                                                         The Australian Energy Market Operator’s
Australians continue to invest in rooftop                                Integrated System Plan, the Renewables
solar PV to reduce their electricity bills and                           Integration Study and government
gain the environmental benefits. Even with                               investment in transmission upgrades will
reducing Commonwealth incentives, rooftop                                enable Australia’s transition to a low emission
solar PV remains an attractive option for                                electricity grid. The expedited progression of
consumers with short payback periods and                                 key transmission projects will be essential in
declining costs.                                                         unlocking the next wave of renewable energy
                                                                         investment in Australia.
A strong compliance focus is important
to protect the integrity of the Renewable                                The small and large-scale renewable energy
Energy Target, particularly during times of                              schemes were not heavily impacted by
strong growth. As market participation has                               the economic slowdown arising from the
increased and diversified, the Clean Energy                              COVID-19 pandemic at the time of writing
Regulator has continued to make a range                                  this report. The market will continue to be
of system and process enhancements to                                    closely monitored and regular updates will
provide greater efficiency for both large                                be provided through the Quarterly Carbon
and small-scale scheme participants. These                               Market Reports and through the Clean Energy
enhancements include the introduction of a                               Regulator website.
fast-track processing pathway for small-scale
technology certificate claims supported by
solar panel validation, and changes to the
online power station accreditation and
                                                                         David Parker AM
                                                                         Chair, Clean Energy Regulator
1   This includes eight gigawatts of renewable capacity operating prior to the commencement of the Renewable Energy Target.

       4               THE ACCELERATION OF RENEWABLES DELIVERED IN 2019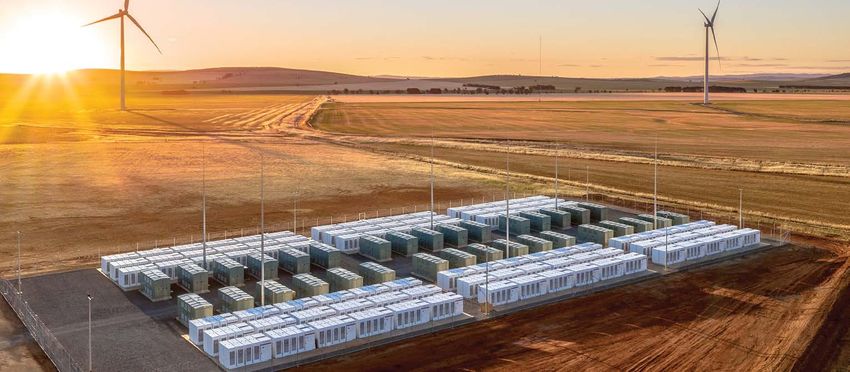
2019 Annual Statement –                                                   decreasing wholesale electricity prices; and
                                                                          residential bills started to decline in part due
Large-scale renewables                                                    to declining total costs of the Large-scale
investment continues                                                      Renewable Energy Target4.

beyond the 2020 target                                                    The Clean Energy Regulator expects
                                                                          approximately 3.4 gigawatts of new utility-
In 2019 sufficient capacity was                                           scale renewable capacity to be delivered in
delivered to exceed the Large-scale                                       20205. A minimum 34,000 gigawatt hours
Renewable Energy Target of 33,000                                         of eligible renewable energy generation is
                                                                          expected in 2020, exceeding the 33,000
gigawatt hours in 2020.                                                   gigawatt hours Large-scale Renewable
                                                                          Energy Target. The estimated generation
Overall findings                                                          could increase substantially if there is an
                                                                          above average hydro generation year.
Across Australia a record 4.1 gigawatts of new
renewable energy capacity was delivered
under the Large-scale Renewable Energy
                                                                          Capacity
Target in 2019, up 17 per cent from the                                   Since January 2016, a total of 12.5 gigawatts
previous record of 3.5 gigawatts set in 2018.                             has been built or is under construction. This
                                                                          is 6.1 gigawatts more capacity than the 6.4
28,300 gigawatt hours of eligible renewable                               gigawatts required to meet the 2020 target.
electricity was generated in 2019 compared
to 23,400 gigawatt hours in 20182.                                        This 6.4 gigawatt threshold was passed in
                                                                          September 2019 with the accreditation of
Generation from large-scale renewables                                    Goldwind’s Cattle Hill Wind Farm in Tasmania.
incentivised by the Large-scale Renewable
Energy Target is estimated to have delivered                              Of the 4.1 gigawatts of large-scale projects
22 million tonnes of carbon dioxide                                       delivered in 2019, 3.9 gigawatts from
equivalent abatement in 2019, an increase                                 utility-scale wind and solar projects and
from 18 million tonnes in 20183. The carbon                               175 megawatts of mid-scale commercial
abatement calculation is a conservative                                   and industrial sized solar PV systems (100
estimate based on the emissions intensity of                              kilowatts to five megawatts) a strong growth
the National Electricity Market in 2019 which                             of 51 per cent compared to 2018.
has decreased by eight per cent compared
to 2018. The emissions intensity of the grid
will continue to reduce as the penetration of
renewables increases.

In addition to decarbonising the grid,
investment in large-scale renewables helped
deliver lower electricity prices for consumers
in 2019. The Australian Energy Market
Commission found the renewable capacity
delivered across the year contributed to

2 Additional to below baseline generation that occurred prior to the Renewable Energy Target. This generation was primarily from hydro and
  bagasse and is approximately 14,000 gigawatt hours each year.
3 This estimate of carbon abatement does not include below baseline generation.
4 Australian Energy Market Commission, 2019 Residential Electricity Price Trends Report.
5 At the time of writing, there have been no announcements regarding the certain delay of projects expected to complete construction in
  2019. As such, our estimate for utility-scale capacity remains at 3.4 gigawatts.

                                                                                            INTRODUCTION                           5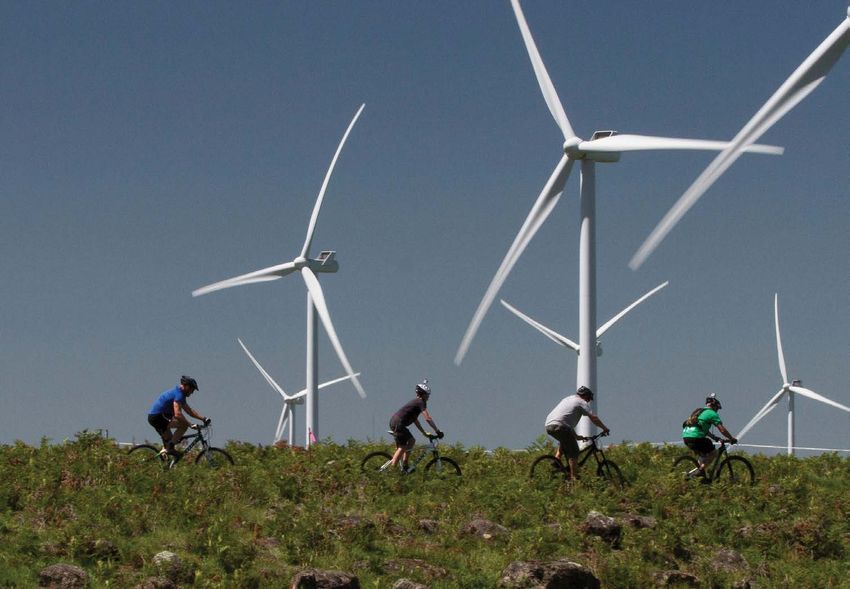
Certificate prices                                                     In the context that the 2020 target will be
                                                                       exceeded, the Clean Energy Regulator views
The increased penetration of renewables in                             the use of shortfall charge to be reasonable
the National Electricity Market has placed                             in the expectation that the majority of
downward pressure on both wholesale                                    shortfall charges will be redeemed in the
electricity prices and large-scale generation                          allowed three-year period.
certificate prices.

Large-scale generation certificate spot prices
                                                                       Household electricity prices
fell from around $48 in January to $39 at the                          According to the Australian Energy Market
end of December 2019, with forward spot                                Commission6, costs associated with the
prices also easing from $39 in calendar 2019                           Large-scale Renewable Energy Target
to $15.50 for calendar 2022.                                           accounted for an estimated average of
                                                                       $8.85 per quarter in 2019 average household
Certificate spot prices are expected to                                electricity bills, a $1 reduction per quarter
continue to moderate in 2020 and beyond                                compared to 2018. This is related to the
as the supply of large-scale generation                                decline in large-scale generation certificate
certificates increases against the static                              prices.
legislated demand of 33,000 gigawatt hours.
                                                                       Looking forward
Liability
                                                                       In 2019, it became clear that substantial
Annual surrender of large-scale generation                             investment in new transmission capacity is
certificates reduced to 76.6 per cent                                  required to enable the full delivery of the
of liability set by the renewable power                                large pipeline of renewable energy projects
percentage for 2019. This was down from                                while maintaining a secure and stable grid.
86.1 per cent for 2018 as a larger amount of                           Grid constraints are leading to curtailment
large-scale generation certificate liability was                       of generation for some operating renewable
taken as shortfall. High differentials between                         power stations and delaying connections in
spot and forward certificate prices provides                           some locations. Transmission investment is
a commercial incentive to utilise shortfall                            underway with significant announcements
charge mechanisms as entities can pay the                              made in 2019 and 2020 for new and
shortfall charge and redeem that with lower                            upgraded interconnectors7; as well as the
price certificates in the future.                                      development of renewable energy zones
The announcement by the Government                                     that will support the connection of new
in the 2019–20 Mid-Year Economic and                                   renewables.
Fiscal Outlook, that it will amend the law                             Longer term, the Australian Energy Market
retrospectively to clarify that no tax is payable                      Operator’s Integrated System Plan—expected
on the refund of large-scale generation                                to be finalised in mid-2020—will provide
certificate shortfall charges, likely encouraged                       a roadmap for necessary transmission
greater use of the shortfall provisions for the                        upgrades to enable the transition of
2019 assessment year and into the future.                              Australia’s grid to allow a higher proportion
                                                                       of renewables.

6 Australian Energy Market Commission, 2019 Residential Electricity Price Trends Report.
7 This includes upgrades to the New South Wales – Queensland interconnector. A new interconnector between South Australia – New South
  Wales has also been listed as a top priority for the Australian Energy Market Operator.

       6              THE ACCELERATION OF RENEWABLES DELIVERED IN 2019
New renewables investment is now
driven primarily by commercial factors
and increasingly by corporations entering
into power purchase agreements to both
hedge electricity prices and meet emissions
reduction goals. The pipeline of projects
tracked by the Clean Energy Regulator at the
end of 2019 includes 1.2 gigawatts of projects
with a signed power purchase agreement.
Beyond this there is 37 gigawatts of projects
with development approval8 across Australia,
which provides the potential for solid future
investment if the transmission network is
upgraded to support this additional capacity.

The economic impacts arising from the
COVID-19 pandemic became apparent in
mid-March 2020, after the year to which this
annual statement relates. However, prior to
finalisation of this full report it appeared the
large-scale renewables industry was holding
up well. No material delays were anticipated
with projects under construction. While
getting new investments to financial close
may be more difficult, the announcements
in the first quarter were strong at 837
megawatts and the Clean Energy Regulator
believes there are strong prospects of more
capacity reaching financial close in 2020 than
the two gigawatts in 2019.

                                                         Maintenance check on wind turbines at
                                                         Gullen Range Wind Farm, NSW. Photo: BJCE Australia.
8   Source: Rystad Energy, Renewables Project Analysis

                                                                 INTRODUCTION                7
Outcomes for 2019

OUTCOMES
FOR 2019
                                           34       million tonnes
                                           of carbon abatement
                                           from generation and
                                           displacement

                                           6.3          gigawatts
                                           of renewable capacity
                                           installed, up 24%

                                           2.2         gigawatts
                                           small-scale solar PV
                                           capacity installed, up 36%

                                           4.1        gigawatts
                                           large-scale renewable
                                           capacity accredited,
                                           up 17%

                                       ✔
                                           35.8              million
                                           small-scale technology
                                           certificates validated,
                                           up 20%

Wind turbine at Snowtown Wind Farm,    ✔
                                           29.6              million
                                           large-scale generation
South Australia. Photo: Chris Oaten,
Clean Energy Regulator.
                                           certificates validated,
                                           up 29%

        8
10.3 gigawatts
of cumulative small-scale solar PV capacity installed,
up 27%
22.9 gigawatts
of cumulative large-scale renewable capacity accredited,
up 22%
16,100 gigawatt hours
of electricity generated or displaced from small-scale
systems, up 20%
28,300 gigawatt hours
generated by large-scale renewable energy power
stations, up 21%
✔
38.1 million
small-scale technology certificates acquitted, up 28%
✔ 25.6 million
large-scale generation certificates acquitted, up 5%
INTRODUCTION 9The Renewable Energy Target
The purpose of the Renewable Energy Target is to encourage new investment in
renewable energy and reduce greenhouse gas emissions. It does this by creating a
market for renewable energy certificates, which helps drive investment in the sector.
On the supply side of the market, participants create certificates for each additional
megawatt hour of renewable energy generated or displaced (no longer required
from the grid). On the demand side, liable entities (mainly electricity retailers) source
certificates in proportion to the total electricity they acquire in an assessment year.
Accredited power stations that operated before 1997 must generate eligible electricity
above a set baseline during a year before large-scale generation certificates can be
created for that electricity.
The Renewable Energy Target comprises the:
• Large-scale Renewable Energy Target, which aims to generate an additional
33,000 gigawatt hours of electricity from renewable sources in 2020, compared
with 1997 levels. The scheme encourages companies to invest in new large-scale
renewable energy power stations, including solar and wind farms, and hydro and
biomass power stations.
• Small-scale Renewable Energy Scheme, which provides incentives for
households and businesses to install small-scale systems. This includes solar
panels, solar water heaters, small-scale wind or hydro systems and air source
heat pumps.
The Large-scale Renewable Energy Target and Small-scale Renewable Energy
Scheme come from the Renewable Energy (Electricity) Act 2000 (the Act).
Under the Act, sectors of the economy that are classed as emissions intensive and
trade exposed are exempt from obligations on the electricity that they use in their
production activities.
For more detail on how the Renewable Energy Target works, see
www.cleanenergyregulator.gov.au
Turbines at Boco Rock, Australian Capital Territory. Photo: Chris Oaten, Clean Energy Regulator.
10 THE ACCELERATION OF RENEWABLES DELIVERED IN 2019YEAR IN REVIEW 1
Australia’s renewable energy acceleration
2019 was another record-breaking year for renewable capacity delivered9. The strong
performance in 2018 was surpassed in 2019 with total renewable capacity delivered under the
Renewable Energy Target (both small-scale and large-scale) increasing by 24 per cent—from 5.1
gigawatts in 2018 to 6.3 gigawatts in 2019.

Investment in solar PV and solar water heater systems under the Small-scale Renewable Energy
Scheme increased across all states in 2019. Solar PV continues to be attractive for households
and businesses looking to reduce their electricity bills; with net system costs to consumers
continuing to fall despite the decreasing subsidy through the Small-scale Renewable Energy
Scheme10.

New South Wales, Queensland and Victoria all saw strong growth in solar PV installations in 2019.
By the end of 2019 the cumulative capacity installed under the Small-scale Renewable Energy
Scheme exceeded 10 gigawatts.
Table 1: Small-scale Renewable Energy Scheme installations and capacity delivered by state and territory

    State/                                    2019              2019 capacity                  Cumulative                   Cumulative
    territory                         installations              (megawatts)                  installations                   capacity
                                                                                                                           (megawatts)
    ACT                                         4,508                             30                   38,883                             122
    NSW                                        83,145                           585                  823,462                           2,433
    NT                                          4,267                             30                   35,536                             103
    QLD                                        80,418                           562                  965,525                           2,946
    SA                                        28,983                             222                 335,263                           1,230
    TAS                                         4,285                             20                   52,222                             157
    VIC                                       88,653                            456                  786,081                          2,009
    WA                                        44,803                             245                 507,403                            1,312
    Total                                   339,062                         2,150   11
                                                                                                  3,544,375                          10,312

The state and territory profile of new utility-scale power station capacity delivered is more
variable due to long construction times and complexity in connecting to the grid. New South
Wales dominated utility-scale capacity delivered with the greatest increase from 2018 while
growth in Queensland declined following delivery of substantial commitments over the period
2016-2018. Key projects delivered in Tasmania and Western Australia in 2019 also resulted in a
significant increase in renewable capacity delivered compared to 2018, albeit from a relatively
small baseline. Cumulatively New South Wales has the largest total renewables fleet by capacity,
owing to a strong portfolio of hydro power stations operating before the commencement
of the Renewable Energy Target combined with new investment in solar and wind projects in
recent years.

9    elivered refers to power stations or installations that are accredited under the Large-scale Renewable Energy Target or installed under the
    D
    Small-scale Renewable Energy Schemes. Delivered utility-scale projects may still be ramping up to full commissioned capacity.
10 The Small-scale Renewable Energy Scheme ends in 2030 with the subsidy provided through the scheme for solar PV decreasing each year
    since 2017. The deeming or forward crediting of certificates declines by one year every year until 2030.
11 This number will continue to increase marginally to the end of 2020 as residual claims for 2019 are submitted and processed.

         12             THE ACCELERATION OF RENEWABLES DELIVERED IN 2019
Salt Creek Wind Farm located on a Merino stud farm near Woorndoo, Victoria. Photo: Mondo.
Table 2: Large-scale Renewable Energy Target capacity delivered by state and territory
State 2019 2019 capacity Cumulative power Cumulative capacity
power (megawatts) station number (megawatts)
stations
ACT 2 1 23 56
NSW 80 1,410 335 8,190
NT 7 3 57 30
QLD 80 1,255 276 4,252
SA 70 403 193 2,696
TAS 4 151 71 2,801
VIC 110 653 359 3,865
WA 38 198 150 997
Total 391 4,074 1,464 22,887
The additional capacity delivered in 2019 drove a record amount of renewable energy
generation across Australia. Total generation and displacement under the Renewable Energy
Target increased by 21 per cent from 36,800 gigawatt hours in 2018 to 44,400 gigawatt hours
in 2019. Of this, 28,300 gigawatt hours was renewable energy generation under the Large-scale
Renewable Energy Target and 16,100 gigawatt hours was from generation and displacement
under the Small-scale Renewable Energy Scheme.
CHAPTER 1: YEAR IN REVIEW 13Figure 1: Total Renewable Energy Target generation and displacement by fuel source
By the end of 2019, total generation from renewables accounted for approximately 25 per cent
of total electricity generation in the National Electricity Market. This is a significant increase from
the end of 2018 when renewables accounted for 20 per cent of generation.
Large-scale capacity increases ahead of the target
In 2019, more than enough capacity was delivered to meet the 2020 target. The strong growth in
large-scale renewables continued throughout 2019:
• 4.1 gigawatts delivered, an increase of 17 per cent from the previous record of 3.5 gigawatts in
2018, bringing the total accredited capacity to 22.912 gigawatts.
• 391 power stations accredited, up from 362 in 2018, with the majority being (88 per cent)
solar power stations between 100 kilowatts to 5 megawatts, and
• 29.6 million large-scale generation certificates validated, a 29 per cent increase on 2018.
• 28,300 gigawatt hours of renewable energy generation, a 21 percent increase on generation
in 2018.
2019 was the hottest and driest year on record13 and hydro generation decreased due to
extended drought throughout Australia. Above baseline hydro generation in 2019 declined
by more than 50 per cent compared to 2018. 2019 was the first year there was more wind
generation in Australia than total hydro generation. The record delivery of utility-scale solar
farms over recent years led to a more than doubling of solar PV generation in 2019 compared
with 2018.
12 This includes approximately eight gigawatts of existing capacity at the start of the Renewable Energy Target in 2001.
13 Australian Energy Market Operator, Quarterly Energy Dynamics Q4 2019, January 2020. Available at: https://aemo.com.au/-/media/files/
major-publications/qed/2019/qed-q4-2019.pdf?la=en
14 THE ACCELERATION OF RENEWABLES DELIVERED IN 2019Solar panels on Ayers Rock Airport. Photo: Voyages.
Figure 2: Above baseline generation by fuel source, 201–2019.
Small-scale investment continues to grow
Investment by Australian households and businesses in small-scale renewable energy systems
grew strongly in 2019:
• 24 per cent increase in the number of small-scale solar PV installed compared with 2018;
almost one in four households now has a small-scale solar PV installation.
• 2.2 gigawatts of small-scale solar PV capacity installed (a 36 per cent increase on 2018),
bringing the cumulative national total to 10.3 gigawatts.
• 16,100 gigawatt hours of electricity generated or displaced by small-scale renewable energy
systems.
• 35.8 million small-scale technology certificates validated.
CHAPTER 1: YEAR IN REVIEW 15Residential rooftop solar panels. Photo: Jonathan Mandl, Clean Energy Regulator.
The average size of small-scale solar PV systems increased in 2019, up by six per cent from
7.2 kilowatts in 2018 to 7.6 kilowatts in 2019. Installations of mid-scale solar PV systems
(15 to 100 kilowatts) on businesses, schools and commercial buildings and households choosing
larger sizes of solar PV installations are factors driving this increase.
Carbon abatement accelerates
The Renewable Energy Target reduces Australia’s emissions by displacing coal and gas used for
electricity generation and water heating with renewable sources such as solar, wind and hydro.
Renewable energy generation increased by 21 per cent in 2019, reducing the emissions intensity
of the National Energy Market to 0.74 tCO2-e/MWh in 2019 down from to 0.7714 in 2018.
Total emissions reductions from the Renewable Energy Target in 2019 reached an estimated
34 million tonnes of CO2-e with 21 million tonnes from the Large-scale Renewable Energy Target
and 13 million tonnes from the Small-scale Renewable Energy Scheme.
Power purchase agreements drive investment in new renewables
Reported15 power purchase agreements underpin over 77 per cent of the total large-scale
renewable project pipeline. Prior to 2017, these agreements were mostly between generators and
large retailers or states and territories with their own renewable energy targets. In recent years,
small retailers looking to increase their market share, and a growing number of corporations
looking to offset their emissions, have actively sought new power purchase agreements.
14 Australian Energy Market Operator: Quarterly Energy Dynamics Q4 2019.
15 Power purchase agreements are commercial agreements and not all may be publicly disclosed.
16 THE ACCELERATION OF RENEWABLES DELIVERED IN 2019Figure 3: Types of power purchase agreements supporting new renewables, 2015 to 2019*
*Based on the year the power purchase agreement was signed.
Over 500 megawatts of new utility-scale renewable capacity in 2019 was underpinned by large
corporations seeking to hedge electricity costs and reduce carbon emissions. The majority of
this capacity was signed by supermarket chains with a portfolio of premises across the country.
A power purchase agreement is often preferred over installing solar PV systems on individual
premises for corporations who do not own their buildings. It removes the complexity and cost
of negotiating with multiple landlords. Indications in 2020 suggest a growing subsector of large
resource corporations looking to power off-grid mines with renewables either through power
purchase agreements or their own installations.
State renewable energy targets also support investment in new renewable energy projects. The
Australian Capital Territory commenced a second reverse auction after the success of the first
reverse auction in 2015. In Victoria successful projects from the 2018 Renewable Energy Auction
Scheme began construction in 2019. Approximately 700 megawatts of the total 886 megawatts
contracted is expected to be delivered in 2020.
In 2019, as part of the Powering Queensland plan, the Queensland government established
CleanCo. CleanCo is a publicly owned energy retailer in the state that will own, operate and
grow the renewable energy assets required to meet their target of 50 per cent renewables by
2030. CleanCo is also responsible for progressing the state’s 400 megawatts of renewables and
100 megawatts of energy storage reverse auction process.
Off-grid solar PV systems
Off-grid solar PV installations demonstrated their potential as a new growth area with capacity
doubling from three megawatts in 2018 to seven megawatts in 2019. The off-grid nature of
these projects shields them from the revenue risks associated with volatile market conditions
and transmission congestion issues that the industry has faced in recent times. Fuel switching
for resource sites is expected to remain a financially attractive option as renewables offer both
a zero-cost fuel and zero carbon risk. The latter is an important consideration as consumers
continue to demand low emissions intensive supply chains, placing pressure on large resource
corporations to maintain low emissions operations.
CHAPTER 1: YEAR IN REVIEW 17Santos deploys solar and batteries to power
Cooper Basin oil wells
Santos is reducing its greenhouse gas emissions from oil and gas production with an
Australian-first rollout of 100 per cent renewable energy to power its oil wells in the
remote Cooper Basin in South Australia and Queensland.
A pilot has been running at Limestone Creek in South Australia since August 2018
and uses solar cells and batteries to power the beam pump that brings oil to the
surface from deep underground reservoirs.
Santos Managing Director and Chief Executive Officer Kevin Gallagher said the pilot
had proven that solar PV and batteries can maintain reliability and availability in the
harsh, off grid environment of the Cooper Basin.
“This nation-leading project is good for the environment, it’s good for reducing fuel
consumption and it is good for the bottom line,” Mr Gallagher said.
“This was Australia’s first oil well running on solar and battery, and following the
success of the pilot, Santos has converted 22 more wells to solar in 2019 with a total
of 2.1 megawatts of capacity. A further 34 conversions planned for this year.”
The project will cost just over $16 million and received a grant of just over
$4 million from the Australian Renewable Energy Agency’s Advancing Renewables
Program that supports a range of development, demonstration and pre-commercial
deployment projects with the potential to provide affordable and reliable renewable
energy in Australia.
Santos plans to commercialise this technology through supply chain and execution
synergies that come with scale.
There are over 200 existing beam pumps across the Cooper Basin that could be
converted and Santos aims to use solar power as the standard energy source for new
onshore oil wells.
Converting oil well pumps to solar power will deliver environmental and commercial
benefits by reducing crude oil consumption, long distance fuel haulage and
greenhouse gas emissions associated with burning crude oil.
This content was provided by Santos.
Royalla Solar Farm, Australian Capital Territory. Photo: Clean Energy Regulator.
18 THE ACCELERATION OF RENEWABLES DELIVERED IN 2019Voluntary large-scale generation certificate demand grows
Total voluntary surrender of large-scale generation certificates in 2019 increased by seven per
cent over 2018.
Sustainability goals are motivating corporations to reduce or offset emissions by voluntarily
surrendering large-scale generation certificates. In 2019 the first large-scale generation
certificates were voluntarily surrendered to offset scope 2 electricity emissions under the Climate
Active Carbon Neutral Standard16 (previously known as the National Carbon Offset Scheme).
Voluntary surrender is also giving business the flexibility to meet renewable energy commitments
under programs such as RE100, a global initiative for companies committed to sourcing 100 per
cent of their electricity from renewable energy sources.
Table 3: Voluntary surrender of large-scale generation certificates, 2018–2019.
2018 2019
Climate Active Carbon Neutral Standard 0 54,018
GreenPower 590,863 486,963
Desalination 62,437 95,441
Other 34,516 73,528
State and territory 0 12,746
Renewable Energy Commitment 0 13,271
Total 687,816 735,967
Throughout 2019, market participants have reported to the Clean Energy Regulator that
businesses are contemplating new models to utilise large-scale generation certificates as an
offset. Large-scale generation certificates have an inherent carbon value as they represent one
megawatt hour of generation which displaces one megawatt hour of fossil fuel generation.
Entities purchasing certificates with the intention to offset scope 2 emissions voluntarily
surrender these certificates through the REC Registry. Existing programs such as Climate Active
or GreenPower accept the surrender of large-scale generation certificates as proof of renewable
electricity use for offsetting purposes.
Large-scale generation certificate prices had remained high for several years as a result of tight
certificate liquidity to meet the 2020 target. Large-scale generation certificate prices declined
in the second half of 2019 as it became clear the target would be exceeded and a surplus of
certificates will arise in the future. Based on current forward declining certificate prices, and
assuming no changes to the policy landscape, large-scale generation certificates could reach a
price equivalence17 with Australian carbon credit units at some time in the early 2020s.
16 P rior to 2019 only Australian carbon credit units or other international abatement units were surrendered to meet requirements under the
Climate Active program.
17 When large-scale generation certificates are converted to carbon abatement equivalent prices based on the emissions intensity of the
National Electricity Market.
CHAPTER 1: YEAR IN REVIEW 19Tomago Aluminium smelter producing approximately 25% of Australia's aluminium. Photo: Tomago Aluminium.
Figure 4: Estimated Large-scale generation certificate and Australian Carbon Credit Unit convergence
Legislated demand
The combined surrender rate for both large and small-scale schemes was 89 per cent, down
five per cent on the surrender rate of 93.3 per cent for the 2018 assessment year. The reduction
in surrender rate is mostly a result of increased paid shortfall in the Large-scale Renewable
Energy Target, which had a surrender rate of 76.6 per cent with 7.7 million large-scale generation
certificates taken as shortfall.
20 THE ACCELERATION OF RENEWABLES DELIVERED IN 2019Tesla battery installation at the Lake Bonney Wind Farm in South Australia. Photo: Infigen Energy.
The actual Large-scale Renewable Energy Target liability required to be acquitted for the 2019
assessment year was 2.1 million certificates above the expected level of 31.2 million large-scale
generation certificates. This was due to higher actual liable electricity demand (up two per cent)
and lower emissions-intensive trade-exposed exemption (down three per cent) from when the
renewable power percentage was set in March 2019. This will result in downward adjustments in
setting the 2021 renewable power percentage.
Some liable entities also surrendered additional large-scale generation certificates in 2019 to
claim a refund on shortfall charges paid for the 2016 assessment year. 2.3 million large-scale
generation certificates were surrendered to redeem a refund of approximately $143 million.
There is now $713 million in consolidated revenue from shortfall charges paid for the 2017, 2018
and 2019 assessment years. Of this, $412 million relates to the payment of shortfall charges for
3.4 million large-scale generation certificates for the 2019 assessment year.
The Renewable Energy (Electricity) Act 2000 allows exemptions from Renewable Energy
Target liability for companies conducting eligible emissions-intensive trade-exposed activities.
Companies eligible for exemption are issued with an exemption certificate. For the new
electricity use method, the certificate details how to determine the amount of exemption in
megawatt hours. The old production calculation method provides the exemption amount in the
issued certificate.
Emissions-intensive trade-exposed entities agree to a commercial arrangement with their
electricity retailer (a liable entity), who can then use the exemption certificate to reduce their
obligation under the Renewable Energy Target.
The number of emissions-intensive trade-exposed entities increased from 93 in 2018 to 98 in
2019. The exemptions for 2019 represent 38,300 gigawatt hours of electricity that can be used to
reduce electricity retailers’ relevant acquisitions. This is a two per cent reduction from the 39,100
gigawatt hours of exemption in 2018.
CHAPTER 1: YEAR IN REVIEW 21Hornsdale Power Reserve – a grid-connected energy storage system co-located with the Hornsdale Wind Farm.
Photo: Clean Energy Finance Corporation.
Addressing challenges in Unexpected network outages demonstrated
the ability of grid-scale batteries to provide
transmission to enable a higher essential short to medium grid stabilisation
penetration of renewables capabilities and avoid rolling blackouts.
The Australian Energy Market Operator In late 2019, the tripping of the Heywood
began the foundation work for long-term interconnector between Victoria and South
planning of the electricity network through Australia resulted in South Australia becoming
the release of the 2020 Draft Integrated islanded. In addition to the re-routing of
System Plan. The Integrated System Plan gas generation, blackouts were prevented
identified “no-regret” new and augmented in part due to the grid-scale batteries in the
transmission infrastructure that provides State—Hornsdale Power Reserve, Lake Bonney
value to the electricity grid in its current Battery System and Dalrymple Battery System—
state and any future states. Some of these quickly switching from charging to discharging
“no-regret” investments progressed further in a manner that maintained frequency within
in late 2019. Announcements were made to allowable limits. Solar and wind generation
upgrade the New South Wales – Queensland also picked up in the short term to allow for
interconnector and to construct a new baseload plants to ramp up and provide the
interconnector between New South Wales and synchronous generation required.
South Australia.
Australian government agencies have
The augmentation to the New South Wales continued to diversify funding priorities to align
– Queensland interconnector has also with the new requirements in a transforming
considered the use of grid-scale batteries as electricity network. The Australian Renewable
they can be completed in half the time of Energy Agency and Clean Energy Finance
standard physical upgrades and at a lower Corporation have directed their investment
cost. The battery option was not adopted strategies and priorities for the coming years
in this case but presents a new alternative to focus on storage technologies to support
way to support grid infrastructure as battery the transition of the electricity grid towards a
costs decline. higher penetration of renewables.
22 THE ACCELERATION OF RENEWABLES DELIVERED IN 2019The Clean Energy Finance Corporation investing
in the grid to support more renewable energy
The Clean Energy Financial Corporation continues to bring a unique combination of
financial expertise, technical knowledge and industry experience to address some of
the nation’s most intractable energy and emissions challenges.
The Clean Energy Financial Corporation finance remains central to filling market
gaps, whether driven by technology, development or commercial challenges. In
supporting the continued growth of the renewables sector, we are also increasingly
focused on renewable energy projects which operate in the most strategic parts of
the grid, and those that potentially benefit from a hybrid of technologies across
solar, storage and wind.
The critical transition to a lower emissions grid must include investment in additional
solar and wind renewables, as well as firming technologies such as pumped storage
which address constrained systems and declining thermal capacity. There are also
significant investment requirements in delivering scale-efficient electricity network
infrastructure and connecting proposed Renewable Energy Zones to load centres.
In parallel, market interest in battery and pumped hydro storage gathers pace,
alongside measures to harness distributed energy resources, deliver virtual power
plants and enhance demand management. Appropriate and planned investment in
these technologies, including those outlined in the Australian Energy Market
Operator Integrated System Plan, all have the potential to deliver a higher
penetration of renewables as we transition to a cleaner energy market.
While awaiting further direction on the Australian Government’s proposed $1 billion
Grid Reliability Fund, the Clean Energy Financial Corporation is looking ahead.
This includes investigating emerging investible opportunities such as pumped
storage, biofuels and hydrogen, alongside our continuing focus on the next wave of
investment in renewable energy and energy efficiency opportunities.
This content was provided by the Clean Energy Financial Corporation.
Commercial solar panel installation, Australian Capital Territory. Photo: Clean Energy Regulator.
CHAPTER 1: YEAR IN REVIEW 23Workers on site at Coopers Gap Farm. Photo: PARF Group.
Record rates of solar PV installations at both The future for renewables
the residential and commercial level are
also presenting challenges in performance The records set in 2019, and continued
management of some distribution networks. strong investment in early 2020, shows
Before the wide-scale uptake of rooftop the ability of the renewables industry to
solar PV, distribution networks experienced mobilise, adapt and overcome market
electricity flow in one direction from challenges. As sectors of the economy shift
predictable electricity sources. Rooftop solar to electrification, including the transport
PV introduces variable and often uncontrolled sector, new opportunities to utilise low cost
bi-directional electricity flow and voltage renewable electricity will open up. It is also
fluctuations. expected that renewables will be the key to
unlock new export industries such as clean
In Victoria commitments to upgrade key hydrogen, ammonia or steel.
distribution networks to plan for 95 per cent
of households to install solar PV have been The wide-scale deployment of solar PV at
announced by Powercor, United Energy and the residential and commercial levels as well
CitiPower. This forward planning will assist as the utility-scale level has exacerbated low
in a smooth transition to a high penetration demand in the middle of the day when solar
of solar PV in those distribution networks by generation is at its peak – this effect is known
allowing for necessary distribution network as the ‘duck curve’. The result leads to low
capacity changes to be made and greater wholesale electricity prices in the middle of
scrutiny of the types of solar PV systems day. Existing technologies such as storage
being installed. This will support greater (including pumped hydro and batteries),
visibility and controllability of solar PV systems demand management and improved
to network service providers and may avoid interconnection/transmission can address
the need for measures such as zero export some of these challenges. Broader market
limits being enforced. A substantial number reforms that appropriately enable and value
of batteries are being piloted as virtual power the services provided by these technologies
stations to assess the benefits to customers will be required.
and network performance.
At the time of writing, the world is facing a
new and unprecedented challenge from the
COVID-19 pandemic. At the time of finalising
the report, renewables at both the small and
large-scale continue to perform during this
very difficult period.
24 THE ACCELERATION OF RENEWABLES DELIVERED IN 2019EVOLUTION OF
DISTRIBUTED ENERGY
RESOURCES
2
Residential solar installation.
Photo: Jonathan Mandl, Clean Energy
Regulator.2019 was another record year for total
rooftop solar PV power stations less than
five megawatts with 2.4 gigawatts delivered.
This surpasses the previous record of 1.7
gigawatts delivered in 2018. There is now 10.7
gigawatts of rooftop solar PV installed under
the Renewable Energy Target, the equivalent
generating capacity of the largest coal fired
generation plant in Australia.
Distributed energy resources are shifting the
production and management of electricity
in Australia, as electricity generation moves
from centralised power stations to millions of
decentralised sources including households
and businesses. Distributed energy sources
have given consumers greater control
over their energy use and supported the
decarbonisation of the electricity grid.
However, this shift to decentralisation
increases the operational complexity for
Australian Energy Market Operator and the
Distribution Network Service Providers.
Residential solar panel installations - part of a Residential solar PV
community microgrid. Photo: Mondo.
installation trends
As solar PV costs have continued to decrease,
it is more affordable for homeowners to
purchase a larger system that covers a higher
proportion of their energy consumption.
The average residential solar PV18 system
size has risen from 5.8 kilowatts in 2018 to
6.4 kilowatts in 2019.
The market has settled combining a five
kilowatt inverter with six to 6.5 kilowatts of
solar panels is the cost effective ‘sweet spot’
for a standard installation. Increasing the
capacity of panels up to 33 per cent over
the inverter capacity provides a higher level
of generation earlier and later in the day; as
well as at peak times for more than half of
the year when solar irradiance is not high.
Stepping up to the next size inverter (eight
kilowatts) with a higher solar PV capacity adds
significantly to system cost and is only likely
to be cost effective for very large households
with significant load during the day or where
battery storage is added.
18 Solar PV systems under 15 kilowatts that are installed on residential homes are classified as residential solar PV systems.
26 THE ACCELERATION OF RENEWABLES DELIVERED IN 2019Efficiency of panels for residential installations has also increased from a historical average of
approximately 15 per cent, approaching 20 per cent in 201919. The average capacity of each
panel installed increased 6 per cent from 289 watts in 2018 to 306 watts in 2019.
Figure 5: Average residential solar PV system capacity and average solar panel capacity, 2011 to 2019
To date, solar PV systems for residential use have primarily been installed by homeowners at
their place of residence. The demand for solar PV by renters has continued to increase. In July
2019, the Victoria Solar Homes Program introduced rebates for installations on rental properties
to ensure the benefits of solar PV can be enjoyed by as many people as possible. The Victorian
Government also supported the Community Energy Hubs Program. At the end of 2019, the
first installation under this program was completed with 52 apartments sharing the benefit of a
combined solar PV and battery system in the apartment block.
If successful, these initiatives will help to expand and diversify the residential solar PV market in
Australia, keeping installation rates high.
19 Clean Energy Reviews, Most Efficient Solar Panels 2020, available at: https://www.cleanenergyreviews.info/blog/most-efficient-solar-panels.
CHAPTER 2: EVOLUTION OF DISTRIBUTED RESOURCES 27Mid-scale commercial and industrial solar PV, wide scale uptake
Mid-scale commercial and industrial solar PV (15 kilowatts to five megawatts) saw steady growth
in 2019 with 11,491 systems installed with a total capacity of 572 megawatts. This was a 12 per
cent increase in the number of mid-scale solar PV systems installed, and a 19 per cent increase in
capacity compared to 2018.
Figure 6: Mid-scale solar PV installations by capacity band
The growth in 2019 is partly attributable to the growing market for retail businesses deploying
mid-scale solar PV across their portfolio of stores with a 64 per cent increase in solar PV
installations compared with 2018. In 2019 the mid-scale market continued to diversify with
more participation from large corporations with a portfolio of solar PV installations across their
buildings nationwide.
28 THE ACCELERATION OF RENEWABLES DELIVERED IN 2019Bunnings Solar Rollout
Bunnings began trialling renewable micro generation projects back in 2009.
These included a solar PV system at Bunnings Warehouse Belconnen (Australian
Capital Territory), and wind turbines at Bunnings Warehouse Port Kennedy and
Bunnings Warehouse Rockingham (Western Australia).
In 2014 a new generation solar PV system was installed at Bunnings Warehouse
Alice Springs (Northern Territory) to further gauge the viability of solar generation.
Since that time 67 solar PV systems have been installed across Bunnings’
Australian network. The systems are generating up to 30 per cent of each store’s
energy needs.
In addition to this, the solar PV system at Bunnings Warehouse Alice Springs was
expanded in 2019 from 100 kilowatts to 475 kilowatts, and battery storage was
introduced; the first of its kind for the network. The system and battery storage are
now producing up to 80 per cent of the store’s energy needs.
Bunnings is currently targeting a reduction of 10 per cent of emissions by 30 June 2025,
based on a 2018 baseline, which factors in the continuing growth of its store network.
This work is part of ongoing efforts to reduce emissions which includes investment in
LED lighting and motion sensor technology to minimise electricity consumption.
In the 2021 financial year Bunnings will install further solar PV systems across its store
network.
This content was provided by Bunnings Group.
Rooftop solar at Bunnings Warehouse, Alice Springs. Photo: Bunnings Group Limited.
CHAPTER 2: EVOLUTION OF DISTRIBUTED RESOURCES 29Batteries integrate into the grid
Batteries continue to be deployed at all levels, from concurrent battery and solar PV installations
on households to utility-scale batteries directly connected to the transmissions network.
State schemes play a key role in uptake at the residential level. Batteries can increasingly be
economically integrated into the electricity system providing essential grid stabilisation abilities at
crucial times. This has assisted in the growth of community and grid-scale batteries.
There were 7563 concurrent solar PV and battery installations in 2019, a 33 per cent increase
in the 5689 battery installations in 201820. Most concurrently installed batteries are installed on
solar PV sized between five and 10 kilowatts. This combination of technologies unlocks the
most additional value by storing excess electricity generated during the day for use during peak
evening hours.
Figure 7: Number of concurrent battery installations by solar PV system size and battery capacity
20 This is based on data disclosed voluntarily to the Clean Energy Regulator on batteries installed concurrently with solar PV.
30 THE ACCELERATION OF RENEWABLES DELIVERED IN 2019When consumer-owned energy storage
devices are combined with rooftop PV,
they can be aggregated and operate
together as virtual power plants. The central
management of these aggregated systems
allows dispatch or consumption of electricity
to manage local voltage or frequency
variations, providing flexibility and stability
to the electricity grid. The South Australia
virtual power plant exemplified these traits.
In October 2019, during an unexpected
outage of the largest generating unit in the
National Electricity Market, Kogan Creek
in Queensland21. Subsequently the power
system frequency immediately dropped
below the normal operating range. The South
Australia virtual power plant detected
this frequency variation and responded
immediately to inject power into the
system to assist in frequency recovery.
The early success of the South Australia Ballarat Energy Storage System. Photo: Consortium
virtual power plant in demonstrating comprising AusNet Services, Spotless, EnergyAustralia
frequency control capabilities across and Fluence.
multiple unexpected outages has
underpinned the expansion of the state’s
virtual power plant from 1,100 to a planned
50,000 systems22. This success has led to
further trials in New South Wales and the
Australian Capital Territory.
Domestic battery.
Photo: Jonathan Mandl, Clean Energy Regulator.
21 Australian Energy Market Operator, AEMO Virtual Power Plant Demonstration, March 2020, available at: https://aemo.com.au/-/media/
files/electricity/der/2020/aemo-knowledge-sharing-stage-1-report.pdf?la=en&hash=AB41C8AF00D7745A26E5C193DEA75BBA.
22 South Australia Department of Energy and Mining, South Australia’s Virtual Power Plant, available at: https://virtualpowerplant.sa.gov.au/.
CHAPTER 2: EVOLUTION OF DISTRIBUTED RESOURCES 3132 THE ACCELERATION OF RENEWABLES DELIVERED IN 2019
MAINTAINING
                                       THE INTEGRITY
                                       OF THE RENEWABLE
                                       ENERGY TARGET IN
                                       A GROWING MARKET

     3
Cycling through Macarthur Wind Farm,
Victoria. Photo: Powering Australian
Renewables Fund (PARF).
Inspections program
As required under the legislation, the Clean Energy Regulator inspects a statistically significant
sample of solar panel systems installed within the last 12 months that have received incentives
under the Small-scale Renewable Energy Scheme. The inspections assess conformance with
scheme eligibility requirements, including whether or not they meet state and territory electrical
safety requirements.
Of the 1910 inspections conducted in 2019, 41 were found to be unsafe or potentially unsafe.
This is an unsafe or potentially unsafe rate of 2.1 per cent, down slightly from 2.2 per cent in
2018. Unsafe is the most adverse rating in the program and is the basis for identifying safety
risks. The agency’s experience has shown there is a small number of inspections where a solar
PV system does pose an imminent safety risk at the time of inspection, such as when there are
exposed live parts or unsecure PV panels.
However, the majority of such PV systems found to be potentially unsafe do not pose an
imminent safety risk. Most were due to water ingress in DC isolators. Of these, the degree of
water ingress varies and in most cases the DC isolator may become unsafe without timely
maintenance but should not pose an imminent risk. Nevertheless, this risk is more than would be
attributable to a substandard system and the practice has been to characterise such instances as
unsafe.
For these reasons, the Clean Energy Regulator distinguishes between PV systems that were
unsafe at the time of the inspection and PV systems that were potentially unsafe at the time of
the inspection.
Table 4: Inspections by state, 2019
State Systems safe Systems substandard Systems unsafe and Number of
potentially unsafe systems
inspected
ACT 36 5 2 43
NSW 323 53 10 386
NT 15 2 0 17
QLD 246 67 8 321
SA 170 57 5 232
TAS 14 14 0 28
VIC 510 100 14 624
WA 204 53 2 259
Total 1,518 351 41 1,910
34 THE ACCELERATION OF RENEWABLES DELIVERED IN 2019Inspecting a solar PV installation. Photo: ECG Electrical. The Clean Energy Regulator provides the results of unsafe and substandard inspections to the relevant state and territory electrical safety regulators that are responsible for electrical safety. The Clean Energy Regulator also provides this information to the Clean Energy Council, which manages the accreditation of solar panel installers and approves the key components used. The Clean Energy Regulator otherwise does not have a safety regulation role. Innovating for efficient and effective participation in the scheme The Clean Energy Regulator continues to support Renewable Energy Target participants by improving processes to reduce regulatory burden while maintaining the integrity of certificate entitlements. CHAPTER 3: MAINTAINING THE INTEGRITY OF THE RENEWABLE ENERGY TARGET IN A GROWING MARKET 35
You can also read