APPENDIX F BEST AVAILABLE CONTROL TECHNOLOGY REPORT - VALENTINE GOLD PROJECT: AMENDMENT TO THE ENVIRONMENTAL IMPACT STATEMENT
←
→
Page content transcription
If your browser does not render page correctly, please read the page content below
VALENTINE GOLD PROJECT: AMENDMENT TO THE ENVIRONMENTAL IMPACT STATEMENT

August 2021

                    APPENDIX F
              BEST AVAILABLE CONTROL
                TECHNOLOGY REPORT
Valentine Gold Project, Assessment of Best Available Control Technology (BACT) Final Report August 2, 2021 Prepared for: Marathon Gold Corporation 36 Lombard Street, Suite 600 Toronto, ON M5C 2X3 Prepared by: Stantec Consulting Ltd. 141 Kelsey Drive St. John's, NL A1B 0L2 Tel: (709) 576-1458 Fax: (709) 576-2126 File: 121416965
VALENTINE GOLD PROJECT, ASSESSMENT OF BEST AVAILABLE CONTROL TECHNOLOGY (BACT)

This document entitled Valentine Gold Project, Assessment of Best Available Control Technology (BACT)
was prepared by Stantec Consulting Ltd. (“Stantec”) for the account of Marathon Gold Corporation (the
“Client”). Any reliance on this document by any third party is strictly prohibited. The material in it reflects
Stantec’s professional judgment in light of the scope, schedule and other limitations stated in the document
and in the contract between Stantec and the Client. The opinions in the document are based on conditions
and information existing at the time the document was published and do not take into account any
subsequent changes. In preparing the document, Stantec did not verify information supplied to it by others.
Any use which a third party makes of this document is the responsibility of such third party. Such third party
agrees that Stantec shall not be responsible for costs or damages of any kind, if any, suffered by it or any
other third party as a result of decisions made or actions taken based on this document.
VALENTINE GOLD PROJECT, ASSESSMENT OF BEST AVAILABLE CONTROL TECHNOLOGY
(BACT)

Table of Contents
ABBREVIATIONS .....................................................................................................................III

1.0       INTRODUCTION ............................................................................................................ 1
1.1       PROJECT OVERVIEW .................................................................................................. 1
1.2       REGULATORY CONTEXT ............................................................................................. 3
1.3       BACT ANALYSIS OBJECTIVE ....................................................................................... 5

2.0       PROJECT COMPONENTS AND TECHNOLOGIES CONSIDERED .............................. 6
2.1       POWER SUPPLY ........................................................................................................... 6
          2.1.1   Main Power .................................................................................................... 6
          2.1.2   Comparison of Power Supply Options .......................................................... 10
2.2       BACK-UP POWER ........................................................................................................11
2.3       BACK-UP SPACE AND COMFORT HEATING .............................................................12
2.4       MINING EQUIPMENT ...................................................................................................12
          2.4.1   Dewatering Pumps ....................................................................................... 12
          2.4.2   Light Towers ................................................................................................ 14
          2.4.3   Off-Road Mobile Mining Equipment .............................................................. 14
2.5       ORE PROCESSING ......................................................................................................16
          2.5.1   General Ore Processing and Leaching Reagents......................................... 16
          2.5.2   Location ....................................................................................................... 17
2.6       OTHER CONSIDERATIONS .........................................................................................18
          2.6.1   Haul Road Design ........................................................................................ 18
          2.6.2   Lighting ........................................................................................................ 18

3.0       EVALUATION OF TECHNICALLY FEASIBLE OPTIONS ............................................19
3.1       POWER SUPPLY ..........................................................................................................19
          3.1.1   Main Power .................................................................................................. 19
          3.1.2   Back-up Power ............................................................................................. 20
          3.1.3   Back-up Space and Comfort Heating ........................................................... 20
3.2       MINING EQUIPMENT ...................................................................................................20
          3.2.1   Dewatering Pumps ....................................................................................... 20
          3.2.2   Light Towers ................................................................................................ 20
          3.2.3   Off-Road Mining Equipment ......................................................................... 20
3.3       ORE PROCESSING ......................................................................................................20
          3.3.1   General Ore Processing and Leaching Reagents......................................... 20
          3.3.2   On-site versus Off-site Milling Locations ...................................................... 21
3.4       OTHER CONSIDERATIONS .........................................................................................21
          3.4.1   Haul Road Design ........................................................................................ 21
          3.4.2   Lighting ........................................................................................................ 21
          3.4.3   Blasting ........................................................................................................ 21
3.5       SUMMARY OF SELECTED OPTIONS..........................................................................21

4.0       ANALYSIS AND RATIONALE FOR THE SELECTED CONTROL
          TECHNOLOGIES ..........................................................................................................22

File: 121416965                                                                                                                     i
VALENTINE GOLD PROJECT, ASSESSMENT OF BEST AVAILABLE CONTROL TECHNOLOGY
(BACT)
4.1 POWER SUPPLY ..........................................................................................................22
4.1.1 Main Power .................................................................................................. 22
4.1.2 Back-up Power ............................................................................................. 22
4.1.3 Back-up Space and Comfort Heating ........................................................... 22
4.2 MINING EQUIPMENT ...................................................................................................22
4.2.1 Dewatering Pumps, Light Towers, and Off-Road Mobile Mining
Equipment .................................................................................................... 22
4.3 ORE PROCESSING ......................................................................................................23
4.3.1 General Ore Processing On-site and Leaching Reagents ............................ 23
4.4 OTHER CONSIDERATIONS .........................................................................................23
4.4.1 Haul Road Design ........................................................................................ 23
4.4.2 Lighting ........................................................................................................ 23
4.4.3 Blasting ........................................................................................................ 23
5.0 SUMMARY ....................................................................................................................24
6.0 REFERENCES ..............................................................................................................27
LIST OF TABLES
Table 1.1 Summary of Maximum Estimated Annual GHG Emissions During Project
Operation ............................................................................................................ 3
Table 3.1 Comparison of Main Power Supply Options .......................................................11
Table 4.1 Hauling and Excavating Equipment ...................................................................15
Table 9.1 2018 Annual GHG Emissions.............................................................................25
LIST OF FIGURES
Figure 1-1 Location of the Valentine Gold Project ................................................................ 2
File: 121416965 iiVALENTINE GOLD PROJECT, ASSESSMENT OF BEST AVAILABLE CONTROL TECHNOLOGY (BACT) Abbreviations BACT Best Available Control Technology CH4 Methane CO2 Carbon Dioxide CO2e Carbon Dioxide Equivalents ECCC Environmental and Climate Change Canada EIS Environmental Impact Statement GHG Greenhouse Gases GHGRP Greenhouse Gas Reporting Program IAAC Impact Assessment Agency of Canada kW Kilowatt kWh Kilowatt-Hour kt Kilotonnes LED Light Emitting Diode MAC Mining Association of Canada NL Newfoundland and Labrador N2O Nitrous Oxide NIR National Inventory Report TMF Tailings Management Facility File: 121416965 iii
VALENTINE GOLD PROJECT, ASSESSMENT OF BEST AVAILABLE CONTROL TECHNOLOGY
(BACT)

Introduction
August 2, 2021

1.0        INTRODUCTION

Marathon Gold Corporation (Marathon) is planning to develop an open pit gold mine at Valentine Lake,
located in the west-central region of the Island of Newfoundland, approximately 60 kilometres (km)
southwest of the town of Millertown, Newfoundland and Labrador (NL) (refer to Figure 1-1).

Marathon submitted an environmental impact statement (EIS) for the Project to the federal Impact
Assessment Agency of Canada (IAAC, the Agency) and the Newfoundland and Labrador Department of
Environment and Climate Change (NLDECC) in September 2020 with the support of Stantec Consulting
Ltd. (Stantec).

The predicted annual greenhouse gas (GHG) emissions from the Project are >25,000 t CO2e/year during
the first eight operational years, therefore, the Project is subject to the provincial Best Available Control
Technology (BACT) requirements for activities inside the Project’s boundaries, as outlined in section 12.1
of the Management of Greenhouse Gas Regulations.

This report outlines how BACT was considered in the design of the Project.

1.1        PROJECT OVERVIEW
Marathon is proposing to develop an open pit gold mine near Valentine Lake, located in the central region
of the Island of Newfoundland, southwest of the Town of Millertown, Newfoundland and Labrador (NL).
The Valentine Gold Project (the Project) will consist primarily of two open pits, waste rock piles, crushing
and stockpiling areas, conventional milling and processing facilities (the mill), a tailings management
facility (TMF), personnel accommodations, and supporting infrastructure including roads, on-site power
lines, buildings, and water and effluent management facilities. The mine site is accessed by an existing
gravel road, approximately 82 km in length, which extends south from Millertown. Approximately 73 km of
this existing access road will be upgraded and maintained by Marathon as part of the Project.

The operational life of the Project is estimated to be 13 years with the anticipated total resource milled of
41,049 kilotonnes. The Project will operate 24 hours a day, seven days a week on a 12-hr shift basis and
is anticipated to create nearly 11,000 full-time equivalents (FTE) in NL. The Project will generate $292
million in revenue to the federal government, and almost $400 million ($27 million annually) of
incremental revenues to the treasury of NL (Strategic Concepts 2020).

Gold ore will be mined from the Marathon and Leprechaun open pits using the standard surface mining
techniques, which include blasting, loading, hauling ore from the pit to the mill or to stockpiles, processing
ore, tailings deposition, hauling and placement of waste rock on the waste rock piles, and phased
development of the TMF dams. Both the Marathon pit and the Leprechaun pit will be mined
simultaneously, with blasting occurring on alternating days.

File: 121416965                                                                                             1
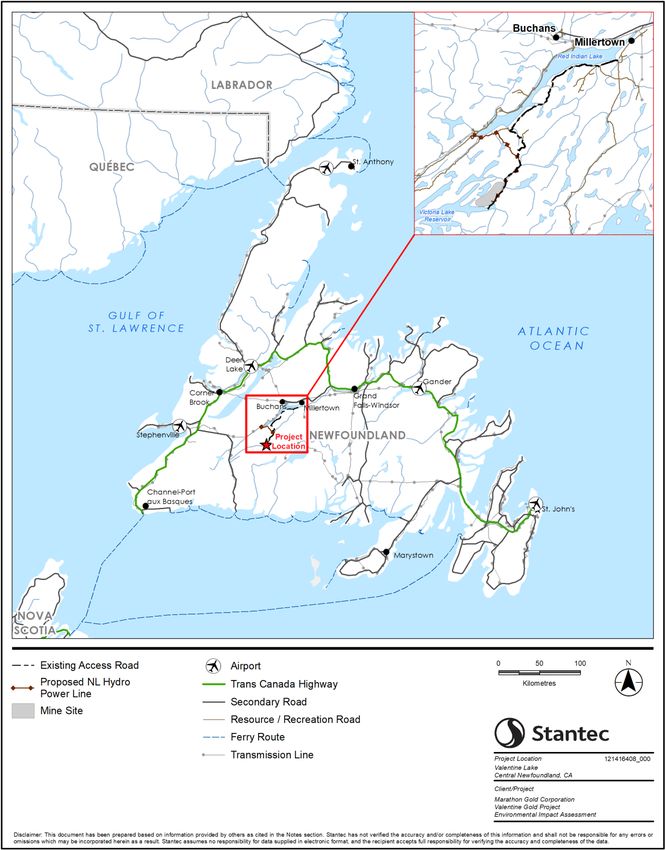
VALENTINE GOLD PROJECT, ASSESSMENT OF BEST AVAILABLE CONTROL TECHNOLOGY
(BACT)

Introduction
August 2, 2021

Figure 1-1        Location of the Valentine Gold Project

File: 121416965                                                           2
VALENTINE GOLD PROJECT, ASSESSMENT OF BEST AVAILABLE CONTROL TECHNOLOGY
(BACT)

Introduction
August 2, 2021

For the first three years of operation, ore will be processed through the mill on-site where it will be
crushed, milled and processed through gravity and cyanidation processes to recover the gold. Initially,
6,800 t of ore will be processed daily, with this quantity anticipated to increase to 11,000 tonnes per day
(tpd) in Year 4 through the addition of the flotation process. Tailings will be treated to remove cyanide
prior to disposal in an engineered TMF. Gold doré will be shipped from site to market in secured trucks.

The maximum estimated annual GHG emissions from Project operation are presented in Table 1.1. The
GHG emissions inventory for Project operation has been updated since the EIS (Marathon 2020) was
prepared, to reflect changes to the Project based on updated Project design. These changes are reflected
in the GHG estimates provided in Table 1.1. Details pertaining to how the GHG emissions inventory was
prepared can be found in Section 5.5.2 and Appendix 5G of the EIS (Marathon 2020).

    Table 1.1           Summary of Maximum Estimated Annual GHG Emissions During Project
                        Operation

                                                                                                             Total
                      Activity                       Units      CO2            CH4            N2O        (expressed as
                                                                                                             CO2e)
    BlastingA                                         t/y      2,400             -              -             2,400
    Stationary   CombustionB                          t/y      1,802           0.09           0.27            1,884
    On-Road     TransportationC                       t/y      58,863          3.08           1.83           59,484
    Off-Road Mobile   EquipmentC                      t/y      29,986          0.82           0.22           30,073
    Electricity Consumption     (indirect)D           t/y      2,506             -              -             2,506
    Shipping of Delivered Supplies     (indirect)C    t/y       926            0.05           0.03             935
    Total Direct Emissions                            t/y      93,051          3.98           2.32           93,842
    Total Indirect Emissions                          t/y      3,432           0.05           0.03            3,441
    Total (direct + indirect)                         t/y      96,483          4.03           2.35           97,283
 Notes:
 A
   Based on MAC emission factors (MAC 2014)
 B
   Based on ECCC's 2019 Canada's Greenhouse Gas Quantification Requirements (ECCC 2019e)
 C
   Based on ECCC emission factors provided in Table A6-13 of the NIR (ECCC 2020b)
 D
   Based on electricity consumption emission factor for NL (27 g CO2e/kWh) from Table A13-2 the ECCC NIR (ECCC 2020b)

1.2          REGULATORY CONTEXT
From a regulatory perspective, the management of GHG emissions takes place at provincial, national,
and international scales. The existing acts and accords are primarily related to operational emissions
above specified thresholds or are related to emission reductions on provincial and federal scales.

The Government of NL has set the following emission reduction target in the provincial Climate Change
Action Plan (Government of NL 2019):

•      30% reduction in provincial GHG emissions below 2005 levels by 2030

File: 121416965                                                                                                         3
VALENTINE GOLD PROJECT, ASSESSMENT OF BEST AVAILABLE CONTROL TECHNOLOGY
(BACT)
Introduction
August 2, 2021
The Government of NL has also passed a motion committing the province to achieve net zero carbon
emissions by 2050 (Newfoundland and Labrador Oil and Gas Industrial Association 2020).
On a federal level, Canada has committed to GHG emission reduction targets as follows (ECCC 2019a):
• 17% reduction of national GHG emissions below 2005 levels by 2020 (under the 2009 Copenhagen
Accord)
• 40% to 45% reduction of national GHG emissions below 2005 levels by 2030 (2021 Earth Day
Summit, ECCC 2021) replacing the former target of a 30% reduction of national GHG emissions
below 2005 levels by 2030 (2015 submission to the United Nations Framework Convention on
Climate Change, under the Paris Agreement)
• Legislation for net zero emissions by 2050 (Strategic Assessment of Climate Change [ECCC 2020a])
To support the initiatives and facilitate achieving the GHG reduction targets, the federal government
developed the Pan-Canadian Approach to Pricing Carbon Pollution, providing flexibility to provinces and
territories to develop carbon pollution pricing systems of their own, and outlining the required criteria for
these systems (ECCC 2019b). For provinces and territories that have not implemented jurisdictional
carbon pollution pricing systems that would meet the federal benchmark requirements, they are required
to comply with the federal carbon pollution pricing system.
The Province of NL created the Made-in-Newfoundland and Labrador Carbon Pricing Plan (NLDMAE
2018), which was approved by the federal government to meet the requirements of the Pan-Canadian
Approach to Pricing Carbon Pollution in October 2018. The plan consists of a hybrid system containing
performance standards for large emitting facilities and large-scale electricity generation, and a carbon tax
on fuel combustion, as outlined below:
• Emission reduction targets from a baseline emission intensity for industrial facilities emitting more
than 25,000 tonnes CO2e annually under NL’s Management of Greenhouse Gas Act (NL Reg.
116/18). This requires the industrial facilities to reduce their GHG emissions under their baseline in
the fourth year of production and to reduce the emissions by 12% under their baseline in year 8 of
production and subsequent years.
• Carbon tax imposed by authority under NL’s Revenue Administration Act (2011) and the Revenue
Administration Regulations (NL Reg. 73/11). The carbon price was introduced on January 1, 2019 at
$20 per tonne of CO2e. In 2022, the price will increase to $50 per tonne of CO 2e.
In addition to the GHG reduction targets and carbon pricing, there are federal and provincial GHG
emission reporting requirements. Federally, under the authority of the Canadian Environmental Protection
Act, 1999 (CEPA), the GHG Emission Reporting Program (GHGRP) requires operators of facilities to
report their annual GHG emissions to ECCC if their emissions are above 10,000 t CO2e per year (ECCC
2019a). Provincially, under the authority of NL’s Management of Greenhouse Gas Act (2016) and the
Management of Greenhouse Gas Reporting Regulations (NL Reg 14/17), there are also GHG emission
reporting requirements. Provincially, there are three tiers for GHG reporting, as follows:
File: 121416965 4VALENTINE GOLD PROJECT, ASSESSMENT OF BEST AVAILABLE CONTROL TECHNOLOGY
(BACT)
Introduction
August 2, 2021
• Facilities emitting 15,000 tonnes of CO2e or more annually must report their emissions to the
provincial government in accordance with the Management of Greenhouse Gas Reporting
Regulations
• Facilities emitting between 15,000 and 25,000 tonnes of CO 2e annually may apply to be designated
as opted-in facilities, with third-party emissions verification in compliance with ISO 14064-3 and ISO
14065
• Facilities emitting more than 25,000 tonnes of CO2e are subject to mandatory annual GHG reduction
targets and require third-party verification of emission reports in compliance with ISO 14064-3 and
ISO 14065
New facilities that release 15,000 t CO2e or more in a calendar year must notify the Minister of
Environment and Climate Change by March 31 of the subsequent year.
Based on the above noted thresholds, the Project will likely be required to report annual GHG emissions
to both the provincial and federal governments, depending on the annual quantity of GHG emissions
released to the atmosphere once the Project is operational.
1.3 BACT ANALYSIS OBJECTIVE
As the GHG emissions resulting from the operation of the Project are expected to exceed 25,000 t
CO2e/year during the first eight years of the mine life, the Management of Greenhouse Gas Regulations
(Newfoundland and Labrador Regulation 116/18, last amended 31/19) will apply to the operation of the
Facility. Section 12.1 (1), 12.3 and 12.4 of the Management of Greenhouse Gas Regulations state the
following:
Section 12.1(1) – “Where a person registers an industrial facility to which these regulations may apply,
other than an offshore industrial facility or a mobile offshore industrial facility, in accordance with
the Environmental Protection Act, the person shall, on the date the industrial facility is registered, provide
information regarding best available control technology to the minister.”
Section 12.3 – “Where information is provided under subsection (1) or (2), the industrial facility is required
to employ best available control technology in accordance with this Part in the operation of the industrial
facility.”
Section 12.4 – “An industrial facility is considered to meet the best available control technology
requirements where the Lieutenant-Governor in Council is satisfied that the combination of machinery
and equipment in the industrial facility
(a) has the most effective greenhouse gas emissions control;
(b) has proven performance and reliability in comparable industrial facilities;
(c) is economically feasible, based on consultation with the operator; and
(d) complies with an Act or regulation relating to air pollution, occupational health and safety and fire
and life safety.”
File: 121416965 5VALENTINE GOLD PROJECT, ASSESSMENT OF BEST AVAILABLE CONTROL TECHNOLOGY
(BACT)
Project Components and Technologies Considered
August 2, 2021
The objective of this BACT Assessment is to therefore illustrate how Marathon has considered the use of
best available control technology in the design and planning of the Project and to demonstrate how the
Management of Greenhouse Gas Regulations BACT requirements will be met. As the Regulation applies
to operational facilities, this assessment focuses on operational activities and equipment.
2.0 PROJECT COMPONENTS AND TECHNOLOGIES
CONSIDERED
A detailed description of the Project and its components is presented in Section 2.3, Project Components,
of the EIS for the Valentine Gold Project (Marathon 2020). Marathon considered alternatives (e.g.,
locations, equipment, techniques, methods) for numerous Project components and activities. These are
detailed in the alternative’s analysis of the EIS (Section 2.11), which identifies and describes alternative
means of carrying out the Project and Project components, with consideration of technical and economic
feasibility, market conditions, regulatory factors, and socio-economic implications that could affect the
selection of the preferred alternative.
The Project infrastructure that is considered to potentially have the biggest impact on GHG releases was
considered in the BACT Assessment and includes:
• Power supply
• Mining equipment (stationary and mobile)
• Ore processing
• Other considerations (haul road design, lighting, blasting)
A description of each of these Project components and the technologies considered during the design of
the Project are presented in the following sections.
2.1 POWER SUPPLY
2.1.1 Main Power
The Project’s grinding mill and processing facility require 23 MW to process the ore and produce gold
doré bars. Assuming continuous operation (8,760 hours per year), the electricity requirement for the
grinding mill and processing facility is estimated at 201,480 MWh annually.
Two main scenarios for power supply exist: purchase and delivery of electricity generated by a third party
or self-generation at the Valentine Gold Project site. These options could include one or a combination of:
• Grid connection
• Diesel generators for electrical base load
• Solar power
• Wind power
File: 121416965 6VALENTINE GOLD PROJECT, ASSESSMENT OF BEST AVAILABLE CONTROL TECHNOLOGY (BACT) Project Components and Technologies Considered August 2, 2021 These options are each evaluated in the following subsections. 2.1.1.1 Grid Connection Power in this area of the province is generated from a number of hydroelectric facilities owned and operated by NL Hydro. Marathon has consulted with NL Hydro, who has indicated that power for the Project can be provided via a direct connection to the existing power grid at a location near the Star Lake Hydroelectric Generation Station. The use of hydroelectric power at the Valentine Gold Project results in no on-site air contaminants or direct GHG emissions generated from power supply. Primary power will be delivered to the site substation, then stepped down and distributed throughout site to the various equipment and locations required, primarily via overhead power lines. There is sufficient grid capacity to meet all the site’s electrical needs through the grid connection. This includes both process needs and space/comfort heating needs. The 2018 Newfoundland and Labrador provincial electrical grid had an average GHG emissions intensity of 27 g CO2e/kWh (ECCC 2019), which is on the lower end of provincial intensities due to most of the electricity being generated by hydrogeneration. However, this does not consider that the majority of hydrogenerated electricity is exported to HydroQuebec. To meet the electricity demand in Newfoundland, the Holyrood Generating Station (HGS) acts as a peaking operation to supply the additional demand in excess of the remaining hydrogenerated electricity. The HGS generates electricity from the combustion of oil, which releases GHG emissions. The actual provincial electrical grid GHG intensity based on 2019 generation and emissions data from HGS is approximately 797 t CO2e per GWh (or 797 g CO2e/kWh). We understand that the HGS will be decommissioned before the Project is initiated (Pers. Comm. G. Crane, June 22, 2021) and replaced with additional hydrogeneration. The removal of the HGS will lower the provincial grid intensity to near zero GHGs per kilowatt-hour given the use of non-emitting hydroelectric power. As such, the use of electricity from the Newfoundland electrical grid would not generate direct GHG emissions. Another broader perspective on GHG emissions from power supply is to consider emissions over the life cycle of a system such as a hydroelectric dam. A life cycle typically consists of the phases covering the cradle to grave of a project or product including: raw material extraction (e.g., iron ore mining); assembly in a factory; transportation to the end-user; commissioning, operation, decommissioning; and final disposal. The GHG emissions associated with each phase can be estimated and summed to give a life cycle GHG emissions intensity, typically with units of g CO 2e per kWh for an electricity generating project. The life cycle GHG emissions associated with a hydroelectric generation facility would vary depending on details including construction approach, design, and location-specific characteristics but have been estimated at approximately 36 g CO2e/kWh (BC Hydro 2013). Using this life cycle GHG intensity factor for the Project, the life cycle GHG emissions associated with the use of hydroelectric electricity are approximately 7,253 t CO2e per year of operation, as shown below. 201,480 MWh/y * 36 g CO2e/kWh * (1,000 kWh) / (1 MWh) * (1 tonne/106 g) = 7,253 t CO2e/y File: 121416965 7
VALENTINE GOLD PROJECT, ASSESSMENT OF BEST AVAILABLE CONTROL TECHNOLOGY
(BACT)

Project Components and Technologies Considered
August 2, 2021

2.1.1.2 Diesel Generator Set

A generator set generally includes two parts:

•    A diesel engine system that uses air and diesel to produce power, usually via a crankshaft
•    A generator that produces an electric current when the crankshaft rotates the rotor of the generator

Other supporting equipment is also present (e.g., diesel fuel tank, controls, exhaust system). The
combustion of diesel in the engine emits air contaminants, steam, and GHGs.

Diesel generator sets are commonly used for base load power supply where grid electricity is not readily
available, such as in remote communities and facilities, or when interruptions to power supply can be
damaging or unsafe. In emergencies, when grid electricity is not available, diesel generator sets provide a
reliable source of energy to safely run criteria loads and life safety systems.

A diesel generator efficiency of 50% was selected to represent large, well-maintained generator sets and
is the upper end of diesel generator set efficiency (Engineering Facility 2019). The required volume of
diesel to meet the full operational electricity needs of the Project would be approximately 38 million litres
per year. Using the emission factors for diesel stationary combustion equipment from the ECCC’s 2019
National Inventory Report (ECCC 2020b), the GHG emissions associated with the use of diesel for power
generation are estimated to be 101,076 tonnes CO2e per year. The calculation is provided below.

201,480 MWh/y * 3,600 MJ/MWh * (1 MJ input energy) / (0.5 MJ output energy) / (36.8 MJ diesel/L) =
37,581,762 L/y

37,581,762 L/y * (2,681 g CO2/L + 0.078 g CH4/L * 25 g CO2e/g CH4 + 0.022 g N2O/L * 298 g CO2e/g N20)
* 1 t CO2e/106 g CO2e = 101,076 t CO2e/y

From a life cycle perspective, the vast majority (>95%) of energy use during the life cycle of a diesel
generator set is during its operation phase (Benton et al. 2017). Since GHG emissions are directly
correlated with diesel energy, the GHG emissions associated with the other phases are approximately 5%
of the operation phase emissions. Using the energy output required (201,480 MWh per year) and the
estimated GHG emissions from operation (101,076 t CO2e per year), the estimated operation phase GHG
intensity is 502 g CO2e/kWh. The GHG emissions intensity of other phases would be approximately 5,054
t CO2e per year, for a combined intensity of 527 g CO2e/kWh (502 g CO2e/kWh plus 25 g CO2e/kWh).

In addition to the life cycle GHG emissions intensity of the diesel generator set, there is also the life cycle
GHG emissions intensity of the diesel itself. That is, there are GHG emissions associated with the
production of the diesel used by the Project. The diesel life cycle (cradle to tank prior to combustion) GHG
emissions intensity from the Argonne National Laboratory is 13.4 g CO 2e/MJ (Argonne National
Laboratory 2020). Using a higher heating value of diesel of 36.8 MJ/L, the life cycle diesel GHG intensity
is approximately 493 g CO2e/L. The estimated annual amount of diesel required over the Project is
37,581,762 L/y. As a result, the estimated annual life cycle GHG emissions from diesel during Project
operation are 18,528 t CO2e.

File: 121416965                                                                                             8
VALENTINE GOLD PROJECT, ASSESSMENT OF BEST AVAILABLE CONTROL TECHNOLOGY
(BACT)

Project Components and Technologies Considered
August 2, 2021

483 g CO2e/L * 37,581,762 L/y * 1 t CO2e/106 g CO2e = 18,528 t CO2e/y

2.1.1.3 Solar Power

A photovoltaic system using solar panels generates electricity from solar irradiance. The amount of solar
irradiance at a given location varies daily depending on weather (e.g., cloud cover), season, and sun
activity, but can be approximated based on historical weather conditions. The area where the Project is to
be located could produce an average of 950 kWh/kW/year (Rylan Urban 2018). Therefore, to produce
201,480 MWh annually to supply the Project, a solar farm with an installed capacity of approximately 212
MW would be required:

201,280 MWh/year / 0.950 MWh/kW/year = 212 MW installed

Large scale solar farms are typically mounted on structures on the ground. The efficiency of the system’s
technology to convert sunlight to energy dictates the physical footprint required to generate a specified
amount of power. Crystalline solar panels are approximately 18% efficient and thin-film solar panels are
approximately 12% efficient. Depending on the technology selected, a solar farm designed to generate
212 MW would require between approximately 848 acres and 1,060 acres (3.4 km2 to 4.3 km2).

The terrain around the Project site is steep and includes wetlands, therefore the amount of land clearing
and preparation to accommodate the minimum solar panel area would be substantially more than the 4.3
km2 estimate. The mining of the aggregate needed to support the solar farm would, in effect, constitute its
own small mine.

The use of solar panels in a photovoltaic system to generate electricity does not result in direct GHG
emissions to the atmosphere. However, GHGs are emitted throughout the life cycle of a photovoltaic
system, as the greatest emissions occur during the manufacturing phase (approximately 97% of total life
cycle GHG emissions) (Lima et al. 2021). In Lima et al. (2021), a life cycle assessment for a solar farm
located in Brazil resulted in an estimate of 65.3 g CO2e/kWh (the highest in the range of 42 g CO2e/kWh
to 65.3 g CO2e/kWh). The authors of this study noted that the photovoltaic panel manufacturing location
has a large impact on the life cycle GHG emissions intensity. Using the estimated electricity consumption
for Marathon (201,280 MWh/year), an estimated equivalent 13,144 t CO2 per year would be generated
during the solar farm’s lifetime. The solar farm life cycle GHG intensity is lower than the estimated GHG
emissions intensity of a diesel generator set.

GHG Emissions (t CO2/y) = estimated electricity usage (201,280 MWh/y) * solar farm life cycle intensity
(65.3 g CO2/kWh) * (1000 kWh/MWh) / (1,000,000 g/tonne) = 13,144 t CO2e/y

This amount of GHGs is equivalent to the combustion of 4,902,648 L of diesel per year over the lifetime of
the Project:

13,144 t CO2/y / 2,681 kg CO2/kL * 1000 kg / 1 t * 1000 L / kL = 4,902,648 L/y

File: 121416965                                                                                           9
VALENTINE GOLD PROJECT, ASSESSMENT OF BEST AVAILABLE CONTROL TECHNOLOGY
(BACT)

Project Components and Technologies Considered
August 2, 2021

2.1.1.4 Wind Power

Wind power is generated from the rotation of turbines by the wind to turn generators. Wind turbines for
commercial electricity generation are typically 50 m to 105 m tall and can be rated between 1 MW and 3
MW per turbine (Bhandari et al. 2020). Turbine rotor diameters for a 2 MW turbine can be up to 132 m
(GE Renewable Energy 2021).

As of December 2019, there were 27 wind turbines installed in Newfoundland and Labrador, for a total
installed capacity of 55 MW (Canadian Wind Energy Association nd). This is approximately 2 MW per
turbine.

Like solar power, wind power is intermittent and dependent on the wind speed over time at a given
location. A back-up electricity generator, such as a diesel generator, and/or a connection to the electrical
grid, would be required.

The area needed for a wind turbine farm is substantial. While the individual footprint of a wind turbine is
small (approximately 0.25 m2 [NREL nd]), the distance between wind turbines is required to be between 5
and 10 turbine diameters (660 m to 1,320 m for turbines with 132 m diameter rotors). Using basic
assumptions on available wind power and turbine technology, approximately 10 to 12 wind turbines would
be required to meet the Project’s power needs.

There are no direct GHG emissions from the operation of a wind farm. GHGs are, however, emitted
throughout the life cycle of a wind turbine installation. An average life-cycle GHG emissions intensity for
an onshore windfarm of the size required for the Project is approximately 40 g CO2e/kWh (Bhandari et al.
2020); meaning approximately 11,686 t CO2e per year may be generated from the operation of the wind
farm providing the electricity required for the Project. The windfarm life-cycle GHG intensity is lower than
the operational GHG intensity of a diesel generator set and solar but higher than hydroelectric. The use of
electricity from a wind farm is equivalent to the combustion of 4,168,324 L of diesel per year in a diesel
generator over the lifetime of the Project.

11,686 t CO2 / (2,681 kg CO2/kL * 1 kg CO2e/kg CO2 + 0.133 kg CH4/kL * 25 kg CO2e/kg CH4 + 0.4 kg
N2O/kL * 298 kg CO2e/kg N2O) * 1 kL/1000 L * 1 t CO2e/1000 kg CO2e = 4,168,324 L

2.1.2      Comparison of Power Supply Options

A comparison of the main power supply options is provided in Table 2.1.

File: 121416965                                                                                           10
VALENTINE GOLD PROJECT, ASSESSMENT OF BEST AVAILABLE CONTROL TECHNOLOGY
(BACT)

Project Components and Technologies Considered
August 2, 2021

 Table 2.1            Comparison of Main Power Supply Options

                                      Life Cycle GHG                                               Approximate Total Life
                                    Emission Intensity             Operating/Direct GHG            Cycle GHG Emissions
    Main Power Supply
                                  During Project Lifetime          Emissions (t CO2e/y)              Over the Project
                                       (g CO2e/kWh)                                                  Lifetime (t CO2e)
 Grid Electricity                                                     Zero or negligible
                                              36                                                             94,293
 (Hydroelectricity)                                                      emissions
 Diesel Generator Set                         527                           101,076                        1,559,906
                                                                      Zero or negligible
 Solar Power                                 65.3                                                           170,872
                                                                         emissions
                                                                      Zero or negligible
 Wind Power                                   40                                                            151,918
                                                                         emissions
 Notes:

 Grid electricity intensity assumes the Holyrood Generating Station will be decommissioned and additional hydrogenerated
 electricity will be available.

 Project lifetime is 13 years.

2.2        BACK-UP POWER
For safety reasons, it is necessary to have a back-up source of power available at the Project site.
Typically, diesel-powered generator sets are used for back-up power as this is an economical and readily
available solution in emergencies. The other forms of power supply assessed in this report are not
suitable for an ‘always at-ready’ back-up power source.

In the event of a grid power outage, back-up generators are not intended to provide power to the entire
Project site; rather, back-up generators will be sized to operate only the most critical systems needed to
prevent damage to and safely shut down equipment and assist with personnel safety. Marathon plans to
install four back-up diesel generators (one 40 kW and three 600 kW) at the Project site.

Back-up generators are typically tested (i.e., operated) at least quarterly to identify any issues that may
be present prior to being called on in an emergency. Testing with diesel fuel is a necessary safety
measure. The exhaust to atmosphere from the back-up generators will be controlled to meet the
province’s air quality requirements. A preliminary review of the tier system set by the federal government
suggests that the back-up generators may need to follow tier 4 requirements.

NL Power estimates that the area surrounding the Project (i.e., TL280 – Buchans to Star Lake)
experiences approximately 62.4 power outage hours each year (Pers. Comm. R. Coish, July 13, 2021).
Assuming that the back-up generators operate at their max capacity of 1,840 kW for 62.4 hours each
year, an annual total of 115 MWh of electricity is produced during outages. The required volume of diesel
to fuel the back-up generators during outages is approximately 21,416 litres per year. Using the emission
factors for diesel stationary combustion equipment from the ECCC’s 2019 National Inventory Report
(ECCC 2020b), the GHG emissions associated with the use of diesel for power generation are estimated
to be 58 t CO2e per year. The calculation is provided below.

File: 121416965                                                                                                            11
VALENTINE GOLD PROJECT, ASSESSMENT OF BEST AVAILABLE CONTROL TECHNOLOGY (BACT) Project Components and Technologies Considered August 2, 2021 115 MWh/y * 3,600 MJ/MWh * (1 MJ input energy) / (0.5 MJ output energy) / (36.8 MJ diesel/L) = 21,416 L/y 21,416 L/y * (2,681 g CO2/L + 0.078 g CH4/L * 25 g CO2e/g CH4 + 0.022 g N2O/L * 298 g CO2e/g N2O) * 1 t CO2e/10^6 g CO2e = 58 t CO2e/y 2.3 BACK-UP SPACE AND COMFORT HEATING Space and comfort heating is a small energy requirement but is one that must not be interrupted due to health and safety requirements. Site buildings (e.g., accommodations camp, offices, processing areas) will be connected to the grid and electricity will be used for heating. However, a back-up system for space and comfort heating is essential. Similar to the diesel generators for back-up power supply for critical systems, Marathon has considered back-up space and comfort heating using diesel and propane fuel in stationary combustion equipment. Propane is typically preferred over diesel for small heating loads. Although propane combustion releases GHG emissions, the quantities of GHG emissions released from propane combustion are less than those from combustion of an energy equivalent amount of diesel. For example, considering the energy-based emission factors for diesel and propane in Newfoundland and Labrador’s “A Guidance Document for Reporting Greenhouse Gas Emissions for Large Industry in Newfoundland and Labrador” (2017), for every 1 GJ of energy, diesel releases approximately 70 kg of CO2 and propane releases approximately 60 kg of CO2. Therefore, the use of propane releases fewer GHGs than diesel, on an energy-equivalent basis. Although the design of the back-up space and comfort heating system has not been finalized, it is expected to include a furnace for combustion, a heat exchanger, and a thermal fluid for heat transfer. Both diesel and propane can be used for this purpose. Because diesel releases more energy (heat) when combusted, less diesel would be needed for heating than if propane were used. Similar to the back-up diesel generators, the back-up space and comfort heating system would be regularly tested to ensure it is functioning properly. The GHG emissions from the testing would be negligible in comparison to other regularly operated stationary combustion sources. A life cycle GHG emissions intensity for a propane heating system could not be located in the literature. However, such a system is likely to have a life cycle GHG emissions intensity that is heavily weighted in terms of percent contribution toward emissions from operation (emissions from combustion of propane), similar to the diesel generator set. 2.4 MINING EQUIPMENT 2.4.1 Dewatering Pumps Dewatering of the pits is necessary for the safe operation of the mine and will be accomplished by in-pit pumping. Permanently installed pumps will be connected to the site grid whenever it is feasible. However, File: 121416965 12
VALENTINE GOLD PROJECT, ASSESSMENT OF BEST AVAILABLE CONTROL TECHNOLOGY
(BACT)

Project Components and Technologies Considered
August 2, 2021

mobile dewatering pumps are also required where pumps are not permanently placed in one location.
These are skid mounted and may be moved as frequently as weekly.

Based on expected dewatering needs, the temporary dewatering pumps will be rated for approximately
150 m3/hour of water flow. The temporary dewatering pumps are expected to operate approximately
10,000 hours total in the maximum operation year (Year 3).

Both diesel engine driven and electric driven pumps were considered, during Project design and they are
evaluated in the following subsections.

2.4.1.1 Diesel Engine Dewatering Pumps

A diesel engine was generally described in Section 2.1.1. For a dewatering pump, the crankshaft of the
diesel engine rotates the impellor of a centrifugal pump, resulting in water movement. Diesel engines
release air contaminants and GHGs to the atmosphere during regular operation.

Diesel engines are inefficient at converting the potential energy of diesel into kinetic energy for work. To
meet the water flow and operational hours requirements, Marathon determined that diesel engines rated
up to 100 kW (134 hp) would be required. These combust 45 L of diesel per hour, which, based on
anticipated operational hours, would result in approximately 449,959 L of diesel combusted annually.
Using the diesel stationary combustion emission factors in Canada’s 2019 National Inventory Report
(ECCC 2020b), approximately 1,261 t CO2e per year would be generated from the use of diesel
dewatering pumps.

449,959 L/y * (2,681 kg CO2/kL * 1 kg CO2e/kg CO2 + 0.133 kg CH4/kL * 25 kg CO2e/kg CH4 + 0.4 kg
N2O/kL * 298 kg CO2e/kg N2O) * 1 kL/1000 L * 1 t CO2e/1000 kg CO2e = 1,261 t CO2e/y

In additional to the operational cost of the diesel fuel itself, diesel engines have regular maintenance
requirements; this includes, but are not limited to, fuel and air filter replacements. Maintenance generally
occurs every 6 months.

2.4.1.2 Electric Driven Dewatering Pumps

Mobility is key for the temporary dewatering pumps. To create a grid-connected dewatering pump,
overhead powerlines would need to be connected from the main electricity system at the Project to
transformers throughout the site. From there, a connection to the dewatering pump would be made via an
“extension cord”. There is a risk of mobile equipment making contact with overhead powerlines; therefore,
this option increases the risk of unsafe operating conditions at the site.

The alternative to a wired connection is the use of batteries mounted next to the dewatering pump. The
mining equipment manufacturer Epiroc has launched a series of battery-powered mobile mining
equipment designed for underground mining (Quarry 2020). Dewatering solutions are not currently
available from Epiroc. Their electric equipment can operate for up to five hours, with battery replacement
taking 10-15 minutes. This means that battery replacements will halt operation temporarily, several times

File: 121416965                                                                                           13
VALENTINE GOLD PROJECT, ASSESSMENT OF BEST AVAILABLE CONTROL TECHNOLOGY
(BACT)

Project Components and Technologies Considered
August 2, 2021

per 12-hour shift. Just like a diesel driven pump, operators must be cognizant of available power and
keep the pump’s energy source “topped up”.

Sources of electricity were described in Section 2.1.

2.4.2      Light Towers

A light tower consists of one or more lights mounted to a telescopic mast and powered by an energy
source connected at the base. In pit mining, the light tower is designed to be towed from place to place as
needed for mining operations. Like temporary dewatering pumps, light towers must be mobile as they are
moved from place to place on a regular basis.

Marathon has estimated that during peak operation, light towers rated at 20 kW are required for 27,997
hours per year (560 MWh per year).

Marathon considered diesel light towers, as these are commonly used and available from the
manufacturers of mobile mining equipment. Other technologies are available, including solar, wind, and
hybrid diesel/solar. Given the negligible energy, annual operational cost, and GHG emissions associated
with light towers, Marathon did not pursue research into the solar, wind, and hybrid light tower
technologies.

2.4.2.1 Diesel Engine Lighting Tower

The information related to diesel engines as presented in Section 2.4.1.1 for dewatering pumps also
applies to light plants. Based on the required energy demand in the operation phase, generator set
efficiency, and operating hours, the estimated diesel consumption is 2 L per hour, resulting in 41,999 L of
diesel per year. The combustion of this diesel would release approximately 118 t CO2e per year of GHGs:

41,999 L/y * (2,681 kg CO2/kL * 1 kg CO2e/kg CO2 + 0.133 kg CH4/kL * 25 kg CO2e/kg CH4 + 0.133 kg
N2O/kL * 298 kg CO2e/kg N2O) * 1 kL/1000 L * 1 t CO2e/1000 kg CO2e = 118 t CO2e/y

2.4.3      Off-Road Mobile Mining Equipment

The Project will be operated using light and heavy mobile mining equipment to develop and extract ore
from open pits, road maintenance and dust control, transporting operating supplies, relocating equipment,
and snow removal.

Heavy equipment will include graders, production drilling units, dozers, front-end loaders, excavators, and
haul trucks. Other, smaller, mobile equipment will include fuel and lube trucks, pickup trucks, shuttle
buses, an on-highway dump truck, flatbed truck, emergency response vehicles, maintenance trucks,
scissor lifts and other mobile lifts, and forklifts.

The capacities of the main hauling and excavating equipment and their roles are shown in Table 2.2.

File: 121416965                                                                                          14
VALENTINE GOLD PROJECT, ASSESSMENT OF BEST AVAILABLE CONTROL TECHNOLOGY
(BACT)

Project Components and Technologies Considered
August 2, 2021

    Table 2.2        Hauling and Excavating Equipment

    Hauling
    Rigid Frame Hauler, 91t payload                       Hauling Ore and Waste
    Articulated Hauler, 36 tonnes payload                 Support Hauler, Till Hauling
    Primary Pit Support
    Motor Grader, 4.9 m blade                             Haul Road Maintenance
    Track Dozer, 447 kW                                   Waste Dump Maintenance
    Track Dozer, 325 kW                                   Pit Support
    Wheel Loader, 4.5m3 bucket                            Pit Support
    Hydraulic Excavator, 4.0 m3 bucket (300-ton class)    Pit Support and Back Up Loading
    Hydraulic Excavator, 3.0 m3 bucket (200-ton class)    Pit Support, Ditching, Construction

Off-road mobile mining equipment is assumed to be owner-operated under a maintenance and repair
contract. Fleet maintenance activities will be performed in the maintenance facilities located near the
processing plant.

Three alternative engine technologies were considered during the design of the Project:

•      Diesel-drive
•      Electric-drive
•      Hydrogen-drive

These alternatives are evaluated below.

2.4.3.1 Diesel-drive Off-Road Mobile Mining Equipment

Haul trucks fuelled with diesel are commonly used in mining operations around the world. These trucks
can operate for hours before refuelling. Regulatory requirements and best operational practices for diesel
storage and fuelling technologies are well defined in Canada and the mining industry. Diesel trucks sold
for use in Canada are designed to meet the health and safety, fire and life safety, and air pollution control
requirements in Canada, and would meet the standards set out in the Newfoundland and Labrador
Environmental Protection Act.

The combustion of diesel fuel releases GHGs to the atmosphere. For the Project’s needs, an estimated
30,073 t CO2e per year would be released from off-road mining equipment combusting diesel. Details
pertaining to how these emissions have been calculated can be found in Section 5.5.2 of the EIS
(Marathon 2020).

2.4.3.2 Electric-drive Off-Road Mobile Mining Equipment

Rather than using a tank containing fuel such as diesel, electric-drive vehicles use batteries to store and
provide energy. The length of operation depends on the activities undertaken and the capacity of the
installed batteries and is expected to be in the order of hours, rather than days. The use of electric-drive

File: 121416965                                                                                           15
VALENTINE GOLD PROJECT, ASSESSMENT OF BEST AVAILABLE CONTROL TECHNOLOGY
(BACT)
Project Components and Technologies Considered
August 2, 2021
equipment would result in no direct GHG emissions at the Project site and limited indirect GHGs if
hydroelectric power is used to charge the batteries. Although life-cycle GHG emissions intensities for
rechargeable batteries are available, they are dependent on battery chemistry, which is not known at this
time.
The use of batteries requires charging spare batteries and replacing spent batteries as needed.
Marathon consulted the manufacturers Caterpillar, Komatsu, Hitachi, and Liebherr with regards to
available electric-drive haul trucks and excavators. A brief summary of the findings is provided below.
• Electric-drive haul trucks are available from these manufacturers, but the trucks are either not
available in North America (Liebherr) or do not meet the Project requirements with respect to
capacity.
• Electric-drive hydraulic excavators are available from these manufacturers, but the excavators are
either not available in North America (Liebherr, Komatsu) or not available as electric-drive in the 200-
and 300-ton classes required for the Project.
An example of a mining operation that does use electric-drive mobile equipment (with batteries) in
Canada is the underground Borden gold mine (Mining Technology 2021). This mine has been operating
since October 2019 and presents a test case for using battery-operated mining equipment. The mine life
is expected to be 7 to 15 years. The ore production capacity of the Borden gold mine is 4,000 tonnes per
day (1.46 million tonnes per year); this is a smaller operation than the Project (4 million tonnes per year).
The provincial and federal government provided a total of $10 million dollars to support electrification of
the mine (Mining Global 2020).
2.4.3.3 Hydrogen-drive Off-Road Mobile Mining Equipment
Hydrogen is a potential fuel for mobile equipment that does not release GHGs when combusted, as there
is no carbon present in the fuel. The technology to incorporate hydrogen fuel in mining equipment is still
being tested and, as such, currently represents both a technological and a financial risk. It was therefore
not considered further in the assessment.
2.5 ORE PROCESSING
For ore processing, Marathon considered alternative means for ore processing and locations of ore
processing based on economic and technical feasibility, as well as environmental effects as outlined
below.
2.5.1 General Ore Processing and Leaching Reagents
Marathon considered three options for ore processing: heap leach only; heap leach and milling; and
milling only. For the first option (heap leach only), mined ore would be piled into heaps and a leaching
solution will then pass through the ore heaps to dissolve the gold. For the second option (heap leach and
milling), low grade ore would be heap leached and higher-grade ore would be processed by grinding,
File: 121416965 16VALENTINE GOLD PROJECT, ASSESSMENT OF BEST AVAILABLE CONTROL TECHNOLOGY (BACT) Project Components and Technologies Considered August 2, 2021 gravity concentration, and, optionally, flotation, as well as leaching. For the final option (milling only), mined ore is ground, gravity recovered, and leached in a mill. There are no direct GHG emissions from the three options selected. Indirectly, the ore processing pathway would affect GHG releases based on the amount of electricity consumed. Marathon considered several alternatives gold leaching reagents, which include cyanide, thiosulphate, thiourea, and halides. Of those leaching reagents, cyanide has been used on a commercial scale and safely and economically used by most gold producers. 2.5.2 Location 2.5.2.1 On-site mill processing Marathon has considered various on-site mill processing locations based on health and safety requirements, geotechnical conditions, environmental receptors (e.g., caribou migration path), and locations of pits and TMF. The locations considered were termed the central site area, the eastern site area, and the western site area. The central site area was the best option because it is technically and regulatory feasible, economically feasible, and the best option for environmental considerations (less haulage and further from the caribou migration path). The energy requirement to run the on-site mill would depend on the ore throughput rates. This was discussed in Section 6 above. 2.5.2.2 Off-site mill processing Even if the ore is milled offsite by Marathon, the energy required to perform the milling is associated with the Project and would be considered an indirect GHG emission source. As the energy consumption for the milling process depends on the production rate (ore throughput), the same ore throughput requires the same amount of energy regardless of the location. Off-site milling would require additional energy for hauling and ore loading and unloading, which would result in higher GHG emission emissions during the operation phase than onsite processing. Assuming a haul truck with 10 tonne loading capacity and the truck diesel fuel efficiency of 40 L/ 100 km, the GHG emissions from hauling 10 tonnes of ore would be approximately 0.1 t CO2e for every 100 km travelled (one-way) as shown in the calculation below. Haul Truck GHG emissions (t CO2e) per 10 tonne hauled = 40 L of diesel/100 km * (2,681 g CO2/L + 20.11 g CH4/L * 25 kg CO2e/kg CH4 + 0.151 g N2O/L * 298 kg CO2e/kg N2O) / 106 g/tonne = 0.1 t CO2e/100 km. The above estimate is based on emission factors for Heavy-duty Diesel Vehicles (HDDVs) - Advanced Control (ECCC 2020b). File: 121416965 17
VALENTINE GOLD PROJECT, ASSESSMENT OF BEST AVAILABLE CONTROL TECHNOLOGY
(BACT)

Project Components and Technologies Considered
August 2, 2021

These additional GHG emissions for off-site milling would consider number of hauling trips (based on
hauling capacity and quantity of ore to be hauled) and empty trucks travelling back from the off-site milling
location to pick up the next load. GHGs would also be associated with haul truck loading and unloading
the ore, however this would be much lower compared to the emissions associated with transporting the
ore.

2.6        OTHER CONSIDERATIONS
2.6.1      Haul Road Design

Haul roads are necessary for the movement of mobile equipment from the pits to locations around the
Project site. Mining companies seek to optimize the length and profile (i.e., grade) of haul roads, to
reduce to the extent practicable the amount of diesel consumed by heavy equipment. The optimization of
haul roads can lower GHG emissions by reducing diesel usage and, therefore, haul road design was
considered in this BACT assessment.

2.6.2      Lighting

Sufficient and appropriate interior and exterior lighting of Project spaces is necessary for the health and
safety of Marathon personnel. Although electrical lighting does not directly emit GHGs, Marathon has
considered the energy efficiency of available lighting technologies in this BACT assessment.

Three technologies were considered: incandescent bulbs, fluorescent tubes, and light-emitting diodes
(LED). Incandescent bulbs are commonly found in residential applications due to the ease of replacement
and low cost. They are available in a wide range of styles and wattages. However, these bulbs are not
energy efficient (US Department of Energy nd) and result in a large portion of electrical energy being lost
as heat. Fluorescent tube light fixtures are commonplace in commercial and industrial settings given the
long lifespan of fluorescent tubes and the required ballasts. Fluorescent tubes are more efficient than
incandescent bulbs (HowStuffWorks nd).

LED lights have an output of 90 to 150 lumens per watt (Lamp HQ nd), which is more efficient than the
output of a comparable fluorescent tube at 50 to 100 lumens per watt (HowStuffWorks nd).

2.6.2.1 Blasting

The GHG emissions from the combustion of explosives are expected to be minimal (approximately 4%
(Marathon (2020)) in comparison to GHG emissions from overall operation of the Project; however, these
have been considered in the BACT assessment from the perspective of reducing explosive use as
feasible.

File: 121416965                                                                                           18
You can also read