Field experiment for open-loop yaw-based wake steering at a commercial onshore wind farm in Italy - WES
←
→
Page content transcription
If your browser does not render page correctly, please read the page content below
Wind Energ. Sci., 6, 159–176, 2021
https://doi.org/10.5194/wes-6-159-2021
© Author(s) 2021. This work is distributed under
the Creative Commons Attribution 4.0 License.

        Field experiment for open-loop yaw-based wake steering
               at a commercial onshore wind farm in Italy
             Bart M. Doekemeijer1 , Stefan Kern2 , Sivateja Maturu2,4 , Stoyan Kanev3 , Bastian Salbert4 ,
          Johannes Schreiber4 , Filippo Campagnolo4 , Carlo L. Bottasso4 , Simone Schuler2 , Friedrich Wilts5 ,
                 Thomas Neumann5 , Giancarlo Potenza6 , Fabio Calabretta6 , Federico Fioretti6 , and
                                            Jan-Willem van Wingerden1
                1 Delft Center for Systems and Control, Delft University of Technology, Delft, the Netherlands
                                       2 GE Renewable Energy, 85748 Garching, Germany
                         3 TNO Energy Transition, Westerduinweg 3, 1755 LE Petten, the Netherlands
                     4 Wind Energy Institute, Technische Universität München, 85748 Garching, Germany
                     5 UL International GmbH – DEWI, Ebertstrasse 96, 26382 Wilhelmshaven, Germany
                                 6 Enel Green Power, Viale Regina Margherita 125, Rome, Italy

                             Correspondence: Bart M. Doekemeijer (b.m.doekemeijer@tudelft.nl)

                                       Received: 11 May 2020 – Discussion started: 2 June 2020
                          Revised: 26 October 2020 – Accepted: 3 December 2020 – Published: 27 January 2021

       Abstract. The concept of wake steering on wind farms for power maximization has gained significant popu-
       larity over the last decade. Recent field trials described in the literature not only demonstrate the real potential
       of wake steering on commercial wind farms but also show that wake steering does not yet consistently lead
       to an increase in energy production for all inflow conditions. Moreover, a recent survey among experts shows
       that validation of the concept currently remains the largest barrier to adoption. In response, this article presents
       the results of a field experiment investigating wake steering in three-turbine arrays at an onshore wind farm in
       Italy. This experiment was performed as part of the European CL-Windcon project. While important, this exper-
       iment excludes an analysis of the structural loads and focuses solely on the effects of wake steering on power
       production. The measurements show increases in power production of up to 35 % for two-turbine interactions
       and up to 16 % for three-turbine interactions. However, losses in power production are seen for various regions
       of wind directions too. In addition to the gains achieved through wake steering at downstream turbines, more
       interesting to note is that a significant share in gains is from the upstream turbines, showing an increased power
       production of the yawed turbine itself compared to baseline operation for some wind directions. Furthermore, the
       surrogate model, while capturing the general trends of wake interaction, lacks the details necessary to accurately
       represent the measurements. This article supports the notion that further research is necessary, notably on the
       topics of wind farm modeling and experiment design, before wake steering will lead to consistent energy gains
       on commercial wind farms.

1   Introduction                                                     alignment, the wake formed by an upstream turbine can be
                                                                     directed away from a downstream turbine at the cost of a
Over the last few years, the concept of wake steering on             small reduction in its own power production and a change
wind farms has gained significant popularity in the literature       in mechanical loads on the turbine structure. Consequently,
(Boersma et al., 2017; Kheirabadi and Nagamune, 2019).               this concept enables a net increase in the power production
Fundamentally, wake steering leverages the principle that in-        of downstream turbines and, generally, of wind farms. In
tentional yaw misalignment of a wind turbine displaces its           high-fidelity simulations, wake-steering strategies are shown
downstream wake. Thus, by choosing the right yaw mis-                to increase the wind-farm-wide power production by 15 %

Published by Copernicus Publications on behalf of the European Academy of Wind Energy e.V.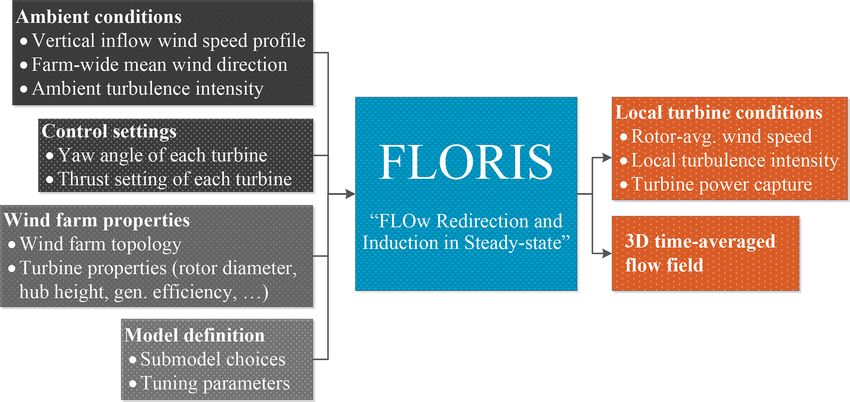
160                                       B. M. Doekemeijer et al.: Field experiment for open-loop yaw-based wake steering

for wake-loss-heavy situations (e.g., Gebraad et al., 2016).       sessed the concept of wake steering on an onshore six-turbine
Moreover, wind tunnel experiments indicate increases in the        wind farm with 3.5 D turbine spacing. While significant gains
wind farm’s power production of up to 4 %–12 % for two-            in power production of up to 47 % for low wind speeds and
turbine arrays (Adaramola and Krogstad, 2011; Schottler            up to 13 % for higher wind speeds are reported for particular
et al., 2016; Bartl et al., 2018), up to 15 %–33 % for three-      situations, the authors also state that the net energy gain of
turbine arrays (Campagnolo et al., 2016a, b; Park et al.,          the wind farm over annual operation is negligible compared
2016), and up to 17 % for a five-turbine array (Bastankhah         to baseline operation.
and Fernando, 2019). However, these experiments neglect               The current literature on wake-steering field experiments
realistic wind variability and measurement uncertainty; of-        suggests that wake steering has real potential to increase the
ten, the wind direction is known a priori and fed directly         net energy production on wind farms yet does not consis-
to the controller. A field experiment of wake steering on a        tently lead to an increase in power production for all inflow
scaled wind farm by Wagenaar et al. (2012) is inconclu-            conditions. Moreover, only Howland et al. (2019) address
sive compared to baseline operation. In response, there has        multiple-turbine interaction, rather than the two-turbine in-
been a surge in the interest in the development of reliable        teractions addressed in Fleming et al. (2017b, 2019, 2020).
wake-steering solutions that address issues of wind variabil-      Clearly, additional research and validation is necessary for
ity and measurement uncertainty (e.g., Rott et al., 2018; Sim-     the industry-wide adoption of wake-steering control algo-
ley et al., 2019; Kanev, 2020; Doekemeijer et al., 2020). Ad-      rithms for commercial wind farms. This is in agreement
ditionally, interest in the effect of yaw misalignment on the      with a recent survey among experts in academia and industry
turbine structural loads is rising, with publications showing      working on wind farm control (van Wingerden et al., 2020),
both reductions and increases in structural loads, depend-         which shows that the lack of validation is currently the pri-
ing on the turbine component, misalignment angle, and wind         mary barrier preventing implementation of wind farm con-
profile (e.g., Kragh and Hansen, 2014; Damiani et al., 2018;       trol.
Ennis et al., 2018). The scope of this article is limited to the      In this regard, this article presents the results of a field
effects of wake steering on power production.                      campaign for wake steering at an onshore wind farm with
   A small number of articles focus on the validation of wake      complex terrain in Italy, as part of the European CL-Windcon
steering for power maximization of full-scale turbines and         project (European Commission, 2020). The goal of this ex-
at commercial wind farms. Fleming et al. (2017a) instru-           periment is to assess the potential of the current wake-
mented a GE 1.5 MW turbine with a lidar and operated the           steering strategies for such complicated, commercial wind
turbine at various yaw misalignments to study the wake de-         farms. The contributions of this work are as follows:
flection downstream. Then, Fleming et al. (2017b) demon-
strated wake steering at an offshore commercial wind farm            – As one of the few in the literature, the potential of a
with relatively large turbine spacing of 7 to 14 times the ro-         state-of-the-art wind farm control algorithm is demon-
tor diameter (7–14 D). These field trials involved yawing an           strated for wake steering at an commercial onshore wind
upstream wind turbine and investigating the change in power            farm with complex terrain.
production at the downstream turbine. When looking at two
turbine pairs spaced 7 and 8 D apart, respectively, a gain was       – Wake interactions in non-aligned (i.e., not in a straight
seen in the power production of the second turbine for most            line) three-turbine arrays are investigated, in which yaw
wind directions, at the cost of a much smaller loss for the            misalignments are applied to the first two turbines. The
upstream machine. This led to an increase in the combined              yaw misalignments are computed offline, based on the
power production of up to 10 % for various wind directions.            optimization of a simplified mathematical model of the
No significant improvements were seen for a third turbine              wind farm. Wake steering for non-aligned turbine arrays
pair spaced at 14 D. However, the uncertainty bounds remain            has not been treated in the existing field experiments.
fairly large and the results also suggest that the net energy
                                                                     – The assigned yaw misalignment covers both negative
yield reduces due to wake steering for a smaller number of
                                                                       and positive angles, depending on the wind direction.
cases. Thereafter, Fleming et al. (2019, 2020) evaluated wake
                                                                       In the existing literature, turbines were only misaligned
steering at a closely spaced (3–5 D) onshore wind farm sur-            in one direction.
rounded by complex terrain, again considering two-turbine
interactions. Measurements show that the net energy yield            – Multiple turbine types are addressed. Namely, the sec-
can increase by up to 7 % and reduce by up to the same                 ond turbine, WTG E5, has a different hub height and
amount for the 3 D spaced turbine pair, depending on the               rotor diameter than the other turbines. This has not yet
wind direction. Similarly, the change in the net energy yield          been assessed in the existing field experiments.
for the 5 D spaced turbine pair is between +3 % and −2.5 %.
It must be noted that the situations that lead to an increase        The article is structured as follows. Section 2 outlines the
in power production outnumber those that show a decrease           wind farm and the experiment. Section 3 shows the turbine
in power production. Furthermore, Howland et al. (2019) as-        control setpoints, calculated using state-of-the-art wind farm

Wind Energ. Sci., 6, 159–176, 2021                                                    https://doi.org/10.5194/wes-6-159-2021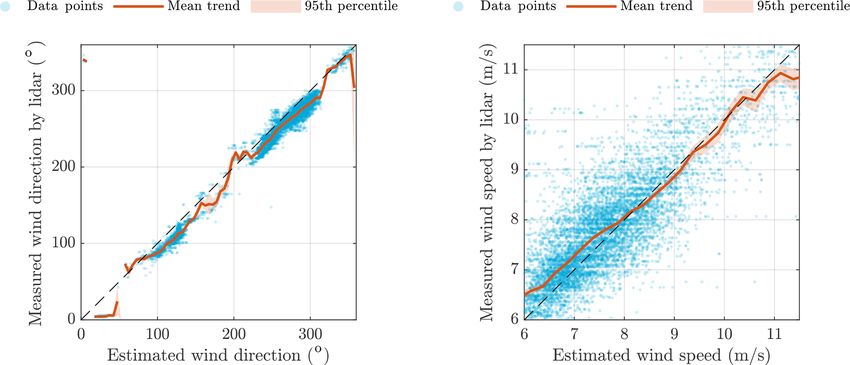
B. M. Doekemeijer et al.: Field experiment for open-loop yaw-based wake steering 161
Table 1. General properties of the GE 1.5s and GE 1.5sle wind The situations of interest are when WTG 26 sheds a wake on
turbines. WTG E5 and one or both turbines shed wakes on turbines
WTG 10, 11, or 12. Additionally, for northwest wind direc-
Variable GE 1.5s GE 1.5sle tions, the situation where turbine WTG E5 sheds a wake on
Rated power (MW) 1.5 1.5 WTG 31 is of interest. For all situations, WTG 25 is used
Cut-in wind speed (m s−1 ) 4.0 3.5 as a reference turbine, and WTG 24 and WTG 25 are used
Rated wind speed (m s−1 ) 13.0 12.0 to estimate the inflow ambient conditions for WTG 26 and
Rotor diameter (m) 70.5 77.0 WTG E5. While this layout lends itself well to wake steer-
Hub height (m) 65 80 ing, this field campaign faces several challenges, namely the
following:
– Part of the experiment is in late summer, with higher
control solutions. Section 4 describes the data postprocess- turbulence levels and lower wind speeds compared to
ing. Section 5 presents the results of the field experiment. winter. Moreover, onshore wind farms typically experi-
Finally, the article is concluded in Sect. 6. ence a higher turbulence intensity than offshore farms.
Higher turbulence levels generally yield lower benefits
2 Methodology for yaw-based wake steering (Appendix A).
– There are variations in the terrain, turbine hub heights,
This section outlines the details of the experiment. In
and turbine rotor diameters throughout the wind farm.
Sect. 2.1, the wind farm layout, terrain, and turbine properties
Specifically, hilly terrain is likely to contribute to varia-
are depicted. Then, Sect. 2.2 addresses the wake-steering ex-
tions in the ambient wind speed and wind direction be-
periment itself and discusses several challenges faced com-
tween different upstream wind turbines. However, al-
pared to previous field tests. Finally, Sect. 2.3 describes what
most all surrogate models in the literature assume a
data are collected during the experiment.
uniform (homogeneous) ambient inflow, where each
upstream turbine experiences the same wind speed,
2.1 The wind farm wind direction, and turbulence intensity (Boersma et al.,
The wake-steering field campaign has been executed on a 2017). Variations in the ambient wind direction have
subset of turbines on a commercial, onshore wind farm near a large influence on wakes and thereby on the wake-
Sedini on the island of Sardinia, Italy. The field experiment steering campaign. Additionally, as can be seen in
is part of the European CL-Windcon project. The wind farm, Fig. 1, various types of vegetation are present on the
owned and operated by Enel Green Power (EGP), is typi- ground. The surface roughness varies with the type of
cally operated for commercial purposes, not for testing. The vegetation, which in turn impacts the level of turbulence
wind farm contains a total of 43 GE wind turbines, of which and thereby wake recovery. Due to its high level of com-
36 turbines are of the type GE 1.5s and 7 turbines are of plexity, surrogate models address these effects to a very
the type GE 1.5sle. Properties of the two turbine types found limited degree and lack validation with higher-fidelity
on this farm are listed in Table 1. The relevant subset of the and experimental data. The surrogate model used in this
wind farm layout is shown in Fig. 1. In the wake-steering work will be discussed in Sect. 3.2.
campaign, WTG E5 is of the type GE 1.5sle and all other – The downstream turbines are closely spaced, implying
turbines are of the type GE 1.5s. that gains due to wake steering are hardly noticeable
The Sedini wind farm is located in a relatively flat area when considering the complete downstream array. For
with an average elevation of 360 to 400 m a.s.l. (above sea example, if the wake of WTG E5 is redirected away
level), surrounded by hills of 400–450 m a.s.l. The site veg- from WTG 10, then the combined net gain of WTG 26,
etation consists of scrub and clear areas. The predominant E5, 10, 11, 12, and 31 would be relatively small. In addi-
wind directions are from the west and southeast. The mean tion, wake steering should be very precise, as the wake
wind speed is 4–6 m s−1 , depending on the season. The site must be redirected between WTG 10, 11, 12, and 31 to
has a median ambient turbulence intensity of 15 %–25 % lead to a net energy increase. For example, if the wake is
with a mean shear exponent of 0.05 to 0.25 for day and night, deflected away from WTG 11, it may be moved on top
respectively (Kern et al., 2017). Figure 2 shows the estimated of WTG 10 or 12, thereby effectively leading to zero net
wind direction, wind speed, and turbulence intensity of the gain.
data collected by the upstream turbines.
– The ambient conditions are to be estimated using ex-
isting turbine sensors, rather than external measurement
2.2 Experiment design
equipment such as a lidar system. This is likely to be
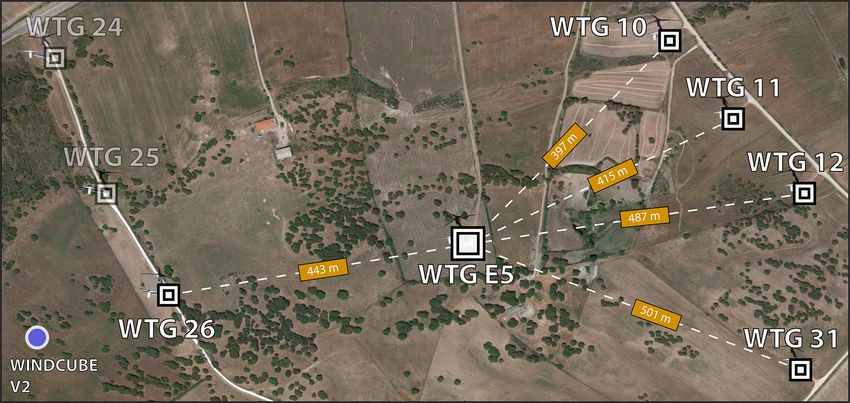
For the wake-steering experiments, eight turbines are used: less accurate but more realistic for the future commer-
WTG 10, 11, 12, 24, 25, 26, 31, and E5, as shown in Fig. 1. cialization of wake steering.
https://doi.org/10.5194/wes-6-159-2021 Wind Energ. Sci., 6, 159–176, 2021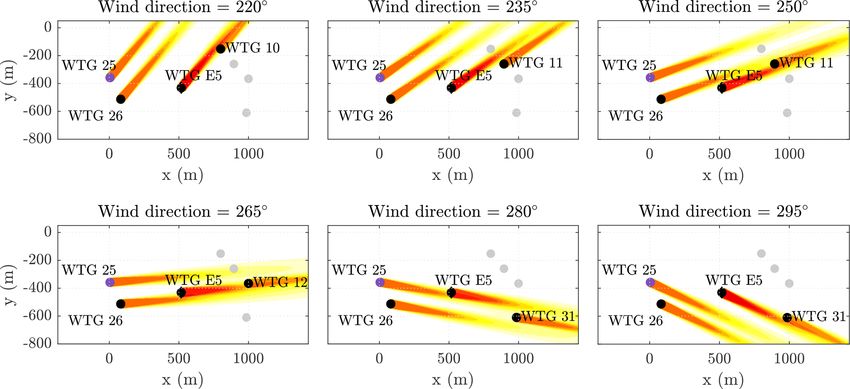
162                                        B. M. Doekemeijer et al.: Field experiment for open-loop yaw-based wake steering

Figure 1. Positions of the wind turbines used in the wake-steering campaign. Turbines WTG 26 and E5 are operated at a yaw misalignment
to steer the wakes away from downstream turbines WTG E5, 10, 11, 12, and 31. WTG 25 is used for normalization. WTG E5 is a GE 1.5sle
turbine, and all others are GE 1.5s turbines. A WindCube V2 lidar system is used to characterize the inflow in front of WTG 26 for a short
period of the field campaign. Imagery © 2020 Google, imagery © 2020 CNES/Airbus, Maxar Technologies; map data © 2020.

Figure 2. All measured data from 19 August 2019 until 3 February 2020, binned by wind direction, wind speed, and turbulence intensity.
Wind comes predominantly from the west, which is within the scope of the wake-steering experiment. Furthermore, wind speeds are relatively
low and turbulence intensities are high. The gray area covers data that are discarded in analysis of the wake-steering experiments.

These challenges, in addition to common challenges such                Table 2. Wind turbines of interest, scheduled according to the wind
as irregular turbine behavior and measurement uncertainty,             direction. To maximize the benefits of wake steering, only three tur-
have led to the decision to consider only one of the down-             bines are considered at a time, depending on the ambient wind di-
stream turbines (WTG 10, 11, 12, 31) at a time, scheduled              rection.
according to the ambient wind direction, as listed in Table 2.
                                                                               Wind direction           Turbines of interest
Thus, the remaining downstream turbines are ignored in the
analysis. This means that the wake can be steered away from                    < 235◦            WTG 26, WTG E5, and WTG 10
the considered turbines and onto the ignored turbines. This is                 235–253◦          WTG 26, WTG E5, and WTG 11
exemplified in Fig. 3, depicting which wake interactions are                   253–276◦          WTG 26, WTG E5, and WTG 12
considered per wind direction.                                                 ≥ 276◦            WTG 26, WTG E5, and WTG 31

Wind Energ. Sci., 6, 159–176, 2021                                                          https://doi.org/10.5194/wes-6-159-2021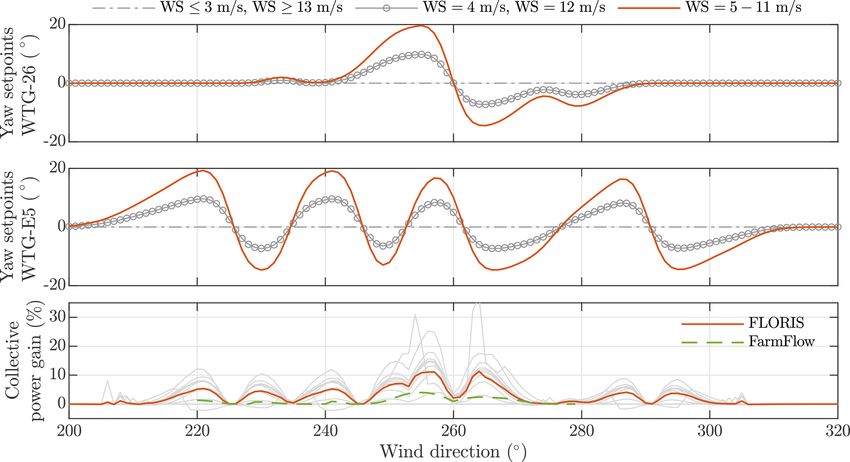
B. M. Doekemeijer et al.: Field experiment for open-loop yaw-based wake steering                                                      163

Figure 3. Predicted flow fields for various wind directions in baseline operation. To maximize the benefits of wake steering, only three
turbines are considered at a time, depending on the ambient wind direction. The considered turbines are WTG 26, WTG E5, and one of the
downstream turbines (operated without yaw misalignment). The schedule of which turbines are considered is listed in Table 2. Note that this
figure is shown for explanatory purposes, and therefore the simulation setup is not described in detail.

2.3   Data acquisition                                                  as the generator power, the wind speed measured by the
                                                                        anemometer, the wind direction measured by the wind vane,
The benefit of wake steering strongly depends on the ambi-              and the yaw orientation measured with the yaw sensor. An al-
ent conditions. Therefore, it is important to accurately char-          gorithm internal to the GE turbine provides estimates of the
acterize these inflow conditions. In this field campaign, data          1 min averaged wind speed, 1 min averaged wind direction,
are acquired from a number of sources. A met mast with a                and 10 min averaged turbulence intensity.
height of 63.5 m is installed 0.5 km north of WTG 25. The
met mast provides information about the wind speed, wind                3     Controller synthesis
direction, vertical shear, temperature, and humidity on the
wind farm. However, ambient conditions vary significantly               As the research field in wind farm control is quickly evolv-
throughout the farm, not least due to this being an onshore             ing, an increasing amount of focus is being put on closed-
wind farm. For this reason, a mobile, ground-based vertical             loop wind farm control solutions (Doekemeijer et al., 2019).
lidar system of the type Leosphere WindCube V2 is installed             However, implementing and testing such a closed-loop wind
to measure the inflow at WTG 26 for the first several months            farm control algorithm is not feasible for the designated field
of the wake-steering field campaign, as shown in Fig. 1. The            campaign, and instead an open-loop solution is opted for.
WindCube is installed at an estimated distance of 3 D in front          Closed-loop solutions require additional communication in-
of WTG 26, thereby lying outside of the turbine’s induc-                frastructure compared to open-loop solutions. Also, the ac-
tion zone. This lidar system measures the wind speed at a               tual turbine behavior becomes less predictable as the com-
0.1 m s−1 accuracy and the wind direction with a 2◦ accuracy            plexity of the controller increases significantly.
at 12 programmable heights up to 200 m, with a sampling                    The controller consists of two components. Firstly, the am-
rate of 1 Hz. This lidar system cannot communicate with the             bient conditions (being the wind direction, wind speed, tur-
control algorithm in real time and thus was only used in post-          bulence intensity) are estimated. How these variables are es-
processing to validate the ambient wind conditions estimated            timated is described in Sect. 3.1. Secondly, the optimal tur-
in front of WTG 26 using WTG 24 and WTG 25. The vali-                   bine yaw setpoints for WTG 26 and WTG E5 are interpo-
dation is shown in Fig. 4, displaying a good fit for the wind           lated from a three-dimensional look-up table using the esti-
speed. Note that a bias is seen in the wind direction estimates.        mated atmospheric conditions. The synthesis of this three-
   In addition to the lidar system, WTG 26 and WTG E5 are               dimensional look-up table is outlined in Sect. 3.2.
instrumented with an additional, accurate nacelle anemome-
ter. Also, WTG 12, 26, and E5 are each instrumented with an             3.1    Estimation of the ambient conditions
additional, accurate nacelle position sensor. Note that these
sensors were only available during the first months of the              As outlined in Sect. 2.3, the ground-based lidar cannot be
field experiment, used for calibration and monitoring. The              used in real time for the wind farm control solution. More-
GE wind turbines provide standardized SCADA data such                   over, the met mast is located too far away to give a reli-

https://doi.org/10.5194/wes-6-159-2021                                                           Wind Energ. Sci., 6, 159–176, 2021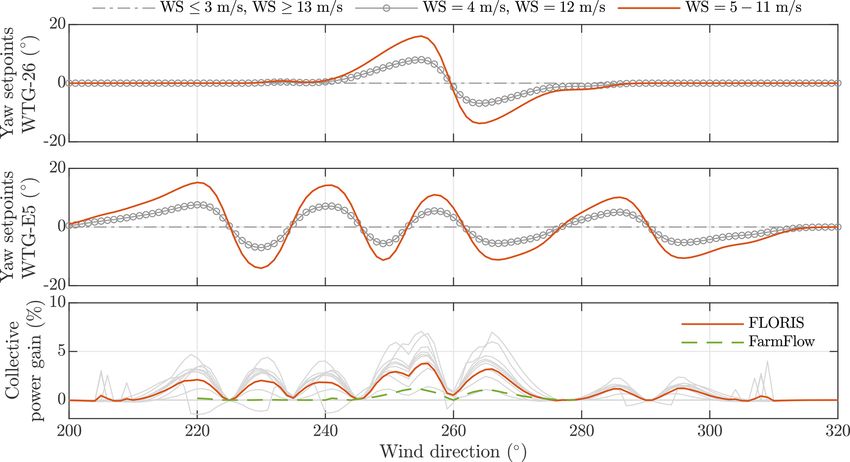
164                                       B. M. Doekemeijer et al.: Field experiment for open-loop yaw-based wake steering

Figure 4. Comparison of wind direction and wind speed estimates from the lidar (10 min averages) and from the turbine anemometers
(1 min averages). For the field campaign, the freestream wind direction, wind speed, and turbulence intensity at WTG 26 are estimated
using upstream turbines WTG 25 and WTG 24. This approach is validated by comparing the estimates to measurements of the Leosphere
WindCube V2 lidar, installed in front of WTG 26 throughout the first several months of the field campaign. The figure shows that the
estimates largely match the measurements and the 95 % uncertainty bounds, denoted by the shaded region, are narrow. Note that waked
sectors (e.g., zone at 80–90◦ ) are not removed in these plots.

able estimate of the ambient conditions. Therefore, turbine          fore inherently includes the time-averaged effects of dynamic
SCADA data are used to derive an averaged freestream wind            flow behavior such as wake meandering. Figure 5 shows a
speed, wind direction, and turbulence intensity for the inflow       flowchart of the inputs and outputs of FLORIS.
of WTG 26. This estimated wind direction is also assumed                The yaw angles of WTG 26 and E5 were optimized in
to be the wind direction at WTG E5. To obtain the ambi-              FLORIS for a range of wind directions (200 to 320◦ in
ent wind condition estimate in front of WTG 26, the individ-         steps of 2◦ ), wind speeds (3 to 13 m s−1 in steps of 1 m s−1 ),
ual estimates from turbines WTG 24 and WTG 25 are aver-              and turbulence intensities (7.5 %, 13.5 %, and 18.0 %). Note
aged, which operate in the freestream flow for the wind di-          that the optimization was done using the wind-direction-
rection range considered for the wake-steering experiments.          scheduled layout as described in Sect. 2.2. The optimiza-
Note that a bias in the wind direction estimate was previously       tion took approximately 102 CPU hours. The yaw angles
seen in Fig. 4. Rather than using the lidar which is likely          were then averaged and fixed between wind speeds of 5 and
prone to bias and uncertainty, this is corrected for by com-         11 m s−1 in postprocessing to reduce yaw actuation at a neg-
paring the estimated position (wind direction) of the largest        ligible loss in the expected gains, verified by simulations
power deficits at downstream turbines from the FLOw Redi-            in FLORIS and supported by findings from the literature
rection and Induction in Steady State (FLORIS) model to the          (Kanev, 2020). Below wind speeds of 5 m s−1 and above
SCADA measurements.                                                  wind speeds of 11 m s−1 , the angles are interpolated linearly
                                                                     to a yaw angle of γ = 0◦ at 3 and 13 m s−1 , respectively. This
                                                                     is to avoid undesirable behavior near cut-in and rated opera-
3.2   Optimization of the turbine control setpoints                  tion.
The turbine yaw angles are optimized using the FLORIS sur-              Furthermore, to reduce sensitivity of the optimized yaw
rogate model, developed by the University of Colorado Boul-          setpoints to the wind direction, a Gaussian smoothing ker-
der (CU Boulder), the US National Renewable Energy Labo-             nel was applied to the table of optimized setpoints with a
ratory (NREL), and the Delft University of Technology (Ge-           standard deviation of 1.5◦ . This is necessary because, when
braad et al., 2016; Doekemeijer et al., 2021). FLORIS is a           sweeping over the wind direction, there are situations in
surrogate wind farm model that combines several submodels            which it would be better to displace a wake to the other
from the literature, such as the single-wake model from Bas-         side of a downstream turbine. This results in a discontinu-
tankhah and Porté-Agel (2016), the turbine-induced turbu-            ous change in the yaw misalignment (Rott et al., 2018). A
lence model by Crespo and Hernández (1996), and the wake             better solution would be hysteresis (e.g., Kanev, 2020), but
superposition model by Katic et al. (1987). The surrogate            this is not possible in the current framework of the turbine
model predicts the steady three-dimensional flow field and           manufacturer. The smoothed look-up table for a turbulence
turbines’ operating conditions of a wind farm under a prede-         intensity of 7.5 % is shown in Fig. 6. This figure also shows
fined inflow at a low computational cost on the order of 10 ms       the predicted gains in power capture for the specified subset
to 1 s. Note that FLORIS has been fit to high-fidelity simu-         of turbines according to FLORIS in idealized conditions. It
lation data previously (Doekemeijer et al., 2019) and there-         is seen that gains of 5 % to 15 % are expected near the wind

Wind Energ. Sci., 6, 159–176, 2021                                                       https://doi.org/10.5194/wes-6-159-2021
B. M. Doekemeijer et al.: Field experiment for open-loop yaw-based wake steering                                                          165

Figure 5. Flowchart of the FLORIS model. This model has four classes of inputs: the ambient conditions, a set of model parameters, the
turbine control settings, and the wind farm properties (e.g., layout). FLORIS maps these inputs in a static fashion to a set of turbine outputs
including the power capture and the three-dimensional flow field.

Figure 6. The turbine yaw setpoints for WTG 26 and WTG E5 for a freestream turbulence intensity of 7.5 %. The yaw angles hold constant
values for wind speeds of 5 to 11 m s−1 . At lower and higher wind speeds, the setpoints are interpolated to a yaw angle of γ = 0◦ at 3 and
13 m s−1 , respectively. The collective power gain of WTG 26, WTG E5, and the downstream turbine (WTG 10, 11, 12, or 31) averaged over
all wind speeds is shown as the solid orange line (FLORIS) and the dashed green line (FarmFlow) in the bottom plot. The gray lines therein
represent the predicted gains for one wind speed by FLORIS.

directions 255 and 265◦ at a turbulence intensity of 7.5 %.               has a different set of underlying equations and therefore pro-
Furthermore, smaller gains on the order of 5 % can be ex-                 vides different predictions. While FarmFlow predicts lower
pected for wind directions 220, 230, 240, 285, and 295◦ at a              gains, which empirically is a common trend for FarmFlow
turbulence intensity of 7.5 %. The look-up tables for higher              compared to FLORIS, it also predicts few to no losses com-
turbulence intensities are included in Appendix A and indi-               pared to baseline operation for most table entries, thereby
cate a strong decrease in expected gains for higher turbulence            solidifying confidence in the synthesized table of setpoints.
intensities.                                                              Furthermore, after implementation on the real wind farm,
   FLORIS makes compromising assumptions about the                        the presented control module is toggled on–off every 35 min.
wind farm terrain and wake behavior. Thus, these predictions              This number is chosen such that toggling is not equal ev-
hold a high uncertainty. As a first step to check its robust-             ery day, thereby reducing dependency on diurnal variations
ness, the optimized yaw angles from FLORIS are simulated                  in the atmosphere. Additionally, a lower toggling time would
in FarmFlow, the in-house wind farm model of TNO (Kanev                   lead to fewer usable data due to postprocessing (step 5 of
et al., 2018). FarmFlow is of the same fidelity as FLORIS but             Sect. 4), and a higher toggling time would reduce the number

https://doi.org/10.5194/wes-6-159-2021                                                              Wind Energ. Sci., 6, 159–176, 2021
166                                        B. M. Doekemeijer et al.: Field experiment for open-loop yaw-based wake steering

of measurements obtained under comparable atmospheric                    speed (in steps of 1 m s−1 ), the numbers of measure-
conditions. The optimal toggling time for such experiments               ments for baseline operation and optimized operation
remains uncertain in the literature.                                     are equal. This reduces bias in the analysis for unbal-
                                                                         anced bins.
4    Data processing                                                Note that a narrower wind speed and turbulence intensity
                                                                    range than that used in this paper should, in theory, better
Sections 2 and 3 outlined the steps taken prior to the experi-      quantify the change in power production due to wake steer-
ment. This section now addresses how the data are processed         ing. However, with the sparsity in the dataset, further narrow-
after the experiment. From 19 August 2019 onward, 1 min             ing these ranges leads to a significant increase in statistical
averages of SCADA data are collected. Analysis was per-             uncertainty. The current turbulence intensity and wind speed
formed on data up until 3 February 2020. The data are post-         ranges are obtained through an iterative process in pursuit of
processed to eliminate any faulty or irrelevant entries as fol-     narrow uncertainty bounds and clear trends. With the filtered
lows:                                                               data, the energy ratio method from Fleming et al. (2019) is
    1. All data with SCADA-based wind direction estimates           then used to calculate the gains due to wake steering. Im-
       outside of the region of interest (200 to 320◦ ) are dis-    portant to note is that WTG 10 and WTG 11 are curtailed
       carded. Note that the plots in Sect. 5 will instead be cut   to a maximum of 500 kW for long periods of time during
       off at a wind direction of 310◦ due to lack of data and      the measurement campaign. To prevent the elimination of
       of yaw activity for higher wind directions.                  this dataset, a part of the analysis is performed using the
                                                                    freestream-equivalent wind speed estimates of the local wind
    2. All data with SCADA-based ambient wind speed esti-           turbine controllers, rather than the generated power signals.
       mates lower than 7 m s−1 and higher than 12 m s−1 are        Note that the analysis for WTG 10 and WTG 11 is exclu-
       discarded, because of high noise levels and/or the op-       sively done with measurements during curtailed operation,
       timized yaw angle setpoints being very small in these        while the analysis for the other turbines relies on measure-
       regions (Fig. 6).                                            ments during normal operation – curtailed and non-curtailed
                                                                    measurements are not mixed within bins.
    3. All data with SCADA-based turbulence intensity esti-            Figure 7 shows the histograms of the postprocessed
       mates lower than 12.0 % and higher than 18.0 % are dis-      dataset, divided into baseline and optimized data. The rela-
       carded. The upper bound is because a high turbulence         tively high turbulence intensity shown in this figure corre-
       intensity reduces wake effects and thereby the expected      sponds to gains in power production on the order of 2 % to
       gains. Moreover, a narrow turbulence intensity range is      6 % according to FLORIS.
       desired with as many data points as possible for a fair
       and statistically sound analysis, explaining the lower       5   Results and discussion
       bound. The turbulence intensity range is on the higher
       side due to the nature of the experiment. The specified      This section analyzes the measurement data and quantifies
       bounds allow for a sufficient number of measurements         the change in performance due to wake steering compared to
       such that a sound statistical analysis can be performed.     baseline operation. Note that all local wind speed estimates
                                                                    and power production signals are normalized with respect to
    4. All data where the turbines of interest produce less than
                                                                    the measurements from WTG 25, to reduce the sensitivity of
       200 kW of power are discarded, to reduce the relative
                                                                    variables to the estimated ambient wind speed. Furthermore,
       variance in power and eliminate any situations in which
                                                                    95 % confidence intervals are calculated through bootstrap-
       turbines exhibit cut-in and cut-out behavior.
                                                                    ping (Efron and Tibshirani, 1993) for the results presented in
    5. Data within 5 min of a toggle change (baseline vs. op-       this section. Additionally, the results shown here are with re-
       timized operation) are discarded. Namely, due to the         spect to the estimated mean atmospheric conditions in front
       functioning of the turbine yaw controller, turbines do       of WTG 26, derived from WTG 24 and WTG 25 as described
       not instantly follow their yaw setpoint to limit usage of    in Sect. 3.
       the yaw motor.                                                  Figure 8 portrays the yaw misalignment setpoints and the
                                                                    power production of WTG 26. The dashed lines represent
    6. Power measurements are time filtered using a (non-           the predictions from FLORIS, and the solid lines represent
       causal) moving average with a centered time horizon of       the measurements. Since WTG 26 is not misaligned for wind
       5 min.                                                       directions lower than 230◦ and higher than 290◦ , the nor-
                                                                    malized power production should equal 1.0, as reflected in
    7. The datasets are separated according to their operational    the FLORIS predictions. Around wind directions of 255 and
       mode: baseline and optimized. The datasets are then          265◦ , yaw misalignments are assigned to the turbine, ex-
       balanced such that for each wind direction and wind          pected to lead to a loss in its power production. Looking

Wind Energ. Sci., 6, 159–176, 2021                                                     https://doi.org/10.5194/wes-6-159-2021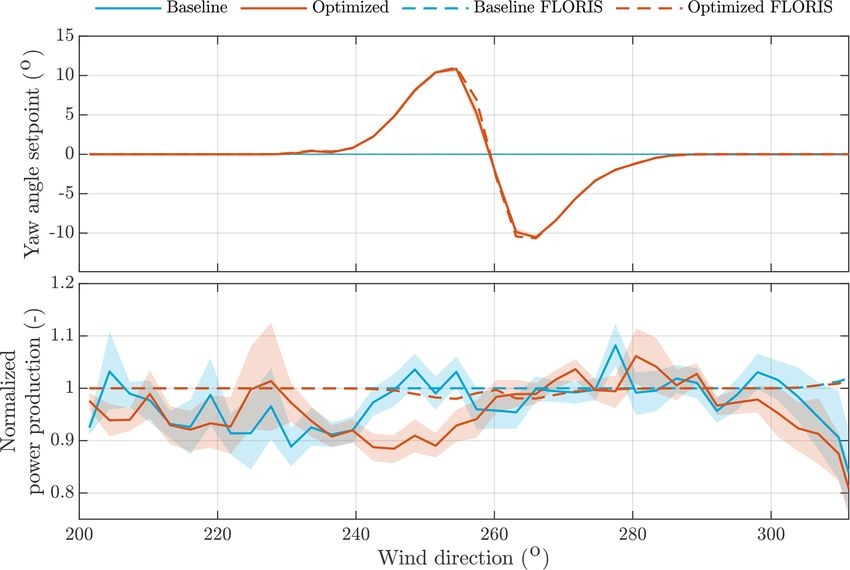
B. M. Doekemeijer et al.: Field experiment for open-loop yaw-based wake steering                                                 167

Figure 7. Filtered measurement data from 19 August 2019 until 3 February 2020, binned as a function of wind direction, wind speed, and
turbulence intensity.

Figure 8. Yaw misalignments and corresponding power production for WTG 26, normalized with respect to WTG 25. The shaded areas
show the 95 % confidence bounds. The dashed lines represent the predictions for the measured inflow conditions by FLORIS. The number
of samples in each bin is shown in Fig. 7.

at the measurements, the yaw setpoints are successfully as-          try and a high sensitivity in the power curve for yaw mis-
signed for all wind directions. However, the predicted loss in       alignment, which are both not accounted for in FLORIS.
power production due to yaw misalignment is not reflected in         These observations were confirmed with measurement data
the measurements. Rather, it appears that positive yaw mis-          from a different GE 1.5s turbine, briefly addressed in Ap-
alignment angles lead to a significant decrease of about 10 %        pendix B. It may be that this asymmetry is partially due to
in the power production (wind directions of 240–250◦ ), while        bias in the wind vane sensor and consequently in the wind
negative yaw misalignment angles even lead to a slight in-           direction estimate. The literature suggests that a bias in these
crease in the power production compared to baseline opera-           measurements is common in operational wind turbines (e.g.,
tion (wind directions of 255–295◦ ). This indicates asymme-          Fleming et al., 2014; Scholbrock et al., 2015; Kragh and

https://doi.org/10.5194/wes-6-159-2021                                                        Wind Energ. Sci., 6, 159–176, 2021
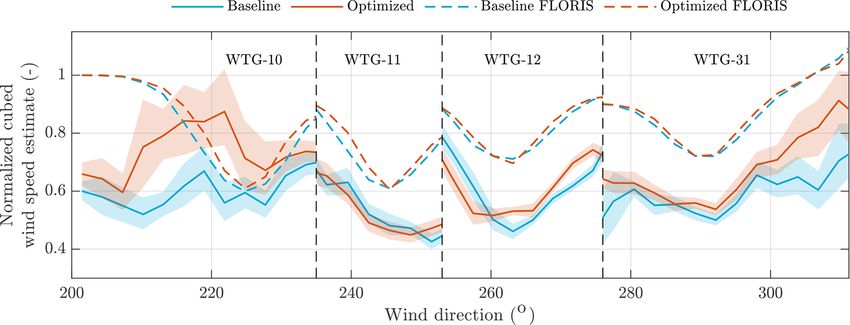
168                                      B. M. Doekemeijer et al.: Field experiment for open-loop yaw-based wake steering

Figure 9. Yaw misalignments and power production for WTG E5, normalized with respect to WTG 25. The shaded areas show the 95 %
confidence bounds. The dashed lines represent the predictions for the measured inflow conditions by FLORIS. The number of samples in
each bin is shown in Fig. 7.

Hansen, 2015), and the claim is further supported by the rel-       in the wake of WTG 24 and thereby producing less power,
atively large uncertainty seen in Fig. 8. Furthermore, wind         to which the power production of WTG E5 is normalized to.
shear and veer are also known to skew the yaw–power curve           Moreover, wakes of WTG 25 and WTG 26 cause losses in
(Howland et al., 2020), though both were quite benign in            power production in both baseline and optimized operation
this experiment. More research is necessary to explain this         for various wind directions in Fig. 9. These effects are both
yaw–power relationship for WTG 26. During the experiment,           reflected in the measurements and seen in the FLORIS pre-
the wind direction bias was addressed by comparing what             dictions. Notably, clear dips in the power production for both
FLORIS predicts to be the wind direction where the largest          baseline and optimized operation are seen at 260 and 278◦
wake losses are at downstream turbines to the actually mea-         caused by wake losses. FLORIS predicts these losses but
sured power losses and wind directions. However, it is not          lacks the accuracy to represent the finer trends in the mea-
unreasonable to assume that this was insufficient. Moreover,        surements. Moreover, changes in the power production due
Fig. 8 shows that unknown factors lead to a systematically          to a yaw misalignment on WTG E5 appear inconsistent (e.g.,
lower power production in the region of 200–225◦ compared           large loss at 245◦ , no losses for 210 to 240◦ ) compared to
to WTG 25. Also, even though both datasets operate at zero          what was seen for WTG 26. The authors speculate that this
yaw misalignment in the region of 295–320◦ , the optimized          may be either due to WTG E5 being of a different turbine
dataset shows a consistent loss compared to baseline opera-         type than WTG 26 or due to different bias corrections in the
tion for unidentified reasons. Hypothesized reasons for these       wind vanes.
discrepancies include terrain effects and differences in in-           Figure 10 displays the cubed wind speed estimate of the
flow conditions and turbine behavior between WTG 26 and             downstream turbine of interest. The reason that this variable
WTG 25 to which the signals are normalized.                         is displayed instead of the power production is due to the
   Figure 9 depicts the yaw misalignment setpoints and the          fact that WTG 10 and WTG 11 are curtailed for long pe-
power production of WTG E5. This turbine contains con-              riods of time, rendering the power measurements unusable.
siderably more yaw variation between wind directions due to         FLORIS predictions show a clear trend in power production
the close spacing and the scheduling of the considered down-        losses due to wake interactions of upstream turbines, notably
stream turbine (Table 2 and Fig. 6). This figure shows that the     at 225, 245, 265, and 290◦ . Since none of the downstream
yaw setpoints are applied successfully with little error. Fur-      turbines are yawed, FLORIS predicts that optimized opera-
ther, note that the normalized power production for unwaked         tion should never lead to any losses compared to baseline op-
conditions is about 1.2 instead of 1.0 due to the larger rotor      eration. When looking at the measurements, this prediction is
size and the higher tower of WTG E5. Note that the high rel-        incorrect for WTG 11 and WTG 12. FLORIS is reasonably
ative power production at 310◦ is due to WTG 25 operating           accurate in predicting at what wind directions the largest dips

Wind Energ. Sci., 6, 159–176, 2021                                                      https://doi.org/10.5194/wes-6-159-2021
B. M. Doekemeijer et al.: Field experiment for open-loop yaw-based wake steering                                                     169

Figure 10. The cubed wind speed estimates of the downstream WTG of interest, serving as a surrogate for the power production under turbine
derating. The results are normalized with respect to WTG 25. The shaded areas show the 95 % confidence bounds. FLORIS underpredicts
the wake losses. Moreover, the optimized dataset appears to outperform the baseline dataset, showing a benefit due to wake steering. The
number of samples in each bin is shown in Fig. 7.

Figure 11. The estimated net gain of the three turbines for wake steering compared to baseline operation. The shaded area shows the 95 %
confidence bounds. The number of samples in each bin is shown in Fig. 7.

in power production occur for downwind turbines. However,              predicts gains to be. However, the measurements also show
FLORIS overestimates the wake recovery, and the power                  losses near 255◦ . This is possibly due to the strong gradients
losses due to wake interactions are therefore larger than pre-         in the yaw misalignment setpoints and thereby the sensitiv-
dicted. This suggests that FLORIS predicts wake positions              ity to noisy inflow conditions. Also, FLORIS predicts zero
reasonably well, though lacks the accuracy to predict the sub-         wake losses for a wind direction of 200◦ for both the base-
tle effects of a yaw misalignment. These model discrepancies           line and the optimized dataset, yet the measurements show
are hypothesized to be not in the least due to the lack of an          a much lower wind speed. This is hypothesized to be due to
accurate terrain model. Because of the underestimated wake             topology effects and turbine interaction that were underes-
effects in FLORIS, wake steering may have a higher poten-              timated or not accounted for in FLORIS. The measurement
tial than predicted, and the optimal yaw angles depicted in            uncertainty bounds are often larger than the potential gains
Sect. 3 may be underestimated. Moreover, the figure shows a            predicted by FLORIS, which is largely due to the poor mod-
very large increase in power production for the region 205–            eling performance of FLORIS rather than to a high measure-
235◦ between optimized and baseline operation. This is due             ment uncertainty.
to WTG E5 steering its wake away from WTG 10. These two                   Finally, the change in performance for the combined three
turbines are positioned closest together on the wind farm, and         turbines is displayed in Fig. 11. FLORIS predicts a relatively
wake losses are therefore predicted to be the highest (Fig. 1).        small but consistent gain across different wind directions of
Furthermore, gains in power production are seen in the re-             about 3 %. This is largely due to high turbulence levels and
gion 260–320◦ . This somewhat agrees with where FLORIS                 the underestimated wake losses in FLORIS (Fig. 10). This

https://doi.org/10.5194/wes-6-159-2021                                                          Wind Energ. Sci., 6, 159–176, 2021
170                                       B. M. Doekemeijer et al.: Field experiment for open-loop yaw-based wake steering

in turn leads to the underestimation of the benefits of wake          Several important observations were made from the mea-
steering. When looking at the measurements, a very large           surement data. Measurements shows that upstream turbines
gain of up to 26 % is seen at 222◦ . Interesting to note is that   may benefit from nonzero yaw misalignment compared to
this 26 % gain is the situation where WTG E5 steers its wake       the wind vane sensor, already leading to an effective increase
away from WTG 10 (Fig. 3), and WTG 26 has no influence             in power production at these turbines without considering
on this interaction. If we only consider turbines WTG E5 and       the phenomenon of wake steering downstream. Such effects
WTG 10, the combined gain in power production of turbines          have a large influence on the results presented in this arti-
WTG E5 and WTG 10 is 35 %. However, it must be noted               cle and are likely due to poor calibration of the wind vane
that the uncertainty bands are large for this bin. Generally,      sensors, rather than to a physical property of the turbine.
notable gains in power production are measured in the re-          Moreover, the potential of wake steering was confirmed for
gion 260–273◦ with a gain of 16 % at 263◦ , with respect to        a large range of conditions. The flatness of the turbine power
three-turbine interaction. Interesting to note is that all three   curve effectively allows wake steering without losing much
turbines experience an increase in power production for this       energy upstream. Also, while the surrogate model leveraged
wind direction, be it due to a yaw misalignment or due to          in this work is able to predict the dominant trends of wake
a steered wake. Among these three turbines, the largest gain       interaction (i.e., FLORIS accurately predicts at what wind
comes from WTG E5 with a 29 % increase in power by itself.         directions the wake losses are highest), large discrepancies
Furthermore, Fig. 11 also shows notable losses, especially in      are seen between its predictions and the field measurements.
the region near 250◦ , due to large losses at WTG 26 orig-         Notably, FLORIS assumes a symmetrical yaw–power curve
inating from yaw misalignment and no gains downstream.             of WTG 26 and WTG E5, assuming peak power production
Losses are also seen near the transition regions (dashed ver-      at zero yaw misalignment. In addition, FLORIS lacks im-
tical black lines), possibly due to strong gradients in the yaw    portant terrain effects and appears to overestimate wake re-
angles at these wind directions.                                   covery. Consequently, FLORIS underestimates the benefits
   In addition to the mismatch between FLORIS and the ac-          of wake steering and the assigned yaw angles in this experi-
tual yaw–power curve of WTG 26 and WTG E5, the lack                ment are suboptimal.
of terrain effects in FLORIS is expected to have a signifi-           Overall, the following recommendations can be made for
cant impact on the results. This may be one of the key rea-        future wind farm validation trials:
sons for the overestimation of wake recovery in the FLORIS
                                                                     – This article demonstrated the asymmetry and flatness
model, which in turn leads to an underestimation of the ben-
                                                                       one may find in the yaw–power curve of commercial
efits of wake steering. Moreover, unmodeled effects such as
                                                                       wind turbines. This curve is particularly important to
secondary steering (Martínez-Tossas et al., 2019) may be a
                                                                       characterize accurately for wake steering. Therefore, fu-
source of error. These unmodeled effects can have a pos-
                                                                       ture trials should perform experiments to allow such
itive effect on the success of wake steering. This leads to
                                                                       a characterization. At a higher level, this experiment
an underestimation of the potential benefits of wake steering
                                                                       showed the significant discrepancies between FLORIS
and consequently to suboptimal yaw misalignment setpoints.
                                                                       and the measurements, especially at downstream tur-
Historical operational data may also be used to reduce the
                                                                       bines. One may want to perform simple and shorter
model–plant mismatch (Schreiber et al., 2020).
                                                                       wake-steering tests to generate data for model tuning,
                                                                       such as keeping an upstream turbine and fixed yaw mis-
6   Conclusions and recommendations                                    alignment angles of −20 to +20◦ in steps of 5◦ at a time
                                                                       under various wind shear and veer conditions (Howland
This article presented a field experiment for wake steering at         et al., 2020). However, this may be at the cost of the
a commercial onshore wind farm in Italy. Three-turbine inter-          plant’s energy production and therefore also depends on
action was considered, with the first two turbines operating           the willingness of the wind farm operator. Performing
under yaw misalignments to maximize the collective power               such a model calibration may also indicate weaknesses
production. The yaw setpoints were calculated according to             in the model, such as the absence of ground effects, in-
an open-loop steady-state and model-based wind farm con-               accuracies in the turbulence model, and variations in the
trol solution. The field experiment shows significant gains,           surface level.
especially for two-turbine interaction, with an increase in
combined power production of up to 35 % for one particular           – A difficult trade-off must be made between the value of
two-turbine situation. Moreover, gains in power production             additional accurate measurements and the higher costs
for the three-turbine array of up to 16 % were measured for            involved. Ideally, one would also measure the complete
particular wind directions. However, the measurements also             wake profiles downstream at a minimum sampling rate
show notable losses for a region of wind directions, largely           of 1 min, measure the fluid density and atmospheric
due to losses at the yaw-misaligned upstream turbines and              temperature at various heights from the ground, and
due to insufficient or incorrect wake steering downstream.             identify the incoming turbulence levels. Furthermore,
                                                                       both for model tuning and the actual wake-steering tri-

Wind Energ. Sci., 6, 159–176, 2021                                                    https://doi.org/10.5194/wes-6-159-2021
B. M. Doekemeijer et al.: Field experiment for open-loop yaw-based wake steering 171
als, an accurate characterization of the inflow conditions – In this experiment, which turbine was considered to
is essential, both in front of turbine WTG 26 and also in be the “downstream turbine of interest” was decided
front of WTG E5. This could be achieved using lidar according to the wind direction to maximize the po-
systems. However, the authors cannot make a definitive tential benefits of wake steering. Unfortunately, this is
conclusion about what equipment would provide most expected to be the reason for poor performance near
value and where it should be placed in a hypothetical the transition regions. Such scheduling requires more
future experiment. The scope of this article lies with the research before implementation and instead should be
analysis of the experiment outcomes, rather than with avoided whenever possible. Additionally, rather than
experiment design smoothing the yaw angles with a Gaussian kernel to re-
duce yaw travel, it is valuable to look into solutions such
– Subsequently, an accurate baseline yaw controller that as hysteresis (e.g., Kanev, 2020).
maximizes power production for the individual turbine
is necessary to present a reliable baseline case to which Finally, loads are neglected in this work but play a vital
the wake-steering controller can be compared. Mea- role in adoption of the concept. Other noteworthy research
sured gains from wake steering should originate from topics to explore include dynamic models and the inclusion
gains at downstream rather than upstream turbines. of heterogeneous inflow effects. In conclusion, this article
supports the notion that further research is necessary, no-
– Field campaigns should run for at least 1 year to mini- tably on the topic of wind farm modeling, before wake steer-
mize the impact of measurement uncertainty. Moreover, ing will lead to consistent energy gains on commercial wind
experiments run throughout the year will provide a re- farms.
alistic idea of the efficacy of the tested concept and its
impact on the annual energy production.
https://doi.org/10.5194/wes-6-159-2021 Wind Energ. Sci., 6, 159–176, 2021172 B. M. Doekemeijer et al.: Field experiment for open-loop yaw-based wake steering Appendix A: Additional look-up table figures The turbine yaw setpoints were optimized for a large range of inflow conditions as described in Sect. 3.2. Figure 6 previ- ously showed the optimal yaw setpoints for a low turbulence intensity of 7.5 %. This appendix shows the optimal yaw set- points for turbulence intensities of 13.5 % and 18.0 %. The optimal turbine yaw setpoints for a turbulence inten- sity of 13.5 % are shown in Fig. A1. Compared to the sit- uation with a turbulence intensity of 7.5 %, the forecasted performance gains notably reduce. A higher ambient turbu- lence leads to more wake recovery, and thus the benefits of wake steering become less apparent. The optimal turbine yaw setpoints for a turbulence intensity of 18.0 % are shown in Fig. A2. Compared to the situations with turbulence intensi- ties of 7.5 % and 13.5 %, the gains are very small. In practice, these gains are expected to drown in statistical uncertainty. Figure A1. The optimal turbine yaw angle setpoints for WTG 26 and E5 for a freestream turbulence intensity of 13.5 %. The averaged collective power gain of WTG 26, WTG E5, and the downstream machine (WTG 10, 11, 12, or 31) is shown as the solid orange line (FLORIS) and the dashed green line (FarmFlow) in the bottom plot. The gray lines therein represent the predicted gains for one wind speed by FLORIS. Wind Energ. Sci., 6, 159–176, 2021 https://doi.org/10.5194/wes-6-159-2021
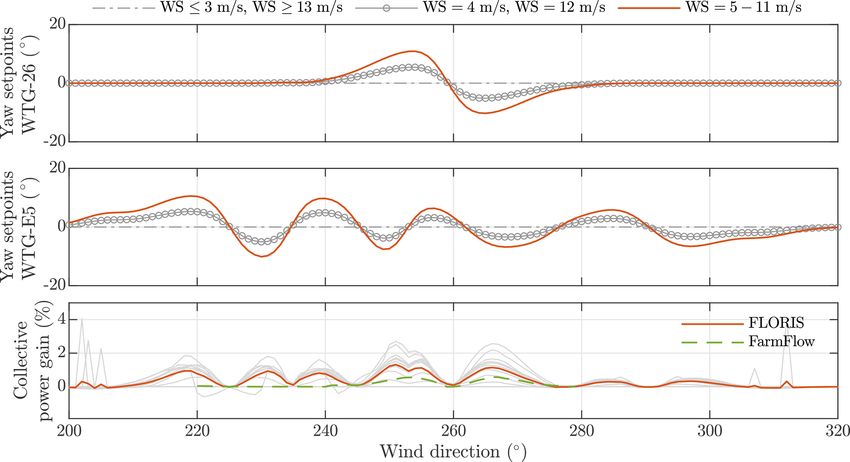
B. M. Doekemeijer et al.: Field experiment for open-loop yaw-based wake steering                                                      173

Figure A2. The optimal turbine yaw angle setpoints for WTG 26 and E5 for a freestream turbulence intensity of 18.0 %. The averaged
collective power gain of WTG 26, WTG E5, and the downstream machine (WTG 10, 11, 12, or 31) is shown as the solid orange line (FLORIS)
and the dashed green line (FarmFlow) in the bottom plot. The gray lines therein represent the predicted gains for one wind speed by FLORIS.

https://doi.org/10.5194/wes-6-159-2021                                                           Wind Energ. Sci., 6, 159–176, 2021
174                                         B. M. Doekemeijer et al.: Field experiment for open-loop yaw-based wake steering

Appendix B: Yaw–power relationship for a GE 1.5s
turbine

The experimental results from Sect. 5 indicate that negative
yaw misalignment in WTG 26 leads to very small losses and
sometimes even to a power gain compared to aligned op-
eration. This behavior is verified by studying experimental
data from a different GE 1.5s turbine inside the Sedini wind
farm that is not included in the wake-steering experiments:
WTG 30. SCADA data of this turbine are used to plot the
normalized power production of the turbine against its yaw
misalignment angle, shown in Fig. B1. This figure shows that
there is practically no decrease in power production when
misaligning the turbine in the negative direction by less than
10◦ . It is likely that this asymmetry is partially due to bias in
the wind direction measurement, which has been seen more
often in operational wind turbines as reported in the literature
(e.g., Fleming et al., 2014; Scholbrock et al., 2015; Kragh
and Hansen, 2015). Furthermore, wind shear and veer are
also known to skew the yaw–power curve (Howland et al.,
2020), though both were quite benign in this experiment.
More research is necessary to explain this yaw–power rela-
tionship for WTG 26. During the experiment, the wind direc-
tion bias was addressed by comparing what FLORIS predicts
to be the wind direction where the largest wake losses are at
downstream turbines to the actually measured power losses
and wind directions. However, it is not unreasonable to as-
sume that this was insufficient. The observations made for
this wind turbine are in agreement with the behavior seen in
WTG 26 and explain the large gains around the 260–280◦
region in the field experiments shown in Fig. 11.

Figure B1. Relationship between the normalized power produc-
tion and the yaw misalignment angle for an arbitrary GE 1.5s wind
turbine on the Sedini wind farm. The data were collected for the
range of 6 to 12 m s−1 wind speeds. The asymmetry is clearly seen.
Moreover, negative yaw misalignment shows a much smaller loss
or even a very slight gain in power production compared to positive
yaw misalignment.

Wind Energ. Sci., 6, 159–176, 2021                                                   https://doi.org/10.5194/wes-6-159-2021
B. M. Doekemeijer et al.: Field experiment for open-loop yaw-based wake steering                                                     175

Code availability. FLORIS is developed by CU Boulder, the              References
Delft University of Technology, and the National Renew-
able Energy Laboratory. A research-oriented MATLAB im-
plementation is developed by the Delft University of Tech-
nology, available at its GitHub repository (Doekemeijer et             Adaramola, M. S. and Krogstad, P. A.: Experimental investigation
al., 2021) (https://doi.org/10.5281/zenodo.4458669). Note that            of wake effects on wind turbine performance, Renew. Energy, 36,
a numerically efficient Python implementation of FLORIS                   2078–2086, https://doi.org/10.1016/j.renene.2011.01.024, 2011.
is developed by the National Renewable Energy Laboratory,              Bartl, J., Mühle, F., and Sætran, L.: Wind tunnel study on
available at its GitHub repository (Mudafort et al., 2021)                power output and yaw moments for two yaw-controlled
(https://doi.org/10.5281/zenodo.4437566). The work presented in           model wind turbines, Wind Energ. Sci., 3, 489–502,
this article uses the MATLAB implementation.                              https://doi.org/10.5194/wes-3-489-2018, 2018.
                                                                       Bastankhah, M. and Fernando, P. A.: Wind farm power optimization
                                                                          via yaw angle control: A wind tunnel study, J. Renew. Sustain.
Author contributions. BMD wrote the article with the direct sup-          Energ., 11, 023301, https://doi.org/10.1063/1.5077038, 2019.
port of JW, delivered the final turbine setpoints, and processed the   Bastankhah, M. and Porté-Agel, F.: Experimental and theoretical
data. BS, JS, and SKa analyzed historical data of the wind site and       study of wind turbine wakes in yawed conditions, J. Fluid Mech.,
closely collaborated with BMD on the synthesis of the farm control        806, 506–541, https://doi.org/10.1017/jfm.2016.595, 2016.
solution. SS, MZ, AB, MG, FW, TN, and GP were essential to the         Boersma, S., Doekemeijer, B. M., Gebraad, P. M. O., Fleming, P.
practical side of the experiments and have provided information on        A., Annoni, J., Scholbrock, A., Frederik, J. A., and van Winger-
the wind farm and on measurement equipment. SKe oversaw the               den, J. W.: A tutorial on control-oriented modeling and control
entire process, provided technical information on the wind turbines,      of wind farms, in: American Control Conference, Seattle, USA,
performed initial analyses on the experimental data, and generally        1–18, https://doi.org/10.23919/ACC.2017.7962923, 2017.
was vital for the success of this work.                                Campagnolo, F., Petrović, V., Bottasso, C. L., and Croce,
                                                                          A.: Wind tunnel testing of wake control strategies,
                                                                          in: Proceedings of the American Control Confer-
                                                                          ence (ACC), 6–8 July 2016, Boston, MA, USA, 513–518,
Competing interests. The authors declare that they have no con-
                                                                          https://doi.org/10.1109/ACC.2016.7524965, 2016a.
flict of interest.
                                                                       Campagnolo, F., Petrović, V., Schreiber, J., Nanos, E. M., Croce,
                                                                          A., and Bottasso, C. L.: Wind tunnel testing of a closed-loop
                                                                          wake deflection controller for wind farm power maximization,
Acknowledgements. The authors thank Paul Fleming for pro-                 J. Phys.: Conf. Ser., 753, 032006, https://doi.org/10.1088/1742-
viding guidance on processing the measurements retrieved from             6596/753/3/032006, 2016b.
the field campaign. Moreover, the authors thank Marcus Zettl,          Crespo, A. and Hernández, J.: Turbulence characteristics in wind-
Axel Busboom, and Maria Gomez for their help in the early                 turbine wakes, J. Wind Eng. Indust. Aerodynam., 61, 71–85,
preparation phase of the experiment. Also, the authors thank              https://doi.org/10.1016/0167-6105(95)00033-X, 1996.
Michael Howland for making the authors aware of the effect of          Damiani, R., Dana, S., Annoni, J., Fleming, P., Roadman, J.,
wind shear and wind veer on the yaw–power curve of commercial             van Dam, J., and Dykes, K.: Assessment of wind turbine com-
turbines. Any mistakes in this work remain the authors’ own. This         ponent loads under yaw-offset conditions, Wind Energ. Sci., 3,
work is part of the European CL-Windcon project and has received          173–189, https://doi.org/10.5194/wes-3-173-2018, 2018.
funding from the European Union’s Horizon 2020 research and in-        Doekemeijer, B. M., Fleming, P. A., and van Wingerden, J.
novation program under grant agreement no. 727477.                        W.: A tutorial on the synthesis and validation of a closed-
                                                                          loop wind farm controller using a steady-state surrogate
                                                                          model, in: American Control Conference, Philadelphia, USA,
Financial support. This
                      research has been supported by                      https://doi.org/10.23919/ACC.2019.8815126, 2019.
the Horizon 2020 Framework Programme (grant no. CL-                    Doekemeijer, B. M., van der Hoek, D. C., and van Wingerden, J.
Windcon (727477)).                                                        W.: Closed-loop model-based wind farm control using FLORIS
                                                                          under time-varying inflow conditions, Renewable Energy, 156,
                                                                          719–730, https://doi.org/10.1016/j.renene.2020.04.007, 2020.
                                                                       Doekemeijer, B. M., Storm, R., and Schreiber, J.: TUDelft-
Review statement. This paper was edited by Johan Meyers and
                                                                          DataDrivenControl/FLORISSE_M: Stable version from 2018–
reviewed by David Schlipf and David Verelst.
                                                                          2019, Zenodo, https://doi.org/10.5281/zenodo.4458669, 2021.
                                                                       Efron, B. and Tibshirani, R. J.: An introduction to the bootstrap,
                                                                          Chapman & Hall, New York, NY, USA, 1993.
                                                                       Ennis, B. L., White, J. R., and Paquette, J. A.: Wind turbine blade
                                                                          load characterization under yaw offset at the SWiFT facility, J.
                                                                          Phys.: Conf. Ser., 1037, 052001, https://doi.org/10.1088/1742-
                                                                          6596/1037/5/052001, 2018.
                                                                       European Commission: Horizon 2020 Project Repository: Closed
                                                                          Loop Wind Farm Control, available at: https://cordis.europa.eu/
                                                                          project/id/727477, last access: 20 October 2020.

https://doi.org/10.5194/wes-6-159-2021                                                          Wind Energ. Sci., 6, 159–176, 2021
You can also read


