Lignin oxidation products in soil, dripwater and speleothems from four different sites in New Zealand - Biogeosciences
←
→
Page content transcription
If your browser does not render page correctly, please read the page content below
Biogeosciences, 18, 2289–2300, 2021
https://doi.org/10.5194/bg-18-2289-2021
© Author(s) 2021. This work is distributed under
the Creative Commons Attribution 4.0 License.
Lignin oxidation products in soil, dripwater and speleothems from
four different sites in New Zealand
Inken Heidke1 , Adam Hartland2 , Denis Scholz3 , Andrew Pearson2 , John Hellstrom4 , Sebastian F. M. Breitenbach5 ,
and Thorsten Hoffmann1
1 Institute of Inorganic Chemistry and Analytical Chemistry, Johannes Gutenberg University Mainz,
Duesbergweg 10–14, 55128 Mainz, Germany
2 Environmental Research Institute, School of Science, University of Waikato, Private Bag 3105,
Hamilton 3240, New Zealand
3 Institute of Geosciences, Johannes Gutenberg University Mainz, J.-J.-Becher-Weg 21, 55128 Mainz, Germany
4 School of Earth Sciences, University of Melbourne, 253-283 Elgin St, Carlton, VIC 3053, Australia
5 Department of Geography and Environmental Sciences, Northumbria University,
Newcastle upon Tyne, NE1 8ST, United Kingdom
Correspondence: Thorsten Hoffmann (t.hoffmann@uni-mainz.de)
Received: 20 September 2020 – Discussion started: 6 November 2020
Revised: 17 February 2021 – Accepted: 2 March 2021 – Published: 8 April 2021
Abstract. Lignin oxidation products (LOPs) are widely used 68, strongly decreases. This shows that the LOP signal is
as vegetation proxies in climate archives, such as sediment strongly influenced by both transport and degradation pro-
and peat cores. The total LOP concentration, 68, provides cesses. Nevertheless, the relative LOP signal from the over-
information on the abundance of vegetation, while the ratios lying soil at the different cave sites is preserved in the flow-
C/V and S/V of the different LOP groups also provide in- stone. We emphasize that for the interpretation of C/V and
formation on the type of vegetation. Recently, LOP analysis S/V ratios in terms of past vegetation changes, it is important
has been successfully applied to speleothem archives. How- to compare only samples of the same type (e.g., speleothem,
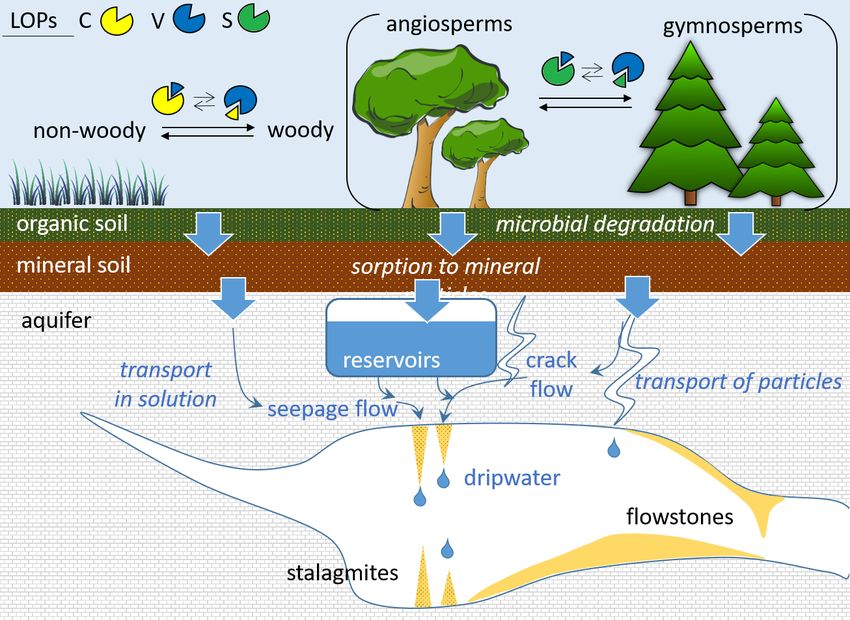
ever, there are many open questions concerning the trans- dripwater or soil) and to evaluate only relative variations.
port and microbial degradation of LOPs on their way from
the soil into the cave system. These processes could poten-
tially alter the original source-dependent LOP signals, in par-
ticular the C/V and S/V ratios, and thus complicate their 1 Introduction
interpretation in terms of past vegetation changes. We ana-
lyzed LOPs in leaf litter and different soil horizons as well Climate archives provide the means to study the climate and
as dripwater and flowstone samples from four different cave environment of the past, which is necessary to put ongoing
sites from different vegetation zones in New Zealand us- climate change into a historic framework. Speleothems are
ing ultrahigh-performance liquid chromatography coupled to valuable climate archives because they are ubiquitous across
high-resolution mass spectrometry. We test whether the orig- climatic and vegetational zones, preserve a range of inor-
inal source-dependent LOP signal of the overlying vegeta- ganic and organic proxies (Fairchild and Baker, 2012; Blyth
tion is preserved and can be recovered from flowstone sam- et al., 2016), and can be accurately dated up to ca. 600 000–
ples and investigate how the signal is altered by the trans- 700 000 years before present using U-series dating (Cheng
port from the soil to the cave. The LOP concentrations range et al., 2016; Scholz and Hoffmann, 2008). While up to the
from mg g−1 in the soil to ng g−1 in the flowstones. Our re- 1990s, speleothem research focused mainly on stable iso-
sults demonstrate that, from the soil to the flowstone, the C/V topes (e.g., δ 18 O and δ 13 C) (McDermott, 2004), today, multi-
and S/V ratios both increase, while the total lignin content, proxy studies combining, for example, stable isotopes, trace
elements, fluorescent organic matter and selected molecu-
Published by Copernicus Publications on behalf of the European Geosciences Union.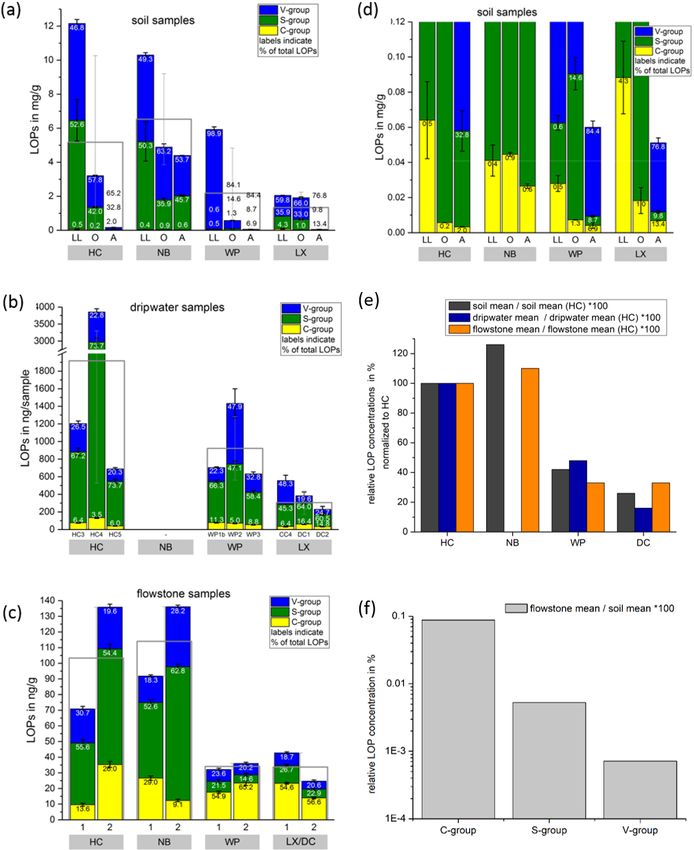
2290                                          I. Heidke et al.: Lignin oxidation products in soil, dripwater and speleothems

lar organic biomarkers are employed to unravel climatic and           The microbial degradation of lignin in the soil is compara-
ecological signals (Blyth et al., 2016; Fairchild et al., 2006).   bly slow. For instance, it can take several years to break down
Vegetation proxies not only complement other climate prox-         a piece of wood (Opsahl and Benner, 1995). This is because
ies but also inform about the impact of changing tempera-          only white-rot fungi are able to completely mineralize lignin
ture and precipitation on the development of vegetation. Fatty     to CO2 , mostly by co-metabolism with other energy sources.
acids, originating from both plants and soil microorganisms,       Other fungi, such as soft-rot and brown-rot fungi, are only
have been extracted from speleothems to study soil and veg-        able to induce structural changes to lignin (Kögel-Knabner,
etation activity (Blyth et al., 2006; Bosle et al., 2014), and     2002). Due to this relative stability, lignin oxidation prod-
long-chain n-alkanes from plant leaf waxes have been used          ucts are widely used as a paleo-vegetation proxy in climate
to investigate vegetation changes (Xie, 2003; Blyth et al.,        archives, such as peat, lake sediments and marine sediment
2007, 2011). However, the use of n-alkane chain length             cores (see the review by Jex et al., 2014). In addition, LOPs
distributions to distinguish between different plant groups        are used as a proxy for the terrestrial input of plant biomass
has been debated (Bush and McInerney, 2013; Blyth et al.,          in natural waters (Zhang et al., 2013; Standley and Kaplan,
2016).                                                             1998; Hernes and Benner, 2002). Blyth and Watson (2009)
   Lignin is a promising paleo-vegetation proxy because it is      first detected lignin-derived compounds in speleothems, and
produced exclusively by vascular plants and represents one         lignin was subsequently highlighted as a promising vegeta-
of the main constituents of wood and woody plants (Boer-           tion proxy in speleothems in several review papers (Blyth
jan et al., 2003; Jex et al., 2014). In addition, the analysis     et al., 2008; Jex et al., 2014; Blyth et al., 2016).
of lignin has the particular advantage that it can yield in-          A recent study showed that trace concentrations of lignin
formation about not only the abundance but also the type           oxidation products can be quantified in dripwater and
of vegetation. Lignin is a biopolymer that mainly consists         speleothems (Heidke et al., 2018). In addition, in a Holocene
of three different monomers, coniferyl alcohol, sinapyl al-        stalagmite from the Herbstlabyrinth, Germany, the LOP con-
cohol and p-coumaryl alcohol, which are linked via C-C             centrations and C/V and S/V ratios were found to co-vary
and C-O bonds in a radical coupling mechanism. The re-             with environmental changes and correlate with other prox-
sulting structural units are guaiacyl (G), syringyl (S) and        ies, such as P, U and Ba concentrations as well as δ 13 C values
p-hydroxyphenyl (H) phenylpropanoid units, respectively,           (Heidke et al., 2019). This study also observed seasonal vari-
with the corresponding ratios varying with plant type. Lignin      ations in LOP concentrations in monthly dripwater samples
from gymnosperms (soft wood) consists mainly of G units,           from the Herbstlabyrinth, with lower LOP concentrations in
whereas lignin from angiosperms (hard wood) contains both          winter and higher concentrations in summer. However, there
G and S units. Grasses and non-woody plant parts, such as          are still many open questions concerning the transport of
leaves and needles, are constructed from equal parts of G,         lignin from the soil through the karst system into the cave
S and H units. In addition, p-coumaric acid and ferulic acid       and speleothem. For instance, the interaction of lignin with
can be ester-bound to the terminal hydroxyl groups of the          mineral surfaces can lead to fractionation (Hernes et al.,
propyl side chains, especially in grass lignin (Boerjan et al.,    2007, 2013), and land-use, climate and soil characteristics
2003; Kögel-Knabner, 2002).                                        may also influence the degradation of lignin (Thevenot et al.,
   To analyze the lignin composition, the lignin polymer is        2010; Jex et al., 2014). These effects could potentially alter
oxidatively degraded into monomeric lignin oxidation prod-         the original source-dependent LOP signals, in particular the
ucts (LOPs), for example via CuO oxidation. The guaiacyl           C/V and S/V ratios, and thus complicate their interpretation
unit is oxidized to vanillic acid, vanillin and acetovanillone     in terms of past vegetation changes. A schematic overview of
(V-group LOPs), and the syringyl unit is oxidized to syringic      the potential processes influencing the LOP signals is shown
acid, syringaldehyde and acetosyringone (S-group LOPs).            in Fig. 1.
Ferulic acid and p-coumaric acid form the C-group LOPs.               The vast majority of procedures for the determination of
The p-hydroxyphenyl unit is oxidized to p-hydroxybenzoic           organic analytes in aqueous solutions such as dripwater rely
acid, p-hydroxybenzaldehyde and p-hydroxyacetophenone              on the collection of discrete samples of the water at a spe-
(H-group LOPs), but because these can also originate from          cific time. Subsequent laboratory analysis of the sample then
other sources than lignin, such as soil microorganisms or the      provides a snapshot of the concentration of the target ana-
degradation of protein-rich material, the H-group LOPs are         lytes at the time of sampling. In the presence of fluctuating
not used as vegetation proxies. The sum of all eight individ-      concentrations, this method also has drawbacks, such as al-
ual C-, S- and V-group LOPs, 68, is used to represent the          lowing for episodic concentration fluctuations to be missed.
total lignin concentration, whereas the ratios of the different    One solution to this problem is to increase the frequency of
LOP groups, C/V and S/V, are used to represent the type            sampling or to install automated sampling systems that can
of lignin, with a higher C/V ratio indicating a higher contri-     collect numerous dripwater samples over a period of time.
bution of non-woody vs. woody plant material and a higher          However, this is costly and in many cases impractical. But
S/V ratio indicating a higher contribution of angiosperm vs.       alternatives exist to overcome some of these difficulties. Of
gymnosperm plant material (Hedges and Mann, 1979).                 these, passive-sampling methods have shown to be promising

Biogeosciences, 18, 2289–2300, 2021                                                   https://doi.org/10.5194/bg-18-2289-2021
I. Heidke et al.: Lignin oxidation products in soil, dripwater and speleothems                                                        2291

Figure 1. Schematic representation of the different potential processes influencing the transport and degradation of LOPs in speleothems and
cave dripwater.

tools for measuring aqueous concentrations of a wide range              2     Methods and materials
of organic substances. Passive samplers avoid many of the
problems described above because they enrich target analytes            2.1    Location and environment of the cave sites
in situ, can be used for extended periods of time and can be
applied without continuously accessing the sampled caves.               The samples in this study were taken from six different
The goal is to determine the mass of target components accu-            cave sites in New Zealand (Fig. 2), spanning a latitudi-
mulated by a sampler, thereby obtaining time-averaged con-              nal gradient from 38◦ S (Waipuna Cave) to 45◦ S (Lux-
centrations. Of course, passive samplers also have their dis-           more Caves). Waipuna Cave (WP) is situated in the Wait-
advantages (Vrana et al., 2005), which is why they are used             omo District in the west of the North Island (38.3114722◦ S,
here as one method in combination with other objects of in-             175.0206389◦ E). The vegetation above the cave consists
vestigation (leaf litter, soil and flowstone samples) and are           of pasture and mixed podocarp–broadleaved forest domi-
primarily used to compare the different sampled sites with              nated by tree ferns. Soils are developed from rhyolitic tephra
each other.                                                             and are characterized by very deep A horizons. Hodges
   In this study, we analyzed the LOP signals in soil and drip-         Creek Cave (HC; 41.171270◦ S, 172.685941◦ E) and Net-
water samples as well as recently deposited flowstones from             tlebed Cave (NB; 41.2104589◦ S, 172.7394572◦ E) are both
six different cave sites in New Zealand with different overly-          situated in Kahurangi National Park (40◦ S), in the Tasman
ing vegetation. We investigated whether the original source-            District in the northwest of the South Island. The vege-
dependent signal of the overlaying vegetation is preserved              tation above both caves consists mainly of mature south-
and can be recovered from the flowstone samples. Further-               ern beech forest with well-developed O horizons. Luxmore
more, we investigated how the signal is altered by the trans-           Caves (LX), Dave’s Cave (DC) and Calcite Cave (CC) are
port process.                                                           all situated on Mt. Luxmore in Fiordland National Park in
                                                                        the Southland District in the southwest of the South Island
                                                                        (45.3894900◦ S, 167.6153448◦ E). The vegetation here con-
                                                                        sists mainly of tussock grassland with alpine species present.
                                                                        A description of all sites including photographs of the veg-
                                                                        etation and the soils is provided in the Supplement. From
                                                                        all caves, flowstones were selected for their higher organic
                                                                        matter content and their tendency to capture more diverse

https://doi.org/10.5194/bg-18-2289-2021                                                          Biogeosciences, 18, 2289–2300, 2021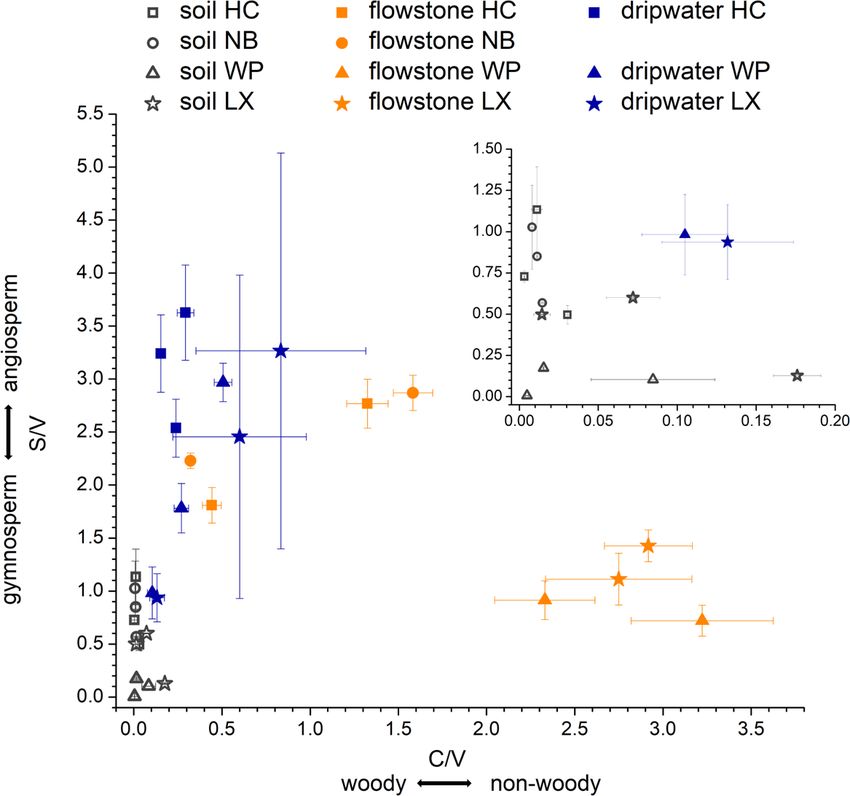
2292                                         I. Heidke et al.: Lignin oxidation products in soil, dripwater and speleothems

flow paths from surface environments compared to other            tion (SPE), the samples were acidified to pH 1–2 with con-
speleothems such as stalagmites.                                  centrated HCl and filtered through 0.45 µm cellulose acetate
                                                                  membrane filters. WP2 water samples and the stream water
2.2     Sampling and pretreatment of samples                      were divided into three subsamples equating to 0.33 L each;
                                                                  all other samples were divided into two subsamples equat-
The overall procedure for the analysis of lignin oxidation        ing to 0.25 L each. The SPE cartridges (Oasis HLB, 200 mg
products (LOPs) was similar to the procedure described in         sorbent, 6 mL volume) were preconditioned with 6 mL of
Heidke et al. (2018). However, since different types of sam-      MeOH followed by 6 mL of water acidified with HCl. The
ples were used, the methodology differed in some points and       samples were loaded by gravity flow using sample reservoirs.
is thus briefly described in the following paragraphs.            Afterwards, the cartridges were rinsed twice with 6 mL of
                                                                  acidified water and dried for 20 min by sucking ambient air
2.2.1    Sampling and pretreatment of soil and litter
                                                                  through the cartridges. The dried cartridges were stored in
         samples
                                                                  sealed plastic bags in the fridge for several weeks to months.
Soil and litter samples were collected during field trips in      Eventually, the cartridges were eluted with 5 mL of MeOH in
2014–2016 and kept refrigerated at 4 ◦ C in sealed containers     10 portions of 0.5 mL. The eluent was evaporated in a stream
prior to analysis. Soil horizons (A and O) and leaf litter (LL)   of nitrogen at 30 ◦ C. The residue was redissolved in 1.5 mL
were assigned on the basis of depth, color and composition of     of 2 mol L−1 NaOH and transferred into the microwave reac-
the soil with reference to the New Zealand soil classification    tion vessel; 250 mg of CuO, 50 mg of (NH4 )2 Fe(SO4 ) and a
manual (Hewitt, 2010) at the time of field sampling. Later,       total volume of 8 mL of 2 mol L−1 NaOH were added, and
a subsample was removed, sieved over a 2.75 mm sieve and          the microwave-assisted degradation was performed as de-
dried at room temperature beneath a fume hood. The dried          scribed in Sect. 2.3.
samples were finely ground with a pestle and mortar and              The 0.45 µm cellulose acetate syringe filters that were used
weighed into microwave reaction vessels. All soil samples         to filter the dripwater samples were stored in sealed plastic
were prepared and analyzed in duplicate; 0.5 g aliquots was       bags in the fridge for several months. The number of filters
taken from samples WP-LL, NB-LL and HC-LL (LL for leaf            used per sample varied depending on the particulate matter
litter); 0.75 g was taken from NB-O (O for O horizon); and        load. For sample WP2-04, 3 filters per subsample were used,
1.0 g was taken from all other samples (NB-A (A for A hori-       adding up to 9 filters in total, and for sample WP2-09, 4 fil-
zon), LX-LL, LX-O, LX-A, WP-O, WP-A, HC-O and HC-                 ters per subsample were used (12 filters in total). For all other
A); 500 mg of CuO, 100 mg of (NH4 )2 Fe(SO4 ) and 15 mL           samples, one filter per subsample was sufficient (two filters
of 2 mol L−1 NaOH were added into the microwave reaction          in total for WP3, WP4 and WP5 and three filters in total for
vessels, and microwave-assisted degradation was performed         WP2-07, WP2-11 and WP-stream). Three blank filters were
as described in Sect. 2.3                                         stored, handled and analyzed in the same way as the sam-
                                                                  ple filters. The filters were eluted with four portions of 1 mL
2.2.2    Active sampling and pretreatment of dripwater            of MeOH per filter. The eluent was evaporated in a stream
         samples                                                  of nitrogen at 30 ◦ C. The residue was dissolved in 3 mL of
                                                                  2 mol L−1 NaOH and then transferred into the microwave re-
Dripwater from four different drip sites in Waipuna Cave          action vessels for further degradation and analysis.
was sampled in LDPE (low-density polyethylene) bottles that
were precleaned with double-distilled water. The drip sites       2.2.3   Passive sampling and pretreatment of dripwater
are well studied for their dynamics by Nava-Fernandez et al.              samples
(2020). Drip site WP2 is a highly seasonal drip site exhibiting
high discharge following rainfall events; 1.0 L samples were      Passive-sampling cartridges with 20 mL volume filled with
collected from WP2 in April, July, September and Novem-           XAD-7 polymeric resin were placed in the caves HC, WP,
ber 2017 to investigate seasonal changes. From all other drip     CC and DC underneath individual fast dripping drip sites for
sites, 0.5 L samples were collected in November 2017. Drip        about 1 year in order to provide an integrated measure of
site WP3 is a fast drip site with 0.5 L of water collected in     dripwater organic matter fluxes. Cartridges were positioned
about 1 h; WP4 is a slow drip site with 0.5 L of water col-       so that the dripwater could flow through the cartridge, allow-
lected within 4 d; and WP5 was a very fast drip site with         ing for organic material to be adsorbed on the resin. After-
0.5 L of water collected within a few minutes. In addition,       wards, the cartridges were capped and stored in the fridge
1.0 L of water from a stream flowing through the cave was         before further processing. Eventually, the cartridges were
sampled in November 2017. After collection, the samples           rinsed with 10 mL deionized water and dried under a vac-
were transferred into precleaned glass bottles and 5 % (w/w)      uum. To extract the organic material, the XAD-7 resin was
of acetonitrile was added to the water to prevent microbial       transferred into an Erlenmeyer flask and stirred for at least
growth. The samples were stored in a fridge at 4 ◦ C awaiting     30 min with 10 mL of an elution solvent mixture consisting
further processing. Before extraction via solid-phase extrac-     of 95 % MeOH, 5 % H2 O and 0.1 mol L−1 NaOH. The sol-

Biogeosciences, 18, 2289–2300, 2021                                                  https://doi.org/10.5194/bg-18-2289-2021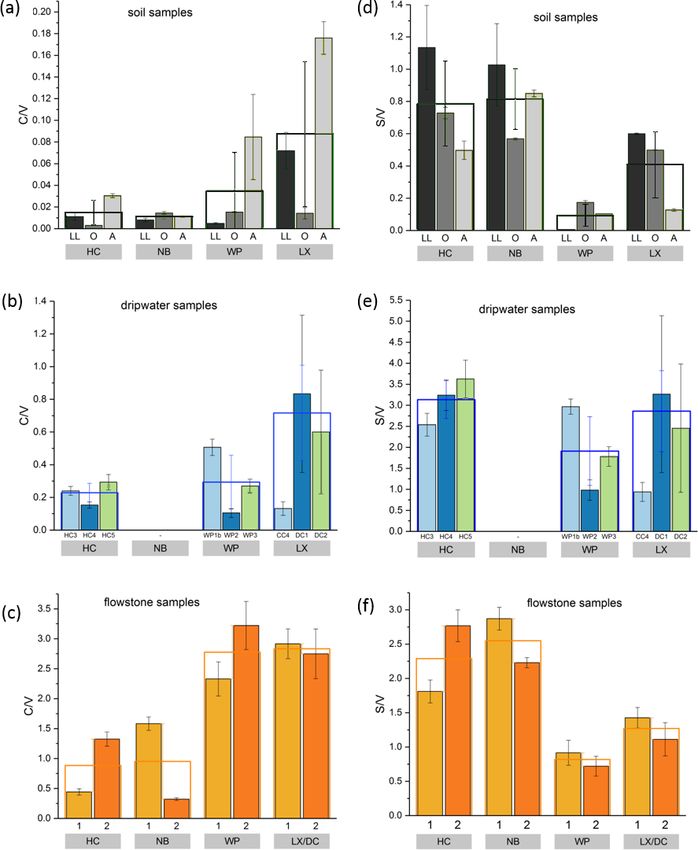
I. Heidke et al.: Lignin oxidation products in soil, dripwater and speleothems 2293
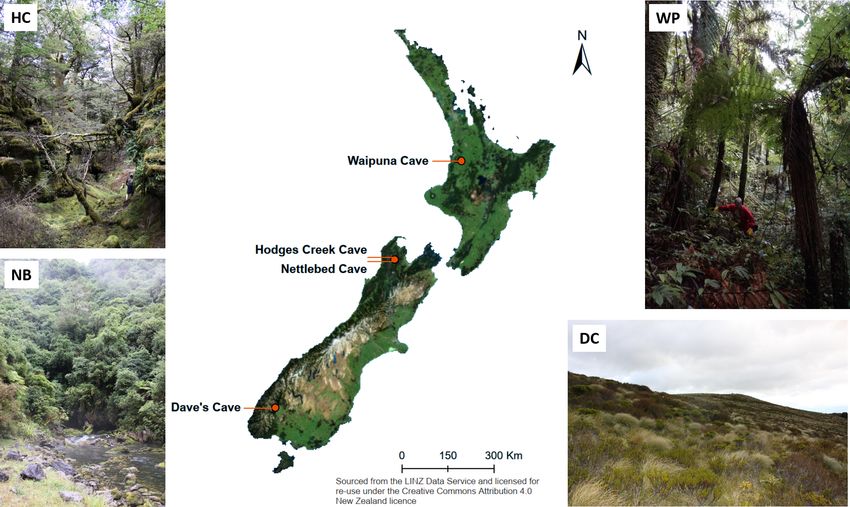
Figure 2. Map of New Zealand with the locations of the caves indicated. The photos give an impression of the vegetation at the sites of
Hodges Creek Cave (HC), Waipuna Cave (WP), Nettlebed Cave (NB) and Dave’s Cave (DC).
vent mixture with the resin was then transferred back into the inductively coupled plasma–mass spectrometer) via a Nu
cartridge, and the cartridge was eluted using positive pres- DSN desolvator. 238 U ion beam intensities were typically
sure applied through a stream of nitrogen. The eluate was 20 to 5 pA, with 233 U / 234 U and 229 Th / 230 Th analyzed si-
collected, and the resin was extracted again with fresh sol- multaneously in twin ion counters in a peak-jumping rou-
vent mixture. The procedure was repeated three times in to- tine. 230 Th / 238 U and 234 U / 238 U activity ratios for samples
tal. Finally, the cartridges were eluted with 10 mL of the sol- were normalized to those calculated for uraninite equilibrium
vent mixture directly in the cartridges using positive pres- standards run in the same analytical session. Ages were cal-
sure applied through a stream of nitrogen. The combined culated using Eq. (1) of Hellstrom (2006) and the decay con-
eluates were filtered over 1 µm glass fiber filters (Whatman stants of Cheng et al. (2013), with initial 230 Th / 232 Th and
GF/F) and evaporated at 35 ◦ C in a stream of nitrogen, until its uncertainty for each speleothem estimated using a strati-
only approx. 2 mL were left. This concentrated eluate, which graphic constraint. A table with all relevant data concerning
consisted mainly of aqueous NaOH as solvent, was trans- the 230 Th / U dating as well as the age–depth models can be
ferred into the microwave reaction vessel; 250 mg of CuO found in the Supplement.
and 50 mg of (NH4 )2 Fe(SO4 ) were added, and the volume
was made up to 8 mL with 2 mol L−1 NaOH. The microwave- 2.2.5 Sampling and pretreatment of flowstone samples
assisted degradation was performed as described in Sect. 2.3.
Samples with 5–10 mm edge length were cut from the flow-
2.2.4 230 Th/U dating of flowstone cores stone cores with a diamond blade saw following the direc-
tion of the growth layers. Photos of the flowstone cores are
Flowstone cores from the study sites were sampled in 2015. shown in the Supplement. The distance from the top of the
Powdered speleothem samples of 100 to 200 mg were col- flowstone core and the ages of the LOP samples are given
lected from sectioned core samples and analyzed as de- in Table 1. The flowstone cores were embedded in a poly-
scribed in Hellstrom (2003) and Drysdale et al. (2012). meric resin for stabilization, which was not resistant to or-
Briefly, samples were dissolved in concentrated HNO3 , ganic solvents but could not be completely dissolved either.
spiked with a mixed 236 U-233 U-229 Th isotopic tracer solu- Therefore, the cleaning protocol described in Heidke et al.
tion, and capped and equilibrated on a hotplate overnight. (2018) had to be slightly modified. Instead of ultrasonica-
U and Th were separated from the sample matrix using tion with dichloromethane and methanol, the samples were
an established procedure with Eichrom TRU ion exchange merely rinsed first with EtOH and then with MeOH and
resin columns, eluted together into a Teflon vial and dried then dried in an airstream. The outer layer of calcite, where
down overnight. Sample U and Th were redissolved in dilute it was not covered by the resin, was etched in 0.6 % HCl
HNO3 and HF and introduced together via a Teflon flow path for 5 min. Afterwards, the samples were dried, weighed and
to a Nu Instruments plasma MC–ICP–MS (Multicollector– then dissolved in 30 % HCl. The sample weight was deter-
https://doi.org/10.5194/bg-18-2289-2021 Biogeosciences, 18, 2289–2300, 2021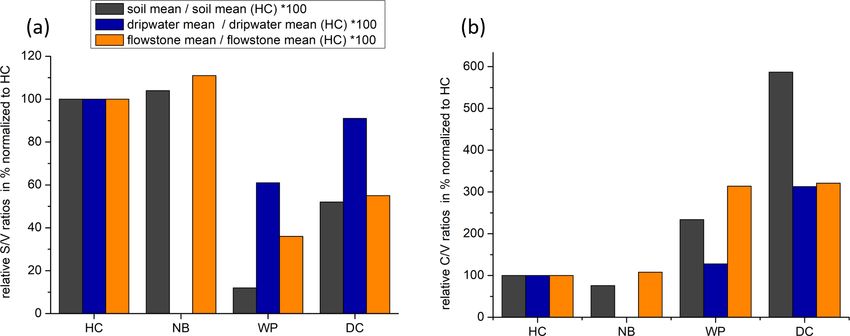
2294                                             I. Heidke et al.: Lignin oxidation products in soil, dripwater and speleothems

Figure 3. Comparison of LOP concentrations in (a) soil, (b) passively sampled dripwater and (c) flowstone samples. The height of the
columns represents the total LOP concentration, 68, and the different colors refer to the C-, S- and V-group LOPs. The empty boxes show
the mean values of the 68 concentrations. Panel (d) shows an enlargement of panel (a) to better illustrate the concentrations of the C-group
LOPs. In panel (e), the mean LOP concentrations (represented as the empty boxes in panels a, b and c) of soil, dripwater and flowstone
samples are normalized to the respective mean LOP concentration of HC. Panel (f) illustrates the different decreases between the soil and the
flowstone of the C-, S- and V-group LOPs. The abbreviations in the grey boxes in panels (a) to (d) indicate the cave (see main text). Other
abbreviations include LL for leaf litter, O for organic horizon and A for A horizon. In panel (b), different bars correspond to the individual
drip sites (see main text). In panel (c), sample 1 stands for the most recently deposited flowstone sample from the cave floor (distance from
the top of 0–1 cm), whereas 2 stands for the stratigraphically older flowstone sample with a distance from the top of 1–2 cm. The ages of the
flowstone samples are given in Table 1.

mined by weighing the resin after complete dissolution of                2.3    CuO oxidation, extraction and analysis of lignin
the sample. The sample solution was diluted 1 : 1 with ultra-                   oxidation products
pure water and then extracted via SPE as described in Heidke
et al. (2018) using Oasis HLB 60 mg cartridges and eluted                The reaction vessels filled with reagents and sample extracts
with 1.5 mL of methanol. The microwave-assisted degrada-                 were flushed with argon and capped. The oxidation, extrac-
tion with 250 mg of CuO, 50 mg of (NH4 )2 Fe(SO4 ) and 8 mL              tion and analysis procedures are described in detail in Hei-
of NaOH was performed as described in Sect. 2.3.                         dke et al. (2018). In brief, the oxidation was carried out in
                                                                         a microwave oven at 155 ◦ C for 90 min. After cooling, ethyl

Biogeosciences, 18, 2289–2300, 2021                                                           https://doi.org/10.5194/bg-18-2289-2021
I. Heidke et al.: Lignin oxidation products in soil, dripwater and speleothems 2295
Table 1. Distance from the top (DFT) of upper and lower edges of the flowstone sample cubes (DFT (upper) and (DFT (lower)), ages
calculated from the age model for upper and lower edges (age (upper) and (age (lower)), and calculated mean sample ages for the flowstone
samples (age (mean)).
Sample DFT (upper) DFT (lower) Age (upper) Age (lower) Age (mean)
in mm in mm in kyr BP in kyr BP in kyr BP
HC1 0 5 0.00 2.19 1.1 ± 1.1
HC2 5 9 2.19 3.26 2.7 ± 0.5
NB1 0 10 0.00 0.94 0.5 ± 0.5
NB2 10 20 0.94 1.59 1.3 ± 0.3
WP1 1 10 0.22 2.08 1.1 ± 0.9
WP2 10 20 2.08 3.90 3.0 ± 0.9
DC1 0 10 0.00 0.37 0.2 ± 0.2
DC2 10 18 0.37 0.72 0.5 ± 0.2
vanillin was added as an internal standard. The reaction mix-
ture was separated from solids by centrifugation, acidified
and then extracted via SPE. For the dripwater and flowstone
samples, the whole sample solution was extracted, whereas
for the soil samples, only 1 mL of the sample solution was ex-
tracted. Oasis HLB cartridges with 60 mg sorbent and 3 mL
volume were used, which were eluted with 1 mL of acetoni-
trile containing 2 % of NH4 OH.
The LC–MS (liquid chromatography–mass spectrometry)
analysis was performed similarly as described in Heidke
et al. (2018). In brief, a pentafluorophenyl column with an
acetonitrile–water gradient elution was used in an ultrahigh-
performance liquid chromatography (UHPLC) system to
separate the LOPs. The mass spectrometric detection was
performed using a Q Exactive Orbitrap high-resolution mass
spectrometer, which was operated alternately in full-scan
mode and MS–MS mode. Further details as well as slight
differences to the method described by Heidke et al. (2018)
can be found in the Supplement.
Figure 4. S/V vs. C/V values of soil, dripwater and flowstone sam-
ples from Hodges Creek Cave (HC), Nettlebed Cave (NB), Waipuna
3 Results and discussion Cave (WP) and Luxmore Caves (LX). The insert shows an enlarge-
ment of the area close to the origin.
3.1 Comparison of soil, passively sampled dripwater
and flowstone samples from different cave sites
concentrations in the older samples, except for the LX–DC
Comparing the LOP concentrations in soil, passively sam- cave (Fig. 3c). In all three samples types – soil, dripwater and
pled dripwater and flowstone samples as well as the distribu- flowstones – the relation between the different cave sites re-
tion of the C-, S- and V-group LOPs (Fig. 3), the concentra- garding the total LOP concentration, 68, is similar, with the
tions range from mg g−1 in the leaf litter and soil samples to highest LOP concentrations in samples from HC and NB and
ng g−1 in the flowstone samples. For the dripwater, the values lower concentrations in samples from WP and LX (Fig. 3e).
are given in nanograms per sample, where “sample” refers to In a scatterplot of S/V vs. C/V values of soil, dripwater
an XAD-cartridge that was deployed in the cave for passive and flowstone samples (Fig. 4), each sample type occupies a
sampling for about 1 year. The total LOP concentrations, 68, distinct region of the diagram, with the soil samples having
decrease strongly with soil depth in all caves (Fig. 3a). Large the lowest C/V values and low S/V values, the dripwater
variations are observed between the different drip sites within samples having medium C/V, and the highest S/V values
the same cave, especially in HC (Fig. 3b). The differences and the flowstone samples having the highest C/V and low
between the stratigraphically younger (1) and older (2) flow- to medium S/V values.
stone samples are less pronounced, with slightly higher LOP
https://doi.org/10.5194/bg-18-2289-2021 Biogeosciences, 18, 2289–2300, 20212296 I. Heidke et al.: Lignin oxidation products in soil, dripwater and speleothems The C/V and S/V ratios in the leaf litter samples are rep- probably caused by structural differences between the indi- resentative of the current vegetation cover (Fig. 5), with low vidual lignin monomers. Lignin high in sinapyl (S-group) C/V and high S/V ratios for HC and NB (angiosperm south- monomers contains mainly β-aryl ether [β-O-4] linkages, ern beech forest), low C/V and low S/V ratios for WP (gym- which can be chemically cleaved more easily, whereas lignin nosperm podocarp forest, apparently dominating the lignin with high proportions of guaiacyl (V-group) monomers con- input over the pasture), and comparatively higher C/V and tains higher amounts of phenylcoumaran [β-5], biphenyl [5- medium S/V ratios for LX (tussock grassland). This is in 5] and biphenyl ether [5-O-4] linkages, which are more re- line with the source specific ratios established by Hedges and sistant to chemical cleavage (Boerjan et al., 2003). As a re- Mann (1979). The S/V and C/V ratios of all sample types sult, lignin with a high contribution of S units is more eas- normalized to the respective ratios of Hodges Creek Cave ily degraded and also less branched because the [5-O-4] and (HC) are presented in Fig. 6a and b, respectively. This pre- [5-5] linkages represent branching points in the polymer. sentation shows that in all three sample types (soil, dripwa- The C-group phenols are mainly bound by peripheral ester ter and flowstone), HC and NB have the highest S/V and linkages linking lignin and cellulose and are often not part the lowest C/V ratios, while WP has the lowest S/V ra- of the lignin polymer itself (Kögel-Knabner, 2002; Boerjan tio, and DC has the highest C/V ratio. This means that al- et al., 2003). This part of the C-group phenols can be cleaved though the absolute ratios increase from soil to dripwater to from the lignin by mild base hydrolysis (Opsahl and Ben- speleothem and the magnitude of change varies among cave ner, 1995). Probably, hydrolysis of the ester-bound C-group sites, the relative ratios show the same trend in all sample LOPs also occurs in the soil and the epikarst aquifer above types. This in turn suggests that the LOP signature of the the cave. These hydrolyzed C-group phenols are more water overlying vegetation is at least partly preserved in dripwater soluble and may be transported to the cave more efficiently and speleothem samples, which is a precondition for using than the less soluble larger lignin particles and therefore can LOPs as a biomarker for past vegetation changes. Possible be enriched in cave dripwater and speleothems compared to causes for the different magnitude of change of the LOP ra- S- and V-group phenols. This could also explain the increase tios from soil to dripwater to flowstone among the different of the C/V ratios from the leaf litter (LL) to the O and cave sites can be differences in soil thickness, types of soil A horizons for all cave sites in our results (Fig. 5). The S/V and vegetation density, which can all influence transport and ratios, on the other hand, decrease from the leaf litter to the degradation of LOPs. O and A horizons, consistent with a higher degradation state As expected, the LOP concentrations decrease from the in deeper soils but are much higher in the dripwater and the soil to the cave. However, the C-, S- and V-group LOPs do flowstone samples than in the soil. A possible explanation not diminish at the same rate. The decrease is strongest for lies in the fact that the adsorption of lignin from the dripwa- the V group and weakest for the C group (Fig. 3f). This ap- ter to the XAD material and the subsequent elution as well as parent change in the lignin composition could be caused by the incorporation of lignin into the speleothem fabric present biotic factors, such as differential microbial degradation, or phase change processes as well, which can be selective and abiotic factors, such as the interaction with mineral surfaces. cause fractionation. Degradation studies of plant litter in litter bags or in situ in Our results suggest that the lignin fragments high in C- and the top 25 cm of the soil using CuO oxidation showed that the S-group lignins, which are more easily degraded, are prefer- concentrations of C- and S-group LOPs decreased faster than entially transported to deeper soils, probably due to their bet- the concentrations of V-group LOPs (Bahri et al., 2006; Op- ter water solubility. Thus, they are enriched in dripwater and sahl and Benner, 1995; Jex et al., 2014). However, the faster speleothems compared to the more stable V-group lignins, degradation of lignin high in S- and C-group LOPs does not which are possibly preferentially retained by sorption to min- necessarily mean that the released lignin fragments are com- eral surfaces. However, our results also show that the initial pletely mineralized. It is also possible that they are leached signals from the vegetation sources, i.e., the relative differ- to deeper soil layers, since the (partial) degradation leads to ences in 68, C/V and S/V between the different cave sites, a higher oxidation state, i.e., to more carboxylic acid func- are well preserved in the dripwater and flowstone samples tional groups, and thus to a better water solubility. Concern- despite these processes. ing the abiotic factors, Hernes et al. (2007) leached different plant litters in water and observed changes in the C/V ratio 3.2 Dripwater study from Waipuna Cave from −40 % to up to +400 % in the leachate compared to the parent litter. Subsequent sorption of the leachate to different Figure 7 shows the results of the active dripwater sampling mineral phases further increased the C/V ratio up to 7-fold at Waipuna Cave. The total LOP concentrations, 68, in compared to the leachate. For S/V, Hernes et al. (2007) ob- the filtered dripwater samples were very low, with a range served a 2-fold increase by the combined effects of leach- of 2–290 ng L−1 . In comparison, 68 in the dripwater from ing and sorption, and the acid / aldehyde ratios increased as the German Herbstlabyrinth cave system was in the range well by a factor of 2 or more. Both the differential micro- of 500–1800 ng L−1 in summer and 30–400 ng L−1 in win- bial degradation and the effects of leaching and sorption are ter (Heidke et al., 2019). The S-group analytes were below Biogeosciences, 18, 2289–2300, 2021 https://doi.org/10.5194/bg-18-2289-2021
I. Heidke et al.: Lignin oxidation products in soil, dripwater and speleothems                                                   2297

Figure 5. C/V and S/V values of the individual soil, dripwater and flowstone samples. The empty boxes show the mean values of the
individual samples.

Figure 6. Mean S/V ratios (a) and mean C/V ratios (b) of soil, dripwater and flowstone samples normalized to the respective mean S/V or
C/V ratios of HC.

https://doi.org/10.5194/bg-18-2289-2021                                                       Biogeosciences, 18, 2289–2300, 2021
2298                                            I. Heidke et al.: Lignin oxidation products in soil, dripwater and speleothems

                                                                      the samples were either not filtered before SPE extraction
                                                                      or 1.0 µm glass fiber filters were used, which possibly ac-
                                                                      counts for the large difference between the LOP results of
                                                                      filtered dripwaters from Waipuna and non-filtered dripwaters
                                                                      from the Herbstlabyrinth (Heidke et al., 2018, 2019). These
                                                                      findings should be systematically investigated in the future
                                                                      to better understand the transport processes of lignin into the
                                                                      cave system and to find a more suitable sampling method for
                                                                      lignin analysis in dripwater. For example, passive-sampling
                                                                      methods with adsorption resins or filters could be more ef-
                                                                      ficient and also easier to apply than whole-water sampling.
                                                                      The contribution to the speleothem record of lignin trans-
                                                                      ported by particles compared to lignin transported in solution
                                                                      and how they differ in composition are difficult to estimate on
                                                                      the basis of the current data. To control and reduce the num-
                                                                      ber of influencing parameters, we suggest using a combina-
                                                                      tion of cave-monitoring projects and artificial cave setups to
                                                                      study this question.
Figure 7. LOP concentrations of the filtered dripwater samples from
Waipuna Cave and of the particulate matter retained in the filters.
                                                                      4   Conclusions

the detection limit in all samples, and the C-group analytes          Our results demonstrate that, from the soil to the flowstone,
were below the detection limit in most samples. Therefore,            the C/V and S/V ratios both increase, while the total lignin
the C/V and S/V ratios could not be calculated. We sus-               content, 68, strongly decreases. Nevertheless, the relative
pect that the lignin was not dissolved homogeneously in               LOP signal from the overlying soil at the different cave sites
the water samples but instead adsorbed to particulate mat-            is preserved in the flowstone. This shows that the LOP signal
ter. In this case, the filtering of the samples would have af-        in speleothems can be used as a proxy for the lignin input in
fected the LOP concentrations. Therefore, we analyzed the             the overlying soil and therefore as a proxy for past vegetation
particulate matter retained in the syringe filters. The results       changes. However, for the interpretation of C/V and S/V ra-
are shown as the hatched bars in Fig. 7. The two samples              tios, it is important that only samples of the same type (e.g.,
that had a considerable particulate matter load, WP2-04 and           speleothem, dripwater or soil) are compared and only relative
WP2-07, showed the highest LOP concentrations of about                variations are examined, since the LOP signal is strongly in-
2200 ng per sample. WP2-11 and WP-stream had low LOP                  fluenced by transport and degradation processes. We suggest
concentrations of about 170 and 50 ng per sample, whereas             that a faster oxidative degradation of C- and S-group LOPs
the rest of the samples was close to or below the detection           in the soil compared to the more stable V-group LOPs makes
limit.                                                                them more soluble, which in turn leads to a more efficient
   The Waipuna LOP results thus suggest that lignin in drip-          transport of these LOPs from the soil to the cave, causing
water is at least partly transported by particles or colloids         higher C/V and S/V ratios in the speleothems. On the other
with dimensions >0.45 µm, which will be favored by flow               hand, LOPs can also adsorb to mineral particles and be trans-
along fractures rather than seepage flow (which can allow for         ported to the cave via particle transport, which may partially
the migration of low-molar-mass organic acids and nanopar-            override the aforementioned fractionation.
ticles; Hartland et al., 2011, 2012). Lignin is likely to be ad-         For the interpretation of paleo-vegetation records from
sorbed to mineral particles (Theng, 2012) and can also form           speleothems using LOPs, it is advisable to first analyze some
organic colloids by coiling with other organic substances             recently deposited speleothem samples and compare these
(humic matter). The adsorption and desorption of LOPs or              with samples from the overlying soil to “ground-truth” the
lignin to mineral surfaces is a continuous and repetitive pro-        LOP signals for the specific cave site. However, it is not clear
cess that depends on many parameters, as described in the             yet whether the relationship between the LOP signals in the
soil continuum model by Lehmann and Kleber (2015) and                 soil and those in the flowstones changes over time, for ex-
the regional chromatography model by Shen et al. (2015)               ample with changing soil thickness, and climatic conditions.
and observed for example in the leaching and sorption ex-             The transformation of LOP signals from the soil to the cave
periments by Hernes et al. (2007). Our results show that the          should be further investigated by expanding the sample set to
particles collected in the filters can be (at least partially)        a greater number of different cave sites with different vegeta-
desorbed and eluted with methanol. In previous studies of             tion, soil type and thickness and climatic conditions to iden-
lignin oxidation products in cave dripwater and speleothems,          tify and quantify different influences. In addition, the incor-

Biogeosciences, 18, 2289–2300, 2021                                                      https://doi.org/10.5194/bg-18-2289-2021
I. Heidke et al.: Lignin oxidation products in soil, dripwater and speleothems 2299
poration of lignin into the speleothem fabric could be studied ers from stalagmites, Org. Geochem., 37, 882–890,
using artificial cave setups (Hansen et al., 2017, 2019; Polag https://doi.org/10.1016/j.orggeochem.2006.05.003, 2006.
et al., 2010; Wiedner et al., 2008). Blyth, A. J., Asrat, A., Baker, A., Gulliver, P., Leng, M. J.,
and Genty, D.: A new approach to detecting vegetation
and land-use change using high-resolution lipid biomarker
Data availability. All relevant data are included in the paper and records in stalagmites, Quaternary Res., 68, 314–324,
the Supplement. https://doi.org/10.1016/j.yqres.2007.08.002, 2007.
Blyth, A. J., Baker, A., Collins, M. J., Penkman, K. E., Gilmour,
M. A., Moss, J. S., Genty, D., and Drysdale, R. N.: Molec-
ular organic matter in speleothems and its potential as an
Supplement. The supplement related to this article is available on-
environmental proxy, Quaternary Sci. Rev., 27, 905–921,
line at: https://doi.org/10.5194/bg-18-2289-2021-supplement.
https://doi.org/10.1016/j.quascirev.2008.02.002, 2008.
Blyth, A. J., Baker, A., Thomas, L. E., and van Calsteren, P.:
A 2000-year lipid biomarker record preserved in a stalagmite
Author contributions. Conception and design of the work were from north-west Scotland, J. Quaternary Sci., 26, 326–334,
done by IH, AH, DS and TH. Fieldwork and sample collection were https://doi.org/10.1002/jqs.1457, 2011.
done by AH, JH, AP and IH. Data collection, performing of the ex- Blyth, A. J., Hartland, A., and Baker, A.: Organic prox-
periments and drafting of the article were done by IH. Data analysis ies in speleothems – New developments, advantages
and interpretation, critical revision of the article, and final approval and limitations, Quaternary Sci. Rev., 149, 1–17,
of the version to be published were done by all authors. https://doi.org/10.1016/j.quascirev.2016.07.001, 2016.
Boerjan, W., Ralph, J., and Baucher, M.: Lignin
Biosynthesis, Ann. Rev. Plant Biol., 54, 519–546,
Competing interests. The authors declare that they do not have any https://doi.org/10.1146/annurev.arplant.54.031902.134938,
competing interests. 2003.
Bosle, J. M., Mischel, S. A., Schulze, A.-L., Scholz, D., and Hoff-
mann, T.: Quantification of low molecular weight fatty acids in
Acknowledgements. We thank Steve Newcombe for his help with cave drip water and speleothems using HPLC-ESI-IT/MS – de-
cutting the speleothem slabs and samples. velopment and validation of a selective method, Anal. Bioanal.
Chem., 406, 3167–3177, https://doi.org/10.1007/s00216-014-
7743-6, 2014.
Financial support. Denis Scholz received funding from the Bush, R. T. and McInerney, F. A.: Leaf wax n-alkane distribu-
German Research Foundation (grant nos. SCHO 1274/9-1 and tions in and across modern plants: Implications for paleoecology
SCHO 1274/11-1). This study received funding through a Marie and chemotaxonomy, Geochim. Cosmochim. Ac., 117, 161–179,
Skłodowska-Curie grant (agreement no. 691037) from the Euro- https://doi.org/10.1016/j.gca.2013.04.016, 2013.
pean Union’s Horizon 2020 Research and Innovation program, a Cheng, H., Lawrence Edwards, R., Shen, C.-C., Polyak, V. J., As-
Marsden Fund grant (no. UOW1403), and a Rutherford Discovery merom, Y., Woodhead, J., Hellstrom, J., Wang, Y., Kong, X.,
Fellowship (no. RDF-UOW1601) to Adam Hartland. Spötl, C., Wang, X., and Calvin Alexander, E.: Improvements
in 230 Th dating, 230 Th and 234 U half-life values, and U–Th
This open-access publication was funded by Johannes isotopic measurements by multi-collector inductively coupled
Gutenberg University Mainz. plasma mass spectrometry, Earth Planet. Sc. Lett., 371/372, 82–
91, https://doi.org/10.1016/j.epsl.2013.04.006, 2013.
Cheng, H., Edwards, R. L., Sinha, A., Spötl, C., Yi, L., Chen, S.,
Kelly, M., Kathayat, G., Wang, X., Li, X., Kong, X., Wang,
Review statement. This paper was edited by Ny Riavo G. Voar-
Y., Ning, Y., and Zhang, H.: The Asian monsoon over the past
intsoa and reviewed by Fernando Gazquez and one anonymous ref-
640,000 years and ice age terminations, Nature, 534, 640–646,
eree.
https://doi.org/10.1038/nature18591, 2016.
Drysdale, R. N., Paul, B. T., Hellstrom, J. C., Couchoud,
I., Greig, A., Bajo, P., Zanchetta, G., Isola, I., Spötl,
References C., Baneschi, I., Regattieri, E., and Woodhead, J. D.:
Precise microsampling of poorly laminated speleothems
Bahri, H., Dignac, M.-F., Rumpel, C., Rasse, D. P., Chenu, C., for U-series dating, Quat. Geochronol., 14, 38–47,
and Mariotti, A.: Lignin turnover kinetics in an agricultural https://doi.org/10.1016/j.quageo.2012.06.009, 2012.
soil is monomer specific, Soil Biol. Biochem., 38, 1977–1988, Fairchild, I. J. and Baker, A.: Speleothem Sci-
https://doi.org/10.1016/j.soilbio.2006.01.003, 2006. ence, John Wiley & Sons, Ltd., Chichester, UK,
Blyth, A. J. and Watson, J. S.: Thermochemolysis https://doi.org/10.1002/9781444361094, 2012.
of organic matter preserved in stalagmites: A pre- Fairchild, I. J., Smith, C. L., Baker, A., Fuller, L., Spötl, C., Mattey,
liminary study, Org. Geochem., 40, 1029–1031, D., McDermott, F., and E. I. M. F.: Modification and preserva-
https://doi.org/10.1016/j.orggeochem.2009.06.007, 2009. tion of environmental signals in speleothems, Earth-Sci. Rev., 75,
Blyth, A. J., Farrimond, P., and Jones, M.: An optimised 105–153, https://doi.org/10.1016/j.earscirev.2005.08.003, 2006.
method for the extraction and analysis of lipid biomark-
https://doi.org/10.5194/bg-18-2289-2021 Biogeosciences, 18, 2289–2300, 20212300 I. Heidke et al.: Lignin oxidation products in soil, dripwater and speleothems Hansen, M., Scholz, D., Froeschmann, M.-L., Schöne, B. R., and Biol. Biochem., 34, 139–162, https://doi.org/10.1016/S0038- Spötl, C.: Carbon isotope exchange between gaseous CO2 and 0717(01)00158-4, 2002. thin solution films: Artificial cave experiments and a complete Lehmann, J. and Kleber, M.: The contentious nature of soil organic diffusion-reaction model, Geochim. Cosmochim. Ac., 211, 28– matter, Nature, 528, 60–68, https://doi.org/10.1038/nature16069, 47, https://doi.org/10.1016/j.gca.2017.05.005, 2017. 2015. Hansen, M., Scholz, D., Schöne, B. R., and Spötl, C.: Sim- McDermott, F.: Palaeo-climate reconstruction from stable isotope ulating speleothem growth in the laboratory: Determination variations in speleothems: a review, Quaternary Sci. Rev., 23, of the stable isotope fractionation (δ 13 C and δ 18 O) be- 901–918, https://doi.org/10.1016/j.quascirev.2003.06.021, 2004. tween H2 O, DIC and CaCO3 , Chem. Geol., 509, 20–44, Nava-Fernandez, C., Hartland, A., Gázquez, F., Kwiecien, O., https://doi.org/10.1016/j.chemgeo.2018.12.012, 2019. Marwan, N., Fox, B., Hellstrom, J., Pearson, A., Ward, B., Hartland, A., Fairchild, I. J., Lead, J. R., Zhang, H., and Baalousha, French, A., Hodell, D. A., Immenhauser, A., and Breitenbach, M.: Size, speciation and lability of NOM–metal complexes in S. F. M.: Pacific climate reflected in Waipuna Cave drip wa- hyperalkaline cave dripwater, Geochim. Cosmochim. Ac., 75, ter hydrochemistry, Hydrol. Earth Syst. Sci., 24, 3361–3380, 7533–7551, https://doi.org/10.1016/j.gca.2011.09.030, 2011. https://doi.org/10.5194/hess-24-3361-2020, 2020. Hartland, A., Fairchild, I. J., Lead, J. R., Borsato, A., Opsahl, S. and Benner, R.: Early diagenesis of vascular plant Baker, A., Frisia, S., and Baalousha, M.: From soil to tissues: Lignin and cutin decomposition and biogeochemi- cave: Transport of trace metals by natural organic mat- cal implications, Geochim. Cosmochim. Ac., 59, 4889–4904, ter in karst dripwaters, Chem. Geol., 304/305, 68–82, https://doi.org/10.1016/0016-7037(95)00348-7, 1995. https://doi.org/10.1016/j.chemgeo.2012.01.032, 2012. Polag, D., Scholz, D., Mühlinghaus, C., Spötl, C., Schröder-Ritzrau, Hedges, J. I. and Mann, D. C.: The lignin geochemistry of ma- A., Segl, M., and Mangini, A.: Stable isotope fractionation in rine sediments from the southern Washington coast, Geochim. speleothems: Laboratory experiments, Chem. Geol., 279, 31–39, Cosmochim. Ac., 43, 1809–1818, https://doi.org/10.1016/0016- https://doi.org/10.1016/j.chemgeo.2010.09.016, 2010. 7037(79)90029-2, 1979. Scholz, D. and Hoffmann, D.: 230 Th / U-dating of fossil corals and Heidke, I., Scholz, D., and Hoffmann, T.: Quantification speleothems, Quaternary Sci. J., 57, 52–76, 2008. of lignin oxidation products as vegetation biomarkers in Shen, Y., Chapelle, F. H., Strom, E. W., and Benner, R.: Origins and speleothems and cave drip water, Biogeosciences, 15, 5831– bioavailability of dissolved organic matter in groundwater, Bio- 5845, https://doi.org/10.5194/bg-15-5831-2018, 2018. geochemistry, 122, 61–78, https://doi.org/10.1007/s10533-014- Heidke, I., Scholz, D., and Hoffmann, T.: Lignin oxidation products 0029-4, 2015. as a potential proxy for vegetation and environmental changes Standley, L. J. and Kaplan, L. A.: Isolation and analysis in speleothems and cave drip water – a first record from the of lignin-derived phenols in aquatic humic substances: im- Herbstlabyrinth, central Germany, Clim. Past, 15, 1025–1037, provements on the procedures, Org. Geochem., 28, 689–697, https://doi.org/10.5194/cp-15-1025-2019, 2019. https://doi.org/10.1016/S0146-6380(98)00041-2, 1998. Hellstrom, J.: Rapid and accurate U / Th dating using parallel ion- Theng, B.: Humic Substances, in: Developments in Clay Science, counting multi-collector ICP-MS, J. Anal. Atom.c Spectrom., 18, Vol. 4, Elsevier, 391–456, https://doi.org/10.1016/B978-0-444- 1346, https://doi.org/10.1039/b308781f, 2003. 53354-8.00012-8, 2012. Hellstrom, J.: U–Th dating of speleothems with high initial 230 Th Thevenot, M., Dignac, M.-F., and Rumpel, C.: Fate of lignins using stratigraphical constraint, Quat. Geochronol., 1, 289–295, in soils: A review, Soil Biol. Biochem., 42, 1200–1211, https://doi.org/10.1016/j.quageo.2007.01.004, 2006. https://doi.org/10.1016/j.soilbio.2010.03.017, 2010. Hernes, P. J. and Benner, R.: Transport and diagenesis of Vrana, B., Allan, I. J., Greenwood, R., Mills, G. A., Do- dissolved and particulate terrigenous organic matter in the miniak, E., Svensson, K., Knutsson, J., and Morrison, G.: North Pacific Ocean, Deep-Sea Res. Pt. I, 49, 2119–2132, Passive sampling techniques for monitoring pollutants in wa- https://doi.org/10.1016/S0967-0637(02)00128-0, 2002. ter, TrAC Trends in Analytical Chemistry, 24, 845–868, Hernes, P. J., Robinson, A. C., and Aufdenkampe, A. K.: Fraction- https://doi.org/10.1016/j.trac.2005.06.006, 2005. ation of lignin during leaching and sorption and implications Wiedner, E., Scholz, D., Mangini, A., Polag, D., Mühlinghaus, C., for organic matter “freshness”, Geophys. Res. Lett., 34, 1921, and Segl, M.: Investigation of the stable isotope fractionation in https://doi.org/10.1029/2007GL031017, 2007. speleothems with laboratory experiments, Quaternary Int., 187, Hernes, P. J., Kaiser, K., Dyda, R. Y., and Cerli, C.: Molecular trick- 15–24, https://doi.org/10.1016/j.quaint.2007.03.017, 2008. ery in soil organic matter: hidden lignin, Environ. Sci. Technol., Xie, S.: Lipid distribution in a subtropical southern China 47, 9077–9085, https://doi.org/10.1021/es401019n, 2013.9 stalagmite as a record of soil ecosystem response to Hewitt, A. E.: New Zealand soil classification, vol. no. 1 of Land- paleoclimate change, Quaternary Res., 60, 340–347, care Research science series, 1172-269X, Manaaki Whenua https://doi.org/10.1016/j.qres.2003.07.010, 2003. Press, Lincoln, New Zealand, 3rd Edn., 2010. Zhang, T., Li, X., Sun, S., Lan, H., Du, P., and Wang, Jex, C. N., Pate, G. H., Blyth, A. J., Spencer, R. G., Hernes, P. J., M.: Determination of lignin in marine sediment using alka- Khan, S. J., and Baker, A.: Lignin biogeochemistry: from modern line cupric oxide oxidation-solid phase extraction-on-column processes to Quaternary archives, Quaternary Sci. Rev., 87, 46– derivatization-gas chromatography, J. Ocean U. China, 12, 63– 59, https://doi.org/10.1016/j.quascirev.2013.12.028, 2014. 69, https://doi.org/10.1007/s11802-011-1936-z, 2013. Kögel-Knabner, I.: The macromolecular organic composition of plant and microbial residues as inputs to soil organic matter, Soil Biogeosciences, 18, 2289–2300, 2021 https://doi.org/10.5194/bg-18-2289-2021
You can also read