Multi pronged approach to human mesenchymal stromal cells senescence quantification with a focus on label free methods - Nature
←
→
Page content transcription
If your browser does not render page correctly, please read the page content below
www.nature.com/scientificreports
OPEN Multi‑pronged approach
to human mesenchymal stromal
cells senescence quantification
with a focus on label‑free methods
Weichao Zhai1, Jerome Tan1, Tobias Russell2, Sixun Chen1, Dennis McGonagle2,
May Win Naing1,3, Derrick Yong3* & Elena Jones2*
Human mesenchymal stromal cells (hMSCs) have demonstrated, in various preclinical settings,
consistent ability in promoting tissue healing and improving outcomes in animal disease models.
However, translation from the preclinical model into clinical practice has proven to be considerably
more difficult. One key challenge being the inability to perform in situ assessment of the hMSCs in
continuous culture, where the accumulation of the senescent cells impairs the culture’s viability,
differentiation potential and ultimately leads to reduced therapeutic efficacies. Histochemical β
-galactosidase staining is the current standard for measuring hMSC senescence, but this method
is destructive and not label-free. In this study, we have investigated alternatives in quantification
of hMSCs senescence, which included flow cytometry methods that are based on a combination
of cell size measurements and fluorescence detection of SA-β-galactosidase activity using the
fluorogenic substrate, C12FDG; and autofluorescence methods that measure fluorescence output
from endogenous fluorophores including lipopigments. For identification of senescent cells in the
hMSC batches produced, the non-destructive and label-free methods could be a better way forward
as they involve minimum manipulations of the cells of interest, increasing the final output of the
therapeutic-grade hMSC cultures. In this work, we have grown hMSC cultures over a period of 7
months and compared early and senescent hMSC passages using the advanced flow cytometry and
autofluorescence methods, which were benchmarked with the current standard in β-galactosidase
staining. Both the advanced methods demonstrated statistically significant values, (r = 0.76, p ≤ 0.001
for the fluorogenic C12FDG method, and r = 0.72, p ≤ 0.05 for the forward scatter method), and good
fold difference ranges (1.120–4.436 for total autofluorescence mean and 1.082–6.362 for lipopigment
autofluorescence mean) between early and senescent passage hMSCs. Our autofluroescence imaging
and spectra decomposition platform offers additional benefit in label-free characterisation of
senescent hMSC cells and could be further developed for adoption for future in situ cellular senescence
evaluation by the cell manufacturers.
Owing to human mesenchymal stromal cells’ (hMSCs) multipotent differentiation potential, trophic functions
and applications in cell and gene therapy1, they have attracted considerable research and clinical interests. In
2006, the International Society for Cellular Therapy (ISCT) proposed a set of minimal criteria to characterize
MSCs including cell surface marker expression (must express CD105, CD73 and CD90, and lack expression
of CD45, CD34, CD14 or CD11b, CD79α or CD19 and HLA-DR surface molecules), must be plastic-adherent
when maintained in standard culture conditions, and must be able to differentiate into osteoblasts, adipocytes
and chondroblasts in vitro2. Based on their high proliferative potential in vitro, hMSCs have been applied exten-
sively in cell-based therapy of graft-versus-host disease, liver failure and rejection after liver transplant, multiple
sclerosis and myocardial infarction3,4. However, variable outcomes of hMSCs transplantation were observed,
resulting from difficulties in controlling the fate of transplanted c ells5 to reduced therapeutic efficacy after trans-
plantation. Despite the cultures’ compliance to the ISCT definitions, these variable outcomes can be attributed by
the different hMSCs tissue sources used6,7, through the different expansion procedures and the use of different
1
Bioprocessing Technology Institute, A*STAR, 20 Biopolis Way, Centros 06‑01, Singapore. 2Leeds Institute of
Rheumatic and Musculoskeletal Medicine, Leeds, UK. 3Singapore Institute of Manufacturing Technology, A*STAR,
2 Fusionopolis Way, Innovis 08‑04, Singapore. *email: derrick‑yong@simtech.a‑star.edu.sg; E.Jones@leeds.ac.uk
Scientific Reports | (2021) 11:1054 | https://doi.org/10.1038/s41598-020-79831-9 1
Vol.:(0123456789)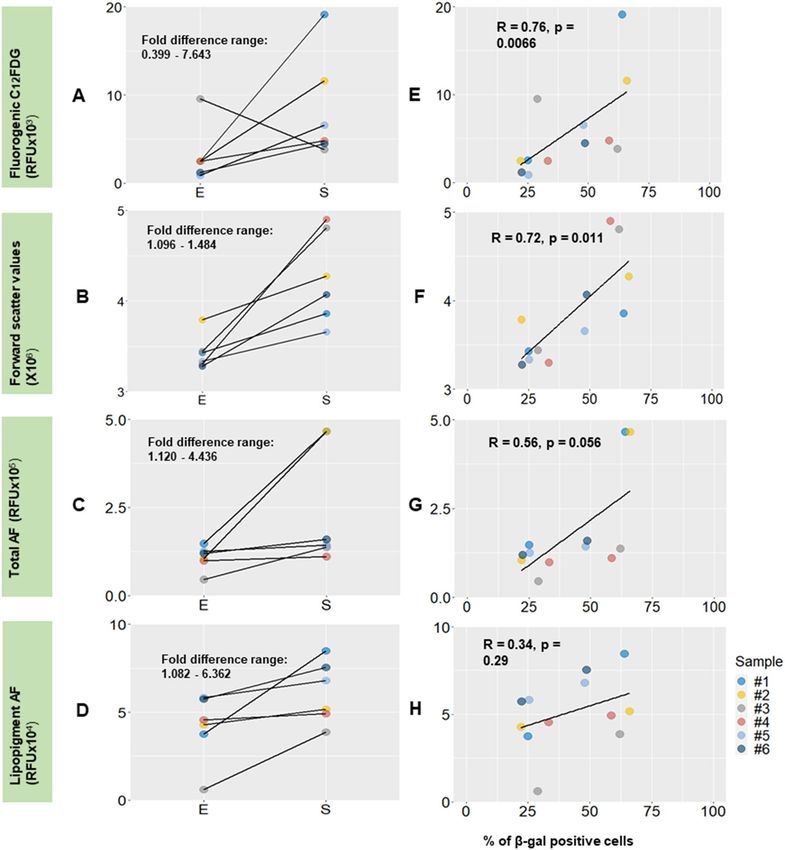
www.nature.com/scientificreports/
media. On top of these factors, replicative s enescence8 of hMSCs also significantly impact on the therapeutic
efficacy, but is not currently included in MSCs release criteria for their therapeutic use9. Therefore, assessing
hMSCs cultures for the presence of senescent cells remains critically important but is not routinely performed
in hMSCs manufacturing p rocesses10.
Numerous studies have documented that in hMSCs cultures, the amount of highly proliferative cells declines
as the passage number increases, resulting in late passages of large and almost non-proliferative senescent
hMSCs11–13. The study by Wagner et al. on serially passaged hMSCs revealed gradual changes in the global gene
and miRNA expression12. Their study concluded that these senescent-link changes in gene and protein expres-
sion were not only associated with senescent passages, but also observed at the start of in vitro expansion. Thus,
this accumulation of senescent cells from early passages suggests that identifying senescent cells in early hMSCs
cultures can be an important analytical step to ensure the best hMSCs product quality for cell-based therapy.
Though MSCs have been actively applied in industry clinical trials of allogeneic transplantations14, there is
still much to understand about MSCs aging and replicative senescence status to improve the long-term safety and
efficacy of MSCs engraftment. At the molecular level, retinoblastoma protein (Rb) or p53 pathways triggers the
cellular senescence p rocess15. Additionally, senescent cells typically exhibit senescence-associated β-galatosidase
(SA-β-gal) activities, acquire persistent DNA damage nuclear foci (PDDF) that contain DDR proteins ( γ H2AX
and 53BP1)16 and secrete growth factors, proteases and cytokines, which some of these biological features can
be explained by the senescence-associated secretory phenotype (SASP). The ISCT criteria released in 20062 is
the current standard for regulatory approvals on hMSCs, but factors such as cellular senescence are not included
in this standard criteria. Human MSCs attain replicative senescence, a feature likely to occur in industrial-scale
MSC expansions, that impair their ability to suppress inflammation and reduce their therapeutic efficacy. Other
clinical release criteria include microbiology testing and potency a ssessments10.
Among the various methods in characterising senescent hMSCs, the detection of senescence-associated β
-galactosidase (SA-β-gal) activity through staining at the optimal lysosomal p H17,18 is the most contemporary
standard. This method is closely associated with the accumulation of senescent cells, can be easily applied and
detected at near-neutral pH, and was tested as a useful biomarker for detection of senescence in culture and
even in vivo in rodents and p rimates19. The SA-β-gal serves as a positive control for other senescence charac-
terization methods being developed, and can be more conclusive in senescence characterization in combina-
tion with flow cytometry or automated image analysis m ethods20. The detection of higher SA-β-gal activity is
associated with an increase in lysosomal mass and accumulation of increased levels of GLB1 mRNA and protein
in senescent cells17,21. Cytochemical staining of SA-β-gal is one way to quantify the level of cell senescence as
the percentage of senescent cells can be determined through counting the number of blue stained cells in the
total population22. However, this method is time consuming and subjective. In contrast to this cytochemical
method, a fluorescence-based method (Fig. 1 bottom left) differentiates between senescent and non-senescent
cell populations more accurately based on incubation with C12FDG, a fluorogenic substrate for β-galactosidase,
as it becomes fluorescent after entering the cell and cleaved by the enzyme23. Furthermore, the flow cytometric
method provides cell size measurement of hMSCs through forward scatter (FSC)24 (Fig. 1 bottom right) and
potentially offers a high-throughput alternative to the cytochemical method to quantitatively evaluate hMSCs
senescence. This is linked to senescent cells generally displaying flattened and enlarged cell s ize1, which can be
measured on the FSC c hannel24.
In our previous work, a method based on acquiring and processing native signals from live cells using the
label-free technique of autofluorescence spectroscopy has been developed25. Autofluorescence methods have
found many applications in biomedical research and d iagnosis26. Its signal comes from a unique class of auto-
fluorescent bio-molecules native to c ells27, and these bio-molecules can be differentiated based on the specific
spectral distribution of their autofluorescence emissions. Of particular interest among these bio-molecules
are lipofuscin and lipofuscin-like p igments28, and their correlation with the state of senescence. Lipofuscin is
formed by lipids, metals and misfolded proteins, which is especially abundant in nerve cells, cardiac muscle
cells and s kin29. Lipofuscin-like pigments are distinguished from lipofuscins and are bipartite granules consist-
ing of an autofluorescent electron-dense pigment and electron-lucent lipid components30. Both lipofuscins and
lipofuscin-like pigment give similar autofluorescence properties and will be measured collectively and referred
to as lipopigments in our study. In contrast to the current standard in the detection of SA-β-gal activity, which
is either c ytochemical31 or fluorescence-based22, the autofluorescence spectroscopy method is non-destructive
and label-free. Furthermore, the amount of emission corresponds to the biomolecule quantities25, and in theory,
can be used to directly determine the extent of the cellular ageing process and senescent status. One challenge
of the previously reported autofluorescence method is that it is still challenging in acquiring autofluorescence
due to its weak i ntensities32.
Therefore, the aim of this work was to carry out MSCs senescence characterization through various methods
including flow cytometry methods such as cytochemical staining through C12FDG and forwards scatter, and
our recently developed label-free autofluorescence spectroscopy m ethod25 for measuring hMSCs senescence
(Fig 1 top). For this purpose, autofluorescence results were compared with the flow cytometer FSC and C12FDG
measurements, and later compared with the β-galactosidase staining results.
Results
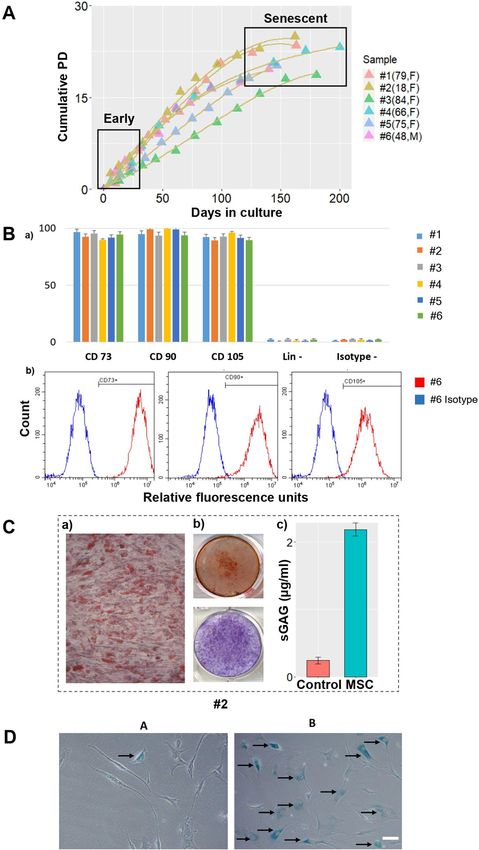
hMSCs characterisation. To prepare a hMSCs cell bank at different passages for hMSC senescence charac-
terisation, cells from six donors were cultured for 7 months. Then their cumulative population doublings (cPD)
averages for early passage cell (cPD = 6.13) and senescent passage cell (cPD = 20.6) were plotted against days
in culture (Fig. 2A). Early passage cells (E) were defined as having cPDs below six33 and senescent passage cells
(S) are defined as cell achieved less than 1 PD in 7 d ays34. It is interesting to note that hMSCs from the young-
Scientific Reports | (2021) 11:1054 | https://doi.org/10.1038/s41598-020-79831-9 2
Vol:.(1234567890)
www.nature.com/scientificreports/
Figure 1. Various methods used for automatic quantification of hMSCs senescence in this study. Top: New
autofluorescence method that employs cell lasing through endogenous fluorophores to collect autofluorescence
signals. Bottom left: fluorescence-based detection of β-galactosidase activities using fluorogenic substrate C12
FDG through enzymatic activation and flow cytometry analysis. Bottom right: flow cytometry forward scatter
(FSC) measurements for hMSCs cell size determination. All three flow cytometer and autofluorescence methods
in quantification of hMSCs senescence were benchmarked with the cytochemical β-galactosidase staining
method.
est donor (18,F) displayed the highest growth rate but the growth curve also coincided with that of the ageing
donor (79,F). Though the data displayed a general trend that the growth rate plateaued as hMSCs approached
senescence, no further inference could be made between the growth rate of hMSCs and donor age, or time to
senescence, based on the growth curves alone.
As clinical outcomes of hMSCs may vary due to the different sources of the hMSCs harvested, the different
expansion procedures and the usage of different media, standard characterisation of hMSCs at early passages is
performed to confirm the hMSCs nature of manufactured cells. The bone marrow derived hMSCs (BM-hMSCs)
used in our experiments were first characterised using ISCT recommended criteria and protocols detailed in the
method section and results are summarized in Fig. 2B. Consistent with the minimal criteria to define hMSCs2,
the cells collected and harvested through in vitro expansion expressed CD105, C73 and CD90, and lacked the
expression of CD45, CD34, CD14, CD19 and HLA-DR (indicated as lineage-negative, Lin-), and can be further
employed for hMSCs senescence studies.
Furthermore, in vitro expanded hMSCs (donor #2) demonstrated tri-lineage differentiation potential as
required by the ISCT c riteria2 (Fig. 2C). Oil Red O staining showed that hMSCs underwent adipogenesis to form
adipocytes with the generation of lipid vesicles (Fig. 2Ca). Alizarin red staining of hMSCs after osteogenesis
revealed the presence of calcium, and combined with alkaline phosphatase staining results, indicated a successful
osteogenesis process (Fig. 2Cb). Furthermore, hMSCs were capable of chondrogenesis with levels of sulphated
glycoaminoglycans (sGAGs) elevated as compared to hMSCs that were not cultured in a chondrogenic media
(Fig. 2Cc).
β-galactosidase staining was next performed on early and senescent passages for all six donor samples with
selected staining images shown in Fig. 2D. The senescent passage cells generally displayed a flattened and enlarged
morphology as compared to the spindle-like shape of the early passage cells (Fig. 2D). Percentage of β-galac-
tosidase positive stained cells were computed for both early and senescent passage cells, showing a fold differ-
ence range (1.757–3) and statistically significant p value (p ≤ 0.001) between E and S passages (Supplementary
Scientific Reports | (2021) 11:1054 | https://doi.org/10.1038/s41598-020-79831-9 3
Vol.:(0123456789)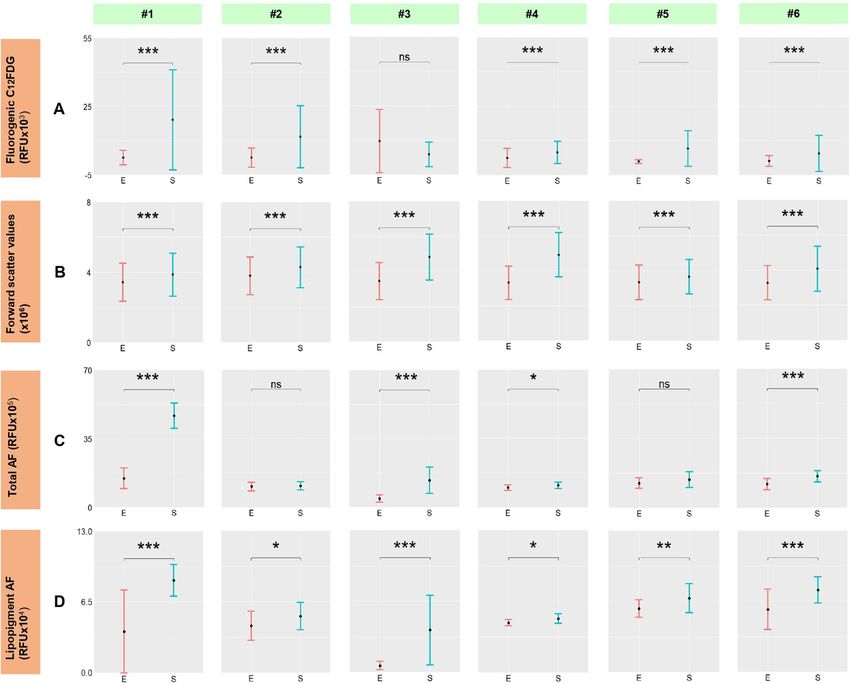
www.nature.com/scientificreports/

                                            Figure 2.  Characterisation of hMSCs used in this study. (A) Cumulative population doubling of the six selected donor samples
                                            (biological repeats n = 6) collected through in vitro expansion over a period of 7 months. Early passage cells are defined when
                                            their cumulative PD value is closest to six and senescent passage cells are defined as cells failed to double in 2 weeks’ time. (B): (a)
                                            Combined data on ISCT phenotypic characterization of all six donor MSC samples on CD73, CD90, CD105, Lin-: lineage negative,
                                            Isotype-: isotype control antibodies. Bars represent mean values and error bars represent standard deviations (SDs) (b) Representative
                                            histograms for donor #6 on CD73, CD90 and CD105 characterization. (C) Representative hMSCs differentiation results (donor #2)
                                            from left to right: (a) Oil Red O stained lipid vesicles after adipogenesis (b) Alizarin red staining demonstrating calcium deposition
                                            (middle upper) and alkaline phosphatase (middle lower) both indicating osteogenic differentiation (c) hMSCs chondrogenesis with
                                            sGAG levels higher than a control sample of hMSCs not cultured in chongrogenic media. (D) β-galactosidase staining images of early
                                            (A) and senescent passages (B) of a selected donor sample. At least 200 cells were measured and counted per β-galactosidase staining
                                            experiment. Arrows indicate β-galactosidase positive hMSCs. Scale bar indicates 50 µm.

          Scientific Reports |   (2021) 11:1054 |                    https://doi.org/10.1038/s41598-020-79831-9                                                                    4

Vol:.(1234567890)
www.nature.com/scientificreports/
Figure 3. Error bar plots showing comparisons between the early and senescent hMSCs passages for six donors
on (A) fluorescent-based β-galactosidase staining through C12FDG mean (B) forward scatter mean (C) total
autofluorescence mean (D) lipopigment autofluorescence mean. Error bar plots were produced based on at least
10 cells measured per sample (experimental repeats n = 10) and 100 cells involved per autofluorescence run, and
105 cells per flow cytometry measurement. Statistical analysis: one-tailed unequal variance t-test was performed
between early and senescent data. Pairs with significant differences are marked with ***(P ≤ 0.001), **(P ≤
0.01), *(P ≤ 0.05) and ns indicates no significance (P > 0.05).
materials Table 1). β- galactosidase results were further employed as the benchmark for evaluation of the flow
cytometer and autofluorescence methods in senescent hMSCs quantification.
Assessing early and senescent passage cells using autofluorescence and flow cytometry meth-
ods. The fluorescent-based β-galactosidase staining through the fluorogenic substrate C12FDG results dem-
onstrated statistical significance for five out of the six donor samples between early and senescent passage cells
as shown in Fig 3A. On top of analysing the lysosomal activities for senescent hMSCs characterisation, hMSC
cell size measurements were also employed for identifying senescence in c ulture35 based on the quantitative and
high throughput data acquisition power of the flow cytometer. The forward scatter measurements through flow
cytometry analysis displayed statistically significant results (p ≤ 0.001) across all six donor samples and dem-
onstrated high confidence in classification of early and senescent passage cells (Fig. 3B). Increases in senescent
MSC cell sizes were confirmed using cytospin preparations followed by measurements of individual cells’ areas
with a fold difference range (1.531–2.937) (Supplementary materials Table 2, Figures 1 and 2).
To evaluate the autofluorescence method in quantification of hMSCs senescence, the total autofluorescence
intensity (Fig. 3C) and the autofluorescence contribution from lipopigments (Fig. 3D) were compared across the
six donor samples between early and senescent passages, and one-tail unequal variance t-tests were performed.
Fluorescence output from lipopigments, showing varying degrees of statistical significance for all of the six donor
samples (Fig. 3D), demonstrated higher confidence in distinguishing between early and senescent cells than the
total autofluorescence intensity measurements.
Scientific Reports | (2021) 11:1054 | https://doi.org/10.1038/s41598-020-79831-9 5
Vol.:(0123456789)www.nature.com/scientificreports/
Figure 4. Fold difference (A–D) and correlation (E–H) plots of the various senescence quantification methods
of hMSCs benchmarking with the β-galactosidase staining method. (A) fluorescent-based β-galactosidase
staining through C12FDG mean (B) forward scatter mean (C) total autofluorescence mean (D) lipopigment
autofluorescence mean. E—early, S—senescent passages. Spearman’s correlation coefficient, a statistical measure
of the strength of a monotonic relationship between paired data, was employed to benchmark the various
autofluorescence and flow cytometry methods with β-galactosidase.
Comparing autofluorescence and flow cytometry results with β‑galactosidase staining
results. The fold difference plots (Fig. 4A) indicated that the C12FDG method generated the highest fold dif-
ference value from the range (0.399–7.463). The autofluorescence methods also output distinguishable fold dif-
ference ranges for total autofluorescence (1.120–4.436) and for autofluorescence contribution from lipopigment
(1.082–6.362) to differentiate between early and senescent passage cells. Furthermore, though autofluorescence
measurements do not provide as good fold difference range as by the C12FDG method, their results are more
consistent in predicting the direction of change from early to senescent passages (Fig. 4C,D) with no data show-
ing opposite trend as seen in C12FDG method (Fig. 4A).
To further evaluate the potential of flow cytometry and autofluorescence methods as new advanced methods
in senescent hMSCs characterisation, results graphically displayed in Fig. 3 were compared with the current
standard using β-galactosidase staining. The below analysis is required as a full growth of cells for several months
before characterisation is difficult to achieve by general cell manufacturers and in situ senescence evaluation
is thus needed. By benchmarking with β-galactosidase staining, we found that the flow cytometric C12FDG
Scientific Reports | (2021) 11:1054 | https://doi.org/10.1038/s41598-020-79831-9 6
Vol:.(1234567890)www.nature.com/scientificreports/
staining and forward scatter methods were significantly correlated with β-galactosidase (p < 0.05). The spearman
correlation value of the C12FDG and FSC flow cytometric methods also suggested that the results were biologi-
cally significant (R > 0.7) (Fig. 4E,F). Thus, the proportion of β-galactosidase positive, senescent hMSCs, can be
potentially predicted based on data presented above. The data points for the total autofluorescence and auto-
fluorescence from lipopigments quantification methods were more scattered giving lower r and non-significant
p values (Fig. 4G,H), which could be resulted by the lower number of cells analysed.
Discussion
Comparison of the advanced methods with the current standard in β‑galactosidase stain-
ing. To assess the autofluorescence method as non-destructive alternative to the current standard in the
detection of SA-β-gal activity through cytochemical staining, we compared the total autofluorescence mean
between early and senescence passage donor cells. The total autofluorescence output distinguished four out of six
donor cell samples and generated a fold difference range (1.120–4.436) between E and S passage cells (Fig. 4C),
suggesting good sensitivity in quantification of senescent hMSC. As expected, senescent hMSCs displayed well
defined morphological changes in our study, demonstrating flattened and enlarged morphology as shown in
our β-galactosidase staining images (Fig. 2D), due to an excess of actin fibers and cell debris1. Bertolo et al.
similarly reported a positive relationship between hMSC cell size and cellular autofluorescence36 resulted by an
increase in the fluorescent cellular organelles (i.e. mitochondria and lysosomes). These studies and correlations
explained our observation that senescent hMSCs displayed a higher total autofluorescence output (Fig. 3C). In
Bertolo’s study, the autofluorescence signal was collected using CytoFLEX flow cytometer with excitation laser
at 488 nm and detection optic at 525/50 nm r ange36. Based on our autofluorescence spectra, detection at 525/50
nm range corresponds to autofluorescence contribution from flavin adenine dinucleotide (FAD) and does not
encompass the full autofluorescence range for lipopigment, which ranges between 450 and 700 n m37. Thus, we
further decoupled and analysed the autofluorescence contribution from lipopigment and its association with
cellular senescence.
Results from the lipopigment autofluorescence between early and senescent passage cells demonstrated sig-
nificant differences between all six pairs of E and S passage cells, with a good fold difference range (1.082–6.362)
but it showed large variation between cultures. Lipopigment is the important indicator of cell senescence28,29,
and contributes to an increase level of autofluorescence in senescent h MSCs1. From previous cell studies, pro-
liferative cells dilute the deposits of the lipopigment during cell division29, showing low or no accumulation of
the pigment. Conversely, non-proliferative cells result in lipopigment accumulation in the lysosomes and cell
cytoplasm as lipopigment cannot be degraded due to its polymeric and highly cross-linked nature29. Thus, a
higher lipopigment autofluorescence intensity suggests the accumulation of the pigment, indicating the cells
reaching a non-proliferative stage and becoming senescent. In the recent studies reported by Feng et al.38, auto-
fluorescence intensity positively correlated with cell senescence in retinal pigment epithelial (RPE) cells that
demonstrated similar potential of the method in identification of cellular senescence. Overall, both the total
autofluoresence mean and lipopigment autofluorescence methods demonstrated promising potential in senescent
hMSCs characterisation.
The flow cytometry assisted detection of senescent hMSCs through C12FDG and FSC measurements are rapid,
high-throughput methods as compared to the cytochemical staining of β-galactosidase, which is labour intensive
and results are operator dependent. Out of the six donor samples analysed, the FSC results produced consist-
ent, statistically highly significant p values (p ≤ 0.001) between all early and senescent pairs (Fig. 3B), which the
consistency could be attributed by the large sample size per measurement (n > 105 ) as compared to 10 cells per
autofluorescence run. By benchmarking with β-galactosidase, the FSC method produced biologically significant
spearman correlation values (R > 0.7) and p values (p ≤ 0.05), demonstrating similar capability in senescent
cells characterisation as β-galactosidase. Flow cytometry forward scatter measurements allow discrimination of
cells by size as FSC intensity is proportional to the diameter of the cell, and resulted by light refraction within
the cell. Majore et al. had first employed FSC as a standardized cell size measurement tool to identify subpopula-
tion of MSC-like cultures from human umbilical c ord24. A recent report from Oja et al. had suggested that cell
area in correlation with cell size could be one of the most statistically significant parameters in representing the
morphological changes that associates with biochemical and gene expression markers of senescent c ells20. This
result was further validated by Bertolo et al. finding that senescent cells generally display flattened and enlarged
cell morphology as compared to the spindle-like form of the early passage cells36. These results correspond with
our observation that the high throughput FSC method produced statistically significant results in distinguishing
between early and senescent hMSCs, as well as with our cell size measurements using cytospins.
Though FSC method produced statistically highly significant p values in classification between early and
senescent passage cells, the fold difference range for FSC measurements (1.096–1.484) did not reflect a clear
distinction between the E and S pairs. Although Oja et al. reported that cell size could be one of the most sta-
tistically significant parameters revealing senescence induced morphological expansion of MSCs, cells were
chosen from selected passages and plated on 2D surface for imaging and analysis using Cell Omics Morphology
Explorer software20. This 2D measurement of cell size is in contrast to the FSC measurements carried out in our
study where cells were measured in suspension. In fact, results from our cytospin 2D measurements of cell areas
showed a fold difference range of (1.531–2.937) between E and S pairs (Supplementary materials Figure 2), close
to the fold difference range provided by forward scatter measurements, and comparable with the fold differences
measured by other methods.
Comparison across the advanced methods. Despite the fact that flow cytometry assisted C12FDG
method generated the highest spearman correlation and fold difference range (0.399–7.643) between early and
Scientific Reports | (2021) 11:1054 | https://doi.org/10.1038/s41598-020-79831-9 7
Vol.:(0123456789)www.nature.com/scientificreports/
senescent pairs, its results are highly sensitive to the assay and cell staining conditions. It is important to note
that previous fluorescent detection of SA-β-gal activities has been performed mostly on fibroblasts23,35, and thus
method optimization is required to ensure that the test is suitable for hMSCs senescence characterisation. In our
experimental design, both the C12FDG staining time and concentration were carefully tuned and hMSCs were
stained in monolayer conditions. Furthermore, a minimum of 105 cells were stained.
On top of being sensitive to assay conditions, the flow cytometry method presents several other limitations
such as complex experimental procedure and extended preparation time. The 1 h C12FDG incubation time is
considerably longer than the autofluorescence method where samples do not require prior incubation with
specific marker before the measurement but significant improvement from the β-galactosidase staining method
where samples need to be incubated overnight. Both the autofluorescence and β-galactosidase staining methods
require additional cell adherent step prior to measurement but only β-galactosidase method involves staining
and destructively labelling. The flow cytometry methods also destructively measure a minimum of 105 cells per
run in suspension as compared to none of the cells being labelled per autofluorescence run. From the perspective
of cell-based therapy, this substantial amount of stained cells is no longer fit for clinical or therapeutic purposes
after the flow cytometry analysis.
In contrast to the flow cytometry methods, the autofluorescence methods demonstrated considerable potential
in distinguishing between early and senescent passages. As discussed, similar results were also reported in litera-
ture, where fluorescence from lipopigment were employed and proven as feasible senescence indicators through
fluorescence microscopy29,38 . The fold difference range between early and senescent pairs produced by both the
total autofluorescence mean (1.120–4.436) and the lipopiment mean (1.082–6.362) were much higher than the
fold difference range produced by FSC measurements (Fig. 4B), but comparable to the fold difference range of
the C12FDG measurements (0.399–7.463). This suggests higher sensitivity of the label-free autofluorescence
methods in identification of senescent hMSCs and its potential as alternatives to the β-galactosidase method.
However, it is important also to note that the autofluroescence method has its limitation in the number of cells
measured owing to the limited number of viable cells after seeding into the silicon wells.
Additionally, as compared to the flow cytometer instrument required for experiment, the autofluorescence
method is more adoptable and economical. For the autofluorescence method, after the 24-h growth and attach-
ment of hMSCs in the medical grade silicon well, only a simple swap of the imaging solution is required before
individual autofluorescence measurements. Each autofluorescence run takes only 10 min to prepare and 2 s to
measure as compared to the 1-h preparation time required for the fluorescence based β-galactosidase method.
The spectrometer set-up does require routine calibration before a new set of experiments to ensure the maximum
intensity output is collected by the fluorescence microscope. The key benefit of this method is that cells were only
incubated in the imaging solution for a short period of time, and thus offers the possibility for the non-modified
cells to be recycled for other downstream quality control processes in cell-based therapy.
Indeed rapid and high throughput, the flow cytometry method however often requires labelling with spe-
cific biomarkers for acceptable classification accuracy. Furthermore, there exists fundamental trade-off between
throughput and accuracy in any measurement system39 as hydrodynamic focusing dilutes the cell suspension
and reduces the throughput rate in order to bring cells into the focus plan of an optical system. Overall, the flow
cytometry method is more suitable for large-scale cell analysis applications, where sacrificial cell samples can
be provided for characterisation purposes only. When a small number of donor cells are available for expansion
and characterisation, particularly for autologous a pplications40, the autofluorescence method would be better at
identifying individual senescent cells without destructive labelling, maximising the final output of therapeutic-
grade hMSC cultures. Overall, the spectra decomposition method offers rapid analysis of the autofluorescence
output from cells, which could be conveniently adopted and applied to label-free measurements at the scale of
hundreds of cells.
In our study, we recognise that the analysis was restricted to early and senescent passages on six donor sam-
ples. However, we used the same number of donors as were analysed in Oja et al. study20 and more stringent
criteria for defining early and senescence MSC passages based on accrued population doubling compared to
Bertolo et al. s tudy36. Also, the various methods of senescence characterization were primarily performed on
bone marrow MSCs owing to the fact that bone marrow derived hMSCs is one of the most common and longest
utilized type of M SCs41,42. Recent studies on the same subject similarly focused on bone marrow M SCs20,36, and
one study36 also assessed adipose-tissue derived stem cells (ADSCs), where similar findings to bone-marrow
MSCs were found. To further validate our autofluorescence platform as the label-free alternative for MSCs
characterization, MSCs from other tissue source should be further measured and evaluated based on the auto-
fluorescence method.
Despite the advantages mentioned for autofluorescence methods, we should not disregard the inherent vari-
ability of cells (donor to donor variations) while evaluating the effectiveness of the different methods in hMSCs
senescence characterization. In the future, autofluorescence methods should be compared to a broader range of
methods used for MSC senescence assessment including gene expression of senescent markers (i.e. p16INK4A and
CCND2)36 and qPCR-based method with single telomere length analysis (STELA)43. Furthermore, from litera-
ture, confluence and different media components are the factors to be considered to affect the autofluorescence
signals36. In our study, we made sure that the media composition was consistent across all samples and the start-
ing seeding concentration for autofluorescence samples remained the same; however, variability in the samples
being measured due to cellular heterogeneity may still exist and is donor r elated44. In addition, the heterogeneity
and auto-differentiation characteristic of MSC could have resulted in the differences in fold-changes (between
early-passage and senescent MSCs) observed for different cultures. Interestingly, no strong correlations were
found between autofluorescence measurements and adipo-, osteo- and chondrogenic differentiation of MSCs,
as well as donor age and telomere length, in a similar recent s tudy36 whereas the correlations with SASP proteins
were much stronger. Future work is needed to determine whether lipopigment measurements described in the
Scientific Reports | (2021) 11:1054 | https://doi.org/10.1038/s41598-020-79831-9 8
Vol:.(1234567890)www.nature.com/scientificreports/
present study would provide notable advantages over total autofluorescence in terms of the assessment of MSC
SASP phenotypes.
There is limited literature on using the lipopigment component to characterize MSCs senescence, and it
is the next step we will pursue for the development and refining of our autofluorescence method. Staining of
lipopigment45 is proposed as the next step to identify the sole autofluorescence contribution from lipopigment,
and we will compare with the results obtained from our current study on using spectra decomposition method
to analyse lipopigment autofluorescence.
Conclusion
In this work, we evaluated the potential of the flow cytometry and autofluorescence methods in senescent hMSCs
identification and benchmarked with the current standard in β-galactosidase staining. Autofluorescence was
studied in two ways, namely via the total autofluorescence output and specific autofluorescence stemming from
lipopigements. These label-free autofluorescence methods distinguished between early and senescent passage cells
based on higher autofluorescence output from the endogenous fluorophores of senescent cells. Flow cytometry
based forward scatter and fluorogenic substrate through C12FDG produced high throughput and accurate dif-
ferentiation between early and senescent hMSCs. However, there exist limitations in these methods owing to the
sensitivity of the flow cytometry method to assay conditions. In contrary, the autofluorescence alternative offers
rapid and consistent measurements of the fluorescence output from cell organelles with no prior incubation or
modification of cells required.
Though the autofluorescence method reported is not ready to be fully extended for on-line monitoring
applications, it is a more adoptable and economical way of rapid assessment of senescent cells through the dif-
ferent stages of the manufacturing process. The spectra decomposition tools developed in house could be further
extended to in situ live cell monitoring at a larger scale. Overall, our label-free semi-automated autofluorescence
cell characterisation method has the potential to offer a wider scope of applications in hMSCs quality assessment
and in monitoring of the cell therapy products during manufacturing.
Methods
hMSCs isolation and culturing. Sections of normal spinous process were collected from patients under-
going spinal surgery at Leeds General Infirmary for corrections of scoliosis or decompressions of the lumbar
or thoracic vertebrae. Samples obtained from 6 patients (biological repeats n = 6 median age 75) were assigned
sample numbers and bone fragments containing bone marrow. Unless otherwise stated, the reagents used were
from Sigma Aldrich. Digestion mix containing collagenase was prepared as previously d escribed46 were used
to initiate hMSc cultures and bone samples were vortexed and incubated in 37 °C water bath for 4 h to extract
hMSCs. The digestion mix containing extracted cells was poured through cell strainer into a fresh tube. The
bone sample was repeatedly washed by sterile PBS to extract the remaining cells and solution again poured
through strainer into the tube until PBS was clear after vortexing the sample. The solution containing cells was
centrifuged at 700 rcf for 10 min at room temperature. The cell pellet was re-suspended in 1× red blood cell lysis
buffer and incubated at room temperature for 5 min, centrifuged again at 700 rcf for 10 min and re-suspended
in 10 ml of DMEM for cell counting.
Cells were seeded into T75 flask at 4000 per cm 2 and serially passaged through in vitro expansion with
StemMACS media (Miltenyi Biotec) over 7 months. The seeding density of hMSCs for each expansion was at
least 105 cells per T75 flask with a harvest of approximately 10 6 cells after passaging. At least 3 × 10⁵ cells were
frozen per passage per donor sample with freezing media (45% StemMACS, 45% FBS—fetal bovine serum,
10% DMSO) and stored as cell bank for later autofluorescence analysis. All our samples are regularly tested for
mycoplasma (MycoAlert PLUS, Lonza) and any positive cultures are destroyed and not used in experiments.
Population doubling and cumulative population doubling of each passage per donor sample were calculated, as
previously described47, and the passage closest to a PD value of six was sent for MSC characterisation according
to ISCT guidelines2.
ISCT and isotype characterisation. Selected early and senescent passage cells were defrosted from fro-
zen vials in a water bath at 37 °C. The cells were counted to be of at least 105 cells per tube. The cell pellet was
re-suspended in 200 µl of blocking buffer (0.5% BSA—bovine serum albumin, 2% FBS in 1× PBS) and incu-
bated for 15 min at room temperature. FACS buffer (0.5% BSA, 0.05% Sodium Azide in 1× PBS) of 200 µl were
added to the suspension and the solution was split into tubes with 50 µl each. Antibodies against MSC positive
markers (Miltenyi Biotec): CD73-PE (Clone AD2), CD90-PerCP-Vio700 (Clone REA897), CD105-FITC (Clone
43A4E1) and negative markers (Viogreen): CD14 (Clone REA599), CD19 (Clone LT19), CD34 (Clone AC136),
CD45 (Clone REA747), HLA-DR (Clone REA805) were added and solutions were incubated for 15 min at 4 °C
in the dark. FACS buffer of 500 µl were added to each tube to wash off non-binding antibodies. Tubes of stained
and unstained cells were spun down at 400 rcf for 5 min, re-suspended in 500 µl FACS buffer and the data were
acquired by Attune Acoustic Focusing Flow Cytometer (Applied Biosystems). The FlowJo software (version
10.7) (http://www.flowjo.com/solutions/flowjo/downloads) was used for data analysis with debris excluded by
gates, and the percentage of cell expressing these surface markers were also recorded.
hMSCs differentiation studies. Minimally passaged (P ≤ 3) hMSCs (donor #2) were assessed for tri-
lineage potential in accordance with ISCT minimum criteria. Briefly, for adipogenesis 5 × 10⁵ cells/well were
seeded into 24-well plates and cultured for 3-weeks in a complete adipogenic media containing: DMEM (Life
Technologies), 10%FCS (Biosera), 10% horse serum (Stem Cell Technologies), 0.5 mM isobutylmethylxantine,
60 µM indomethacine (ICN) and 0.5 mM hydrocortisone. Wells had half media changes every 3 days. At day-21
Scientific Reports | (2021) 11:1054 | https://doi.org/10.1038/s41598-020-79831-9 9
Vol.:(0123456789)www.nature.com/scientificreports/
cells were fixed with 10%-formalin before lipid vesicles were stained using an Oil Red O solution for 10 min after
which wells were counter-stained with haematoxylin for 45 s. Samples were stored in PBS whilst imaged using
Olympus CKX41 light microscope and an Olympus C-7070 camera.
Chondrogenesis was conducted in Eppendorf tubes seeded with 2.5 × 10⁵ hMSCs, which were centrifuged
at 650 rcf for 5 min to pellet the cells and cultured in a chondrogenic media containing: high-glucose DMEM
(Life Technologies), 200 µM ascorbic-2-phosphate, 1mM sodium pyruvate, 40 µg/ml proline, 1 mg/ml bovine
serum albumin, 10 nM dexamethasone, 10 ng/ml TGFβ3 (R&D Systems) and 1% ITS+. Samples were cultured
for 3 weeks with half media change three times per week. On day 21 media was completely removed, and the
pellet washed carefully twice with PBS. 100 µL of 1mg/ml papain solution was added and allowed to incubate
overnight at 65 °C in the water bath as previously d escribed48. After which the contents were mixed well and
frozen at −20 °C until a glycosaminoglycan (GAG) was measured using Blyscan Glycosaminoglycan Assay
(Bicolor) was performed as per manufacturer’s instructions.
Osteogenesis was assessed using either alizarin red or alkaline phosphatase staining. 104 hMSCs were seeded
into 12-well plates and cultured for 3-weeks with bi-weekly half media changes. Samples were cultured in an
osteogenic media containing, DMEM (Life Technologies), 10% FCS (Biosera), 100 µM ascorbic-2-phosphate,
10 mM β-glycerophosphate and 100 nM dexamethasone.
Alkaline phosphatase staining was measured on the 14th day after initiation of osteogenesis, wells were fixed
using a citrate/acetone solution, following fixation Fast-Blue solution was used as per manufacturers’ instructions.
Alizarin red staining was assessed at day 21 after initiation of osteogenesis. Wells were fixed for 1 h in cold 70%
ethanol. A 40 mM alizarin red aqueous solution was used to stain the cultures for 10 min at room temperature
after which cultures were washed 3 times with distilled water. Both alkaline phosphatase and alizarin red stained
wells were imaged using an Olympus CKX41 light microscope with an Olympus C-7070 camera attached.
Cytochemical and flow cytometric detection of SA‑β‑galactosidase activities. To analyse the
lysosomal activities of hMSCs for senescence characterisation using the cytochemical staining method, senes-
cent cells histochemical staining kit was employed. Early and senescent passage cells were seeded in one well
of a six-well plate with a maximum seeding density of 105 cells per well to avoid confluence. After 24 h in a 37
°C incubator, growth medium was first aspirated from the early and senescent hMSCs. Cells were washed twice
with 1 ml of PBS (Life Technologies). Fixation buffer of 1.5 ml was added per well and the cells were incubated
for 6–7 min at room temperature. Cells were then rinsed 3 times with 1 ml of PBS. Staining mixture of 1 ml was
next added per well. The plate was sealed with parafilm and incubated at 37 °C without CO2 overnight. After
incubation, the staining mixture was replaced with 1 ml of PBS. The blue-stained cells and the total number of
cells were counted and the percentage of cells expressing β-galactosidase was calculated. At least 200 cells were
counted in each well after staining.
For the fluorescence-based detection of β-galactosidase activities, selected early and senescent passages of
at least 105 cells were seeded per well of a six-well plate and placed in an incubator at 37 °C with 5% CO2 for 24
h. 33 µM of C12 FDG (Thermo Fisher) working solution was added to the designated wells in the six-well plate
and incubated for 1 h. The working solution was then removed and the cell monolayer was washed twice with
1 ml PBS. The cells were harvested by trypsin followed by centrifuging at 600 rcf at 4 °C for 5 min. C12 FDG
fluorescence was acquired through FL1 channel on the Attune flow cytometer.
Autofluorescence microspectroscopy. A previously reported autofluorescence microspectroscopy
protocol for fibroblasts25 was adopted for hMSCs based on their similar adherent nature. Selected passages of
hMSCs were seeded at a concentration of at least 3.0 × 10⁴ cells/ml on glass coverslips (Schott) within square
silicone wells fabricated from medical grade silicone (Wacker Chemie AG). These coverslips with cells in 1 ml of
StemMACS media (Miltenyi Biotec) were then incubated in a CO2 incubator for 24 h before autofluorescence
microspectroscopy. Prior to measurements, the culture media was extracted and the remaining contents in the
wells were washed twice with 1 ml of PBS. After washing, any excess PBS was remove and 100 µl of imaging
solution (Thermo Fisher Scientific) was added. Five phase contrast images were obtained per coverslip at ran-
dom locations through a 4× objective. Autofluorescence images and spectra were then taken through a 60×
oil-immersion super apochromat objective (Olympus). At least 100 cells per early and senescent passage per
donor were involved in each autofluorescence run. Autofluorescence output of at least 10 cells were recorded
with measurements made at different locations within the silicon well (experimental repeats n = 10). This was
followed by five background spectral measurements of a 100 µl volume of imaging solution placed on a clean
region of the same coverslip.
Autofluorescence spectral decomposition and data analysis. Autofluorescence spectra were simi-
larly processed based on the previously reported m ethod25. This was achieved via a MATLAB-based (version
9.5.0.94444 R2018b) (http://www.mathworks.com/products/compiler/matlab-runtime.html) software devel-
oped in-house that performed signal processing, background correction and spectral decomposition. Spectral
decomposition involved a linear unmixing of the autofluorescence spectra into its constituent components. Each
spectral component corresponded to a specific autofluorescent biochemical found natively in cells. In this study,
four spectral components were used in the decomposition, namely nicotinamide adenine dinucleotide in both
bound (NADHbound ) and free (NADH free ) forms, FAD and lipopigments26. Firstly, the software was trained to
recognize the first three components’ emissions using reference solutions. NADH free was prepared by dissolving
NADH in Tris buffer at pH 8.0 (BUF-1414-500ml-pH8.0, 1st Base, Singapore); NADHbound was prepared by
mixing NADH free solutions with l-lactate dehydrogenase dissolved in the same Tris buffer; FAD in PBS without
Ca2+ and Mg2+. Spectral fitting parameters for these components were compiled into library files. Subsequently,
Scientific Reports | (2021) 11:1054 | https://doi.org/10.1038/s41598-020-79831-9 10
Vol:.(1234567890)www.nature.com/scientificreports/
autofluorescence spectra for commercial senescent cells (ATCC, PCS-500-012) were processed with these three
components and a fourth component that comprised estimations for lipopigments was generated. This thus
trained the software to recognize lipopigments, and its spectral fitting parameters were similarly added to the
library files. The compiled library files were then applied in the spectral decomposition of autofluorescence
spectra from test hMSCs. For donor cell samples autofluorescence signal processing, the library obtained from
commercial cell software training was applied with lipopigment identified as one of the four expected fluoro-
phores. Both the fluorescent and background data were inputed for each early and senescent passage hMSCs
per donor, and the wavelength range was set between 400 and 850 nm to encompass the full wavelength range
uorophores26. After signal processing, the decomposed autofluorescence spectra, the identified
of the selected fl
peak values for the fluorophores and the sum of intensities under each peak per measurement were stored and
tabulated.
Autofluorescence mean and autofluorescecne contribution from lipopigment mean were then computed for
statistical analysis. The unequal variance t-test which assumes that both groups of data are sampled from Gaussian
populations, but does not assume those two populations have the same standard deviation, was employed to help
to quantify the deviation between the means of the two measured parameters. Statistical analyses for the autofluo-
rescence measurements were conducted using R (version 4.0.2) (cran.r-project.org/bin/windows/base/)49 with
standard deviations computed through ggerrorplot50 and the standard deviations for the flow cytometry read-
ings computed by the FlowJo software. Figures were produced using R studio packages g gplot251 and ggpubr50.
Ethics declarations
The study conducted is in accordance with the guidelines approved by North West-Greater Manchester West
Research Ethics Committee (REC: 16/NW/0797) and Agency for Science, Technology and Research Institu-
tional Review Board (IRB Reference: 2018-001). Patients gave written informed consent in accordance with the
declaration of Helsinki.
Data availability
The datasets analysed during the current study are available from the corresponding author on reasonable request.
Received: 31 August 2020; Accepted: 7 December 2020
References
1. Li, Y. et al. Senescence of mesenchymal stem cells. Int. J. Mol. Med. 39, 775–782. https://doi.org/10.3892/ijmm.2017.2912 (2017).
2. Dominici, M. et al. Minimal criteria for defining multipotent mesenchymal stromal cells. The international society for cellular
therapy position statement. Cytotherapy 8, 315–317. https://doi.org/10.1080/14653240600855905 (2006).
3. Mundra, V., Gerling, I. C. & Mahato, R. I. Mesenchymal stem cell-based therapy. Mol. Pharm. 10, 77–89. https://doi.org/10.1021/
mp3005148 (2012).
4. Patel, D. M., Shah, J. & Srivastava, A. S. Therapeutic potential of mesenchymal stem cells in regenerative medicine. Stem Cells Int.
https://doi.org/10.1155/2013/496218 (2013).
5. Dazzi, F. & Trento, C. Mesenchymal stem cells and innate tolerance: Biology and clinical applications. Swiss. Med. Wkly. 140,
w13121. https://doi.org/10.4414/smw.2010.13121 (2010).
6. Musina, R., Bekchanova, E. & Sukhikh, G. Comparison of mesenchymal stem cells obtained from different human tissues. Bull.
Exp. Biol. Med. 139, 504–509. https://doi.org/10.1007/s10517-005-0331-1 (2005).
7. Paniushin, O., Domaratskaia, E. & Starostin, V. Mesenchymal stem cells: Sources, phenotype, and differentiation potential. Izvestiia
Akademii nauk. Seriia biologicheskaia https://doi.org/10.1134/S106235900601002X (2006).
8. Hayflick, L. The cell biology of human aging. N. Engl. J. Med. 295, 1302–08. https: //doi.org/10.1111/1523-1747.ep1253 2752 (1976).
9. Galipeau, J. & Sensebe, L. Mesenchymal stromal cells: Clinical challenges and therapeutic opportunities. Cell Stem Cell 22, 824–33.
https://doi.org/10.1016/j.stem.2018.05.004 (2018).
10. Lechanteur, C. et al. Clinical-scale expansion of mesenchymal stromal cells: A large banking experience. J. Transl. Med. 14, 145.
https://doi.org/10.1186/s12967-016-0892-y (2016).
11. Schellenberg, A. et al. Population dynamics of mesenchymal stromal cells during culture expansion. Cytotherapy 14, 401–411.
https://doi.org/10.3109/14653249.2011.640669 (2012).
12. Wagner, W. et al. Replicative senescence of mesenchymal stem cells: A continuous and organized process. PLoS ONE 3, e2213.
https://doi.org/10.1371/journal.pone.0002213 (2008).
13. Liu, J., Ding, Y., Liu, Z. & Liang, X. Senescence in mesenchymal stem cells: Functional alterations, molecular mechanisms, and
rejuvenation strategies. Front. Cell Dev. Biol. https://doi.org/10.3389/fcell.2020.00258 (2020).
14. Wang, Q. et al. Armms as a versatile platform for intracellular delivery of macromolecules. Nat. Commun. https: //doi.org/10.1038/
s41467-018-03390-x (2018).
15. Turinetto, V., Vitale, E. & Giachino, C. Senescence in human mesenchymal stem cells: Functional changes and implications in
stem cell-based therapy. Int. J. Mol. Sci. 17, 34. https://doi.org/10.3390/ijms17071164 (2016).
16. Hladik, D. et al. Long-term culture of mesenchymal stem cells impairs ATM-dependent recognition of DNA breaks and increases
genetic instability. Stem Cell Res. Ther. https://doi.org/10.1186/s13287-019-1334-6 (2019).
17. Kurz, D. J., Decary, S., Hong, Y. & Erusalimsky, J. D. Senescence-associated (beta)-galactosidase reflects an increase in lysosomal
mass during replicative ageing of human endothelial cells. J. Cell Sci. 113, 3613–3622 (2000).
18. Ohto, U. et al. Crystal structure of human β-galactosidase structural basis of GM1 gangliosidosis and morquio B diseases. J. Biol.
Chem. 287, 1801–1812. https://doi.org/10.1074/jbc.M111.293795 (2012).
19. Itahana, K., Campisi, J. & Dimri, G. Mechanisms of cellular senescence in human and mouse cells. Biogerontology 5, 1–10. https
://doi.org/10.1023/B:BGEN.0000017682.96395.10 (2004).
20. Oja, S., Komulainen, P., Penttilä, A., Nystedt, J. & Korhonen, M. Automated image analysis detects aging in clinical-grade mesen-
chymal stromal cell cultures. Stem Cell Res. Ther. 9, 6. https://doi.org/10.1186/s13287-017-0740-x (2018).
21. Lee, B. Y. et al. Senescence-associated β-galactosidase is lysosomal β-galactosidase. Aging Cell 5, 187–195. https://doi.org/10.111
1/j.1474-9726.2006.00199.x (2006).
Scientific Reports | (2021) 11:1054 | https://doi.org/10.1038/s41598-020-79831-9 11
Vol.:(0123456789)www.nature.com/scientificreports/
22. Debacq-Chainiaux, F., Erusalimsky, J. D., Campisi, J. & Toussaint, O. Protocols to detect senescence-associated beta-galactosidase
(sa-βgal) activity, a biomarker of senescent cells in culture and in vivo. Nat. Protocols 4, 1798. https: //doi.org/10.1038/nprot. 2009.191
(2009).
23. Noppe, G. et al. Rapid flow cytometric method for measuring senescence associated β-galactosidase activity in human fibroblasts.
Cytom. Part A J. Int. Soc. Adv. Cytom. 75, 910–916. https://doi.org/10.1002/cyto.a.20796 (2009).
24. Majore, I., Moretti, P., Hass, R. & Kasper, C. Identification of subpopulations in mesenchymal stem cell-like cultures from human
umbilical cord. Cell Commun. Signal https://doi.org/10.1186/1478-811X-7-6 (2009).
25. Yong, D. et al. Autofluorescence spectroscopy in redox monitoring across cell confluencies. PLOS ONE 14, e0226757. https://doi.
org/10.1371/journal.pone.0226757 (2019).
26. Croce, A. & Bottiroli, G. Autofluorescence spectroscopy and imaging: A tool for biomedical research and diagnosis. Eur. J. Histo-
chem. https://doi.org/10.4081/ejh.2014.2461 (2014).
27. Ghukasyan, V. & Heikal, A. Natural Biomarkers for Cellular Metabolism: Biology, Techniques, and Applications (CRC Press, Boca
Raton, 2014).
28. Guardo, G. D. Lipofuscin, lipofuscin-like pigments and autofluorescence. Eur. J. Histochem. 59, 2485. https://doi.org/10.4081/
ejh.2015.2485 (2015).
29. Moreno-Garcia, A., Kun, A., Calero, O., Medina, M. & Calero, M. An overview of the role of lipofuscin in age-related neurode-
generation. Front. Neurosci. https://doi.org/10.3389/fnins.2018.00464 (2018).
30. Wisniewski, H., Wen, G., Opitz, J., Reynolds, J. & Pullarkat, R. Lipopigment in the Aging Brain. Vol. 31, 183–191. https://doi.
org/10.1002/ajmg.1320310621 (1988).
31. Severino, J., Allen, R., Balin, S., Balin, A. & Cristofalo, V. J. Is β-galactosidase staining a marker of senescence in vitro and in vivo?.
Exp. Cell Res. 257, 162–171 (2000). https://doi.org/10.18632/oncotarget.12752.
32. Schaefer, P., Kalinina, S., Rueck, A., Arinim, C. & Einem, B. Nadh autofluorescence—A marker on its way to boost bioenergetic
research. Cytom. Part A 95, 34. https://doi.org/10.1002/cyto.a.23597 (2018).
33. Ferreira, M. et al. Comprehensive characterization of chorionic villi-derived mesenchymal stromal cells from human placenta.
Stem Cell Res. Ther. 9, 25. https://doi.org/10.1186/s13287-017-0757-1 (2018).
34. Churchman, S. M., Boxall, S. A., McGonagle, D. & Jones, E. A. Predicting the remaining lifespan and cultivation-related loss of
osteogenic capacity of bone marrow multipotential stromal cells applicable across a broad donor age range. Stem Cells Int. 2017,
34. https://doi.org/10.1155/2017/6129596 (2017).
35. Biran, A. et al. Quantitative identification of senescent cells in aging and disease. Aging Cell 16, 661–671. https://doi.org/10.1111/
acel.12592(2017).
36. Bertolo, A., Baur, M., Guerrero, J., Potzel, T. & Stoyanov, J. Autofluorescence is a reliable in vitro marker of cellular senescence in
human mesenchymal stromal cells. Sci. Rep. 9, 2074. https://doi.org/10.1038/s41598-019-38546-2 (2019).
37. Monici, M. Cell and tissue autofluorescence research and diagnostic application. Biotechnol. Ann. Rev. 11, 227–56. https://doi.
org/10.1016/S1387-2656(05)11007-2 (2005).
38. Feng, L. Detecting a-beta deposition and RPE cell senescence in the retinas of SAMP8 mice. Discov. Med. 21, 149–158 (2016).
39. Mahjoubfar, A., Goda, K., Betts, G. & Jalali, B. Optically amplified detection for biomedical sensing and imaging. J. Opt. Soc. Am.
A 30, 2124–32. https://doi.org/10.1364/JOSAA.30.002124 (2013).
40. Eaker, S. et al. Concise review: Guidance in developing commercializable autologous/patient-specific cell therapy manufacturing.
Stem Cells Transl. Med. 2, 871–883. https://doi.org/10.5966/sctm.2013-0050 (2013).
41. Haynesworth, S., Goshima, J., Goldberg, V. & Caplan, A. Characterization of cells with osteogenic potential from human marrow.
Bone 13, 81–88. https://doi.org/10.1016/8756-3282(92)90364-3 (1992).
42. Pittenger, M. F. et al. Multilineage potential of adult human mesenchymal stem cells. Science 284, 143–147 (1999).
43. Baird, D. M., Rowson, J., Wynford-Thomas, D. & Kipling, D. Extensive allelic variation and ultrashort telomeres in senescent
human cells. Nat. Genet. 33, 203 (2003).
44. Trivedi, A., Miyazawa, B., Gibb, S., Valanosky, K. & Vivona, L. Bone marrow donor selection and characterization of MSCs is
critical for pre-clinical and clinical cell dose production. J. Transl. Med. 17, 24. https://doi.org/10.1186/s12967-019-1877-4 (2019).
45. Georgakopoulou, E. A. et al. Specific lipofuscin staining as a novel biomarker to detect replicative and stress-induced senescence.
A method applicable in cryo-preserved and archival tissues. Aging 5, 37 (2013). https://doi.org/10.18632/aging.100527.
46. Campbell, T. et al. Mesenchymal stem cell alterations in bone marrow lesions in patients with hip osteoarthritis. Arthritis Rheu-
matol. 68, 1648–1659. https://doi.org/10.1002/art.39622 (2016).
47. Churchman, S. et al. Transcriptional profile of native cd271+ multipotential stromal cells: Evidence for multiple fates, with promi-
nent osteogenic and Wnt pathway signaling activity. Arthritis Rheum. 64, 2632–43. https://doi.org/10.1002/art.34434 (2012).
48. Jones, E. et al. Synovial fluid mesenchymal stem cells in health and early osteoarthritis: Detection and functional evaluation at the
single-cell level. Arthritis Rheum. 58, 1731–40. https://doi.org/10.1002/art.23485 (2008).
49. RStudio Team. RStudio: Integrated Development Environment for R (RStudio, PBC., Boston, 2020).
50. Kassambara, A. ggplot2: Based Publication Ready Plots (HalioDx, Marseille, 2020).
51. Wickham, H. ggplot2: Elegant Graphics for Data Analysis (Springer, New York, 2016).
Acknowledgements
We thank the Leeds team for hMSCs donor samples collection, and Dr. Rich Curthbert, Dr. Clara Sanjurjo-
Rodriguez and Dr. William Jones on the trainings provided. We would also like to thank our undergraduate
and pre-university students—Chan Zhi Xian, Tong Xintong, Tan Lip Guo, Wee Juin Shin—for their assistance
in this work.
Author contributions
Conceptualization: D.Y., W.Z., E.J.; Data acquisition: W.Z., D.Y., T.R., E.J.; Data analysis: W.Z., D.Y., J.T., T.R.,
E.J.; Data interpretation: W.Z., D.Y., J.T., T.R., E.J.; Manuscript review for important intellectual content: W.Z.,
D.Y., J.T., S.C., T.R., E.J.; Funding: M.W.N, D.M., E.J. All authors have read and agreed to the published version
of the manuscript.
Competing interests
The authors declare no competing interests.
Additional information
Supplementary Information The online version contains supplementary material available at https://doi.
org/10.1038/s41598-020-79831-9.
Scientific Reports | (2021) 11:1054 | https://doi.org/10.1038/s41598-020-79831-9 12
Vol:.(1234567890)You can also read