An optimised protocol Harnessing Laser capture Microdissection for transcriptomic Analysis on Matched primary and Metastatic colorectal tumours ...
←
→
Page content transcription
If your browser does not render page correctly, please read the page content below
www.nature.com/scientificreports

            OPEN           An Optimised Protocol Harnessing
                           Laser Capture Microdissection
                           for Transcriptomic Analysis on
                           Matched Primary and Metastatic
                           Colorectal Tumours
                           Chin-Ann J. Ong 1,5, Qiu Xuan Tan 1,5, Hui Jun Lim1,5, Nicholas B. Shannon1,
                           Weng Khong Lim 2, Josephine Hendrikson1, Wai Har Ng1, Joey W. S. Tan1, Kelvin K. N. Koh1,
                           Seettha D. Wasudevan1, Cedric C. Y. Ng 3, Vikneswari Rajasegaran3, Tony Kiat Hon Lim4,
                           Choon Kiat Ong 3, Oi Lian Kon3, Bin Tean Teh 3, Grace H. C. Tan1, Claramae Shulyn Chia1,
                           Khee Chee Soo1 & Melissa C. C. Teo1*
                           Generation of large amounts of genomic data is now feasible and cost-effective with improvements in
                           next generation sequencing (NGS) technology. Ribonucleic acid sequencing (RNA-Seq) is becoming
                           the preferred method for comprehensively characterising global transcriptome activity. Unique to
                           cytoreductive surgery (CRS), multiple spatially discrete tumour specimens could be systematically
                           harvested for genomic analysis. To facilitate such downstream analyses, laser capture microdissection
                           (LCM) could be utilized to obtain pure cell populations. The aim of this protocol study was to develop a
                           methodology to obtain high-quality expression data from matched primary tumours and metastases
                           by utilizing LCM to isolate pure cellular populations. We demonstrate an optimized LCM protocol
                           which reproducibly delivered intact RNA used for RNA sequencing and quantitative polymerase chain
                           reaction (qPCR). After pathologic annotation of normal epithelial, tumour and stromal components,
                           LCM coupled with cDNA library generation provided for successful RNA sequencing. To illustrate our
                           framework’s potential to identify targets that would otherwise be missed with conventional bulk
                           tumour sequencing, we performed qPCR and immunohistochemical technical validation to show that
                           the genes identified were truly expressed only in certain sub-components. This study suggests that
                           the combination of matched tissue specimens with tissue microdissection and NGS provides a viable
                           platform to unmask hidden biomarkers and provides insight into tumour biology at a higher resolution.

                           High-throughput next-generation sequencing (NGS) is a powerful strategy to study cancer progression at the
                           molecular level, where ribonucleic acid sequencing (RNA-Seq) is becoming the preferred method for compre-
                           hensively characterising global transcriptome activity1. By comparing the transcriptomes, differential expression
                           of genes in discrete cell populations can be easily identified. This approach has emerged as a useful tool for char-
                           acterising the transcriptomes and molecular signatures of tissues-of-interest via RNA or protein profiling, which
                           may reflect their functionality2. In recent years, large genomic consortiums such as The Cancer Genome Atlas
                           (TCGA) and The International Cancer Genome Consortium (ICGC) have been established1. With these publi-
                           cally available large-scale integrated data, much effort have been placed into identifying putative prognostic bio-
                           markers using NGS, however, few have made it to clinical practice3. A plausible reason for this could be due to the

                           1
                            Department of Sarcoma, Peritoneal and Rare Tumours (SPRinT), Division of Surgery and Surgical Oncology,
                           National Cancer Centre Singapore, 11 Hospital Drive, Singapore, S169610, Singapore. 2Cancer and Stem Cell Biology,
                           Duke-NUS Medical School, 8 College Road, Singapore, 169857, Singapore. 3Division of Medical Sciences, National
                           Cancer Centre Singapore, 11 Hospital Drive, Singapore, S169610, Singapore. 4Department of Anatomical Pathology,
                           Singapore General Hospital, 20 College Road, Singapore, S169856, Singapore. 5These authors contributed equally:
                           Chin-Ann J. Ong, Qiu Xuan Tan and Hui Jun Lim. *email: melissa.teo.c.c@singhealth.com.sg

Scientific Reports |   (2020) 10:682 | https://doi.org/10.1038/s41598-019-55146-2                                                            1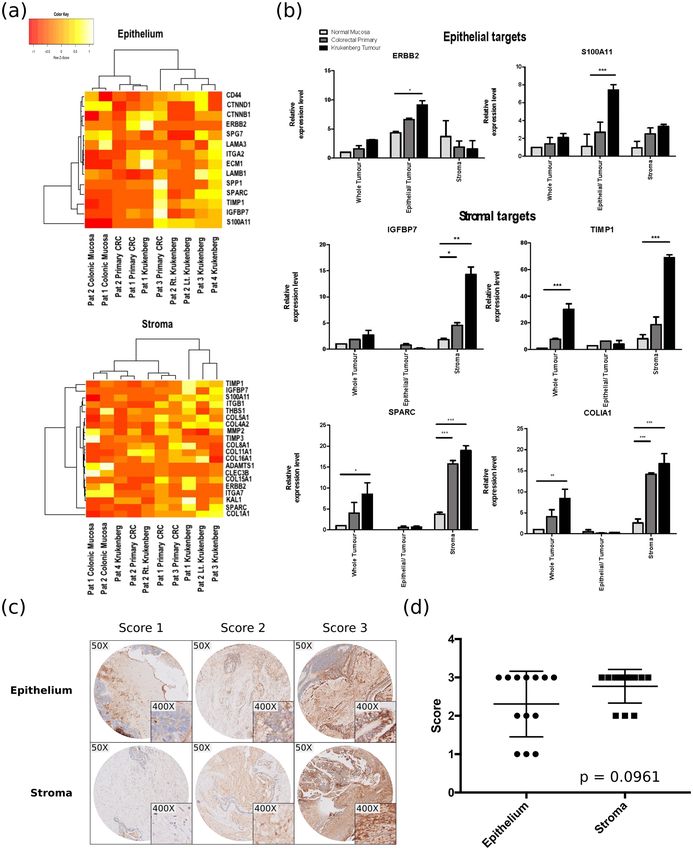
www.nature.com/scientificreports/                                                               www.nature.com/scientificreports

                           limitations of conventional sequencing methods which analyse whole tumour biopsies4. Conventional sampling
                           of a cancerous mass often results in a collection of varied cell types as tumour cells are frequently intermixed with
                           stromal, inflammatory and epithelial cells. This leads to great difficulty in obtaining pure samples of malignant
                           cells, and as a result complicate the genetic evaluation of these cells5,6. To gain deeper understanding of biological
                           processes and disease mechanisms, it is vital to elucidate gene expression of discrete cellular populations found
                           in whole tumour samples7,8.
                               Laser capture microdissection (LCM) is a unique method which allows the segregation of pure cell popula-
                           tions from defined anatomical locations instead of whole tumour biopsies9. Using microscopy to identify specific
                           compartments of tissue, laser is used to precisely dissect the samples-of-interest, following which nucleic acids
                           can be extracted from these pure cellular populations and used in downstream experiments, revolutionizing
                           molecular analyses of intricate tissue samples10–13. In conjunction with RNA extraction methods, LCM has been
                           used to ensure effective processing of samples, and analyse transcriptomes of discrete tumour cell populations
                           and low-quantity cellular populations in tissues14. In comparison to other techniques for isolation of cells, LCM
                           allows for the retention of positional information of cells without requiring tissue dissociation. Additionally, there
                           is no need for live cells with genetic labels15.
                               Although LCM is widely utilized on a variety of tissue types, obtaining high-quality RNA remains difficult
                           and necessitates for strict protocols which are critical for downstream analyses16,17. Furthermore, tissue handling
                           time plays a critical role in the preservation of RNA integrity. In a selected group of patients who undergo cytore-
                           ductive surgeries (CRS) that usually take numerous hours, it is particularly challenging to harvest specimens
                           with optimal RNA integrity and would require a streamlined workflow to ensure that specimens are processed
                           promptly after being surgically removed. Hence, a feasible approach using targeted LCM that precisely captures
                           areas of interest to achieve accurate RNA sequencing with minimal starting material is pertinent in light of the
                           challenges of procuring adequate amounts of tissue samples.
                               In this protocol paper, we aim to demonstrate a validated workflow incorporating LCM for robust transcrip-
                           tomics analysis in the era of NGS compared to the conventional bulk tumour sequencing. There is currently no
                           literature on the use of LCM to reproducibly isolate high-quality RNA from systematically collected matched
                           tumours and its downstream applications specifically in colorectal and Krukenberg tumours. Furthermore,
                           there is a lack of publicly available data, such as on TCGA, which are matched. As such, differences in gene
                           expression in unmatched normal and tumour samples may not be truly representative of upregulated genes or
                           signaling pathways in malignant cells. We have established a methodology developed for RNA-Seq that cou-
                           ples LCM with Nugen Ovation FFPE RNA Multiplex System for efficient sequencing of RNA in microdissected
                           clinical samples from colorectal and Krukenberg tumours which have not been demonstrated before. The opti-
                           mized workflow for RNA isolation and sequencing from LCM samples of matched normal mucosal, colorectal
                           and Krukenberg tumours was determined. qPCR verification on several chosen targets was then performed to
                           evaluate the quality of RNA-Seq data. Further confirmation of the spatial expression by immunohistochemistry
                           (IHC) was performed to validate the target in situ and to assess the accuracy of the LCM. Finally, to determine if
                           LCM samples performed better compared to whole tumour samples, qPCR analyses on both microdissected and
                           non-microdissected matched trios of normal-primary-metastatic samples were conducted.

                           Results
                           Optimisation of pipeline.          The workflow consisting of major steps such as LCM, RNA isolation and RNA
                           sequencing is depicted in Fig. 1. Each process has been optimized to ensure seamless flow of tissue collection and
                           tissue processing to preserve and obtain good quality RNA for downstream applications like RNA sequencing
                           and qPCR validation. Since RNA starts degrading once the tissue is removed from the body, tissue handling time
                           was kept to minimum throughout the procedure. We ensured that the time of tissue resection to tissue harvest
                           was carried out as quickly as possible and the tissue was snap frozen immediately before bringing the sample to
                           our laboratory for further processing. Additionally, the time from staining the sample to completion of LCM was
                           strictly maintained to less than 30 mins for each slide. The temperature for tissue storage is also a critical compo-
                           nent for maintaining high RIN. For long-term storage, our samples were kept in a −80 °C freezer. Alternatively,
                           we stored the samples in liquid nitrogen or dry ice for short-term storage. The usage of wet ice for temporary
                           storage was not suitable. To minimize freeze-thaw cycles of our eluted RNA, which would ultimately degrade
                           them, we stored eluted RNA in aliquotes. Lastly, we applied RNase Away to ensure a clean working area and used
                           nuclease/RNase free water for all our experiments to prevent contamination.

                           Patient samples and LCM. Multisampling of colorectal and Krukenberg tumour samples in conjunction
                           with the associated normal mucosa was performed (Fig. 2). Normal colonic mucosa was collected to serve as
                           control in the gene expression analysis. Analyzing these samples in trio - normal mucosa, primary tumour and
                           metastasis - could provide insights to the biological process that may be masked by tumour centric analysis. We
                           identified four patients who underwent cytoreductive surgery for resection of Krukenberg tumours. Among these
                           patients, complete normal-primary-metastasis sample trio were obtained for Patients 1 and 2. Matched primary
                           colon tumour and Krukenberg tumour specimens were collected from Patient 3 while only Krukenberg tumour
                           was available for Patient 4 (Supplementary Table S1). Biopsies were systematically harvested and snap frozen in
                           liquid nitrogen immediately upon resection to preserve good morphology and RNA integrity of the specimen
                           for histological assessment and transcriptomic analysis respectively. The RNA quality will affect the success of
                           the downstream processes, highlighting the importance of proper tissue handling. The tissues-of-interest were
                           marked by the clinical pathologist on digitalized haematoxylin and eosin (H&E) stained slides (Supplementary
                           Fig. S1). During microdissection, the cresyl violet-eosin quick staining protocol provided good morphological
                           resolution of the tissue samples. Using the pathologically annotated image as reference, areas-of-interest were
                           identified and microdissected (Fig. 2).

Scientific Reports |   (2020) 10:682 | https://doi.org/10.1038/s41598-019-55146-2                                                              2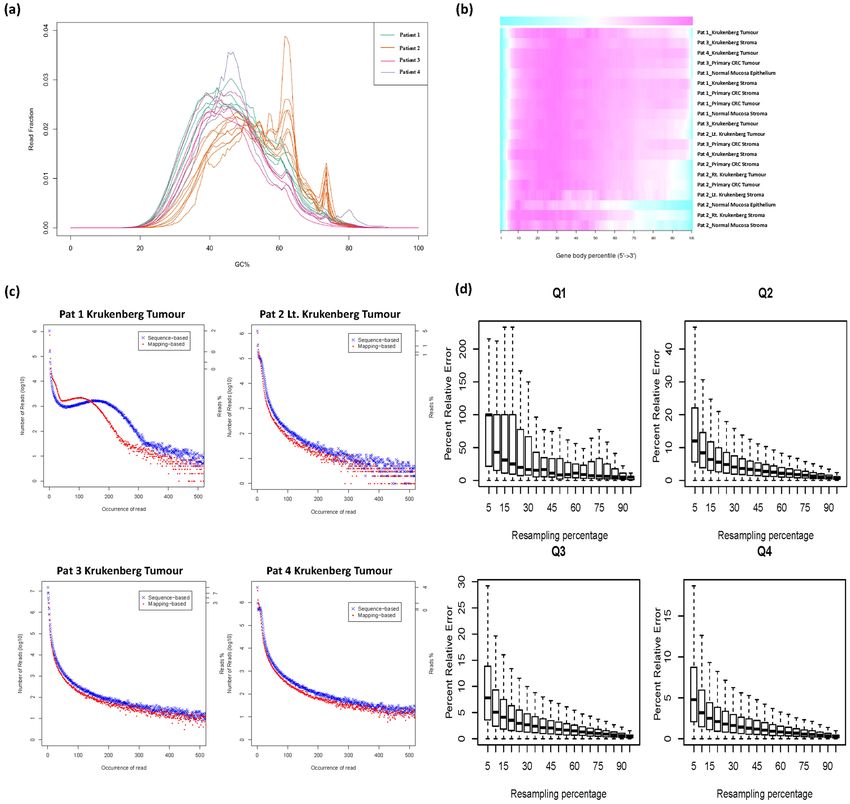
www.nature.com/scientificreports/                                                              www.nature.com/scientificreports

                           Figure 1. Schematic illustration of the workflow.

                           RNA integrity number (RIN) analysis and RNA quantification. Total RNA was extracted from the
                           microdissected tissues. The quality and degree of degradation of extracted RNA was appraised via RNA integ-
                           rity number (RIN) before amplification. The quality of RNA integrity is determined by an algorithm applied to
                           electrophoretic RNA analysis and is expressed as the RIN that ranges between 1 (totally degraded) to 10 (intact).
                           The automated electrophoresis Bioanalyzer system provided the RIN for the 20 samples, with a mean value of
                           5.53 ± 1.73 (s.d.), indicating relatively good RNA quality (Fig. 3 and Table 1).
                               For all the samples, the overall mean value of the RNA quantity in 5 µl of eluent was 28.77 ng ± 21.31 (s.d.),
                           whereby all except two samples (normal mucosa stroma) were well above the recommended input quantity by the
                           Manufacturers’ guidelines (Fig. 3 and Table 1). This threshold was overruled for the sample below the lower limit
                           of 10 ng and was used to construct a library along with all the other samples.

                           Sequencing data quality control.            Raw RNA-Seq data was aligned to the human reference transcriptome
                           (hg19) and the quality of the sequencing data assessed using RSeQC. We first studied the distribution of GC con-
                           tent across all reads in each sample. Most samples had the expected normal distribution of GC content, with some
                           samples from patient 2 having additional peaks, possibly due to contamination of sequencing adapters or other
                           factors related to sample preparation (Fig. 4a). In addition, we examined the presence of 5′to 3′ bias in the data
                           by applying a gene body coverage analysis on the mapped reads for all libraries using the geneBodyCoverage.py
                           script in RSeQC. No significant 5′or 3′ end bias was reported based on the gene body coverage analysis (Fig. 4b).
                           We note again that samples from patient 2 had reduced coverage at the 3′ end. The duplication levels relative to
                           the total number of sequences show a distribution that is skewed to the right of the graph, indicating that most of
                           the libraries demonstrate good library diversity. However, some of the samples exhibit higher levels of duplication
                           which may be due to the contamination of the library possibly from residual ribosomal RNA as observed from the
                           report of overrepresented sequences (Fig. 4c and Supplementary Fig. S2a). We then performed a saturation anal-
                           ysis to check if the sequencing coverage is sufficient to give a good representation of the intrinsic transcriptomic
                           profile (Fig. 4d and Supplementary Fig. S2b). The saturation plots indicate that the number of reads is sufficient
                           to accurately quantify even low-abundance transcripts.

                           Analysis of the RNA-Seq results. To compare the transcriptomic landscape of the samples, we applied
                           unsupervised clustering analysis to the expression data generated from RNA-Seq. Figure 5a demonstrates the
                           variability of transcriptomic signatures of the various samples both in the epithelial and stromal components.
                           Briefly, expression data of both the stroma and epithelium revealed that the samples from the 4 patients formed
                           groups corresponding to normal, primary tumour and Krukenberg with a couple of exceptions in the samples.
                           This observed pattern suggests that there is a common molecular modification process driving the formation of
                           cancers as the normal cells progress to form tumours and eventually gain the ability to metastasize. The modifica-
                           tion of the transcriptome does not merely occur in the epithelial cells. It also happens in the stroma.
                              Using the RNA sequencing data of the epithelial component of the tumours and normal mucosa, the 2D
                           principal component analysis (PCA) plots revealed that the principal components (PC) 1 and 2 separated tumour

Scientific Reports |   (2020) 10:682 | https://doi.org/10.1038/s41598-019-55146-2                                                            3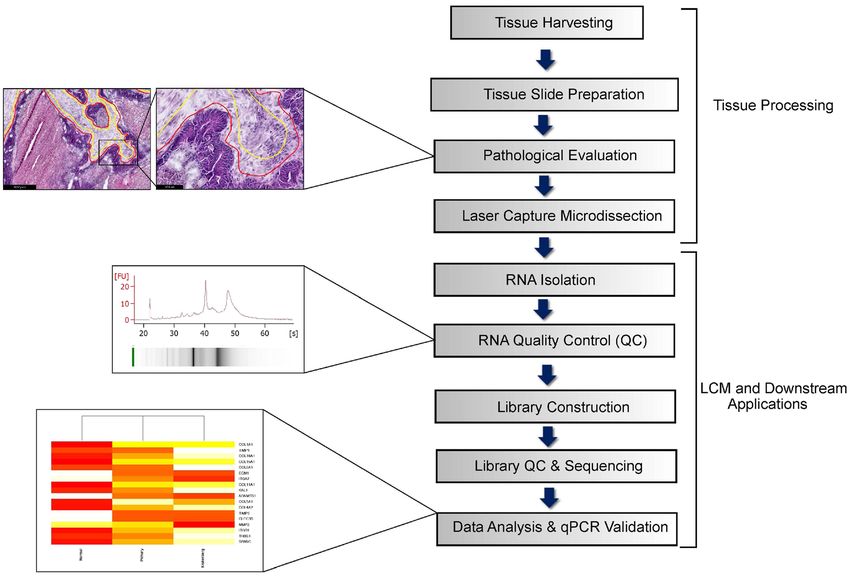
www.nature.com/scientificreports/                                                            www.nature.com/scientificreports

                           Figure 2. Representative images of surgical samples harvested in trio (normal-primary-metastasis), H&E
                           stained reference section (10X) and LCM sections (10X). Red arrows represent tumour epithelial cells while
                           blue arrows represent the stromal cells.

                           Figure 3. Total RNA capillary electrophoresis Bioanalyzer electrochromatograms from LCM samples from
                           patient 1. These diagrams show the differences in quality of RNA obtained from different LCM samples. FU,
                           fluorescence units; RIN, RNA integrity number; nt, nucleotide; s, seconds.

                           versus non-tumour epithelium into two groups. This observation is further supported by the distance matrix of
                           the epithelium that demonstrated two distinct clustering that corresponds to tumour and non-tumour samples
                           in general (Supplementary Fig. S3). Based on these findings, it is clear that the normal colonic mucosa exhibits
                           a completely different transcriptomic profile compared to both the primary tumours and Krukenberg tumours
                           (Supplementary Fig. S3). Specifically, in patient 1, the transcriptomic profile of the Krukenberg tumours differs
                           greatly from that to the primary tumour but clustered with the Krukenberg tumours from the 3 other patients.
                           In patients 2 and 3, the transcriptomic profile of the Krukenberg tumours is more similar to the primary tumour
                           compared to patient 1, suggesting potential differences in the biological aggressiveness across patients with
                           colorectal tumours that metastasize to the ovary (Krukenberg).
                               On a similar note, as suggested by the PCA plot and distance matrix in Supplementary Fig. S3, the stroma of
                           the normal colonic mucosa can be separated from that of the tumour stroma using unsupervised clustering of

Scientific Reports |   (2020) 10:682 | https://doi.org/10.1038/s41598-019-55146-2                                                         4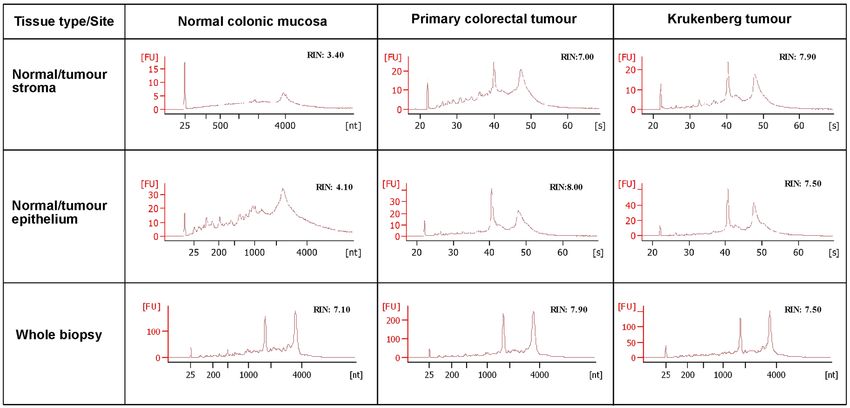
www.nature.com/scientificreports/                                                              www.nature.com/scientificreports

                           Figure 4. (a) GC Content of LCM samples. There is an expected normal distribution of % GC content across
                           sequencing reads in all 20 samples. (b) Heat map of the gene body coverage of all libraries. Overall, the 5′
                           end has higher coverage compared to the 3′ end. This 5′ to 3′ bias is consistent between all samples indicating
                           comparable expression values amongst them. The graph was generated using the aligned reads for each library
                           and inputted into the geneBodyCoverage.py script from the RseQC package. (c) Representative plots illustrating
                           the distribution of duplicated reads relative to the total number of sequences for all libraries. (d) Saturation plot
                           of the colorectal tumour component, illustrating percent relative error versus resampling fraction for transcripts
                           grouped by expression quartile (
www.nature.com/scientificreports/ www.nature.com/scientificreports
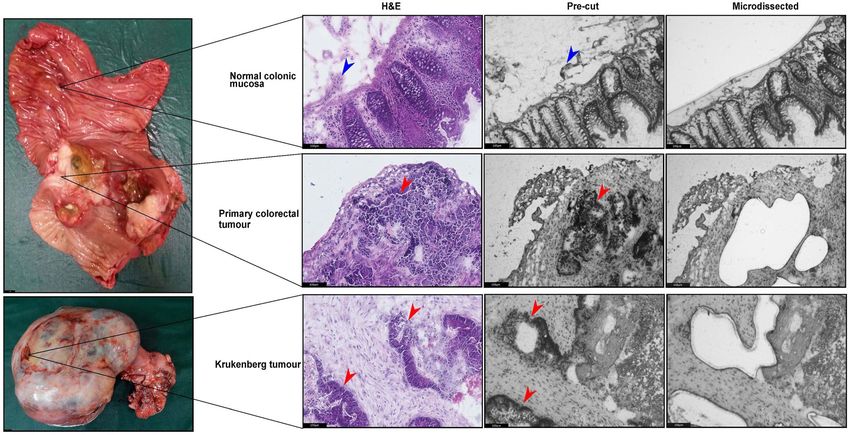
Figure 5. Validation of RNA-Seq data by qPCR analysis of LCM samples. (a) Heat map illustrating the
epithelial and stromal transcriptomic landscape of all the RNA-Seq samples across patients. Each row is
normalized using Z-score. (b) Results illustrating the expression patterns of epithelial targets (ERBB2 and
S100A11) as well as stromal targets (IGFBP7, TIMP1, SPARC & COLIA1) across samples and tissue types.
These targets were upregulated specifically in the respective compartments. The data was normalised to β-
Actin and analysed using one-way ANOVA. Results are the mean of three biological replicates and standard
deviations are shown. (c) Representative immunohistochemical (IHC) staining of IGFBP7, illustrating the
scores 1 to 3 for epithelial and stromal staining intensity scoring in our Krukenberg samples. (d) Distribution of
intensity scoring for epithelial and stromal staining in Krukenberg samples (p = 0.0961). *p < 0.05, **p < 0.01,
***p < 0.001.
Scientific Reports | (2020) 10:682 | https://doi.org/10.1038/s41598-019-55146-2 6www.nature.com/scientificreports/ www.nature.com/scientificreports
SN Sample ID RIN Total RNA input 5 µl (ng)
1 Pat 1 Colonic Mucosa Stroma 7.9 4.82
2 Pat 1 Colonic Mucosa Epithelial 5 59.22
3 Pat 1 Primary CRC Stroma 7 47.20
4 Pat 1 Primary CRC Tumour 8 41.60
5 Pat 1 Krukenberg Stroma 7.9 28.85
6 Pat 1 Krukenberg Tumour 7.5 57.00
7 Pat 2 Colonic Mucosa Stroma 5 3.80
8 Pat 2 Colonic Mucosa Epithelial 3.1 16.17
9 Pat 2 Primary CRC Stroma 5.2 11.97
10 Pat 2 Primary CRC Tumour 6.3 24.08
11 Pat 2 Right Krukenberg Stroma 4.5 12.55
12 Pat 2 Right Krukenberg Tumour 7.1 28.96
13 Pat 2 Left Krukenberg Stroma 5.9 10.30
14 Pat 2 Left Krukenberg Tumour 7.1 20.76
15 Pat 3 Primary CRC Stroma 3 20.05
16 Pat 3 Primary CRC Tumour 4.2 10.06
17 Pat 3 Krukenberg Stroma 5 56.04
18 Pat 3 Krukenberg Tumour 4.1 81.14
19 Pat 4 Krukenberg Stroma 3 17.08
20 Pat 4 Krukenberg Tumour 3.7 23.87
Average 5.5 28.8
S.D. 1.7 21.3
Table 1. RNA integrity and quantity of microdissected samples.
instance, IGFBP7 is a known stromal marker in many epithelial cancers, and elevated expression is associated
with disease progression and poorer overall survival18–20. COL1A1, a fibrillar collagen encoding gene found in
the stroma of multiple cancers, plays a role in tumour proliferation, invasion, migration and angiogenesis18,21–23.
Upregulation of ERBB2 (HER2) is associated with aggressive tumours, and poorer overall and disease-free surviv-
als in breast cancer24,25. We subjected these differentially expressed genes, namely ERBB2, SPINK1, CEACAM1,
SPARC, TIMP1, IGFBP7, COL1A1, ENO1, VEGFA, S100A11 and PLA2G2A, to validation by qPCR using spe-
cific primers (Supplementary Table S3). qPCR relative expression data of these selected targets corresponded with
the expression patterns identified by the RNA-Seq data of microdissected samples (Fig. 5b and Supplementary
Fig. S4). Apart from confirming targets, such as ERBB2 and S100A11, which are exclusively upregulated in the
tumour epithelial cells, qPCR data confirmed that stromal targets such as SPARC, TIMP1, IGFBP7, COL1A1 were
upregulated specifically in stromal components and not in epithelial components (Fig. 5b).
To investigate the impact of microdissection in target calling, we performed qPCR on microdissected sam-
ples as well as matched whole tumour biopsies which were not subjected to microdissection. Comparing gene
expression data between microdissected samples and whole biopsies, merely 1 out of 9 genes had matched gene
expression patterns across the two groups of comparison, whereby TIMP1 was unanimously identified as a metas-
tasis specific gene (p ≤ 0.001) in both analyses. Interestingly, our results demonstrated that whole tumour biopsies
may not provide enough resolution to identify important targets that might be hidden in sub-compartments
of tissues. For example, expression of IGFBP7 was insignificant in whole tumour analysis while homogenous
stromal analysis showed significantly higher expression of IGFBP7 in both primary tumour and metastasis with
2.719 (p ≤ 0.05) and 12.46 (p ≤ 0.01) fold increase respectively when compared to normal stroma. Analysis of
stroma enriched samples also revealed that SPARC and COLIA1 expression in the stromal compartments of both
primary and metastatic tumour were highly significant (p ≤ 0.001) while these targets were only significantly
enriched in metastatic tumours in whole biopsy analysis.
Immunohistochemical validation of RNA-Seq results. Due to the rarity of Krukenberg tumours, we
used archival samples of Krukenberg tumors for our immunohistochemical validation. Utilizing IGFBP7 as a
representative marker, we stained and analyzed the epithelial and stromal components of each tissue microar-
ray (TMA) core. Representative staining intensities are shown in Fig. 5c. All 14 stromal samples revealed high
IGFBP7 staining while 11 out of 14 epithelial samples exhibited high staining (p = 0.0961) (Fig. 5d). Although
our results did not reach significance possibly due to the small sample size, we confirmed the spatial expression of
IGFBP7 thus validating the accuracy of LCM.
Discussion
Whole tumour biopsies are typically used in conventional techniques of RNA-Seq, limiting the possibility of fur-
ther differentiation of specific gene expression in various tumour cell types. Furthermore, conventional methods
typically require the capture of a significant number of cells or numerous cycles of RNA amplification to generate
ample quantities of RNA for downstream experiments, which may inadvertently introduce artifacts especially
when initial RNA quantities are small26–28. In order to precisely characterize genomic aberrations in a tumour
Scientific Reports | (2020) 10:682 | https://doi.org/10.1038/s41598-019-55146-2 7www.nature.com/scientificreports/ www.nature.com/scientificreports
population, it is integral to acquire pure genetic material from cancerous cells with no or minimal contamination
of neighbouring cells. LCM is a powerful high throughput technique which allows for the isolation of pure cell
populations from fresh frozen or paraffin-embedded tissue sections and dissociated cultured cells29. It allows
for the microscopic isolation of distinct cell types from tissue sections that may subsequently be utilized in gene
expression analyses30. Additionally, LCM enables the isolation of homogeneous populations of cells from histo-
logically complex tissues sections31. This approach results in satisfactory quality and quantity of RNA for subse-
quent experiments, such as microarray analyses32,33. It is a valuable technique that permits extraction of deeply
embedded cells from tissues and has multiple advantages compared to conventional techniques.
Likewise, in this report, we have described and validated a workflow that combines LCM with RNA-Seq for
a robust and efficient approach to RNA sequencing for NGS. Through our optimization, we were able to obtain
high-quality RNA from LCM-derived matched tumour samples validated by RNA quality assessment platform,
qPCR and IHC. The methodology of sequencing minute amounts of RNA obtained from LCM and RNA-Seq data
generated from in-depth sequencing of microdissected tumour specimens was able to demonstrate high-quality
RNA with minimal degradation as reflected by high RIN values in conjunction with acceptable quality control
performance. Furthermore, qPCR and IHC data highlighted the difference in the expression profile of selected
targets between whole tumour biopsies and the same samples subjected to tissue microdissection.
We have successfully demonstrated that in-depth analysis of tumour compartments and normalisation using
matched tissue samples from CRS allows for the potential of identification of putative therapeutically relevant
biomarkers that would otherwise not have been identified from conventional genomic sequencing approaches.
The novelty of this paper lies in the analysis of multiple sampling of normal mucosal, stromal and epithelial com-
ponents in the same patient to correct for innate biological differences. Notably, there is currently no literature on
the use of LCM to reproducibly isolate high-quality RNA from systematic collection of matched tumours and its
downstream applications specifically in colorectal and Krukenberg tumours. Furthermore, there is a lack of pub-
licly available data, such as on TCGA, which are matched. As such, differences in gene expression in unmatched
normal and tumour samples may not be truly representative of upregulated genes or signaling pathways in
malignant cells. For example, the differing results of SPARC and COLIA1 expression in the microdissected vs
non-microdissected samples highlight the utility of LCM for accurate target calling in molecular studies. Using
conventional whole biopsy sequencing, SPARC and COLIA1 were identified as metastatic markers, but were
not significant in the primary tumour. Harnessing the strength of LCM, the enriched samples showed that both
SPARC and COLIA1 are significantly enriched in both primary and metastatic tumours, highlighting that these
markers are biological relevant in both settings. Whole tumour biopsies may not provide enough resolution to
identify important targets that might be hidden in sub-compartments of tissues. Using whole tumour sequencing
may lead to the overlook of common profiles in primary and metastatic tumours that reveal conserved signaling
pathways. These observations suggest that key molecular markers may be masked by disparate gene expression
levels in different tissue compartments, highlighting the importance of tissue composition in the generation of
molecular data. LCM allows for specific components to be dissected and subsequently a more accurate gene
expression profile in separate components of the tumour sample34,35. This technique potentially provides greater
insights into early genetic changes found within distinct tissue compartments enabling the investigation of molec-
ular events that underlie the progression of malignant lesions36. Hence, LCM-based analyses of patient-derived
clinical samples may be a routine and useful method for the identification of underlying pathological causes of
malignancies for diagnostic and therapeutic applications.
We would like to emphasize that this manuscript serves as a methods paper of utilizing LCM to uncover tar-
gets that would be missed with conventional bulk sequencing, with qPCR and IHC data for technical validation.
We do not claim that we have identified key differentially expressed genes in peritoneal metastasis in general.
The current study is statistically underpowered for the identification of robust differentially expressed genes that
dictate the biology of peritoneal metastases, and doing so would in turn generate multiple false positive results.
To identify key differentially expressed genes that define the transcriptomic landscape of peritoneal metastasis
will require a different study design and a larger sample size based upon careful statistical power calculations37, a
possibility by consortiums such as TCGA.
Nonetheless, there are limitations to our approach. Even if RNA-Seq is able to pick up differentially expressed
targets, validation using qPCR still requires selection of targeted genes. As such, several key differentially
expressed genes may not be detected and evaluated. Furthermore, availability of LCM equipment and down-
stream molecular applications are less efficient with formalin-fixed paraffin-embedded (FFPE) tissue samples
compared to ethanol fixed and live cultured cells samples38,39. RNA-Seq is mainly limited to snap frozen samples
due to inherent problems with FFPE tissues where the fixation and embedding processes directly modify and
degrade RNA40. Moreover, freshly acquired specimens are technically challenging due to size constrains41. As the
amount of RNA isolated with LCM is minute, sample degradation needs to be kept to a minimum10. However,
degradation may also occur during staining procedures which are critical for the identification of cells for cap-
ture. Studies have reported a substantial drop in RNA levels in LCM samples from tissues following exposure to
staining solutions during immunocytochemistry42, although there was no difference in RNA yield when immu-
nohistostaining was carried out in the presence of RNase inhibitors in all solutions except wash buffers43. Hence,
given limited tissue quantity of early neoplastic lesions, maximising genetic and molecular information obtained
from these tissue specimens represents a vital technical challenge.
Conclusion
These findings suggest that in the era of NGS and large consortiums, a fraction of samples should be subjected to
LCM before transcriptomics analysis to enable the identification of robust targets. We present here, in principle,
a method that reliably produces high quality RNA from fresh-frozen colorectal and Krukenberg microdissected
matched specimens that are amenable to transcriptome profiling that has not been demonstrated before. We
Scientific Reports | (2020) 10:682 | https://doi.org/10.1038/s41598-019-55146-2 8www.nature.com/scientificreports/ www.nature.com/scientificreports
were able to obtain high-quality RNA from LCM-derived tumour samples validated by RNA quality assessment
indicators and qPCR amongst paired samples of primary, metastatic and normal tissue. We further showed that
RNA-Seq from the combination of matched trio (normal-primary-metastatic) samples allows for the potential
identification of putative therapeutically relevant biomarkers that can provide insights into tumor evolution and
improve data integrity as compared to public databases of TCGA which only describes the macroscopic findings
of cancers. Hence, this study demonstrates the usefulness of LCM for transcriptome analysis that enables com-
parisons of discrete cell populations residing within malignant tissues procured from intact tissue sections, a
methodology that could be harnessed for biomarker discovery. Moving forward, this workflow may be practiced
on other tissue types and will enhance research on neoplastic progression, epithelial-stromal interactions and
unique cancer biomarkers.
Methods
LCM and RNA extraction. Four patients with Krukenberg tumours of colorectal origin were identified and
recruited for this study. Multiple samples of matched normal mucosa, primary colorectal tumours and ovarian
metastasis (Krukenberg tumours) as described in Table 1 were systematically harvested for this study. In total, 20
samples of colorectal and Krukenberg tumours with paired adjacent normal colonic mucosa were subjected to
LCM and subsequently used for gene expression analysis. This study was approved by the SingHealth Centralized
Institutional Review Board (CIRB Ref: 2015/2479/F) and informed consent was obtained from patients. All
the experiments were performed in accordance with the relevant guidelines and regulations. Tissue sections of
10μm were cut and mounted onto plain glass slides for manual microdissection or PEN membrane slides (Life
Technologies, Carlsbad, CA, USA) for UV LCM. The frozen sections were briefly washed in nuclease-free water
and stained with 3:1 cresyl violet acetate: eosin stain (Sigma Aldrich; Missouri, USA; C5042 and HT110132)
before undergoing dehydration through graded alcohols and xylene. Thorough dehydration helps reduce the
activity of endogenous RNase enzymes. To minimise RNA degradation, duration of tissue handling remained
short. Using the H&E image with pathological annotations (Supplementary Fig. S1) as a reference, cutting out-
lines were drawn meticulously around specific cells to prevent tissue contamination. Consecutive sections were
used for LCM and photo documentation. Laser-captured cells were collected on LCM Macro CapSure caps (Life
Technologies, Carlsbad, CA, USA) using the Arcturus XT LCM instrument (Life Technologies, Carlsbad, CA,
USA).
Total RNA was extracted from all 20 microdissected tissues and 3 whole biopsies which were not subjected to
LCM using the QIAgen RNAeasy Micro Kit (Qiagen, CA, USA), according to the manufacturer’s instructions. All
9 samples were stored in nuclease-free tubes and stored at −80 °C. To reduce sample degradation, the bench top
and instruments required for all laboratory procedures such as sample preparation, microdissection, and RNA
®
extraction were cleaned using RNase AWAY (Life Technologies, Carlsbad, CA, USA) to minimise atmospheric
RNase enzyme.
RNA quality assessment. Aliquots of each RNA pool were analysed for quality and quantity on a
Bioanalyzer RNA Pico chip (Agilent). The quality and quantity of isolated total RNA were evaluated using the
2100 BioAnalyzer (Agilent Technologies, Palo Alto, CA) with RNA 6000 Pico LabChip kit (Agilent Technologies,
Santa Clara, CA). 1 µl of each isolated RNA sample was analysed with RNA 6000 Pico Assay employing RNA Pico
LabChips (Agilent Technologies). Briefly, the quality of each RNA sample was approximated by the fragment size
distribution, including two peaks correlating to 18 S and 28 S ribosomal RNAs, and a signal in the small molecu-
lar weight area, corresponding to small RNAs. This distribution was correlated to an extensive database of RNA
samples and a RIN was tabulated. The resultant electropherograms were used to determine RNA integrity and
concentration. RIN was calculated by the instrument where a value of 10 denotes intact RNA and a value of 1
indicates complete degradation.
RNA library preparation and sequencing. Nugen Ovation RNA-Seq System (Nugen, CA, USA) was
used to prepare the sequencing library. The amount of RNA used ranged from 3–60 ng. As defined in the user’s
manual, amplification of both mRNA and non-polyadenylated transcripts makes the Ovation FFPE RNA-Seq
Multiplex System (Nugen, San Carlos, CA, USA) ideal for amplification before the use of next generation
sequencing (NGS). The libraries were checked using Agilent DNA1000 chip to confirm that all obtained profiles
conform to what was expected. Six uniquely indexed libraries were pooled and loaded into each lane of flow cells.
Sequencing was carried out via Illumina HiSeq 2500 (Illumina, San Diego, CA, USA) at 150 base pairs, paired
end, and 50 million paired reads per sample as per the manufacturer’s protocol.
FastQC validation. For quality assessment of raw sequencing reads, FASTQ files were analysed using the
FASTQC tool using default settings44. To assess the quality of read alignments, the sequencing reads were first
aligned to the human reference transcriptome (hs37d5) using the STAR aligner using default settings45. The BAM
files were then processed using the RSeQC tool to produce various RNA-Seq diagnostic plots46,47. Briefly, tran-
scripts were grouped quartiles based on their expression level. For each quartile, the degree to which transcript
expression levels differed when using a random subset of reads as compared to when using the full set of reads was
determined. This resampling process was repeated using varying fractions of the total reads. If sequencing depth
is adequate, the relative error should be low and stable even when a subset of reads are used, indicating that satu-
ration has been achieved. In this case, transcripts below the 25th percentile of expression (“Q1”) display saturation,
suggesting that even low-abundance transcripts have been accurately quantified. To assess the contamination rate
of human ribosomal RNA (rRNA) in the libraries, sequencing reads were aligned to a reference comprising the
sequences of known human ribosomal RNAs using BWA under default settings, and the extent of rRNA contam-
ination inferred from fraction of reads in the library aligning to the rRNA reference48.
Scientific Reports | (2020) 10:682 | https://doi.org/10.1038/s41598-019-55146-2 9www.nature.com/scientificreports/ www.nature.com/scientificreports
RNA expression analysis and qPCR verification of selected gene targets. Using DNA nexus
applications, reads were mapped using TopHat2 v2.0.12 and CuffDiff v2.1.1 on the genome version ucsc_hg19.
Fragments per Kilobase of transcript per Million (FPKM) and fragment counts for each transcript, primary tran-
script and gene in each sample was normalized as part of CuffDiff. Data was further analysed in R (v 3.4.2). FPKM
values from CuffDiff were used for principal component analysis (PCA), and a distance matrix (representing
all the pair wise distances between all samples analysed) was visualised using the hopach library. As this was
an exploratory analysis, targets selected for qPCR validation was based on biological significance. To verify the
expression data derived from the RNA-Seq, we applied qPCR to the RNA extracted from microdissected tissues
as well as matched biopsies which were not subjected to LCM in order to evaluate the quality of RNA-Seq anal-
ysis. We selected genes from the RNA-Seq data to represent increased expression unique to certain components
or combinations of components (Supplementary Table S2) in order to validate the differences between whole
samples and LCM samples. cDNA was synthesized using 100 pg of RNA with qSCript cDNA SuperMix (Quanta
Biosciences, Beverly, MA) and processed on the SimpliAMP thermal cycler (Applied Biosystems, Thermo
Scientific, Waltham, Massachusetts). PCR primers were first designed with Primer3 v0.4.0 and inputted into
NCBI BLAST to check for specificity of the primers generated (Supplementary Table S3). β-Actin was used as a
reference gene. qPCR was performed on the CFX-96 system (Bio-Rad Laboratories, Berkeley, California) in trip-
licates per sample using the iTaq universal SYBR Green supermix (Bio-Rad Laboratories, Berkeley, California).
The data was normalized to β-Actin and analysed using one-way ANOVA.
Immunohistochemistry (IHC). A tissue microarray (TMA) was constructed using Krukenberg tumours
collected from patients who were treated in the National Cancer Centre Singapore or Singapore General Hospital
between 2004–2017 (n = 14). The constructed TMA block was sectioned into 5 µm sections and mounted onto
slides. IHC staining of the TMA sections was performed using the BOND-MAX autostainer (Leica Microsystems,
Wetzler, Germany) as per the manufacturer’s instructions. Briefly, sections were deparaffinized and rehydrated.
Antigen retrieval was conducted at 100 °C, following which the slides were cooled down to room temperature
and washed. In order to block endogenous peroxidase activity, sections were incubated in 3–4% (v/v) H2O2 for
15 minutes. To prevent non-specific binding, sections were blocked in 10% goat serum. They were then incubated
with anti-IGFBP7 (ab171085, Abcam, Cambridge, UK) antibody for 20 minutes, following which the slides were
rinsed and exposed to polymer for 5 minutes. Slides were then washed, treated with DAB-Chromogen detection
reagent for 7 minutes and then rinsed again. Sections were subsequently exposed to haematoxylin for 5 minutes to
counterstain the nuclei. Finally, slides were rinsed, dehydrated and mounted. Colon samples were used as positive
controls while the negative control was derived by replacing the primary antibody with BondTM Antibody diluent.
Evaluation of IHC staining. All stained sections were assessed by two independent scorers (WHN and JH)
who were blinded to the outcome. Scoring for the epithelial and stromal components was conducted by strati-
fying the intensity of the stain to a value of 0 (no staining) to 3 (strong staining) if at least 10% of the target cells
were positively-stained (Fig. 5c). In situations where there were discrepancies, a third researcher (HJL) assessed
the sections independently to obtain the final score. t-test analysis was used to compare between the epithelial
and stromal expressions.
Data availability
RNA sequencing raw data were deposited into the Gene Expression Omnibus (GEO) under the accession code
GSE119968.
Received: 29 October 2018; Accepted: 23 November 2019;
Published: xx xx xxxx
References
1. Tomczak, K., Czerwinska, P. & Wiznerowicz, M. The Cancer Genome Atlas (TCGA): an immeasurable source of knowledge.
Contemp Oncol (Pozn) 19, A68–77, https://doi.org/10.5114/wo.2014.47136 (2015).
2. Ozsolak, F. & Milos, P. M. RNA sequencing: advances, challenges and opportunities. Nat Rev Genet 12, 87–98, https://doi.
org/10.1038/nrg2934 (2011).
3. Han, Y., Gao, S., Muegge, K., Zhang, W. & Zhou, B. Advanced Applications of RNA Sequencing and Challenges. Bioinform Biol
Insights 9, 29–46, https://doi.org/10.4137/BBI.S28991 (2015).
4. Byron, S. A. et al. Translating RNA sequencing into clinical diagnostics: opportunities and challenges. Nat Rev Genet 17, 257–271,
https://doi.org/10.1038/nrg.2016.10 (2016).
5. Finotello, F. & Di Camillo, B. Measuring differential gene expression with RNA-seq: challenges and strategies for data analysis. Brief
Funct Genomics 14, 130–142, https://doi.org/10.1093/bfgp/elu035 (2015).
6. Ning, L. et al. Current challenges in the bioinformatics of single cell genomics. Front Oncol 4, 7, https://doi.org/10.3389/
fonc.2014.00007 (2014).
7. Tarazona, S., Garcia-Alcalde, F., Dopazo, J., Ferrer, A. & Conesa, A. Differential expression in RNA-seq: a matter of depth. Genome
Res 21, 2213–2223, https://doi.org/10.1101/gr.124321.111 (2011).
8. Mikulowska-Mennis, A. et al. High-quality RNA from cells isolated by laser capture microdissection. Biotechniques 33, 176–179
(2002).
9. Wang, S. et al. Improvement of tissue preparation for laser capture microdissection: application for cell type-specific miRNA
expression profiling in colorectal tumors. BMC Genomics 11, 163, https://doi.org/10.1186/1471-2164-11-163 (2010).
10. Fend, F. & Raffeld, M. Laser capture microdissection in pathology. J Clin Pathol 53, 666–672 (2000).
11. Singh, R. R., Luthra, R., Routbort, M. J., Patel, K. P. & Medeiros, L. J. Implementation of next generation sequencing in clinical
molecular diagnostic laboratories: advantages, challenges and potential. Expert Rev Precis Med Drug Dev 1, 109–120 (2016).
12. Takeshima, Y. et al. Heterogeneous genetic alterations in ovarian mucinous tumors: application and usefulness of laser capture
microdissection. Hum Pathol 32, 1203–1208, https://doi.org/10.1053/hupa.2001.28956 (2001).
Scientific Reports | (2020) 10:682 | https://doi.org/10.1038/s41598-019-55146-2 10www.nature.com/scientificreports/ www.nature.com/scientificreports
13. Nichterwitz, S. et al. Laser capture microscopy coupled with Smart-seq. 2 for precise spatial transcriptomic profiling. Nat Commun
7, 12139, https://doi.org/10.1038/ncomms12139 (2016).
14. Crosetto, N., Bienko, M. & van Oudenaarden, A. Spatially resolved transcriptomics and beyond. Nat Rev Genet 16, 57–66, https://
doi.org/10.1038/nrg3832 (2015).
15. Datta, S. et al. Laser capture microdissection: Big data from small samples. Histol Histopathol 30, 1255–1269, https://doi.
org/10.14670/HH-11-622 (2015).
16. Sun, H. J., Chen, J., Ni, B., Yang, X. & Wu, Y. Z. Recent advances and current issues in single-cell sequencing of tumors. Cancer Lett
365, 1–10, https://doi.org/10.1016/j.canlet.2015.04.022 (2015).
17. Calon, A. et al. Stromal gene expression defines poor-prognosis subtypes in colorectal cancer. Nat Genet 47, 320–329, https://doi.
org/10.1038/ng.3225 (2015).
18. Rupp, C. et al. IGFBP7, a novel tumor stroma marker, with growth-promoting effects in colon cancer through a paracrine
tumor–stroma interaction. Oncogene 34, 815, https://doi.org/10.1038/onc.2014.18, https://www.nature.com/articles/
onc201418#supplementary-information (2014).
19. Adachi, Y. et al. Expression of angiomodulin (tumor-derived adhesion factor/mac25) in invading tumor cells correlates with poor
prognosis in human colorectal cancer. International journal of cancer 95, 216–222, doi:10.1002/1097-0215(20010720)95:43.0.co;2-o (2001).
20. Jiang, W., Xiang, C., Cazacu, S., Brodie, C. & Mikkelsen, T. Insulin-like growth factor binding protein 7 mediates glioma cell growth
and migration. Neoplasia (New York, N.Y.) 10, 1335–1342, https://doi.org/10.1593/neo.08694 (2008).
21. Sun, S. et al. Identification of COL1A1 as an invasionrelated gene in malignant astrocytoma. International journal of oncology 53,
2542–2554, https://doi.org/10.3892/ijo.2018.4568 (2018).
22. Wang, Q. & Yu, J. MiR-129-5p suppresses gastric cancer cell invasion and proliferation by inhibiting COL1A1. Biochemistry and Cell
Biology 96, 19–25, https://doi.org/10.1139/bcb-2016-0254 (2017).
23. van Kempen, L. C. et al. Type I collagen expression contributes to angiogenesis and the development of deeply invasive cutaneous
melanoma. International journal of cancer 122, 1019–1029, https://doi.org/10.1002/ijc.23147 (2008).
24. Lane, H. A. et al. ErbB2 Potentiates Breast Tumor Proliferation through Modulation of p27Kip1-Cdk2 Complex Formation:
Receptor Overexpression Does Not Determine Growth Dependency. Molecular and Cellular Biology 20, 3210–3223, https://doi.
org/10.1128/mcb.20.9.3210-3223.2000 (2000).
25. Kennedy, S. P. et al. Targeting promiscuous heterodimerization overcomes innate resistance to ERBB2 dimerization inhibitors in
breast cancer. Breast Cancer Research 21, 43, https://doi.org/10.1186/s13058-019-1127-y (2019).
26. Mo, A. et al. Distinct Transcriptional Changes and Epithelial-Stromal Interactions Are Altered in Early-Stage Colon Cancer
Development. Mol Cancer Res 14, 795–804, https://doi.org/10.1158/1541-7786.MCR-16-0156 (2016).
27. Butler, A. E. et al. Recovery of high-quality RNA from laser capture microdissected human and rodent pancreas. J Histotechnol 39,
59–65, https://doi.org/10.1080/01478885.2015.1106073 (2016).
28. Kim, T., Lim, C. S. & Kaang, B. K. Cell type-specific gene expression profiling in brain tissue: comparison between TRAP, LCM and
RNA-seq. BMB Rep 48, 388–394 (2015).
29. Lovatt, D., Bell, T. & Eberwine, J. Single-neuron isolation for RNA analysis using pipette capture and laser capture microdissection.
Cold Spring Harb Protoc 2015, pdb prot072439, https://doi.org/10.1101/pdb.prot072439 (2015).
30. Burbach, G. J., Dehn, D., Nagel, B., Del Turco, D. & Deller, T. Laser microdissection of immunolabeled astrocytes allows
quantification of astrocytic gene expression. J Neurosci Methods 138, 141–148, https://doi.org/10.1016/j.jneumeth.2004.03.022
(2004).
31. Luzzi, V., Mahadevappa, M., Raja, R., Warrington, J. A. & Watson, M. A. Accurate and reproducible gene expression profiles from
laser capture microdissection, transcript amplification, and high density oligonucleotide microarray analysis. J Mol Diagn 5, 9–14,
https://doi.org/10.1016/S1525-1578(10)60445-X (2003).
32. Murakami, H., Liotta, L. & Star, R. A. IF-LCM: laser capture microdissection of immunofluorescently defined cells for mRNA
analysis rapid communication. Kidney Int 58, 1346–1353, https://doi.org/10.1046/j.1523-1755.2000.00295.x (2000).
33. Mo, A., Jackson, S., Devers, T. J. & Rosenberg, D. W. Targeted Transcriptional Profiling of Microdissected Biopsy Specimens
Representing Early Colonic Neoplasia. J Cell Biochem 117, 2677–2681, https://doi.org/10.1002/jcb.25644 (2016).
34. Bai, X. et al. Development and characterization of a novel method to analyze global gene expression profiles in endothelial cells
derived from primary tissues. Am J Hematol 83, 26–33, https://doi.org/10.1002/ajh.20953 (2008).
35. Wang, F. et al. Integrated analysis of microRNA regulatory network in nasopharyngeal carcinoma with deep sequencing. J Exp Clin
Cancer Res 35, 17, https://doi.org/10.1186/s13046-016-0292-4 (2016).
36. Makhzami, S., Rambow, F., Delmas, V. & Larue, L. Efficient gene expression profiling of laser-microdissected melanoma metastases.
Pigment Cell Melanoma Res 25, 783–791, https://doi.org/10.1111/pcmr.12013 (2012).
37. Pepe, M. S., Li, C. I. & Feng, Z. Improving the quality of biomarker discovery research: the right samples and enough of them. Cancer
epidemiology, biomarkers & prevention: a publication of the American Association for Cancer Research, cosponsored by the American
Society of Preventive Oncology 24, 944–950, https://doi.org/10.1158/1055-9965.Epi-14-1227 (2015).
38. Shou, J. et al. Optimization and validation of small quantity RNA profiling for identifying TNF responses in cultured human
vascular endothelial cells. J Pharmacol Toxicol Methods 53, 152–159, https://doi.org/10.1016/j.vascn.2005.02.004 (2006).
39. Morton, M. L. et al. Identification of mRNAs and lincRNAs associated with lung cancer progression using next-generation RNA
sequencing from laser micro-dissected archival FFPE tissue specimens. Lung Cancer 85, 31–39, https://doi.org/10.1016/j.
lungcan.2014.03.020 (2014).
40. Bevilacqua, C., Makhzami, S., Helbling, J. C., Defrenaix, P. & Martin, P. Maintaining RNA integrity in a homogeneous population of
mammary epithelial cells isolated by Laser Capture Microdissection. BMC Cell Biol 11, 95, https://doi.org/10.1186/1471-2121-11-95
(2010).
41. Wang, W. Z., Oeschger, F. M., Lee, S. & Molnar, Z. High quality RNA from multiple brain regions simultaneously acquired by laser
capture microdissection. BMC Mol Biol 10, 69, https://doi.org/10.1186/1471-2199-10-69 (2009).
42. Vincent, V. A., DeVoss, J. J., Ryan, H. S. & Murphy, G. M. Jr. Analysis of neuronal gene expression with laser capture microdissection.
J Neurosci Res 69, 578–586, https://doi.org/10.1002/jnr.10329 (2002).
43. Clement-Ziza, M., Munnich, A., Lyonnet, S., Jaubert, F. & Besmond, C. Stabilization of RNA during laser capture microdissection
by performing experiments under argon atmosphere or using ethanol as a solvent in staining solutions. RNA 14, 2698–2704, https://
doi.org/10.1261/rna.1261708 (2008).
44. Andrews, S. FastQC A Quality Control tool for High Throughput Sequence Data, http://www.bioinformatics.babraham.ac.uk/projects/
fastqc/ (2010).
45. Dobin, A. et al. STAR: ultrafast universal RNA-seq aligner. Bioinformatics 29, 15–21, https://doi.org/10.1093/bioinformatics/bts635
(2013).
46. Wang, L., Wang, S. & Li, W. RSeQC: quality control of RNA-seq experiments. Bioinformatics 28, 2184–2185, https://doi.org/10.1093/
bioinformatics/bts356 (2012).
47. RSeQC. RSeQC: An RNA-seq Quality Control Package, http://rseqc.sourceforge.net/.
48. Li, H. & Durbin, R. Fast and accurate short read alignment with Burrows-Wheeler transform. Bioinformatics 25, 1754–1760, https://
doi.org/10.1093/bioinformatics/btp324 (2009).
Scientific Reports | (2020) 10:682 | https://doi.org/10.1038/s41598-019-55146-2 11www.nature.com/scientificreports/ www.nature.com/scientificreports
Acknowledgements
This project was funded by the National Cancer Centre Singapore Research Fund. MCCT is supported by the
National Medical Research Council Clinician-Scientist Award (NMRC/CSIRG/1360/2013). CAJO is supported
by the Ministry of Health Healthcare Research Scholarship SEED funding (NMRC/SEEDFUNDING/017/2016)
and National Medical Research Council Transition Award (NMRC/TA/0061/2017).
Author contributions
H.J.L., Q.X.T., J.W.S.T. and C.A.J.O. wrote the manuscript. Q.X.T., N.B.S., W.K.L., H.J.L., W.H.N., J.H., K.K.N.K.,
C.C.Y.N. and V.R. carried out the experiments and performed data analysis. T.K.H.L. assessed the pathological
slides. S.D.W., G.H.C.T. and C.S.C. obtained patient consent and contributed matched surgical human tumour
samples. C.K.O., O.L.K., B.T.T. and K.C.S. provided integral clinical and scientific inputs to this study. C.A.J.O.
and M.C.C.T. contributed intellectual guidance, conceived the conceptual framework, and examined the
manuscript critically for publication.
Competing interests
The authors declare no competing interests.
Additional information
Supplementary information is available for this paper at https://doi.org/10.1038/s41598-019-55146-2.
Correspondence and requests for materials should be addressed to M.C.C.T.
Reprints and permissions information is available at www.nature.com/reprints.
Publisher’s note Springer Nature remains neutral with regard to jurisdictional claims in published maps and
institutional affiliations.
Open Access This article is licensed under a Creative Commons Attribution 4.0 International
License, which permits use, sharing, adaptation, distribution and reproduction in any medium or
format, as long as you give appropriate credit to the original author(s) and the source, provide a link to the Cre-
ative Commons license, and indicate if changes were made. The images or other third party material in this
article are included in the article’s Creative Commons license, unless indicated otherwise in a credit line to the
material. If material is not included in the article’s Creative Commons license and your intended use is not per-
mitted by statutory regulation or exceeds the permitted use, you will need to obtain permission directly from the
copyright holder. To view a copy of this license, visit http://creativecommons.org/licenses/by/4.0/.
© The Author(s) 2020
Scientific Reports | (2020) 10:682 | https://doi.org/10.1038/s41598-019-55146-2 12You can also read