Atmospheric Changes and Ozone Increase in Mexico City during 2020 Lockdown Period
←
→
Page content transcription
If your browser does not render page correctly, please read the page content below
Atmospheric Changes and Ozone Increase in Mexico City during
2020 Lockdown Period
Sakthi Selvalakshmi Jeyakumar
Instituto Politecnico Nacional
Jonathan Muthuswamy Ponniah
Instituto Politecnico Nacional
Gopalakrishnan Gnanachandrasamy
Sun Yat-Sen University
Sandra Soledad Morales-Garcia ( ssmoralesg@hotmail.com )
Instituto Politecnico Nacional https://orcid.org/0000-0003-0647-8489
Pedro Francisco Rodríguez-Espinosa
Instituto Politecnico Nacional
Gowrappan Muthusankar
French Institute of Pondicherry: Institut Francais de Pondichery
Diana Cecilia Escobedo-Urias
Instituto Politecnico Nacional
Research Article
Keywords: Mexico City Metropolitan Area (MCMA), Ozone, Air Pollutants, Meteorological influences, COVID-19, Mexico.
DOI: https://doi.org/10.21203/rs.3.rs-544962/v1
License: This work is licensed under a Creative Commons Attribution 4.0 International License. Read Full License
Page 1/18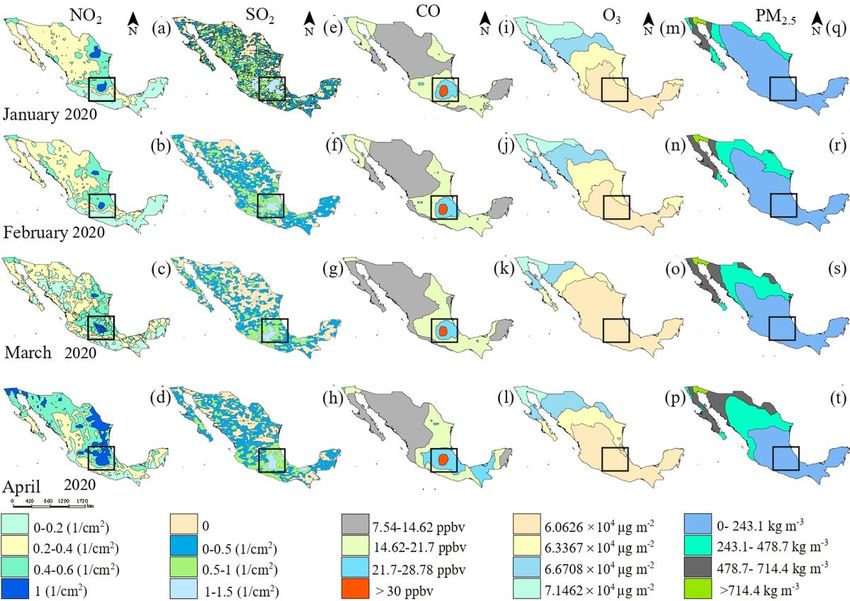
Abstract
Atmospheric pollutant (NO2, SO2, CO, O3 and PM2.5) variations during the COVID-19 pandemic (during 2020) have been studied from
Mexico City in Central America. Meteorological factors (i.e) rainfall, temperature along with relative humidity played an important role in
increasing the photochemical reaction for the formation of O3 and PM2.5. Concentration pattern of O3 and PM2.5 were higher in all the
stations in spite of the reduced primary pollutants. However, higher level of O3 and PM2.5 during the lockdown period in 2020 is mainly
due to the air-mass exchange which happened through the broader channel in the north (Tenango del Aire Pass) and in the southeast
(Cuautla-Cuernavaca valley). The higher values of particulate matter are compensated by domestic heating (“Quédate en Casa”/ Stay at
Home), whereas the increase of O3 is supported by the higher solar radiation and household activities (both indoor/ outdoor).
Monitoring stations (BJ, GAM, UAM, SFE) in Mexico City indicate that the level of pollutants (except GAM) were within the WHO
guidelines. Comparison of pollutants with other countries indicate a spike in NO2, O3 and PM2.5 levels. Overall results indicate that the
anthropogenic activities which is influenced by the meteorological parameters has affected the air quality in Mexico City and it persisted
during the lockdown period.

Introduction
The COVID-19 is a worldwide ongoing pandemic, initially chronicled in Wuhan, capital of Hubei province in China (Raibhandari et al.,
2020) during late December 2019. This contagious disease created chaos across the globe affecting 208 countries including the
developed countries like USA, UK, Australia, Europe, Japan, Germany, Africa, Mexico, India, Singapore, Malaysia, Canada and several
other Latin American countries with a total affected human cases of 44 million (as of 30th October, 2020).

Without any exception, Mexico also reported its first case during mid-January, 2020 in the state of Nayarit and Tabasco and gradually
all over the country totaling 1,957,889 cases and deaths were upto 167,760 persons (as of 10th February, 2020). Among the different
states in Mexico, the most affected cases was detected in Mexico City (as of 10th February, 2020). The Mexican government initiated
the lockdown slowly during mid-March 2020 by ceasing all high activities and closing schools, movie theaters, restaurants, public malls
to avoid large people gatherings for social distancing. Recently, air pollution is the most important environmental problem labelled in
most of megacities posing threats for human health due to the presence of primary and secondary pollutants resulted from
anthropogenic activities and in-situ atmospheric reactions. Mexico City, renowned as one of the five largest populated cities in the world
is bustled with heavy human activities and residents > 22 million habitants (United Nations, 2018). On this context, Mexico City always
pinpointed for the air pollution since 1940, the era of industrial activities and gradual rise in pollution (Lezama, 2000). There are
numerous studies which reported the strangling air problems in Mexico City Metropolitan Area (MCMA) especially the high ozone (O3)
and PM2.5 concentrations making this the most polluted City in North America (Molina et al. 2007). Despite the huge population, the
Mexico City host a large vehicular fleet available as taxi cab, passenger car, ride hauling services, light duty vehicles and heavy vehicles
for cargo system. After a very serious episodes of severe air pollution for several years, the Mexican government introduced Bus Rapid
Transit (BRT) system as an initiative to minimize the air pollution. Since the epoch of industrialization, there was a regular increase in
vehicles for freight systems considered as an important source for emitting pollutants in interurban areas and general vehicle fleet in
urban areas (Bel, 2018).

Most of the megacities faces air pollution risking human health (Holgate, 2017), in recent decades, Mexico City has reported major air
pollution calamity due to the high concentrations of air pollutants such as NO2, SO2, CO, O3, PM2.5 which was high compared to the
permissible Air Quality Standards guidelines (WHO, 2019). The majority of these pollutants are emitted through urban road transport
containing massive vehicle fleet (metro, metro bus, microbus) and simultaneous traffic congestion, which is generally used by 12 million
people (INEGI, 2018). Besides the immense use of this public transit, a study conducted on vehicle pollutant measurements discloses
the commuter exposure to PM2.5, CO and benzene especially in microbuses, buses and metro in Mexico City, which causes carcinogenic
health problems (Gomez-Perales et al., 2004; Shiohara et al., 2005).

Since 1940, the Mexico City Metropolitan Area experienced a major air pollution due to urbanization and industrial activities, hence the
Mexican government steps into implementing several strategies during the late 20th century to control and reduce the emissions
triggering air pollution by restraining the emissions from industries also for the transport sector such as driving restrictions called “No
Driving Day” (Hoy No Circula program in Spanish) in 1989. Implementing the control measures, it brought down significant changes in
improving the air quality, which also happened due to the change in composition of gasoline and verification of vehicle engine (Davis,
2008; INEGI, 1988). However, particulate matter (PM) were a major pollutant emitted from the industrial areas present in the City which

                                                                 Page 2/18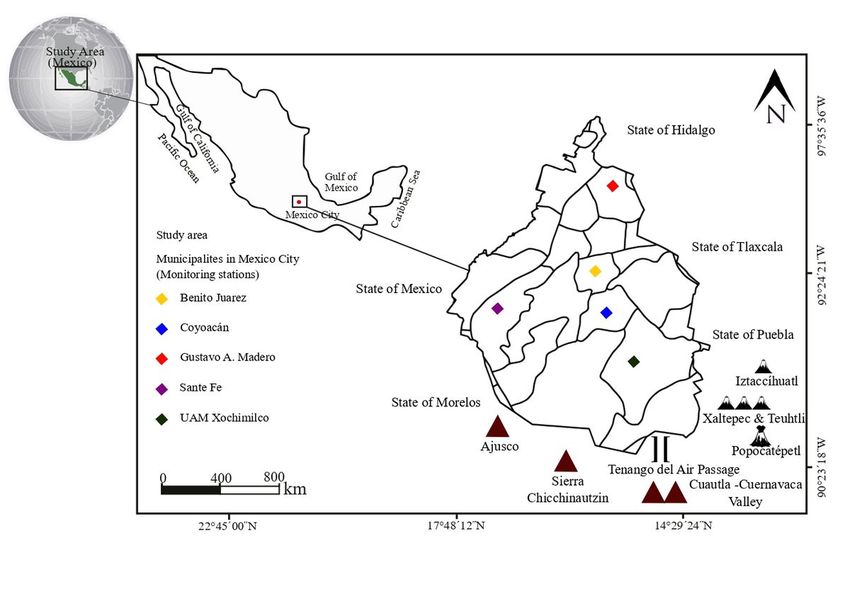
has happened due to in-house hold activities and different chemical additives from various sector (Soto-Coloballes, 2017; Sicard et al.,
2020).

The immediate lockdown period announced across the globe made a substantial difference in the environment and the atmosphere,
which was well documented through many research articles and social media. We made use of this period (upto June 2020) to identify
and understand the causes, processes accountable for persisting air pollution in Mexico City Metropolitan Area. The main objective of
the present study was to document and understand the changes due to the lock down which happened through industrial and transport
sectors and the direct effect on the changes in the atmospheric conditions in Mexico City.

Materials And Methods
Geographical information of the Study area

Mexico City is an inland basin located at elevated position of 2240 m above mean sea level (MSL) enclosed with high mountains of
Ajusco and Sierra Chicchinautzin in the south, Iztaccíhuatl- Popocatépetl dormant volcanic mountains in the east bordering the State of
Mexico and Puebla (Fig. 1). Mexico City Metropolitan Area consists of 16 localities formerly known as “Mexico City”, comprising 59
metropolises in State of Mexico and 1 metropolis in State of Hidalgo. The topography of Mexico City indicates that it is surrounded with
high mountains. In addition, a board opening in the north and a narrow passage in the south-south east at the border of the basin
formerly called “Tenango del Aire” acts as natural ventilators for the City between the Mexico City basin and Cuautla- Cuernavaca Valley
in the State of Morelos. Since 2000, the drastic transformation in the Mexico City caused urbanization and it expanded over some
municipalities bordering the basin from the states of Mexico, Puebla, Tlaxcala, Morelos and Hidalgo which are under increasing
population growth forming a grand urban complex in Mexico “Mexico City Megalopolis” as the most polluted City in the World (Fig. 1).

Meteorological settings

The Mexico City basin falls under sub-tropical highland climate, which is classified into three patterns: 1) dry winter (November to
March); 2) dry summer (April to May and 3) rainy season (June to October) mainly to understand the changes. The summer is the driest
season in Mexico adjoined by the presence of clear skies with low humidity and high pressure system with an average ambient
temperature of 12 to 24 ˚C. The driest month have westerly current experiencing the anti-cyclonic flow along with strong thermal
inversion at night (Collins and Scott, 1993). This (flow) that often lasts after the sunrise due to turbulent mixing and the strong heating
by the sun enhances the photochemical reaction of the ozone (O3) recording higher values of pollutants in Mexico City. In contrary, the
rainy season have easterly winds prevailing over the mountains surrounding the Mexico City basin, which is due to convection and the
thermal inversions of high moisture concentration. However, during early morning the turbulent eddies are generated from the heat from
the sun causing severe vertical mixing of the pollutants (Giovanni et al., 2017).

The average annual rainfall in Mexico City is about 820 mm, which is intense from July to September. The diverse meteorological
condition in Mexico city is responsible for the persisting air pollution, triggering activities in the photochemical ozone production and
other secondary pollutants such as aerosol loadings and particulate matter (PM2.5 & PM10) (Garrido-Perez et al., 2018).

Mexico City suffer several episodes of ozone pollution since the last few decades especially during summer season, which is found
higher than permissible limits of Mexican Air Quality Standards and WHO guidelines. The summer seasons are suspected to have UV
radiations boosting the photochemical reactions. However, in the rainy season after precipitation by mid-day the ozone pollution is
happening throughout the year (Molina., 2002). The low wind velocity prevailing in Mexico City with high ozone concentration during
summer and low during winter (1994–2014) is very well correlated with the particulate matter contents with similar changes (Barrett
and Raga, 2016). Hence, the meteorological variables were considered as most important factor towards understanding the air quality
and pollution in Mexico City.

Pollutant data collection

This study was carried out by analyzing various set of data which is considered as important for determining and the understanding the
discrepancies of air quality in Mexico City Megalopolis during the lockdown period. We used the meteorological data such as 1)
temperature (in °C); 2) relative humidity (in %); 3) wind speed (in m/s); 4) precipitation (in mm) and air pollutant data (i.e) NO2, SO2, CO,
O3, PM2.5 (in µg/m3 expect for CO measured in mg/m3) from a real time monitoring stations.

                                                                 Page 3/18
In this article, we have limited our data by mentioning only the diurnal average concentrations of the pollutants from January – May
2020 compared along with the annual average concentration for 2017, 2018 and 2019. The selection of the data and period was
selected primarily to identify the periods which is considered as regular movements in the city limits during the past years. The open
data was obtained from government network called “Red Autómatico de Monitoreo Atmosférico” (RAMA, 2020). This network
comprises 34 stations in Mexico City and State of Mexico with regular maintenance of the laboratories and the monitoring equipment.
Among the 34 stations, we selected only 5 stations for the study based on importance with massive human activities and vehicular
congestions in Mexico city limits. The selected stations are as follow as: a) Benito Juarez (BJ) (Alt. 2250 MSL); b) Coyoacán (COY) (Alt.
2280 MSL); c) Gustavo A. Madero (GAM) (Alt. 2227 MSL); d) Sante Fe (SFE) (Alt. 2599 MSL) and e) UAM Xochimilco (UAM) (Alt. 2246
MSL) respectively. The studied pollutants NO2, SO2, CO and PM2.5 were obtained as hourly average concentration and O3 was obtained
on average for 8 hrs to comply the standard quality.
Satellite- borne data
The primary data of pollutants concentrations were cross referred with the satellite image through spatial and temporal analysis of the
pollutants. The satellite images were procured from the open access platform from NASA, which is officially available as “NASA
GIOVANNI V4.34”. The data obtained were manipulated with the aid of Geographical Information System (GIS) for the above mentioned
pollutants for the period of 2018 to 2020 (January- May). The spatial distribution of each pollutant were obtained and specified for our
area of interest. We have collected different atmospheric pollutants (CO, NO2, O3, PM2.5, and SO2) satellite data from 2018 to 2020 for
Mexico City. The data accessed from the GIOVANNI (Goddard Earth Sciences Data and Information Services Center, or GES DISC),
indicates various Geo science data from NASA satellites directly on the web portal (https://earthdata.nasa.gov/), without any
disturbances of traditional data acquisition and analysis methods. The pollutants CO, SO2, and PM2.5 were obtained from the source
MERRA 2model (GMAO 2015) and NO2, and O3 from the source OMDOAO3e (Veefkind et al., 2012) with a spatial resolution of 0.25°.
The data were available as vector files obtained data as a vector file which can be opened in Arc GIS software (Arc Map 10.3) and
further the data was classified into four groups which was used to reclassify for the pollutants.
Mexican legislatures for air quality
The Mexico City megalopolis had a great history of air pollution because of economic and demographic growth. Hence the Mexican
government made a remarkable advance in improving air quality since 1990s by initiating numerous regulations in transport and
industrial sectors. The Secretariat of Environment (SEDEMA) is in authority for organizing Mexico City Environmental Programs towards
air quality and other environmental problems in Mexico City megalopolis and other surrounding municipalities in states of Mexico,
Puebla, Tlaxcala, Morelos and Hidalgo. Moreover, Mexico City have many other governmental officialdoms for the environmental
policies and problems. The Mexican Secretariat of the Environment and Natural Resources (SEMERNAT) for the protection and
management of natural resources through some environmental standards known as “Official Mexican Standards” (Norma Oficial
Mexicana). The abrupt actions taken by Mexican government through these environmental agencies were executing the air quality
standards, monitoring the stations in majority of the municipalities, regulating vehicle engines verifications for their emission
inventories, modifying the composition in the gasoline and supporting newer technologies through scientific research. In 1994, the
Mexican government imposed its air quality standards for major air pollutants especially for nitrogen dioxide (NO2), sulfur dioxide
(SO2), carbon monoxide (CO), ozone (O3) and particulate matter (PM2.5). The above parameters were used in this study as a quality
guideline for determining air quality pertained to human health and the changes during the lockdown periods.
Results And Discussion
Spatial & temporal distribution of air pollutants in Mexico City
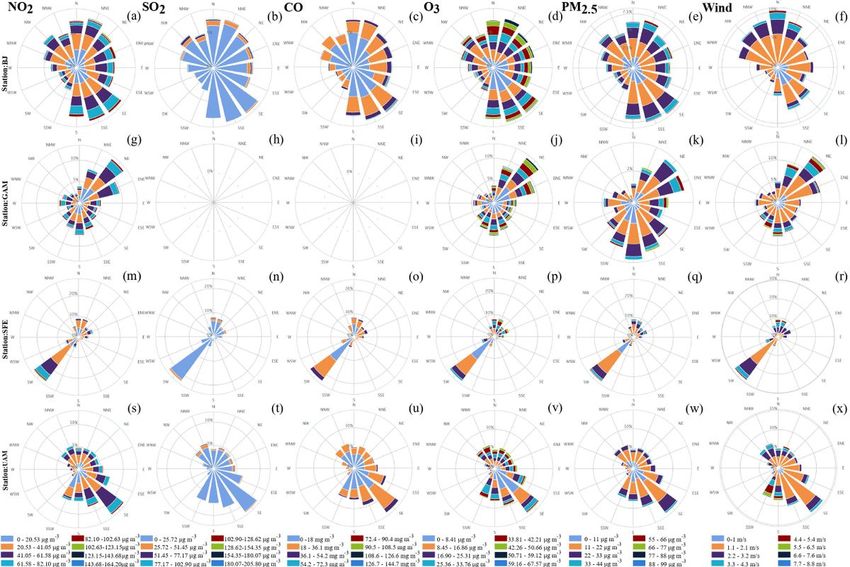
The average concentrations of air pollutants (NO2, SO2, CO, O3, PM2.5) from five studied monitoring stations in Mexico City is shown in
Table 1. Likewise, satellite images for the months of January to May 2020 (Fig. 2) were used to observe the changes in the air
pollutants along with the three previous years (2017, 2018 & 2019) (Suppl. Fig. F1).
Page 4/18Table 1
Mean concentration of major air pollutants of five municipalities in Mexico City during lockdown
and its comparisons
Locations Year NO2 SO2 CO O3 PM2.5
(µg/m3) (µg/m3) (mg/m3) (µg/m3) (µg/m3)
Benito Juárez Annual - 42.25 1.78 163.45 22.37
Coyoacán Avg. - - - - -
Gustavo A. Madero 2018 12.78 - - 131.70 23.69
Santa Fe 41.65 26.19 0.89 142.79 14.74
UAM Xochimilco 68.81 37.28 1.27 138.24 19.90
Avg. 41.03 35.24 1.31 144.05 20.18
Benito Juárez Annual 59.86 11.93 0.96 137.87 15.36
Coyoacán Avg. - - - - -
Gustavo A. Madero 2019 83.44 0.76 - 157.39 39.34
Santa Fe 63.32 19.62 0.16 123.66 30.63
UAM Xochimilco 55.86 14.08 0.86 144.20 27.47
Avg. 65.62 11.60 0.66 140.78 28.20
Benito Juárez 2020* 76.06 31.37 13.5 148.91 30.43
Coyoacán - - - - -
Gustavo A. Madero 83.23 - - 169.06 16.95
Santa Fe 65.27 16.43 7.11 148.60 36.13
UAM Xochimilco 60.53 21.51 8.37 171.69 39.23
Avg. 71.27 23.10 9.66 159.57 35.26
NOM-023-SSA1-1994 400/hr - - - -
NOM-022-SSAI-2010 - 290/24 hr - - -
NOM-021-SSAI-1993 - - 12.5/8 hr - -
NOM-020-SSAI-2014 - - - 137/8 hr -
NOM-025-SSAI-2014 - - - - 45/24 hr
WHO Guidelines 200/ hr 20/24 hr - 100/8 hr 25/24 hr
*Mean concentration for January to May
Based on the available data set compared to the annual average of 2018, 2019 and 2020 (January to May) the pollutants were seen in
the concentrated in the following order: NO2: 2020 > 2019 > 2018; SO2: 2018 > 2020 > 2019; CO: 2020 > 2018 > 2019; O3: 2020 > 2018 >
2019 and PM2.5: 2020 > 2019 > 2018. Compared to the WHO values for SO2 (20/24 hr µg/m3), O3 (100/8hr µg/m3) and PM2.5 (25/24 hr
µg/m3) the present local values indicates higher values during the lockdown period of March to May 2020. The significant reduction in
SO2, CO, O3 during 2019 period indicate that they were mainly seen during the fuel scarcity period (García-Franco, 2019). It should also
be observed that nearly 70 explosions (January to May 2020) occurred in the volcano Popocatepetl emitting approximately 2500
tons/day load of SO2 into the atmosphere (CENAPRED, 2020). This is very well supported by the plume and wind direction which is NW-
W-NNE during the months of March, April and May 2020 (Suppl. Table T1) (de Foy et al., 2009; Martin Del-Pozzo, 2009; Schiavo, 2020;
SEDEMA-CDMX, 2018). In addition, the higher NO2, CO, SO2 values during the January, February period of 2020 is also attributed to the
smoke plumes released from the fireworks used during the festival seasons during the end of the year releasing high quantity of sulfate
Page 5/18nitrate, ammonium and potassium, which is responsible for the 50% of total particulate matter (García-Franco, 2019; Retama et al.,
2019).
Carbon monoxide values in Mexico City varied from 7.11 to 13.5 mg/m3 in the five studied locations. However, overall calculated values
were well below the permissible limits of NOM-021-SSAI-1993 (Mexican Norm.). Comparing the previous two years (2018-19) data on
CO in Mexico City, the values indicate a five to seven-fold increase during the lockdown period. Higher values of CO during the lockdown
period in Mexico City is mainly due to the indoor emission of CO mainly due to low grade solid fuel, biofuels clogged chimneys, gas
burners, home cooking, wood-burning fire places, decorative fire places etc., could vent CO into indoor spaces and subsequently to the
main route (Howard et al., 1991; Buchholz et al., 2016; Murphy et al., 2007; Wolff et al., 2013). In contrast, the lower values during the
two previous years (2018-19) indicate that the major population in the City limits are often out in the streets due to the various workload
as individuals and are well stretched in industrial sectors (Levesque et al., 2001; Maroni et a., 2002). The above distribution of personal
in different work places also reduces the use of individual emission of CO mainly in indoor conditions. In addition, the presence of road
side restaurants and food stalls, which is often popular in developing mega cities like Mexico also increases the presence of CO and its
subsequent reduction in CO in April-May 2020 (Velasco et al., 2019).
Higher values of PM2.5 in the lockdown period is mainly due to the presence of secondary pollutants, which is generated through
photochemical reaction through NO2, SO2 and CO (Garcia-Franco, 2020). This is also supported by the temperatures (18–22°C) during
the months of April and May 2020, where the photochemical reaction is triggered. Earlier report on PM2.5 concentrations in Mexico
indicates that high values are found in areas close to metro stations and rapid transit system, which includes the metro and metrobuses
(Velasco et al., 2019). Moreover, in congested cities and high traffic zones the high presence of PM2.5 suggest that the majority of PM2.5
is due to the transport sector, which are trapped during morning and evening periods (Hernandez-Paniagua, 2018). Recent studies
during the lockdown periods in different countries also suggest that the increase in particulate matter was counter balanced by
domestic heating (Sicard et al., 2020). Likewise, the higher values of SO2, PM2.5 combine during the lockdown period is not associated
to the reduction of vehicles rather than the volcanic explosions from Popocatepetl during the latter half of the lockdown period (March
to May 2020) (Suppl. Table T1).
Role of wind in transporting pollutants
Mexico City have three types of seasons namely dry summer, dry winter and rainy season. During the dry summer (April and May) the
photochemical reactions of VOC, NO2 and SO2 often causes smog, aerosol loadings (values in µg/m3) with high O3 (159.57) and PM2.5
(35.26) (Cohen et al., 2018; Salcedo et al., 2012). Higher concentrations (values in µg/m3) of NOx (71.27) and O3 (148.60) during early
morning are from the vehicle rush during the peak hours (8 to 10 am) is directly linked to the photochemical reaction. Moreover, the
pollutants have a tendency to circulate through synoptic pattern throughout the year due to their regional settings of high latitudes and
altitude (Edgerton, 1999). In addition, the topography of Mexico City basin shows it is surrounded by high elevated mountain causing a
circulation pattern effectively promoting the diurnal movement of airborne particles of O3 and PM2.5 within the basin, causing a
persistent O3 enrichment (de Foy et al., 2006). Despite the (in central Mexico region) circulation pattern, the pressure system which
prevails in the basin creates a great difference in distribution of pollutants inside the basin. This is supported by the broader opening in
the north of the basin which acts as a natural window of the City providing ventilation and in the south the “Tenango del aire pass
(TAP)”. The natural openings/ channels transmit the polluted air by northerly and southerly winds from TAP with high O3 (110 µg/m3)
towards MCMA. The enriched values (µg/m3) of NOx (71.27), O3 (159.57) is mainly through the corridors of Cuautla – Cuernavaca
valley under high pressure system (S-SSE-SE wind direction) (Fig. 3). Meanwhile, the Cuautla – Cuernavaca valley in the south transmits
the clean air from Amecameca prevailed with southerly winds under low pressure system (LPS) with lowest ozone concentration (80
µg/m3) due to the air mass exchange event which happened in a circular manner inbetween the mountain openings (Garcia-Reynoso et
al., 2009; Salcedo et al., 2012; Garcia-Yee et al., 2018). Moreover, the increase of O3 is also due to the reduction in particulate matter
content (compared to before lockdown), which also leads to surface O3 levels through higher solar radiation and possibly through
house hold garden related activities (Deng et al., 2010; Li et al., 2013; Su et al., 2003).
Meteorological influence of wind over the pollutants (NO2, SO2, CO, O3, PM2.5, Wind speed) in the present study is analyzed for four
stations (BJ, GAM, SFE, UAM) in the study area (Fig. 3a-x). Results from the northern monitoring station GAM indicates higher
concentration (in µg/m3) of NO2 (83.23), O3 (169.06), PM2.5 (16.25), which also follows a NNE-NE-ENE direction. The wind velocity was
5.5 to 8.8 m/s causing pollutants to more a longer distance from north to south by the strong influence of wind (Fig. 3g, j-l) (Fast et al.,
Page 6/182007). No clear distribution pattern is observed in SO2 and CO. The trajectory of the pollutants suggests that the ventilation of polluted
air is transferred through the broad channel in the northern part of Mexico City and it is also depending on the velocity and air pressure
(Fast et al., 2007). Data from the central monitoring station indicates elevated higher values (in µg/m3) of NO2 (71.27), CO (9.66), O3
(159.27) and lower values of PM2.5 (35.26) and SO2 (23.10) respectively. The wind direction follows a S-SSE-SE and N-NNE-NE-ENE-E,
where pollutants are carried away with a maximum velocity of 4.4 to 5.4 m/s (Fig. 3a-f).
The two southern monitoring stations UAM and SFE indicates that the concentration (values in µg/m3) pattern is at the intermediate
level: NO2: 60.53, 65.27; SO2: 21.51, 16.43; CO: 8.37, 7.11; O3: 171.69, 148.60; PM2.5: 39.23, 36.13 and wind speed (in m/s): 7.7, 8.8
indicating a SSE-SE-ESE direction respectively. The air mass exchange is mainly through the volcanic mountain series of Xaltepec used
Teuhtli. Furthermore, it is evident that there is a presence of “Rossby wave” breaking event, which is an anticyclonic process where cold
air passes towards equator and the warm air towards westward direction (Rodrigues and Wollings, 2017). This massive instability in the
atmospheric conditions in Mexico City clearly affects the air quality conditions in the region (Silva-Quiroz et al., 2019).
Role of temperature in distribution of pollutants
Temperature is another important factor governing all the meteorological factors like rainfall and pressure. Like wind, temperature is
also an important factor for the formation of secondary pollutants (values in µg/m3) O3 (UAM: 171.69), PM2.5 (UAM: 39.23). However,
the primary pollutants like NO2 (GAM: 82.33); SO2 (BJ: 31.37); CO (BJ: 13.5) are formed due to the photochemical reaction (Garcia-
Franco, 2020; Sicard et al., 2020). The above results are very well supported by previous studies indicating a variability in the upper-
troposphere circulation “Madden-Julian Oscillation”, where low UV radiation and less ozone exists (Barret and Raga 2016). Ozone
concentration studies in 2015 indicates that the temperature reaches higher values during the hot-dry seasons accompanied by a
minimum boundary layer height (Garzon et al., 2015). The major correlation with the higher values (µg/m3) of PM2.5 (UAM: 39.25) and
O3 (UAM: 171.69) during the March to May period, where the temperature inversions occurs in the day and vertical mixing of air column
happens during the night time (Whiteman et al., 2000; Garcia-Franco et al., 2020).
Changes in vehicle and industrial emission inventories
As this article mainly infers the origin of pollutants from the transport sector which was later affected by the meteorological influences.
The record of the inventories of transport sector (including road & air) and industrial emissions where the reduction in emission ceased
during February to May 2020.
General surface/ ground transportation movements in Mexico City involves 17 million commuting trips during week days (INEGI, 2017).
The aviation movements for national/ international movements is documented in Table 2. Six different regions aviation movements
were considered from the available data sets: a) Domestic & International (DL); b) American international (AI); c) Canadian International
(CI); d) Central & Latin America (CL); e) European (E) and f) Asian (A). The movement of air traffic for the month of February and March
2020 were reduced from different routes were: February 2020 (in %): DI (11.22) > E (9.83) > A (7.56) > CL (7.26) > AI (6.65) > CI (2.78) and
March 2020: CL (35.44) > DI (24.50) > CI (23.75) > AI (13.33) > A (11.46) > E (2.96) respectively. The data also infers that the movement of
air traffic is based on the policies of each country and region. This is also inferring that CO2 reduction takes place due to the reduction
of air traffic (Le Quere et al., 2020).
Page 7/18Table 2 Air carriers services and it’s reduction during the initial lockdown period
in Mexico
Air Carriers 2020 (No. of flights) Reduction in flights (%)
Jan Feb Mar Jan+ Feb Mar
Domestic & International (DL)
Aeromar 2163 1930 1860 89.23 85.99
Aeromexico 7307 6277 5225 85.90 71.51
Aeromexico Connect 10054 8953 7511 89.05 74.71
Aerounion* 291 236 263 81.10 90.38
Estafeta* 341 285 325 100 83.58 95.31
Interjet 10219 9081 6309 88.56 61.74
Mas Air* 126 104 110 82.54 87.30
Magnicharters 494 306 310 61.94 62.75
Vivaaerobus 6534 5809 5492 88.90 84.05
Volaris 11895 10899 9908 91.63 83.30
Total Services & CO2 49424 43880 37313 100 88.78 75.50
American International (AI)
Alaska Airlines 1139 1136 1228 99.74 107.81
American Airlines 3113 3141 2897 100.90 93.06
Amerijet International* 24 26 24 108.33 100.00
Atlas Air* 40 42 42 105.00 105.00
Compass Airlines 70 62 62 88.57 88.57
Continental Express 595 578 462 97.14 77.65
Delta Airlines 3115 2708 2271 100 86.93 72.91
Envoy Air, Inc 1086 1016 863 93.55 79.47
FEDEX* 167 161 166 96.41 99.40
Frontier 353 352 306 99.72 86.69
Jet Blue Air 324 274 263 84.57 81.17
Mesa Airlines 1783 1605 1549 90.02 86.88
Southwest Airlines 1070 962 904 89.91 84.49
United Airlines 2839 2609 2586 91.90 91.09
Total Services & CO2 15718 14672 13623 100 93.35 86.67
*Cargo services. +For the month of
Canadian International (CI) January 2020 for calculation purpose,
Air Canada 886 839 745 94.70 84.09 the values are kept at 100.
West Jet 1179 1182 930 100 100.25 78.88
Total Services & CO2 2065 2021 1675 100 97.22 76.25 Based on the surface transport
movements in Mexico City from
January to May 2020 indicates a
Central & Latin America (CL) wide variations and non-reduction of
Aerolineas Argentinas 52 50 40 96.15 76.82 movements in some sectors. The usage (in millions) from
Aerorepublica 59 41 24 69.49 40.68
Avianca 309 290 206 93.85 66.67
January to May (2020) is as follows: metrosystem 130.709
Copa 850 792 580 100 93.18 68.24 (January) to 35.900 (May); public transport 12.4 (local and
Lanperu 212 200 108 94.34 50.94 long distance buses) (in January) to 33.22 (May) and short
Volaris Costa Rica 115 108 73 93.91 63.48
transport system 44.16 (micro bus) (in January) to 11.61 (in
Total Services & CO2 1597 1481 1031 100 92.74 64.56
European (E) May) (INEGI, 2020). Eventhough based on the above data there
Air France 151 137 123 90.73 81.46 was a reduction in public transport movement during the lock
British Airways 88 84 86 95.45 97.73
down, other services were operating as it is during the normal
Cargolux Airlines* 90 61 96 67.78 106.67
Iberia 126 122 114 100 96.83 90.48 conditions. This clearly contributes more towards emissions of
KLM (Royal Dutch Airlines) 62 58 56 93.55 90.32 NO2, SO2, CO, PM2.5 and VOC as they are mostly perceived
Lufthansa 120 116 90 96.67 75.00
from the transport sector. The above inference is very well
Turkish Airlines 70 68 62 97.14 88.57
Total Services & CO2 707 646 627 100 90.17 97.04 supported by earlier studies in Mexico City that apart from
Asian (A) transport sector, industrial source (for NO2, SO2) and soil
Emirates Arabes 155 150 112 96.77 72.26
erosion (for PM2.5) and solvent paints (for VOCs) are
Korean Air 20 24 24 100 120.00 120.00
Qatar Airlines 73 79 81 108.22 110.96 responsible for the presence of these pollutants (Molina et al.,
Total 248 253 217 100 92.44 88.54 2019). Likewise, the adaptations from MOBILE 6.2 - Mexico
and Moves – Mexico found significant reduction in total
emissions (in %) for NOx by -37, CO by -52 and VOCs by 26 percent. However, there was an increase observed (in %) for O3 by 6.6 due to
the operations in urban traffic stations PM10 by + 8 and PM2.5 by 6 mainly due to the contributions from gasoline based taxis and
passenger cars (Guevara et al., 2017).
Page 8/18Industrial sector in Mexico City which has 26 different types (paper, manufacture, mining, fabrication, plastics, rubber) plays a major role
in the emission and in transporting the pollutants. The “Monthly industrial activity indice (MIAI)” was calculated based on the data from
2019 (April-May). The calculated MIAI values for the construction industry indicates that it was 105, 99.5 (April, May 2019) and 64.7,
63.8 (April, May 2020) respectively. Likewise, for manufacturing industries it was 115.4, 114.9 (April, May 2019) and 74.3, 74.1 (April,
May 2020). Overall, the reduction of industrial activity was between 35.7 to 40.3% (construction) and 40.8 to 41.1% in manufacturing
sector. In the mining industry it is almost maintained the same way 70.3 to 73.1% (for April-May 2019) and 68.2 to 72.3% (for April-May
2020) for Mexico City (Suppl. Fig. F2a-j). Air quality/ emission studies from these industries often indicate that toxic metals (As, V, Fe,
Cu) dominate due to the increase in PM2.5 (Morales-García et al., 2014). The above MIAI values suggest that the main contributors exist
due to the emissions which also has a direct effect on the higher values of VOCs that often has a direct impact on O3 (Koupal and
Palacios 2019).
Statistical Information
Statistical analysis was done with the available data as well as the meterological variables of temperature and rainfall for the year
2020. Dendrograms were generated which indicated two different clusters which high linkage distance (Fig. 4). The long linkage
distance between O3 and rainfall (avg. rainfall of 20.92 mm for March to May 2020) infers the presence of high O3 and the production
during the dry seasons (Velasco, 2017). The short linkage values of PM2.5 and SO2 indicates that the particulate matter contents are
mainly due to the geothermal activity mixed with wind direction (NW) along with the vehicle emissions. The individual linkage of NO2
with other parameters (O3, PM2.5, CO, SO2) suggest that NO2 is the controlling factor for the formation of O3 and for the generation of
PM2.5 which also depends in the temperature and other pollutants (Murphy et a., 2007). The above inference is also supported by the
notion “Stay at Home” (Quédete en Casa), where household heating has increased multiple times (Sicard et al., 2020). The short linkage
distance between CO and temperature specifies the absorption of particular radiation where the generation of CO and temperature has a
direct relationship.
Correlation matrix results (p > 0.05) clearly infers a negative value (r2 = -0.87) with NO2 indicate that the SO2 in is from an external
source mainly due to the explosions in volcan Popocateptl assisted by the wind direction. However, the strong association between O3
vs NO2 (r2 = 0.57) and O3 vs CO (r2 = 1.00) indicates photochemical reaction and O3 increase (Chin et al., 1994). Particulate matter
indicates positive correlation with NO2 (r2 = 0.94) which is a governing factor, whereas the negative relationship with SO2 (r2 = -0.98)
indicates the less conversion process responsible for the PM2.5 particles. Positive correlation (r2) of temperature with NO2 (1.00), CO
(0.54) and PM2.5 (0.96) suggest that temperature is the dependent factor for the conversion of NO2 and SO2 for sulfate and nitrates
(Eatough 1994; Khoder, 2002; Lin et al., 2019). The negative relationship (r2) of rainfall with NO2 (-0.84), CO (-0.93), PM2.5 (-0.61) and
temperature (-0.81) specifies the low reaction rate for the conversion of NO2 and SO2 to nitrate and sulfate during precipitation time. The
moderate positive value for SO2 vs rainfall (0.46) indicate the higher rate of conversion process due to the surface inversion during the
night period (Lin et al., 2019). Overall results indicate that the distribution of pollutants is dependent on meteorological parameters,
whereas the insignificant associations shows the independency of the factor for their fate and state in the atmosphere.
Comparative Studies
Based on the available data compared to the air pollutants reported from different countries during the present pandemia from January
till date (Before the lockdown & After lockdown), we have collected the available data and it has been compared with reference to WHO
guidelines (Table 3).
Page 9/18Table 3
Comparison of air pollutants reported before and after lockdown across the globe
Country Locations Before Lockdown (before March 2020) After Lockdown (after March 2020) Reference
NO2 SO2 CO O3 PM2.5 NO2 SO2 CO O3 PM2.5
India Delhi 45.59 16.08 1.03 34.05 80.51 20.16 13.19 0.72 34.32 37.75 Mahato
et al.,
2020
China* 44 cities - - - - - 13.66 6.76 4.58 - 5.93 Bao &
Zhang.,
2020
Brazil Sao Paulo 24.4 - 0.4 40.2 12.4 19.2 - 0.1 44.6 12.4 Nakada &
Urban.,
2020
Rio de Bangu -1.8 - -15.2 - 33.5 -16.8 - -42.4 -7.8 - Dantas et
Janeiro† al., 2020
Iraja 28.8 - - - 31.1 1.4 - - -2.7 - Dantas et
al., 2020
Tijuca - - 12 - 63 - - -30.3 34 - Dantas et
al., 2020
Kazakhstan Almaty 37 49 674 30 27 24 52 343 34 38 Kerimray
et al.,
2020
China Yangtze 50 7 0.9 43 56 40 6 0.7 64 30 Li et al.,
River Delta 2020
Europea Nice 30.9 - - 39.5 10.9 12.5 - - 77.6 12.4 Sicard et
al., 2020
Rome 46.4 33.3 21.8 21.5 61.9 14.3 Sicard et
al., 2020
Turin 51.3 25.2 37.6 23.9 64.4 16.6 Sicard et
al., 2020
Valencia 27.8 31.6 18.8 8.3 65.8 10.7 Sicard et
al., 2020
Mexico 2020 January to March April to May
Benito 46.75 17.39 16.88 62.27 27.13 36.26 7.70 8.38 84.97 32.63 Present
Juárez study
Gustavo A. 48.93 - - 73.21 36.82 41.15 - - 94.79 3.71
Madero
Santa Fe 39.01 9.79 9.63 72.10 29.33 31.81 3.94 3.94 78.16 34.28
UAM 28.36 11.64 9.41 73.60 33.83 34.74 5.94 5.91 96.76 39.62
Xochimilco
WHO - 200/ 20/24 - 100/8 25/ 200/ 20/24 - 100/8 25/
Guidelines hr hr hr 24 hr hr hr hr 24 hr
a
Mean concentrations recorded at four station before and during lockdown; All values in µg/m3 (except CO as mg/m3); *Air Quality
Index; †Variation in the air pollutants (%)
NO2 values after the lockdown period in Mexico City is high compared to other countries, which is mainly due to the direct emissions
from vehicles. Likewise, SO2 and CO values indicate spike in some monitoring stations (especially in Benito Juárez), but it was lower
than the permissible limits of WHO. The higher values in BJ alone is mainly due to topographical features of the station and the wind
direction S-SSE-SE. Ozone values were well within the permissible limits of WHO, but it two to three fold higher than other countries.
PM2.5 values were higher in Mexico City when compared to other countries as well as WHO values which is mainly attributed to the
photochemical reactions and solar radiations of the primary pollutants (Garcia-Yee et al., 2018; Sicard et al., 2020).
Page 10/18Conclusion
Mexico City is well known as one of the most polluted cities in North America and the present article focuses on the changes in the air
quality status amid the present pandemic which has shook the whole world in one way or the other.
Primary and secondary data sets were generated to monitor the pollutants (NO2, SO2, CO, O3 and PM2.5) in four different monitoring
stations located in the Mexico City area. The results indicate that higher values in GAM for all the pollutants which is two to three fold
higher than the WHO permissible limits. The increase in pollutants were mainly due to the meteorological factors like rainfall,
temperature, relative humidity, wind speed and its direction which foster the photochemical reaction. This is very well supported by the
evaluation of statistical analysis indicating that the enrichment of pollutants (NO2, SO2, CO) were from vehicular fleet and industries.
The higher temperatures often promote the intense photochemical reactions which enhances the formation of O3 and PM2.5 which is
observed in all the stations despite the lockdown period which were are highly controlled by the wind direction and precipitation. It is
clearly observed that Mexico City suffers severe air pollution through both natural as well as anthropogenic ways and the persistency of
the pollutants happens via broad channel in the narrow passage (Tenango del Aire) and Cuautla-Cuernavaca Valley in the south. It is
clear that the government should form strong strategies towards air quality management tools with updated technology for both
transport vehicles and cars with changes in emissions standards, which will help cooperate restore the air quality standards.
Abbreviations
BJ: Benito Juárez; CO: Carbon monoxide; GAM: Gustavo A Madero; MCMA: Mexico City Metropolitan Area; MIAI: Monthly industrial
activity índices; MOBILE 6.2: Mobile Source Emission Factor Model for Mexico; NO2: Nitrogen dioxide, O3: Ozone; PM2.5: Particulate
matter; SFE: Santa Fe; SO2: Sulfur dioxide; UAM: Universidad Autónoma de Metropolitana; WHO: World Health Organization
Declarations
Ethics approval and consent to participate
Not applicable
Consent for publication
Not applicable
Availability of data and materials
All data generated or analyzed during this study are included in this published article (and its supplementary information files)
Competing interests
All authors certify that they have no affiliations with or involvement in any organization or entity with any financial interest or non-
financial interest in the subject matter or materials discussed in this manuscript.
Funding
No funds, grants or other support was received.
Author´s contributions
Conceptualization: Sakthi Selvalakshmi Jeyakumar, Jonathan Muthuswamy Ponniah; Data curation: Sakthi Selvalakshmi Jeyakumar,
Gopalakrishnan Gnanachandrasamy, Sandra Soledad Morales-García, Pedro Francisco Rodriguez-Espinosa; Formal analysis: Sakthi
Selvalakshmi Jeyakumar, Gopalakrishnan Gnanachandrasamy; Funding acquisition: Jonathan Muthuswamy Ponniah; Investigation:
Gopalakrishnan Gnanachandrasamy, Pedro Francisco Rodriguez-Espinosa, Diana Cecilia Escobedo-Urias; Methodology: Sakthi
Selvalakshmi Jeyakumar, Gopalakrishnan Gnanachandrasamy, Gowrapan Muthusankar; Diana Cecilia Escobedo-Urias; Project
administration: Jonathan Muthuswamy Ponniah; Resources: Jonathan Muthuswamy Ponniah; Software: Sakthi Selvalakshmi
Jeyakumar, Jonathan Muthuswamy Ponniah, Gopalakrishnan Gnanachandrasamy, Gowrapan Muthusankar; Supervision: Jonathan
Muthuswamy Ponniah; Validation: Sandra Soledad Morales-García, Pedro Francisco Rodriguez-Espinosa, Gowrapan Muthusankar,
Page 11/18Diana Cecilia Escobedo-Urias; Visualization: Jonathan Muthuswamy Ponniah; Roles/Writing - original draft: Sakthi Selvalakshmi
Jeyakumar, Jonathan Muthuswamy Ponniah; Writing - review & editing: Sakthi Selvalakshmi Jeyakumar, Jonathan Muthuswamy
Ponniah.
Acknowledgement
SSJ wishes to thank CONACyT (Mexico) for the research fellowship. SSMG, PFRE and DCEU wishes to express their gratitude to
Sistema Nacional de Investigadores (SNI), CONACyT, Mexico. This work is a partial contribution from the Earth System Science Group
(ESSG), Mexico & Chennai India (Participating members: JSS, GMS and MPJ.
References
1. Barrett B, Raga G (2016) Variability of winter and summer surface ozone in Mexico City on the intraseasonal time scale.
Atmospheric Chemistry Physics 16(23):15359–15370. https://doi.org/10.5194/acp-16-15359-2016
2. Bel G, Holst M (2018) Evaluation of the impact of Bus Rapit Transit on air pollution in Mexico City. Transp Policy, 63, 209–220.
https://doi.org/10.1016/ j.tranpol.2018.01.001
3. Buchholz RR, Paton-Walsh C, Griffith DWT, Kubistin D, Fisher JA, Deutscher NM, Kettlewell G, Riggenbach M, Macantangay R,
Krummel PB, Langenfelds RL (2016) Source and meteorological influences on air quality (CO, CH4 & CO2) at a Southern
Hemisphere urban site. Atmos Environ 126:274–289. http://dx.doi.org/10.1016/j.atmosenv.2015.11.041
4. CENAPRED (2020) Centro Nacional De Prevención De Destres. Reportes del volcán Popocatépetl.
http://www.cenapred.unam.mx/reportesVolcanGobMX. (Accessed on 18/08/2020)
5. Chin M, Jacob DJ, Munger JW (1994) Relationship of ozone and carbon monoxide over North America. J Geophys Res
99(D7):14565–14573. https://doi.org/10.1029/94JD00907
6. Cohen Y, Petetin H, Thouret V, Marécal V, Josse B, Clark H, Boulanger D (2018) Climatology and long-term evolution of ozone and
carbon monoxide in the upper troposphere–lower stratosphere (UTLS) at northern mid-latitudes, as seen by IAGOS from 1995 to
2013. Atmospheric Chemistry Physics 18(8):5415–5453. https://doi.org/10.5194/acp-18-5415-2018
7. Collins CO, Scott SL (1993) Air pollution in the valley of Mexico. Geographical Reviews 2:119–133.
https://doi.org/10.1016/j.atmosres.2017.04.035
8. Davis LW (2008) The effect of driving restrictions on air quality in Mexico City. J Polit Econ 116(1):38–81.
https://doi.org/10.1086/529398
9. De Foy B, Krotkov NA, Bei A, Herndon N, Huey LG, Martínez A-P, Ruíz-Suárez LG, Wood EC, Zavala M, Molina LT (2009) Hit from both
sides: Tracking industrial and volcanic plumes in Mexico City with surface measurements and OMI SO2 retrievals during the
MILAGRO field campaign. Atmospheric Chemistry Physics 9:9599–9617. https://doi.org/10.5194/acp-9-9599-2009
10. De Foy B, Varela JR, Molina LT, Molina MJ (2006) Rapid ventilation of the Mexico City basin and regional fate of the urban plume.
Atmospheric Chemistry Physics 6:2321–2335. https://doi.org/10.5194/acp-6-2321-2006
11. Deng JJ, Wang TJ, Liu L, Jiang F (2010) Modeling heterogeneous chemical processes on aerosol surface. Particuology, 8, 308–
318. https://doi.org/ 10.1016/j.partic.2009.12.003
12. Eatough D, Caka F, Farber R (1994) The Conversion of SO2 to Sulfate in the Atmosphere. Isr J Chem, 34, 301–314. https://doi.org/
10.1002/ijch.199400034
13. Edgerton SA, Bian X, Doran JC, Hubbe JM, Malone EL, Shaw WJ, Whiteman CD, Zhong S, Arriaga JL, Ortiz E, Ruiz M, Sosa G, Vega
E, Limon T, Guzman F, Archuleta J, Bossert JE, Elliot SM, Lee JT, McNair LA, Chow JC, Watson JC, Coulter R, Doskey PV, Gaffney JS,
Marley NA, Neff W, Petty R (1999) Particulate Air Pollution in Mexico City: A collaborative Research Project. J Air Waste Manag
Assoc 49:10–1221. https://doi.org/10.1080/10473289.1999.10463915
14. Fast JD, de Foy B, Rosas FA, Caetano E, Carmichael G, Emmons L, McKenna D, Mena M, Skamarock W, Tie X, Coulter RL, Barnard
JC, Wiedinmyer C, Madronich S (2007) A meteorological overview of the MILAGRO field campaigns. Atmospheric Chemistry
Physics 7:2233–2257. https://doi.org/10.5194/acp-7-2233-2007
15. García-Franco JL (2020) Air Quality in Mexico City during the fuel shortage of January 2019. Atmos Environ, 222, 117131.
https://doi.org/ 10.1016/j.atmosenv.2019.117131
16. García-Franco J, Stremme W, Bezanilla A, Ruiz-Angulo A, Grutter M (2018) Variability of the mixed-layer height over Mexico City.
Bound-Layer Meteorol 167(3):493–507. https://doi.org/10.1007/s10546-018-0334-x
Page 12/1817. Garcia-Reynoso A, Jazcilevich A, Ruiz-Suarez LG, Torres-Jardon R, Lastra MS, Juarez NAR (2009) Ozone weekend effect analysis in
Mexico City. Atmosfera 22:281–297
18. García-Yee JC, Torres-Jardón R, Barrera-Huertas H, Castro T, Peralta O, García M, Gutiérrez W, Robles M, Torres-Jaramillo JA, Ortínez-
Álvarez A, Ruiz-Suárez LG (2018) Characterization of NOx- Ox relationships during daytime interchange of air masses over a
mountain pass in the Mexico City megalopolis. Atmos Environ, 22, 100–110. https://doi.org/10.1016/ j.atmosenv.2017.11.017
19. Garrido-Perez JM, Ordóñez C, Garcia-Herrera R, Barriopedro D (2018) Air stagnation in Europe: spatiotemporal variability and impact
on air quality. Sci Total Environ, 645, 1238–1252. https://doi.org/10.1016/ j.scitotenv.2018.07.238
20. Garzón JP, Huertas JI, Magaño M, Huertas ME, Cárdenas B, Watanabe T, Maeda T, Wakamatsu S, Blanco S (2015) Volatile organic
compounds in the atmosphere of Mexico City. Atmos Environ 119:415–429. https://doi.org/10.1016/j.atmosenv.2015.08.014
21. Giovanni C, Estévez HR, Valdés-Barrón M, Bonifaz-Alfonzo R, Riveros-Rosas D, Velasco-Herrera VM, Vázquez-Gálvez FA (2017)
Aerosol climatology over the Mexico City basin: Characterization of optical properties. Atmos Res 194:190–201.
https://doi.org/10.1016/j.atmosres.2017.04.035
22. Gómez-Perales J, Colvile R, Nieuwenhuijsen M, Fernández-Bremauntz A, Gutiérrez- Avedoy V, Páramo-Figueroa V, Blanco-Jiménez S,
Bueno-López E, Mandujano F, Bernabé-Cabanillas R, Ortiz-Segovia E (2004) Commuters' exposure to PM2.5, CO, and benzene in
public transport in the metropolitan area of Mexico City. Atmos Environ 38:1219–1229.
https://doi.org/10.1016/j.atmosenv.2003.11.008
23. Guevara M, Tena C, Soret A, Serradell K, Guzmán D, Retama A, Camacho P, Jaimes- Palomera M, Mediavilla A (2017) An emission
processing system for air quality modelling in the Mexico City Metropolitan Area: Evaluation and comparison of the MOBILE6.2-
Mexico and MOVES-Mexico traffic emissions. Sci Total Environ, 584–585, 882–900. https://doi.org/10.1016/
j.scitotenv.2017.01.135
24. Hernández-Paniagua IY, Andraca-Ayala GL, Diego-Ayala U, Ruiz-Suarez LG, Zavala-Reyes JC, Cid-Juárez S, Torre-Bouscoulet L,
Gochicoa-Rangel L, Rosas-Párez I, Jazcilevich A (2018) Personal exposure to PM2.5 in the mega City of Mexico: a multi-mode
transport study. Atmosphere, 9 (2), 57. https://doi.org/ 10.3390/atmos9020057
25. Holgate ST (2017) Every breath we take: the lifelong impact of air pollution–a call for action. Clin Med 17(1):8–12.
https://doi.org/10.7861/clinmedicine.17-1-8
26. Howard PH (1991) Handbook of environmental degradation rates. 1st Edition, Boca Raton Publs., 776p
27. Instituto Nacional de Ecologia (INE) (1998) Segundo Informe sobre la Calidad del Aire en Ciudades Mexicanas – 1997, Mexico City,
online available at: https://sinaica.inecc .gob .mx /archivo /informes /2doInforme .pdf
28. Instituto Nacional de Estadística Geografía (INEGI) (2017) Encuesta origen-destino en hogares de la Zona Metropolitana del Valle
de México (EOD 2017). http://www.be ta.inegi.org.mx/proyectos/enchogares/especiales/eod/2017/
29. Instituto Nacional de Estadística Geografía (INEGI) (2018) Available online: https://www.inegi.org.mx/temas/transporteurb/2018-
Red de Transporte de Pasajeros
30. Instituto Nacional de Estadística Geografía (INEGI) (2020) Transportes/Información general
31. Khoder M (2002) Atmospheric conversion of sulfur dioxide to particulate sulfate and nitrogen dioxide to particulate nitrate and
gaseous nitric acid in an urban area. Chemosphere 49:675–684. https://doi.org/10.1016/s0045-6535(02)00391-0
32. Koupal J, Palacios C (2019) Impact of new fuel specifications on vehicle emissions in Mexico. Atmos Environ, 201, 41–49.
https://doi.org/10.1016/ j.atmosenv.2018.12.028
33. Lin CA, Chen YC, Liu CY, Chen WT, Seinfeld JH, Chou CCK (2019) Satellite – Derived correlation of SO2, NO2 and aerosol optical
depth with meteorological conditions over East Asia from 2005 to 2015. Remote Sensing 11:01738.
https://doi.org/10.3390/rs11151738
34. Lévesque B, Allaire S, Gauvin D, Koutrakis P, Gingras S, Rhainds M, Prud′Homme H, Duchesne J-F (2001) Wood burning appliances
and indoor air quality. Sci Total Environ, 281 (1–3), 47–62. https://doi.org/ 10.1016/S0048-9697(01)00834-8
35. Lezama JL (2000) Aire dividido, Crítica a la política del aire en el Valle de México. El Colegio de México, México
36. Le Quere C, Jackson RB, Jones MW, Smith AJP, Abernethy S, Andrew RM, De-Gol AJ, Wills DR, Shan Y, Canadell JG, Friedlingstein P,
Creutzig F, Peters GP (2020) Temporary reduction in daily global CO2 emissions during the COVID-19 forced confinement. Nature
Climate Change, 10, 647–653. https://doi.org/ 10.1038/s41558-020-0797-x
37. Liu H, Wang XM, Pang JM, He KB (2013) Feasibility and difficulties of China’s new air quality standard compliance: PRD case of
PM2.5 and ozone from2010 to 2025. Atmospheric Chemistry Physics 13:12013–12027. https://doi.org/10.5194/acp-13-12013-
Page 13/182013
38. Del-Pozzo M AL (2009) Precursors to eruptions of Popocatépetl Volcano. Mexico Geofísica Internacional 51(1):87–107
39. Maroni M, Carrer P, Cavallo D, Jantunen M, Katsouyanni K, Kuenzli N (2002) Air pollution exposure of adult population in Milan
(Expolis study). In: Procd. of Indoor Air 2002, The 9th Int. Conf, 4. on Indoor Air Quality & Climate, Monterey, pp 455–460
40. Molina LT, Kolb CE, de Foy B, Lamb BK, Brune WH, Jimenez JL, Ramos-Villegas R, Sarmiento J, Paramo-Figueroa VH, Cardenas B,
Gutierrez-Avedoy V, Molina MJ (2007) Air quality in North America's most populous City – overview of the MCMA- 2003 campaign.
Atmospheric Chemistry Physics 7:2447–2473. https://doi.org/10.5194/acp-7-2447-2007
41. Molina LT, Velasco E, Retama A, Zaval M (2019) Experience from Integrated Air Quality Management in the Mexico City
Metropolitan Area and Singapore. Atmosphere, 10 (9), 512. https://doi.org/10.3390/atmos10090512
42. Molina LT, Molina MJ (2002) Air Quality in the Mexico MegaCity: An Integrated Assessment. Kluwer Academic Publishers, 384p
43. Morales-García SS, Rodríguez-Espinosa PF, Jonathan MP, Navarrete-López M, Herrera- García MA, Muñoz-Sevilla NP (2014)
Characterization of As and trace metals embedded in PM10 particles in Puebla City, México. Environmental Monitoring Assessment,
186, 55–67. https://doi.org/ 10.1007/s10661-013-3355-4
44. Murphy JG, Day DA, Cleary PA, Wooldridge PJ, Millet DB, Goldstein AH, Cohen RC (2007) The weekend effect within and downwind
of Sacramento – part 1: observations of ozone, nitrogen oxides, and VOC reactivity. Atmospheric Chemistry Physics 7:5327–5339.
https://doi.org/10.5194/acpd-6-11427-2006
45. Raibhandari B, Phuyal N, Shrestha B, Thapa M (2020) Air medical evacuation of Nepalese citizen during epidemic of COVID-19
from Wuhan to Nepal. Journal of Nepal Medical Association 58(222):125–133. https://doi.org/10.31729/jnma.4857
46. Retama A, Neria-Hernández A, Jaimes-Palomera M, Rivera-Hernández O, Sánchez-Rodríguez M, López-Medina A, Velasco E (2019)
Fireworks: A major source of inorganic and organic aerosols during Christmas and New Year in Mexico City. Atmospheric
Environment X, 2, 100013. https://doi.org/10.1016/ j.aeaoa.2019.100013
47. Rodrigues RR, Woollings T (2017) Impact of atmospheric blocking on South America in austral summer. J Clim, 30 (5), 1821–1837.
https://doi.org/ 10.1175/JCLI-D-16-0493.1
48. Salcedo D, Castro T, Ruiz-Suárez LG, García-Reynoso A, Torres-Jardón R, Torres- Jaramillo A, Mar-Morales BE, Salcido A, Celada AT,
Carreón-Sierra S, Martínez AP, Fentanes-Arriaga OA, Deustúa E, Ramos-Villegas R, Retama- Hernández A, Saavedra MI, Suárez-
Lastra M (2012) Study of the regional air quality south of Mexico City (Morelos state). Sci Total Environ 414:417–432.
https://doi.org/10.1016/j.scitotenv.2011.09.041
49. Schiavo B, Morton-Bermea O, Salgado-Martinez E, Hernandez-Alvarez E (2020) Evaluation of possible impact on human health of
atmospheric mercury emanations from the Popocatépetl volcano. Environmental Geochemistry Health, 1–13.
https://doi.org/10.1007/s10653-020-00610-6
50. SEDEMA-CDMX (2018) Inventario de Emisiones de la Ciudad de México 2016: contaminantes criterio, tóxicos y compuestos de
efecto invernadero. Secretaría del Medio Ambiente de la Ciudad de México. Dirección General de Gestión de la Calidad del Aire,
Dirección de Programas de Calidad del Aire e Inventario de Emisiones
51. Shiohara N, Fernández-Bremauntz A, Blanco-Jiménez S, Yanagisawa Y (2005) The commuters' exposure to volatile chemicals and
carcinogenic risk in Mexico City. Atmos Environ, 39, 3481–3489. https://doi.org/ 10.1016/j.atmosenv.2005.01.064
52. Sicard P, De Marco A, Agathokleous E, Feng Z, Xu X, Paoletti E, Rodriguez JJD, Calatayud V (2020) Amplified ozone pollution in
cities during the COVID-19 lockdown. Sci Total Environ 735:139542. https://doi.org/10.1016/j.scitotenv.2020.139542
53. Silva-Quiroz R, Rivera AL, Ordoñez P, Gay-Garcia C, Frank A (2019) Atmospheric blockages as trigger of environmental.
contingencies in Mexico City Heliyon 5:e02099. https://doi.org/10.1016/j.heliyon.2019.e02099
54. Soto-Coloballes NV (2017) El control de la contaminación atmosférica en México (1970–1980): tensiones y coincidencias entre el
sector salud y los industriales. Dynamis 37(1):187–209
55. Su FC, Mukherjee B, Batterman S (2003) Determinants of personal, indoor and outdoor VOC concentrations: an analysis of the
RIOPA data. Environ Res 126:192–203. https://doi.org/10.1016/j.envres.2013.08.005
56. United Nations (2018) Revision of World Urbanization Prospects. Available online:
https://www.un.org/development/desa/publications/2018-revision-of-world-urbanization-prospects.html
57. Veefkind JP, Aben I, McMullan K, Förster H, De Vries J, Otter G, Claas J, Eskes HJ, De Haan JF, Kleipool Q, Van Weele M, Hasekamp
O, Hoogeveen R, Landgraf J, Snel R, Tol P, Ingmann P, Voors R, Kruizinga B, Vink R, Visser H, Levelt PF (2012) TROPOMI on the ESA
Page 14/18You can also read