Monitoring for Changes in Spring Phenology at Both Temporal and Spatial Scales Based on MODIS LST Data in South Korea - MDPI
←
→
Page content transcription
If your browser does not render page correctly, please read the page content below
remote sensing
Article
Monitoring for Changes in Spring Phenology at Both
Temporal and Spatial Scales Based on MODIS LST
Data in South Korea
Chi Hong Lim 1 , Song Hie Jung 2 , A Reum Kim 3 , Nam Shin Kim 1 and Chang Seok Lee 4, *
 1    Division of Ecological Survey Research, National Institute of Ecology, 1210 Geumgang-no, Maseo-myeon,
      Seocheon 33657, Korea; sync03@nie.re.kr (C.H.L.); geotop@nie.re.kr (N.S.K.)
 2    Gwangneung Forest Conservation Center, Korea National Arboretum, 415 Gwangneungsumogwon-ro,
      Soheul-eup, Pocheon 11186, Korea; jung2024@nie.re.kr
 3    Graduate School of Seoul Women’s University, Seoul Women’s University, 621 Hwarang-no, Nowon-gu,
      Seoul 01797, Korea; dkfma@swu.ac.kr
 4    Division of Chemistry and Bio-Environmental Sciences, Seoul Women’s University, 621 Hwarang-no,
      Nowon-gu, Seoul 01797, Korea
 *    Correspondence: leecs@swu.ac.kr

 Received: 20 August 2020; Accepted: 7 October 2020; Published: 9 October 2020

 Abstract: This study aims to monitor spatiotemporal changes of spring phenology using the green-up
 start dates based on the accumulated growing degree days (AGDD) and the enhanced vegetation
 index (EVI), which were deducted from moderate resolution imaging spectroradiometer (MODIS)
 land surface temperature (LST) data. The green-up start dates were extracted from the MODIS-derived
 AGDD and EVI for 30 Mongolian oak (Quercus mongolica Fisch.) stands throughout South Korea.
 The relationship between green-up day of year needed to reach the AGDD threshold (DoYAGDD)
 and air temperature was closely maintained in data in both MODIS image interpretation and from
 93 meteorological stations. Leaf green-up dates of Mongolian oak based on the AGDD threshold
 obtained from the records measured at five meteorological stations during the last century showed
 the same trend as the result of cherry observed visibly. Extrapolating the results, the spring onset of
 Mongolian oak and cherry has become earlier (14.5 ± 4.3 and 10.7 ± 3.6 days, respectively) with the
 rise of air temperature over the last century. The temperature in urban areas was consistently higher
 than that in the forest and the rural areas and the result was reflected on the vegetation phenology.
 Our study expanded the scale of the study on spring vegetation phenology spatiotemporally by
 combining satellite images with meteorological data. We expect our findings could be used to predict
 long-term changes in ecosystems due to climate change.

 Keywords: AGDD; climate change; EVI; MODIS LST; Mongolian oak; phenology

1. Introduction
     Global climate change can lead to meaningful changes in plant phenology as temperature affects
the timing of development, not only alone but also by interacting with other factors, such as the
photoperiod [1,2]. A number of recent studies showed that the growing season of vegetation has
been extended by recent climate change [3–9] and this extension mostly results from the earlier onset
of spring. Many of those studies have reported a correlation between earlier spring phenology and
rising temperature but have showed different effects on the end of the growing season [1,10–15].
Therefore, spring phenology is the most indisputable monitoring tools for the seasonality of plant
species [5,13,16–18]. Spring phenology is thought to greatly affect the productivity and carbon budget
of temperate and boreal ecosystems [17,19]. In addition, difference among species in spring phenology

Remote Sens. 2020, 12, 3282; doi:10.3390/rs12203282                       www.mdpi.com/journal/remotesensing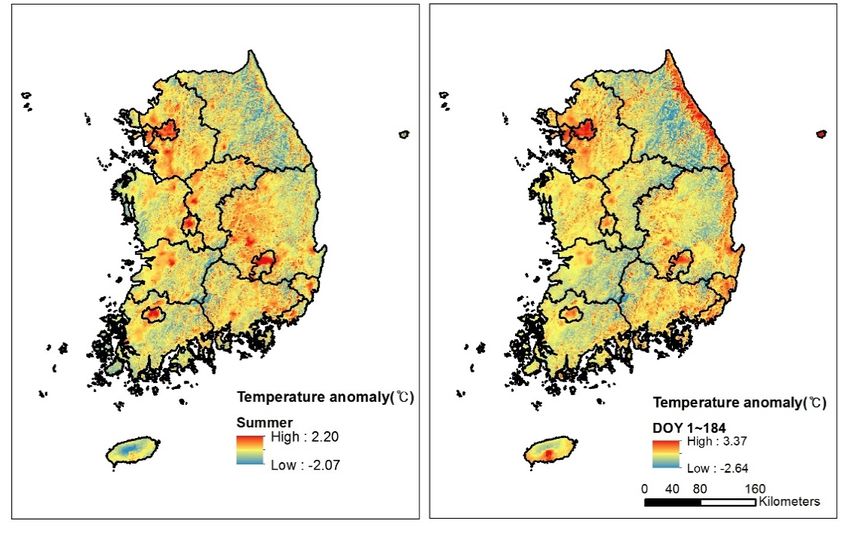
Remote Sens. 2020, 12, 3282                                                                         2 of 25

is a significant mechanism for maintaining the coexistence of species in diverse plant communities by
reducing competition for pollinators and other resources [1,20,21].
      Earlier spring green-up due to climate change can increase risk of a false spring, when subsequent
hard freezes damage new, vulnerable plant growth in ecological and agricultural systems [22–24].
Therefore, the climate-driven changes in the phenology of plant species are not only the simple change
of phenomena but also the change of ecological functions. For example, phenological mismatches due
to the time shifts might occur when organisms that typically interact, such as plants and pollinators,
are no longer active at the same time [25,26]. According to Kudo and Ida [27], although both the onset
of flowering and the first appearance of overwintered queen bees in Corydalis ambigua populations
were closely related to snowmelt time and/or spring temperature, flowering tended to be ahead of the
first pollinator appearance when spring came early, resulting in lower seed production due to low
pollination services.
      Land use pattern can account for much of the temperature variation [28]. In particular, urbanization
is increasingly having an important anthropogenic impact on climate and has significantly influenced
terrestrial ecosystems [29–32]. It can modify the local climate on daily, seasonal, and annual scales [33–
36]. The changes in climate due to intensive land-use by humankind in urban areas can therefore be
regarded as a kind of climate change on a local scale. The change in the local climate as a result of a
distinguishing land-use pattern in an urban area is often referred as the urban heat island (UHI) effect.
The UHI effect is recognized as being caused by a reduction in the latent heat flux and an increase
in sensible heat in urban areas as vegetated and evaporating soil surfaces are replaced by pavement
and building materials with relatively impervious and low albedo [37–40]. Consequently, cities are
exposed to climate change from greenhouse gas-induced radiative forcing, and localized effects from
urbanization such as the urban heat island. Warming and extreme heat events due to urbanization
and increased energy consumption are simulated to be as large as the impact of doubled CO2 in some
regions [41].
      Numerous techniques to observe how phenology has changed, including ground-based
observations [6,42–44], digital repeat photography [45–49], and satellite remote sensing [7,16,23,50–52]
have been developed. Among these techniques, satellite remote sensing is taking the spotlight because
of the advantage of providing multi-decadal records of vegetation phenology across larger spatial scales
than other techniques [53–55]. In particular, advances in both temporal and spatial resolutions and
ease of availability in recent years have made remotely sensed data derived from moderate resolution
imaging spectroradiometer (MODIS) the most generally used datasets in phenological observation at
the extensive scale such as regional and global levels [52,56–58]. In addition, as novel algorithms are
developed to resolve the critical limitations of the satellite measurement such as cloud contamination
and cloud shadow effect [57,59–67].
      This study was carried out to monitor changes of vegetation phenology due to climate change. To
carry out this study, we established the following hypotheses: First, the green-up date of the Mongolian
oak will respond to the accumulative value of the temperature at which the physiological activity
of the plant is initiated. Second, the green-up date of the Mongolian oak will be spatially different
depending on local climate conditions. Third, the green-up date of the Mongolian oak will be advanced
according to climate change. Fourth, urbanization will bring about a change in the green-up date of
the Mongolian oak.
      To verify these hypotheses, we analyzed the relationship between the temperature and the
vegetation phenology data obtained from MODIS images for 30 representative Mongolian oak forest
sites selected based on the national inventory data for the natural environment that the Korean
government constructed. To verify this data, we analyzed the relationship between day of year (DoY;
159 accumulated growing degree days (AGDD)) and average temperature based on weather data from
all 93 meteorological stations in South Korea. To trace the temporal variation of phenology that the
Mongolian oak showed over the past century, we traced the change in DoY (159 AGDD) based on
weather data from the five major cities that have been measuring weather data for the longest period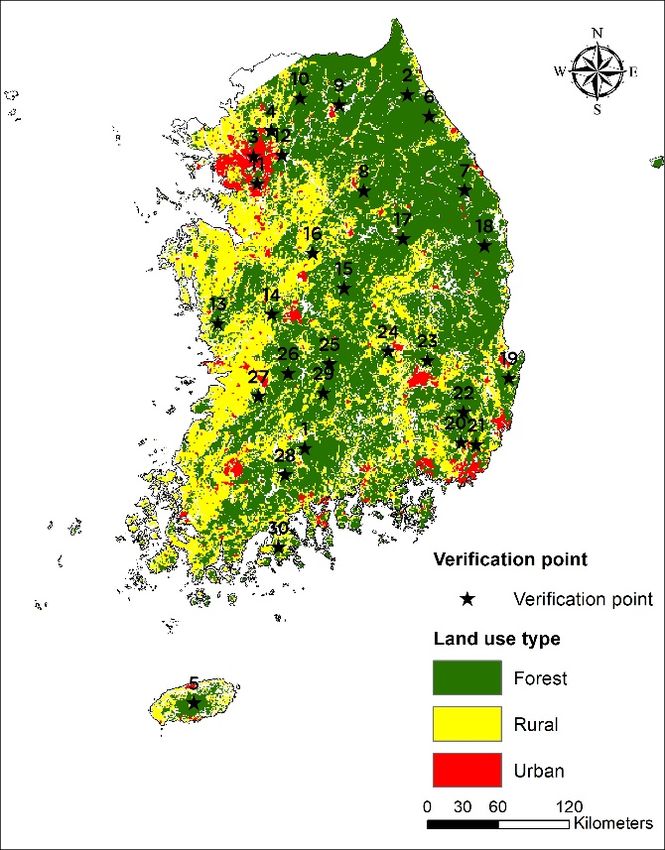
Remote Sens. 2020, 12, 3282                                                                                    3 of 25

in Korea. On the other hand, we analyzed the cherry blossom date data of five major cities in Korea,
which have been surveying cherry blossom dates for a long time to re-validate the temporal variation
of the green-up date of the Mongolian oak deducted from the temperature data. Finally, we analyzed
the spatial variation of temperature anomaly throughout South Korea and by land-use type of urban,
rural, and forest areas.

2. Materials and Methods

2.1. Study Area
     In the study of vegetation phenology, it is necessary to select pure stands to reduce errors
from differences in phenology according to plant species. Mongolian oak (Quercus mongolica Fisch.)
forest, which dominates the temperate deciduous broadleaved forest zone, was selected as the target
vegetation for this study (Figure 1). The phenological signal of canopy reflectance from deciduous
broadleaved forests can be clearly defined, ensuring accurate measurement of the change in growing
season. Therefore, we selected Mongolian oak (Quercus mongolica Fisch.), which is not only a dominant
species in the temperate deciduous broadleaved forest zone but also the representative species forming
the late successional forest on the Korean Peninsula, as the target species of this study. Among the
species belonging to the Quercus genus, Q. mongolica grows at the highest elevation and thus, would
likely be a species sensitive to global warming. Mongolian oak begins leaf unfolding and senescence
the earliest among deciduous oaks growing in Korea. Therefore, it is estimated that Mongolian
oak could be the best species to derive phenological transition date from MODIS image with low
 Remote Sens. 2020, 12, x FOR PEER REVIEW                                                         4 of 28
spatial resolution.

      Figure 1. Map of the study area and spatial distribution of the primary sampling points. Meteo-station:
       Figure 1. Map stations;
      Meteorological    of the study   area and
                                 Verification    spatial
                                              point:     distribution
                                                     Mongolian        of the primary
                                                                 oak (Quercus        sampling
                                                                              mongolica          points.selected
                                                                                        Fisch.) forests  Meteo-
       station:
      for       Meteorological stations; Verification point: Mongolian oak (Quercus mongolica Fisch.) forests
          validation.
       selected for validation.

2.2. Experimental Design
    The overall procedure of the experiments was shown in Figure 2. We selected 30 representative
Mongolian oak forest sites based on the national inventory data for the natural environment that the
Korean government constructed. The Mongolian oak forest is a typical late successional forest of the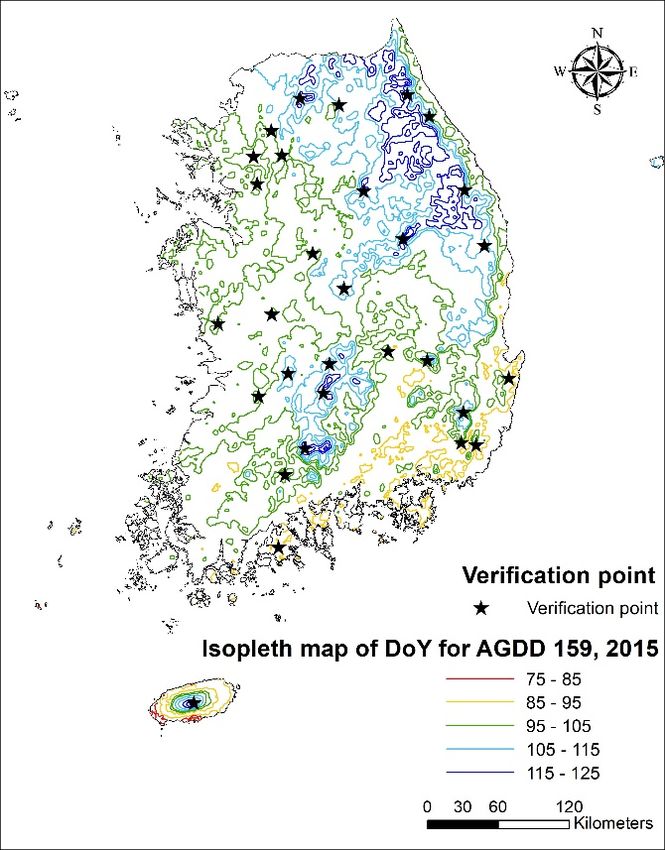
Remote Sens. 2020, 12, 3282                                                                                 4 of 25

      In order to verify the green-up date of Mongolian oak deducted from the temperature data
obtained from MODIS image of 1 km spatial resolution, meteorological data were collected from all (93)
meteorological stations in South Korea. Moreover, meteorological data were collected from five major
cities that have been measuring weather data for the longest period in Korea to deduce the change of
green-up dates of Mongolian oak over year. Furthermore, cherry blossom data were collected from the
same cities that have been observing flowering of the cherry visibly for the longest period in Korea
to verify the change of green-up dates of Mongolian oak deducted from temperature variation over
the year.

2.2. Experimental Design
      The overall procedure of the experiments was shown in Figure 2. We selected 30 representative
Mongolian oak forest sites based on the national inventory data for the natural environment that
the Korean government constructed. The Mongolian oak forest is a typical late successional forest
of the Sens.
Remote temperate
             2020, 12,deciduous    broadleaved forest, and thus the forest is located relatively far from
                      x FOR PEER REVIEW                                                                       the
                                                                                                            7 of 28
human living environment. Therefore, it is very difficult to obtain weather data from the site where
of mean
this forestairwas
               temperature
                   formed and,anomaly   among
                                  thereby,       the threetemperature
                                           we obtained      land-use types.
                                                                       dataThe  linear regression
                                                                            by analyzing    MODISanalysis     was
                                                                                                     image data.
performed      by   using  Microsoft   Excel 2016   software   (Microsoft Corp.,     ◦
                                                                                  Redmond,
We deducted DoY (159 AGDD), the period required to reach AGDD 159 C necessary for the leaf      WA,   USA),   and
Pearson’s of
unfolding    correlation   test and
                the Mongolian     oakANOVA
                                      obtainedtest were performed
                                                through              by using
                                                          previous research   SigmaPlot
                                                                            (Lim           12.0based
                                                                                  et al. [60])  software  (Systat
                                                                                                     on the  data
Software
and         Inc.,the
     clarified     Chicago,  IL, USA).
                     relationship   between DoY (159 AGDD) and the average temperature.

                Figure 2. Flowchart showing the overall process of data processing and experiment.
                Figure 2. Flowchart showing the overall process of data processing and experiment.
     To verify this data, we analyzed the relationship between DoY (159 AGDD) and the average
3. Results
temperature based on weather data from 93 stations in Korea. Based on these results, we tracked the
temporal variation of phenology that the Mongolian oak showed over the past century. These data
3.1. Spatial
were         Distribution
      re-validated         of Isopleth
                      through           of DoYon
                                the analysis   forthe
                                                   AGDD     159blossom date data of five major cities in Korea,
                                                       cherry
whichSpatial
       have been     surveying
               distribution   of cherry
                                 isopleth blossom
                                            of DoYdates    for a long
                                                     for AGDD      159time.
                                                                        was expressed on the topography and
     To enhance
land-use   type mapsthe (Figure
                        reliability
                                 3). of
                                     DoYthese
                                           forresults,
                                              AGDD we   159added
                                                            tendedmaps
                                                                    to be including   isopleth
                                                                          earlier in the       of DoY
                                                                                         sites with    for latitude
                                                                                                    lower   AGDD
159, 2015,  elevation,  and  the  land-use   type  and   geographical   and topographical    information
and altitude, where area located on the southern and western parts of South Korea. On the other            of  each
verification  site of
hand, an effect    as urbanization
                      Appendix A. on advancement of green-up dates was also confirmed from several
verification sites such as 3, 4, 11, 12, 19, 23, 24, and so on (Figure 3).
2.3. Data Collection and Pre-Processing
    The details for the remotely sensed available data sources by station are listed in Table 1. To
deduct spring green-up timing of Mongolian oak, we used an 8-d interval air temperature map dataset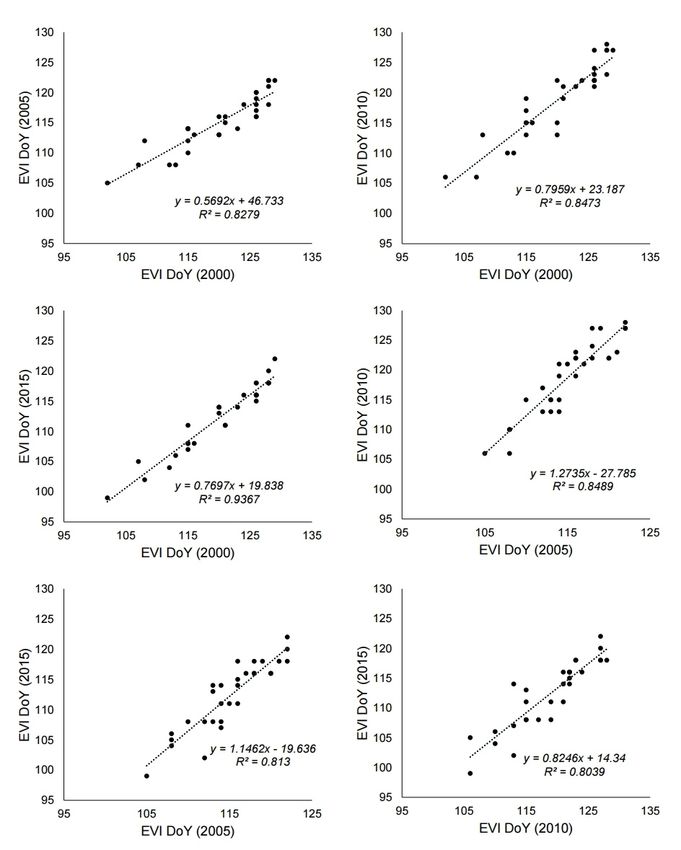
Remote Sens. 2020, 12, 3282                                                                                                     5 of 25

(1 km spatial resolution, root mean squared error: 3.91) in South Korea from January 1 to June 26 in
2015, which was reconstructed by Lim et al. [60] using MODIS land surface temperature (LST) imagery.
In addition, we collected the MODIS surface reflectance product (MOD09GA) from January 1 to June
26 in 2000, 2005, 2010, and 2015 to deduct the spring green-up date based on the enhanced vegetation
index (EVI).
     Daily air temperature data (minimum and maximum temperature) in meteorological stations
from January 1 2015 to July 2 2015 were obtained from KMA (Korea Meteorological Administration).
In addition, daily mean air temperature data from January 1 1907 to December 31 2014 and the first
flowering date of cherry (Prunus serrulata Lindl.) from 1921 to 2014 from five meteorological stations
were acquired from KMA (Table 1).
     To analyze the relationship between characteristics of air temperature and land-use intensity, a
MODIS land cover product (MCD12Q1.005) was downloaded from the Earthdata website of NASA
(now available at https://ladsweb.modaps.eosdis.nasa.gov/). The MODIS re-projection tool software
(MRT V4.1) was used to re-project from the original Sinusoidal (SIN) to a TIFF file using the Universal
Transverse Mercator projection (UTM Zone 52N, WGS84 ellipsoid). From the image, we extracted
the pixels labeled by urban, rural, and forest land-use types in the MODIS land-cover type product
(MCD12Q1). In addition, all water pixels were extracted for masking.

                                        Table 1. A summary for data used in the study.

                                                 Original
                     Data type                                     Time Period                 Utility               Source
                                                Resolution
                                                                                        Deduction of spring
                          Air temperature
                                                8 d, 1000 m     1/1/2015~6/26/2015     green-up date based on     Lim et al. [60]
                               dataset
                                                                                      AGDD for Mongolian oak
       MODIS                                                    1/1/2000~6/26/2000
                                                                                        Deduction of spring
       product                                                  1/1/2005~6/26/2005                                   NASA
                             MOD09A1             8 d, 500 m                            green-up date based on
                                                                1/1/2010~6/26/2010                                  Earthdata
                                                                                       EVI for Mongolian oak
                                                                1/1/2015~6/26/2015                                   website
                              MCD12Q1           Yearly, 500 m          2015            Land-use classification
                         First flowering date                                           Deduction of spring
                                                   Yearly           1921~2014
                               of cherry                                              green-up date for cherry
                                                                                        AGDD calculation to
                                                                1/1/1907~12/31/2014     extract phenological          Korea
    Meteorological
                       Air temperature record                                             ascending trend         Meteorological
     station data
                             (maximum,             Daily                                                          Administration
                                                                                      Deduction of relationship
                          minimum, mean)
                                                                                       between phenological
                                                                1/1/2015~7/2/2015
                                                                                        event dates based on
                                                                                          AGDD and EVI

2.4. Indices Calculation
      A series of indices that affect vegetation phenology, growing degree days (GDD; ◦ C·d), and
accumulated GDD (AGDD) were derived from the completely reconstructed 8-d air temperature maps.
We used air temperature dataset by MODIS in the previous study of Lim et al. [60]. In addition, from
the daily air temperature data, the AGDD at each station was calculated in the same way.
      First, growing degree days (GDD; ◦ C·d) were calculated using the equation from McMaster and
Wilhelm [68]:
                                             (Tmax·t + Tmin·t )
                                    GDDt =                      − Tbase                              (1)
                                                     2
where Tmax·t and Tmin·t are the maximum and minimum air temperatures at DoYt , respectively, and
Tbase is the temperature below which plant growth is zero. In this study, we set the base temperature as
5 ◦ C. In addition, the GDD based on meteorological station data were estimated to validate the GDD
derived from MODIS.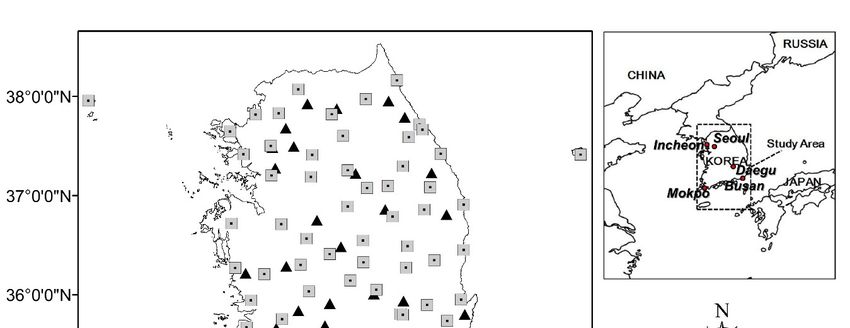
Remote Sens. 2020, 12, 3282                                                                        6 of 25

    We accumulated 8-d interval GDDs by simple summation when the GDD exceeded the base
temperature [3,57]:
                             GDDt−i + i × GDDt (GDDt > Tbase )                       (2)

where GDDt is the 8-d mean GDD at DoYt , and i is the time interval coefficient (GDD from MODIS: 8;
GDD from field measured data: 1), AGDDt is the GDDs accumulated from the beginning of the time
period until DoYt+7 .
      A study of Lim et al. [60] focused deduction of a meteorological indicator from reconstructed
MODIS image and discussed applicability of the indicator. We carried out a study that actually applied
the indicator. Furthermore, we extended the time range in conjunction with the weather data measured
in 93 meteorological stations throughout the whole national territory, and we verified the estimated
data compared to the phenology data of other plants, such as the cherry blossom date, which was
recorded over a long period.
      Based on 159 ◦ C·d, the average of AGDD threshold values determined from field measurements
when the spring green-up was started in Mongolian oak forests [60], a MODIS-derived AGDD threshold
map was generated by counting pixelwise the number of DoY (hereafter, DoYAGDD ) required to reach
the AGDD threshold to assess the timing of green-up of Mongolian oak throughout the whole national
territory of South Korea.
      To normalize the air temperature data, urban and water areas were masked. A linear regression
model was fitted to the remaining air temperature with elevation and coordinates of X and Y for
determining the constant and linear components of temperature. Based on the temperature map,
which was normalized by applying a regression model, the difference in air temperature between the
measured and normalized data was calculated:

                                               Ta·t = Tm·t − Tn·t                                     (3)

                                          ATa·t = ATa·(t−8) + i × Ta·t                                (4)

where Ta·t is the air temperature anomaly, and Tm·t and Tn·t are the measured air temperature and
normalized air temperature, respectively. Normalized air temperature means the temperature that can
reflect changes of the environmental conditions (altitude, longitude, latitude, etc.) on the natural land
surface (forest, agricultural land, etc.). ATa·t is the accumulated value of air temperature anomalies
from DoY1 until DoYt. i is the DoY interval coefficient, which ranges from 1 to 8.
     The EVI was calculated from the MODIS surface reflectance product based on Equation (5):

                                                    ρNIR − ρRED
                              EVI = G ×                                                               (5)
                                          ρNIR + C1 × ρRED − C2 × ρBLUE + L

where ρNIR, ρRED, and ρBLUE are near the infrared, red, and blue bands in MOD09A1, respectively.
L is the canopy background adjustment, C1 and C2 are the coefficients, and G is the gain factor. Then, a
bit-pattern analysis was implemented to remove the cloudy pixels identified by the information in
the state flags (16-bit unsigned integer). In order to deduct green-up dates from the EVI, we used a
sigmoid-based equation [63]. In the sigmoid model, phenological transition dates were attained by
obtaining maximum value in the rate of change of curvature.

2.5. Statistical Analysis
     We measured the linear regression coefficient and Pearson’s correlation coefficient to deduct
relationship between air temperature and first spring phenological events. In addition, we used
one-way analysis of variance (ANOVA) followed by Tukey’s HDC post hoc test to compare the
difference of mean air temperature anomaly among the three land-use types. The linear regression
analysis was performed by using Microsoft Excel 2016 software (Microsoft Corp., Redmond, WA, USA),
Remote Sens. 2020, 12, 3282                                                                                                7 of 25

and Pearson’s correlation test and ANOVA test were performed by using SigmaPlot 12.0 software
(Systat Software Inc., Chicago, IL, USA).

3. Results

3.1. Spatial Distribution of Isopleth of DoY for AGDD 159
     Spatial distribution of isopleth of DoY for AGDD 159 was expressed on the topography and
land-use type maps (Figure 3). DoY for AGDD 159 tended to be earlier in the sites with lower latitude
and altitude, where area located on the southern and western parts of South Korea. On the other
hand, an effect of urbanization on advancement of green-up dates was also confirmed from several
verification sites such as 3, 4, 11, 12, 19, 23, 24, and so on (Figure 3).
      Remote Sens. 2020, 12, x FOR PEER REVIEW                                                                       8 of 28

            Figure 3. The isopleth map of day of year (DoY) for accumulated growing degree days (AGDD) 159
      Figure 3. The isopleth map of day of year (DoY) for accumulated growing degree days (AGDD) 159
           overlapped on the topography (left) and land-use type (right) maps.
      overlapped on the topography (left) and land-use type (right) maps.
      3.2. Relationship Between Air Temperature and Phenological Events
3.2. Relationship Between Air Temperature and Phenological Events
            We compared green-up dates of Mongolian oak and air temperature among major Mongolian
      We   compared green-up dates of Mongolian oak and air temperature among major Mongolian oak
      oak forests in each season (winter, DoY 1~59; spring, DoY 60~151; total, DoY 1~184) throughout South
forests
      Koreaeach
         in          season (winter,
               to investigate              DoYbetween
                                relationship    1~59; spring,
                                                        unfolding DoYstart60~151;   total, DoYoak
                                                                           date of Mongolian        1~184)  throughout
                                                                                                      and air temperature.South
KoreaWe to deducted
            investigate     relationship
                         mean                between
                                 air temperature    andunfolding
                                                          green-up start    date AGDD
                                                                     date (DoY    of Mongolian       oak andimage
                                                                                      ) from the MODIS         air temperature.
                                                                                                                      as the
We deducted        meanstations
      meteorological        air temperature       and
                                     are located far   green-up
                                                     from  Mongoliandateforests.
                                                                            (DoYAGDD ) from the MODIS image as the
             Figure stations
meteorological        4 shows the
                                arerelationship
                                      located far between    MODIS-derived
                                                   from Mongolian               air temperature and the green-up start
                                                                         forests.
      date   for each   sampling    site of Mongolian   oak  forests (N  =
      Figure 4 shows the relationship between MODIS-derived air temperature30; Figure  1). At the seasonal   scale,
                                                                                                        and the     the date start
                                                                                                                 green-up
      had   the  highest   correlation    with mean   air temperature     in spring  (R 2 = 0.87), followed by the whole
date for each sampling site of Mongolian oak forests (N = 30; Figure 1). At the seasonal scale, the date
      season (R2 = 0.84), the winter season (R2 = 0.59). The result indicated that
had the   highest correlation with mean air temperature in spring (R2 =if0.87),                 the mean air temperature
                                                                                                       followed by the whole
      in the2 spring season rises by 1 °C, Mongolian          oak  will leaf  out earlier  by  3.84  DoY. Similarly, mean
season (R = 0.84), the winter season (R2 = 0.59). The result indicated that                      if the  mean air temperature
      air temperature during DoY◦1~184 was highly correlated with the date (R2 = 0.84), and the regression
in thecoefficient
       spring season        rises  by  1   C, Mongolian     oak  will  leaf  out  earlier  by  3.84  DoY.
                    indicated that the date will move back by 3.58 DoY in accordance with the rising of mean
                                                                                                            Similarly, mean air
                                                   1~184. correlated with the date (R = 0.84), and the regression
temperature       duringby  DoY                                                                2
      air temperature          1 °C1~184
                                     duringwasDoYhighly
coefficient indicated that the date will move back by 3.58 DoY in accordance with the rising of mean air
temperature by 1 ◦ C during DoY 1~184.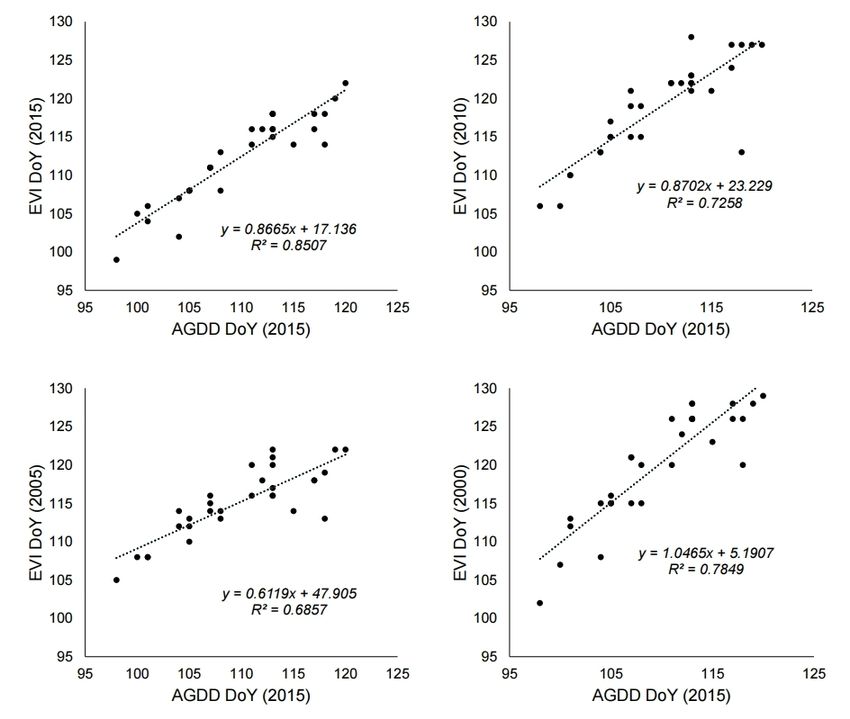
Remote Sens. 2020, 12, 3282                                                                                          8 of 25
      Remote Sens. 2020, 12, x FOR PEER REVIEW                                                                 9 of 28

           Figure
      Figure  4. 4. The
                    The relationship between
                          relationship        meanmean
                                        between     moderate resolutionresolution
                                                           moderate      imaging spectroradiometer   (MODIS)-
                                                                                    imaging spectroradiometer
           derived air temperature (winter: January to February, spring: March to May,  total: January
      (MODIS)-derived air temperature (winter: January to February, spring: March to May, total:       to January
                                                                                                          June)   to
           and green-up DoYAGDD for 30 sampling sites of Mongolian oak forests in South Korea.
      June) and green-up DoYAGDD for 30 sampling sites of Mongolian oak forests in South Korea.

            Green-up start dates from MODIS-derived AGDD in 2015 and EVI in 2000, 2005, 2010, and 2015
     Green-up start dates from MODIS-derived AGDD in 2015 and EVI in 2000, 2005, 2010, and 2015
     were closely related with each other (Figure 5). Green-up start dates from MODIS-derived EVI in
were closely related with each other (Figure 5). Green-up start dates from MODIS-derived EVI in 2000,
     2000, 2005, 2010, and 2015 were also closely related with each other (Figure 6).
2005, Remote
      2010,   and2020,
           Another
             Sens. 201512, were
                     comparison  also closely
                                    was
                           x FOR PEER   carriedrelated
                                      REVIEW            with each
                                                out to establish theother  (Figurebetween
                                                                     relationship   6).   the seasonal mean
                                                                                                         10 ofair
                                                                                                               28
      temperature measured from meteorological stations (N = 93; Figure 1) and the green-up DoY
      determined by the AGDD threshold derived from measured air temperature. The result indicated
      that the seasonal mean air temperatures were significantly related to the green-up DoY (p ≤ 0.01)
      (Figure 7). Among the results compared, the coefficient of determination was the highest in the winter
      season (R2 = 0.78), followed by the whole season (R2 = 0.75), and the spring season (R2 = 0.65).

      Figure  5. The
           Figure     relationship
                   5. The           between
                          relationship between the
                                                 theAGDD
                                                     AGDD DoY    andthe
                                                             DoY and theenhanced
                                                                         enhanced  vegetation
                                                                                 vegetation     index
                                                                                            index      (EVI)
                                                                                                   (EVI) DoY DoY
                                                                                                              for for
      30 sampling   sites of Mongolian    oak   forests in South Korea. Green-up  DoY   deducted    based
           30 sampling sites of Mongolian oak forests in South Korea. Green-up DoY deducted based on AGDD  on  AGDD
      in 2015 showed
           in 2015      significant
                   showed            correlation
                            significant correlationwith
                                                    withgreen-up   DoYdeducted
                                                          green-up DoY deductedbased
                                                                                 based
                                                                                     on on
                                                                                         EVIEVI  in 2000,
                                                                                             in 2000, 2005,2005,
                                                                                                            2010,2010,
      and 2015.
           and 2015.
Remote
Remote Sens. 2020, 12,
Sens. 2020, 12, 3282
x FOR PEER REVIEW 9 of
11 of 25
28
Figure 6. The
Figure 6. The relationship
relationship between
between green-up
green-up DoY
DoY deducted
deducted based
based on
on EVI
EVI for
for 30
30 sampling
sampling sites
sites of
of
Mongolian
Mongolianoak oakforests
forestsinin
2000, 2005,
2000, 2010,
2005, and and
2010, 20152015
in South Korea.Korea.
in South Green-up DoY inDoY
Green-up each in
year showed
each year
significant correlation
showed significant with eachwith
correlation other.
each other.
Another comparison was carried out to establish the relationship between the seasonal mean
air temperature measured from meteorological stations (N = 93; Figure 1) and the green-up DoY
determined by the AGDD threshold derived from measured air temperature. The result indicated that
the seasonal mean air temperatures were significantly related to the green-up DoY (p ≤ 0.01) (Figure 7).
Among the results compared, the coefficient of determination was the highest in the winter season (R2
= 0.78), followed by the whole season (R2 = 0.75), and the spring season (R2 = 0.65).Remote Sens. 2020, 12, 3282 10 of 25
Remote Sens. 2020, 12, x FOR PEER REVIEW 12 of 28
Figure 7.7.The
Figure relationship
The between
relationship the seasonal
between mean air mean
the seasonal temperatures measured from
air temperatures 93 meteorological
measured from 93
stations and the green-up DoY determined by the AGDD threshold.
meteorological stations and the green-up DoY determined by the AGDD threshold.
3.3. Change of Green-Up Date during the Past Century
3.3. Change of Green-Up Date during the Past Century
To determine the relationship between vegetation phenology and air temperature on a longer
To determine the relationship between vegetation phenology and air temperature on a longer
temporal scale, we analyzed the response of vegetation phenology due to the rise of the mean air
temporal scale, we analyzed the response of vegetation phenology due to the rise of the mean air
temperature during the past century. The analysis was carried out for five meteorological stations
temperature during the past century. The analysis was carried out for five meteorological stations
that had recorded the DoY of the phenological event (first flowering DoY of cherry; Figure 8) and the
that had recorded the DoY of the phenological event (first flowering DoY of cherry; Figure 8) and the
air temperature during the period (Figure 9). The flowering date of cherry (Figure 8) became earlier
air temperature during the period (Figure 9). The flowering date of cherry (Figure 8) became earlier
and air temperature (Figure 9) was risen significantly. Consequently, both factors showed a negative
and air temperature (Figure 9) was risen significantly. Consequently, both factors showed a negative
correlation (Table 2). Leaf green-up date of Mongolian oak based on the AGDD threshold showed the
correlation (Table 2). Leaf green-up date of Mongolian oak based on the AGDD threshold showed
same trend as the flowering date of cherry (Figure 10, Table 2). Therefore, the green-up DoYAGDD of
the same trend as the flowering date of cherry (Figure 10, Table 2). Therefore, the green-up DoYAGDD
Mongolian oak was highly correlated to both the annual mean air temperature and the first flowering
of Mongolian oak was highly correlated to both the annual mean air temperature and the first
date of cherry as a phenological event (p ≤ 0.001; Table 3).
flowering date of cherry as a phenological event (p ≤ 0.001; Table 3).
Table 2. The rate of change for the annual mean air temperature and the phenological event dates
during the past century.
Linear Regression Coefficient (/100 Years)
City Annual Mean Air First flowering DoY of
DoYAGDD (R2 )
Temperature (R2 ) Cherry (R2 )
Seoul 2.3 (0.56 **) −13.68 (0.47 **) −13.71 (0.40 **)
Incheon 1.8 (0.39 *) −11.56 (0.36 *) −8.10 (0.16 *)
Daegu 2.5 (0.67 **) −18.87 (0.56 **) −15.56 (0.45 **)
Busan 1.6 (0.52 **) −19.97 (0.38 *) −8.00 (0.19 *)
Mokpo 0.9 (0.27 *) −8.65 (0.17 *) −8.30 (0.15 *)
* Significant at p ≤ 0.05; ** significant at p ≤ 0.01.Remote Sens. 2020, 12, 3282 11 of 25
Table 3. The relationship between green-up DoYAGDD of Mongolian oak and the annual mean air
temperature and the first flowering DoY of cherry.
Coefficient of Pearson’s Correlation
City N Annual Mean Air First Flowering DoY
Temperature (◦ C) of Cherry
Seoul 87 −0.754 *** 0.913 ***
Incheon 92 −0.574 *** 0.731 ***
Daegu 87 −0.832 *** 0.854 ***
Busan 91 −0.789 *** 0.838 ***
Mokpo 91 −0.716 *** 0.756 ***
Total 299 −0.823 *** 0.913 ***
*** Significant at p ≤ 0.001.
Remote Sens. 2020, 12, x FOR PEER REVIEW 13 of 28
Figure 8. 8.Changes
Figure Changes of the first
of the firstflowering
flowering DoY
DoY of cherry
of cherry during
during the century
the past past century incities
in major major of cities
South of
South Korea.
Korea.Remote Sens. 2020, 12, 3282 12 of 25
Remote Sens. 2020, 12, x FOR PEER REVIEW 14 of 28
Figure
Figure 9. 9. Changesof
Changes of the
the annual
annualmean
meanairair
temperature during
temperature the past
during the century in major
past century in cities
majorofcities
Southof
Korea.
South Korea.Remote Sens. 2020, 12, 3282 13 of 25
Remote Sens. 2020, 12, x FOR PEER REVIEW 15 of 28
Figure Changes
10. 10.
Figure Changesof of
thethe
simulated
simulatedgreen-up
green-updates
datesof
ofMongolian
Mongolian oak, which
which require
require159159AGDD
AGDD
during thethe
during past century
past using
century thethe
using airair
temperature
temperaturemeasured
measuredin
in the
the meteorological stationsininmajor
meteorological stations major
cities of South
cities Korea.
of South Korea.
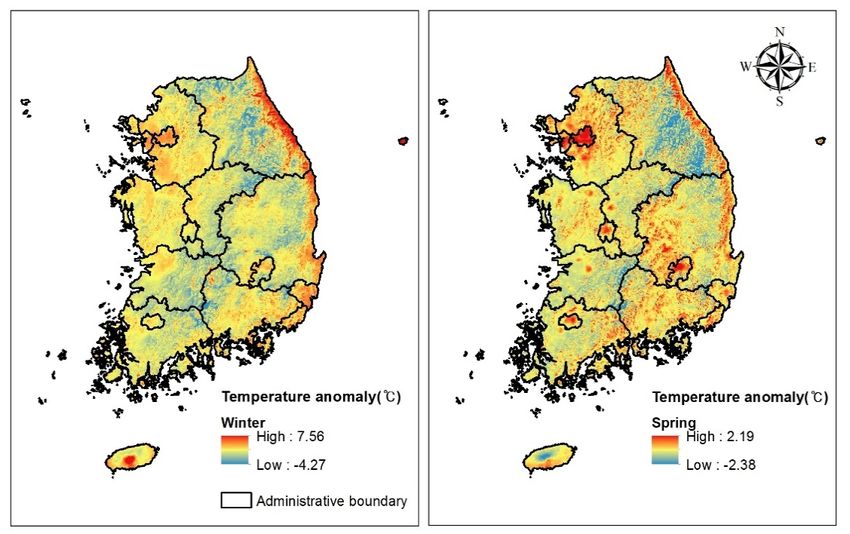
3.4. Temperature Anomaly due to Topography and Land-Use Intensity
Figure 11 shows the mean air temperature anomaly in each season. From the winter to the spring,
the area that had high temperature anomaly was mostly distributed in the east coast region of South
Korea. It is because this region experiences a temperature gradient due to the mountain ranges with
high altitude, which block off the northwesterly wind from the Siberian anticyclone during the period.Remote Sens. 2020, 12, 3282 14 of 25
This phenomenon was also seen in the southern part of Jeju Island, the southernmost island of South
Korea, which
Remote Sens. 2020,has
12, xa FOR
highPEER
mountain
REVIEW(Mt. Halla) long-stretched from east to west in the center. 17 of 28
Figure 11. The
Figure 11. The spatial
spatial distribution of air
distribution of air temperature
temperature anomalies
anomalies during
during winter
winter (upper left), spring
(upper left), spring
(upper right), summer (lower left), and DoY 1~184, 2015 in South Korea (lower right).
(upper right), summer (lower left), and DoY 1~184, 2015 in South Korea (lower right).
Aside from the
The results of areas that were
an analysis ofaffected
variance by (one-way
seasonal wind, there were
ANOVA) and many
a posthotspots distributed
hoc analysis (Tukeyas
ahonestly
point pattern (Figure 11). The reason that the air temperature was higher than the
significant difference; Tukey HSD) indicated that there was a difference (F = 1889.62) surrounding area
in these areas
between groups, is due to therural,
urban, urbanand
heatforest
islandareas
(UHI)ateffect from the intensive
the significance land-use
level of by human
0.001 (Table beings.
4), and the
The results of an analysis of variance (one-way ANOVA) and a post hoc analysis
difference was clear (p ≤ 0.001) (Table 5). In particular, the urban area appeared to have the higher(Tukey honestly
significant difference; to
difference compared Tukey indicated that there was a difference (F = 1889.62) between groups,
HSD)groups.
the other
urban, rural,12a
Figure andshows
forest the
areas at the significance
time-series patterns level
of theofmean
0.001 air
(Table 4), and theanomaly
temperature difference
forwas clear
each (p
land-
≤ 0.001) (Table 5). In particular, the urban area appeared to have the higher difference
use type. It can be seen that 8-d anomalies in urban areas were always higher than 0 °C. In contrast,compared to the
other groups.
anomalies in the other land-use types fluctuated around approximately 0 °C in a time-series.
Consequently, the temperature anomaly in urban area consistently increased differently from that in
areas that belonged to the other land-use type (Figure 12b). Hence, the time to reach the AGDD
threshold in the urban area was much shorter than the time in the other areas.Remote Sens. 2020, 12, 3282 15 of 25
Table 4. The one-way ANOVA table shows the difference of mean air temperature anomaly among the
three land-use types (urban, rural, forest).
Sum of Squares Df Mean Square F Sig.
Remote Sens. 2020, 12, x FOR PEER REVIEW 18 of 28
Between Groups 1049.47 2 524.73 1889.62 0.000 ***
Within Groups 23,910.99 86,106 0.28
Table Total
4. The one-way ANOVA table shows the
24,960.46 difference of mean air temperature anomaly among
86,108
the three land-use types (urban, rural, forest).
*** Significant at p ≤ 0.001.
Sum of Squares Df Mean Square F Sig.
Table 5. TheGroups
Between results of Tukey’s HSD(honestly
1049.47 significant
2 difference) post hoc test. 1889.62
524.73 Std. error: Standard
0.000 ***
error, Sig.: Significance value.
Within Groups 23,910.99 86,106 0.28
Mean24,960.46 95% Confidence Interval
CLASS TotalCLASS Std. Error 86,108Sig.
Difference Lower Bound Upper Bound
*** Significant at p ≤ 0.001.
Rural 0.06 * 0.004 0.000 *** 0.0506 0.0689
Forest
Urban −0.46 * 0.008 0.000 *** −0.4802 −0.4419
Table 5. The results of Tukey’s HSD(honestly significant difference) post hoc test. Std. error:
Forest −0.06Standard
* error,
0.004 Sig.: Significance
0.000 *** value. −0.0689 −0.0506
Rural
Urban −0.52 * 0.008 0.000 *** −0.5407 −0.5009
95% Confidence Interval
Forest Mean
0.46 * 0.008 0.000 *** 0.4419 0.4802
Urban
CLASS CLASS Std.
Rural 0.52 *
Difference 0.008Error Sig.
0.000 *** Lower
0.5009 Upper0.5407
Bound
Bound
* Significant at p ≤ 0.05; *** significant at p ≤ 0.001.
Rural 0.06 * 0.004 0.000 *** 0.0506 0.0689
Forest
Urban −0.46 * 0.008 0.000 *** −0.4802
Figure 12a shows the time-series patterns of the mean air temperature anomaly for each land-use −0.4419
type.Rural Forest
It can be seen −0.06 * in urban0.004
that 8-d anomalies areas were 0.000 *** higher−0.0689
always −0.0506
than 0 ◦ C. In contrast, anomalies
Urban −0.52 * 0.008 0.000 *** ◦ −0.5407
in the other land-use types fluctuated around approximately 0 C in a time-series. Consequently, −0.5009 the
temperature Forest 0.46 * 0.008 0.000 *** 0.4419 0.4802
Urban anomaly in urban area consistently increased differently from that in areas that belonged
Ruraltype (Figure
to the other land-use 0.5212b).
* Hence, 0.008
the time0.000 *** the AGDD
to reach 0.5009threshold in the
0.5407
urban area
* Significant
was much shorter than the time at p ≤areas.
in the other 0.05; *** significant at p ≤ 0.001.
Figure 12. The time-series patterns of the 8-d mean air temperature anomaly (a) and accumulated air
Figure 12. The time-series patterns of the 8-d mean air temperature anomaly (a) and accumulated air
temperature anomaly (b) for land-use types.
temperature anomaly (b) for land-use types.
4. Discussion
4.1. Utility of MODIS Images as a Tool for Phenology Research
Lim et al. [60,63] confirmed the leaf unfolding start date of Mongolian oak from the digital
cameras installed in Mongolian oak community of five locations with different ecological conditionsRemote Sens. 2020, 12, 3282 16 of 25
and reported that these results confirmed at the field were consistent with the leaf unfolding start date
based on AGDD derived from the time series analysis of the satellite image (MODIS) temperature data.
Air temperatures obtained through satellite image analysis for 30 Mongolian oak forests selected
throughout the whole national territory in this study reflected the temperature changes occurring from
the difference in latitude and altitude of each site well. Furthermore, the leaf unfolding start dates
of the Mongolian oak based on both AGDD (Figure 4) and EVI in each site (Figure 5) were closely
correlated with each other. The leaf unfolding start dates of the Mongolian oak deduced based on EVI
in different years, 2000, 2005, 2010, and 2015, were also closely correlated with each other (Figure 6). In
addition, the result showed a similar trend to the relationship between the mean temperature and the
green-up DoY determined by the AGDD threshold derived from the air temperature measured by 93
weather stations (Figure 7).
As the result of analysis on the yearly changes of the unfolding start date of Mongolian oak
was based on AGDD calculated from air temperature data for about 100 years measured by the
Korea Meteorological Administration, the date was assessed to have advanced by 9–20 days on a
national basis (Table 2, Figure 10). These results have been inversely proportional to changes in
the average temperature measured by the Korea Meteorological Administration over the past 100
years, and positively correlated with the cherry blossom date measured by the Korea Meteorological
Administration (Table 3, Figures 8 and 9).
As was shown above, the leaf unfolding start dates of Mongolian oak derived from satellite image
analysis were consistent with the results identified visibly in the field sites [60], and well reflected the
spatial temperature variation. Furthermore, the dates also tended to be proportional to the long-term
annual mean temperature and the change in the cherry blossom date measured directly. In this regard,
the phenology study through MODIS image analysis was evaluated to have methodological validity.
The relationship between air temperature or degree days and phenophases, especially flowering
and leaf unfolding, is well known and has been widely reviewed [5,60]. As temperature has been
known as a major driver of phenology [25,69], AGDD has a long history of use in predicting plant and
insect phenology in agriculture [60,70,71].
Traditionally, the estimation of air temperature has depended on ground measurements at point
levels such as meteorological stations and ground surveys. The ground-measured air temperatures
were spatially interpolated using a GIS with conventional spatial statistics techniques such as kriging,
inverse distance weighting (IDW), spline, and so on for expanding the estimation to the polygon
level. Although the development of GIS and spatial statistics have led to a drastic refinement in the
interpolated result, there is a severe weakness due to the limited number of the points [60,72].
But remote sensing is an alternative data source since remotely-sensed imagery is intrinsically
spatialized [59]. In particular, MODIS provides an abundant series of land surface temperature (LST)
products with different spatial and temporal resolutions from both terra and aqua platforms [57].
Previous studies have shown that the LST data measured by MODIS can be successfully used for linear
regression estimates of air temperatures at a regional scale [60,73–75].
4.2. Climate Change and Vegetation Phenology
Based on the records at major cities of South Korea, mean air temperature has risen between 0.9
to 2.5 ◦ C (on average 1.8 ± 0.6 ◦ C) during the past century (Figure 8). During the period, cherry has
flowered earlier, from 8.00 to 15.56 days (on average 10.7 ± 3.6 days) (Figure 8, Table 2). Applying the
green-up DoY determined by the AGDD threshold, Mongolian oak has leafed out earlier, from 8.65 to
19.97 days (on average 14.5 ± 4.3 days) (Figure 10, Table 2).
Changes in climate conditions influence the energy and time budgets of individual organisms
and thus can directly alter the timing of such events. Therefore, phenology is utilized as a valuable
tool for diagnosing the biological impacts of climate change [8,18]. Climate changes may also influence
phenology indirectly, as organisms use environmental cues, such as temperature or rainfall, to regulate
the timing of specific events within their annual cycle [76]. Changes in phenology have emergedRemote Sens. 2020, 12, 3282 17 of 25
as one of the most conspicuous responses of biota to recent climatic warming [43,77–79]. Many
long-term phenological data sets provide persuasive evidence of significant temporal advances in
several phenological events across a wide range of biological species from various regions [80,81]. The
consistency of this pattern is shown by the phenological advances found in flowering and leaf unfolding
times [82–86]. In general, the most remarkable phenomena have been found in the phenophases
occurring in the spring season [43].
Many data usually demonstrate that these changes are mainly a product of temperature increase
rather than of other aspects of the weather [6,8,87–94]. However, precipitation (Mediterranean
vegetation) [85,95], the timing of snowmelt and the temperatures that follow snowmelt (high-latitude
and high-altitude ecosystems), the amount and seasonal variability of precipitation, the duration
of the dry season, solar radiation (tropical forests) [96–102], and photoperiod and winter chilling
requirements (some temperate tree species) [103–107] are also known as critical factors that regulate
spring phenology.
4.3. Urban Heat Island Effect and Vegetation Phenology
The results of this study show that urbanization affected not only temperature rise (Figure 3)
but also phenology Figures 8 and 9, Table 2). Green-up date of Mongolian oak obtained from five
major cities, 93 meteorological stations, and 30 natural forests was earlier in the mentioned order
(Figures 8 and 9, Table 2) and the order was attributed to the degree of urbanization of the area that
the data was collected. The results from this study agreed with the results from numerous previous
studies [23,51,108,109]. The results showed that urban areas experienced a greater accumulated air
temperature than the rural and forest areas in similar geographical conditions, such as altitude, latitude,
and longitude (Figure 12b). Consequentially, the experience caused phenological events in urban area
to occur earlier than in the other areas. For example, in 2015, the green-up date of Mongolian oak
forests on Mt. Nam, located in the center of Seoul, the capital of South Korea, was DoY 98 [60], which
was earlier by approximately 10 days compared to the date in the surrounding rural and forest areas
(Figure 4). Such an earlier spring green-up was because Mongolian oak on Mt. Nam had experienced
the accumulated air temperature anomaly of 188.26 (Figure 12).
Urbanization is considered as a main driver of climate change [110]. Land transformation and
increasing impervious surface cover increase local temperatures and alter ecosystem processes such as
the carbon cycle [111–115]. Built surfaces generally absorb more solar radiation than vegetation; they are
also impervious, covering the soil and preventing heat dissipation from evapotranspiration [116,117].
Thus, land use pattern can account for much of the temperature variation [28,118–121]. The urban
energy budget also controls temperature variance significantly [122–124].
Urbanized areas are also exposed to climate change from greenhouse gas-induced radiative
forcing, and localized effects from urbanization such as the urban heat island. Warming and extreme
heat events due to urbanization and increased energy consumption are simulated to be as large as the
impact of doubled CO2 in some regions [41]. Urban micro-climates have long been recognized [125].
Observational evidence showed trends in urban heat islands in some locations of a similar magnitude
or greater than that from greenhouse gas-forced climate change [126,127]. In the phenological study,
urban areas represent important study fields because their warmer conditions allow for an assessment
of the future potential impacts of climate change on plant development [128] UHI-induced increases in
temperature can affect vegetation phenology both within and around cities [49]. Lee et al. [129] and
Jung et al. [18] reported that abnormal shoot growth appeared more frequently, and shoot length was
longer, in the hotter urban center than in the urban fringe or the suburban greenbelt and the frequency
of abnormal shoots and their lengths were closely correlated with the urbanized ratio (positively)
and with the vegetation cover of land expressed as NDVI (Normalized difference vegetation index;
negatively) in Seoul. A study carried out by Zipper et al. [51] showed that the length of the urban
growing season in Madison, Wisconsin of the USA is approximately five days longer than in the
surrounding rural areas, and the UHI impacts on growing season length are relatively consistent fromRemote Sens. 2020, 12, 3282 18 of 25
year to year. These studies have indicated that vegetation phenology is relevant to the UHI effect and
the potential impacts of climate change on urban climate [130].
5. Conclusions
The changes in phenology due to climate change vary depending on time, space, degree of human
intervention, and so on. Most studies for plant phenology have been carried out focusing on the specific
factors. However, various factors need to be considered in order to understand plant phenology at
certain times. In this study, we tried to clarify the changes in phenology of the Mongolian oak in
various aspects by utilizing satellite image data. It is necessary to study long-term trends to understand
the relationship between climate change and phenology, but the method by which satellite images
are utilized inherently includes the fundamental problem that the period of analysis is short. These
problems can be supplemented by taking into account environmental factors such as temperatures,
which play an important role in phenological events of plant, rather than using the specific reflective
properties of the plant. Information on temperatures measured and the blooming dates of cherry
blossoms observed for more than 100 years in Korea can be used as very powerful sources for studying
the changes of phenology due to climate change. In this study, we clarified the relationship between
air temperature and spring green-up date of Mongolian oak by applying a meteorological indicator
(AGDD) derived from MODID LST imagery in 30 sampling sites of the Mongolian forest throughout
the whole national territory of South Korea. Furthermore, we clarified a correlation between both
factors by applying AGDD based on the records of 93 meteorological stations. In addition, the results
of this study were confirmed by the data that flowering date of cherry became earlier and responded
negatively on the rise of mean air temperature during the past century based on the records at five
meteorological stations. Through this study we showed that the study for phenology can be carried out
through meteorological indicators derived from satellite images. We could also confirm that long-term
trends in the changes could be deduced by utilizing the additional observation data. Furthermore, the
results obtained from this study showed that the spatiotemporal changes in environmental conditions
cause obvious changes in plant phenology. In addition, the result of this study showed that change of
microclimate due to the intense land use in the urban area also caused change of vegetation phenology.
Overall, we extended the spatiotemporal scales of the phenological study by applying the remote
sensing image interpretation and the spatial statistics techniques. We expect our findings could be
used to predict long-term changes in ecosystems due to climate change.
Author Contributions: Conceptualization, C.H.L. and C.S.L.; methodology, C.H.L. and C.S.L.; software, C.H.L. and
N.S.K.; validation, S.H.J. and C.S.L.; formal analysis, C.H.L. and A.R.K.; investigation, C.H.L. and A.R.K.; resources,
N.S.K. and C.S.L.; data curation, C.S.L. and S.H.J.; writing—original draft preparation, C.S.L.; writing—review
and editing, C.S.L.; visualization, C.H.L.; supervision, C.S.L.; project administration, C.H.L. All authors have read
and agreed to the published version of the manuscript.
Funding: This research received no external funding.
Conflicts of Interest: The authors declare no conflict of interest.
Abbreviations
GDD Growing degree days set as 5 ◦ C
AGDD Accumulated growing degree days
EVI Enhanced vegetation index (EVI)
MODIS LST Moderate resolution imaging spectroradiometer land surface temperature
DoYAGDD Day of year needed to reach the AGDD threshold (159 ◦ C·d)
DoY (159 AGDD) Day of year required to reach AGDD 159 ◦ C necessary for the leaf unfolding
AGDD 159 ◦ C Accumulated growing degree days 159 ◦ C necessary for the leaf unfoldingRemote Sens. 2020, 12, 3282 19 of 25
Appendix A
Table A1. The DoY reached the AGDD 159 and the green-up DoY in 2015 for 30 sampling sites of
Quercus mongolica forest throughout South Korea. Max. K: DoY required for green-up start based on
curvature K, Diff.: Difference between days deducted based on AGDD 159 and curvature K.
Elevation Aspect DoY for
No. Site No. Lon. Lat. Max. K Diff.
(m) (◦ ) AGDD 159
1 Mt. Jiri 128.46 38.04 985 90 117 121 4
2 Mt. Jeombong 127.42 38.01 906 78 118 123 5
3 Mt. Nam 127.80 37.95 141 13 98 98 0
4 Gwangneung 128.67 37.87 230 42 104 107 3
5 Mt. Halla 127.16 37.75 1315 317 118 125 7
6 Mt. Odae 127.26 37.57 690 148 113 116 3
7 Mt. Deokwang 126.99 37.55 878 331 113 119 6
8 Mt. Chiak 127.03 37.34 1090 298 119 123 4
9 Mt. Majeok 129.01 37.31 513 2 111 109 −2
10 Gookmangbong 128.05 37.3 1124 240 113 119 6
11 Mt. Gwanggyo 128.43 36.94 429 21 107 108 1
12 Mt. Yebong 129.20 36.89 423 54 108 109 1
13 Mt. Ami 127.57 36.82 306 198 104 107 3
14 Mt. Gyeryong 127.88 36.56 527 304 107 109 2
15 Mt. Sokri 127.20 36.35 907 67 113 115 2
16 Mt. Doota 126.69 36.27 408 164 105 106 1
17 Mt. Sobaek 128.29 36.08 907 75 120 126 6
18 Mt. Donggo 128.66 36.01 900 187 112 116 4
19 Mt. Moojang 127.75 35.98 320 90 100 97 −3
20 Mt. Maebong 127.36 35.9 607 246 105 103 −2
21 Mt. Cheongsong 129.43 35.88 523 225 101 97 −4
22 Mt. Gaji 127.69 35.76 1126 316 113 116 3
23 Mt. Palgong 127.09 35.72 860 186 107 114 7
24 Mt. Geumoe 129.01 35.62 709 111 108 105 −3
25 Mt. Baekwoon 128.98 35.39 895 203 113 116 3
26 Mt. Woonjang 129.12 35.37 969 235 111 114 3
27 Mt. Moak 127.53 35.33 721 242 115 109 −6
28 Mt. Birae 127.35 35.13 571 320 105 103 −2
29 Mt. Namdeokyou 127.30 34.58 1197 181 117 121 4
30 Mt. Jogye 126.55 33.38 266 117 101 97 −4
References
1. Cleland, E.E.; Chuine, I.; Menzel, A.; Mooney, H.A.; Schwartz, M.D. Shifting plant phenology in response to
global change. Trends Ecol. Evol. 2007, 22, 357–365. [CrossRef]
2. Walker, W.H.; Meléndez-Fernández, O.H.; Nelson, R.J.; Reiter, R.J. Global climate change and invariable
photoperiods: A mismatch that jeopardizes animal fitness. Ecol. Evol. 2019, 9, 10044–10054. [CrossRef]
[PubMed]
3. De Beurs, K.M.; Henebry, G.M. Land surface phenology, climatic variation, and institutional change:
Analyzing agricultural land cover change in Kazakhstan. Remote Sens Environ. 2004, 89, 497–509. [CrossRef]
4. Visser, M.E.; Both, C. Shifts in phenology due to global climate change: The need for a yardstick. Proc. R. Soc.
B 2005, 272, 2561–2569. [CrossRef] [PubMed]
5. Schwartz, M.D.; Ahas, R.; Aasa, A. Onset of spring starting earlier across the Northern Hemisphere. Glob.
Chang. Biol. 2006, 12, 343–351. [CrossRef]
6. Primack, R.; Higuchi, H. Climate change and cherry tree blossom festivals in Japan. Arnoldia 2007, 65, 14–22.
7. Jeong, S.J.; Ho, C.H.; Choi, S.D.; Kim, J.; Lee, E.J.; Gim, H.J. Satellite Data-Based Phenological Evaluation of
the Nationwide Reforestation of South Korea. PLoS ONE 2013, 8, e58900. [CrossRef]
8. Richardson, A.D.; Keenan, T.F.; Migliavacca, M.; Ryu, Y.; Sonnentag, O.; Toomey, M. Climate change,
phenology, and phenological control of vegetation feedbacks to the climate system. Agric. For. Meteorol.
2013, 169, 156–173. [CrossRef]Remote Sens. 2020, 12, 3282 20 of 25
9. Liu, Q.; Piao, S.; Janssens, I.A.; Fu, Y.; Peng, S.; Lian, X.; Ciais, P.; Myneni, R.B.; Peñuelas, J.; Wang, T. Extension
of the growing season increases vegetation exposure to frost. Nat. Commun. 2018, 9, 1–8. [CrossRef]
10. Menzel, A. Plant Phenological Anomalies in Germany and their Relation to Air Temperature and NAO. Clim.
Chang. 2003, 57, 243–263. [CrossRef]
11. Estrella, N.; Menzel, A. Responses of leaf colouring in four deciduous tree species to climate and weather in
Germany. Clim. Res. 2006, 32, 253–267. [CrossRef]
12. Fu, Y.H.; Piao, S.; Op de Beeck, M.; Cong, N.; Zhao, H.; Zhang, Y.; Menzel, A.; Janssens, I.A. Recent spring
phenology shifts in western Central Europe based on multiscale observations. Glob. Ecol. Biogeogr. 2014, 23,
1255–1263. [CrossRef]
13. Keenan, T.F.; Richardson, A.D. The timing of autumn senescence is affected by the timing of spring phenology:
Implications for predictive models. Glob. Chang. Biol. 2015, 21, 2634–2641. [CrossRef] [PubMed]
14. Ju, R.; Gao, L.; Wei, S.; Li, B. Spring warming increases the abundance of an invasive specialist insect: Links
to phenology and life history. Sci. Rep. 2017, 7, 1–12. [CrossRef] [PubMed]
15. Piao, S.; Liu, Q.; Chen, A.; Janssens, I.A.; Fu, Y.; Dai, J.; Liu, L.; Lian, X.; Shen, M.; Zhu, X. Plant phenology and
global climate change: Current progresses and challenges. Glob. Chang. Biol. 2019, 25, 1922–1940. [CrossRef]
[PubMed]
16. Schwartz, M.D.; Reiter, B.E. Changes in North American spring. Int. J. Climatol. 2000, 20, 929–932. [CrossRef]
17. Richardson, A.D.; Hollinger, D.Y.; Dail, D.B.; Lee, J.T.; Munger, J.W.; O’keefe, J. Influence of spring phenology
on seasonal and annual carbon balance in two contrasting New England forests. Tree Physiol. 2009, 29,
321–331. [CrossRef]
18. Jung, S.H.; Kim, A.R.; An, J.H.; Lim, C.H.; Lee, H.; Lee, C.S. Abnormal shoot growth in Korean red pine
as a response to microclimate changes due to urbanization in Korea. Int. J. Biometeorol. 2020, 64, 571–584.
[CrossRef]
19. Xu, M.; Wang, H.; Wen, X.; Zhang, T.; Di, Y.; Wang, Y.; Wang, J.; Cheng, C.; Zhang, W. The full annual carbon
balance of a subtropical coniferous plantation is highly sensitive to autumn precipitation. Sci. Rep. 2017, 7,
10025. [CrossRef]
20. Gu, L.; Post, W.M.; Baldocchi, D.; Andy Black, T.; Verma, S.B.; Vesala, T.; Wofsy, S.C. Phenology of Vegetation
Photosynthesis. In Phenology: An Integrative Environmental Science; Schwartz, M.D., Ed.; Springer: Dordrecht,
The Netherlands, 2003; pp. 467–485.
21. Fantinato, E.; Vecchio, S.D.; Giovanetti, M.; Alicia Teresa Rosario Acosta, A.; Buffa, G. New insights into
plants co-existence in species-rich communities: The pollination interaction perspective. J. Veg. Sci. 2018, 29,
6–14. [CrossRef]
22. Inouye, D. Effects of climate change on phenology, frost damage, and floral abundance of montane wildflowers.
Ecology 2008, 89, 353–362. [CrossRef] [PubMed]
23. Allstadt, A.J.; Vavrus, S.J.; Heglund, P.J.; Pidgeon, A.M.; Thogmartin, W.E.; Radeloff, V.C. Spring plant
phenology and false springs in the conterminous US during the 21st century. Environ. Res. Lett. 2015, 10,
104008. [CrossRef]
24. Raza, A.; Razzaq, A.; Mehmood, S.S.; Zou, X.; Zhang, X.; Lv, Y.; Xu, J. Impact of climate change on crops
adaptation and strategies to tackle its outcome: A review. Plants 2019, 8, 34. [CrossRef] [PubMed]
25. Miller-Rushing, A.J.; Høye, T.T.; Inouye, D.W.; Post, E. The effects of phenological mismatches on demography.
Philos. Trans. R. Soc. B 2010, 365, 3177–3186. [CrossRef]
26. Kehrberger, S.; Holzschuh, A. Warmer temperatures advance flowering in a spring plant more strongly than
emergence of two solitary spring bee species. PLoS ONE 2019, 14, e0218824. [CrossRef]
27. Kudo, G.; Ida, T.Y. Early onset of spring increases the phenological mismatch between plants and pollinators.
Ecology 2013, 94, 2311–2320. [CrossRef]
28. Berndes, G.; Bird, N.; Cowie, A. Bioenergy, Land Use Change and Climate Change Mitigation; IEA Bioenergy:
Rotorua, New Zealand, 2013; Available online: https://www.ieabioenergy.com/wp-content/uploads/2013/10/
Bioenergy-Land-Use-Change-and-Climate-Change-Mitigation-Background-Technical-Report.pdf (accessed
on 10 August 2020).
29. Zhang, X.; Friedl, M.A.; Schaaf, C.B.; Strahler, A.H.; Schneider, A. The footprint of urban climates on
vegetation phenology. Geophys. Res. Lett. 2004, 31, 1–4. [CrossRef]
30. Yao, X.; Wang, Z.; Wang, H. Impact of Urbanization and Land-Use Change on Surface Climate in Middle and
Lower Reaches of the Yangtze River, 1988–2008. Adv. Meteorol. 2015, 2015, 10. [CrossRef]You can also read