Measurement report: Effect of wind shear on PM10 concentration vertical structure in the urban boundary layer in a complex terrain
←
→
Page content transcription
If your browser does not render page correctly, please read the page content below
Atmos. Chem. Phys., 21, 12113–12139, 2021
https://doi.org/10.5194/acp-21-12113-2021
© Author(s) 2021. This work is distributed under
the Creative Commons Attribution 4.0 License.

Measurement report: Effect of wind shear on PM10 concentration
vertical structure in the urban boundary layer in a complex terrain
Piotr Sekuła1,2 , Anita Bokwa3 , Jakub Bartyzel1 , Bogdan Bochenek2 , Łukasz Chmura1,2 , Michał Gałkowski1,4 , and
Mirosław Zimnoch1
1 Faculty  of Physics and Applied Computer Science, AGH-University of Science and Technology,
19 Reymonta St., 30-059 Kraków, Poland
2 Institute of Meteorology and Water Management, National Research Institute, Branch of Kraków,

14 Piotra Borowego St., 30-215 Kraków, Poland
3 Institute of Geography and Spatial Management, Jagiellonian University, 7 Gronostajowa St., 30-387 Kraków, Poland
4 Max Planck Institute for Biogeochemistry, Department of Biogeochemical Signals,

Hans-Knoll-Str. 10, 07745 Jena, Germany

Correspondence: Anita Bokwa (anita.bokwa@uj.edu.pl)

Received: 31 January 2021 – Discussion started: 15 March 2021
Revised: 25 May 2021 – Accepted: 29 June 2021 – Published: 13 August 2021

Abstract. The paper shows wind shear impact on PM10 ver-            100–120 m a.g.l. – the zone where air quality is significantly
tical profiles in Kraków, southern Poland. The data used            better than in zone 1, either due to the increase in the wind
consist of background data for two cold seasons (Septem-            speed or due to the wind direction change and advection of
ber 2018 to April 2019 and September 2019 to April 2020)            different, clean air masses.
and data for several case studies from November 2019 to
March 2020. The data are composed of PM10 measurements,
model data, and wind speed and direction data. The back-
ground model data come from operational forecast results of
the AROME model. PM10 concentration in the vertical pro-            1   Introduction
file was measured with a sightseeing balloon. Significant spa-
tial variability of the wind field was found. The case studies      Particulate matter (PM) concentration remains one of the
represent the conditions with much lower wind speed and a           most relevant air-quality concerns in urban environments
much higher PM10 level than the seasonal average. The in-           (Thürkow et al., 2021). Exposure to ambient PM concentra-
versions were much more frequent than on average too. Wind          tion with diameter below 10 µm (PM10 ) can cause lung irri-
shear turned out to be the important factor in terms of PM10        tation, cellular damage, coughing asthma, and cardiovascular
vertical profile modification. It is generated due to the relief    diseases (Jeong, 2013). Particles with diameter below 1 µm
impact, i.e. the presence of a large valley, blocked on one side    (i.e. fine and ultrafine particles which constitute in most cases
with the hills. The analysis of PM10 profiles from all flights      the majority of PM10 fraction) have the strongest impact on
allows us to distinguish three vertical zones of potential air      health because they can reach the deepest portions of the
pollution hazards within the valley (about 100 m deep) and          airways or even the bloodstream (Franchini and Mannucci,
the city of Kraków: (1) up to about 60 m a.g.l. – the zone          2007, 2011). Presence of the particulate matter in the ambi-
where during periods of low wind speed, air pollution is po-        ent air is the result of multiple physio-chemical processes, in-
tentially the highest and the duration of such high levels is the   cluding local emission, chemical transformation, long-range
longest, i.e. the zone with the worst aerosanitary conditions;      transport, vertical mixing and deposition, most of which are
(2) about 60–100 m a.g.l. – transitional zone where the large       dependent on meteorological conditions across a large range
decrease in PM10 levels with height is observed; (3) above          of spatial and temporal scales (Zhang et al., 2015; Zhou et
                                                                    al., 2020; Thürkow et al., 2021).

Published by Copernicus Publications on behalf of the European Geosciences Union.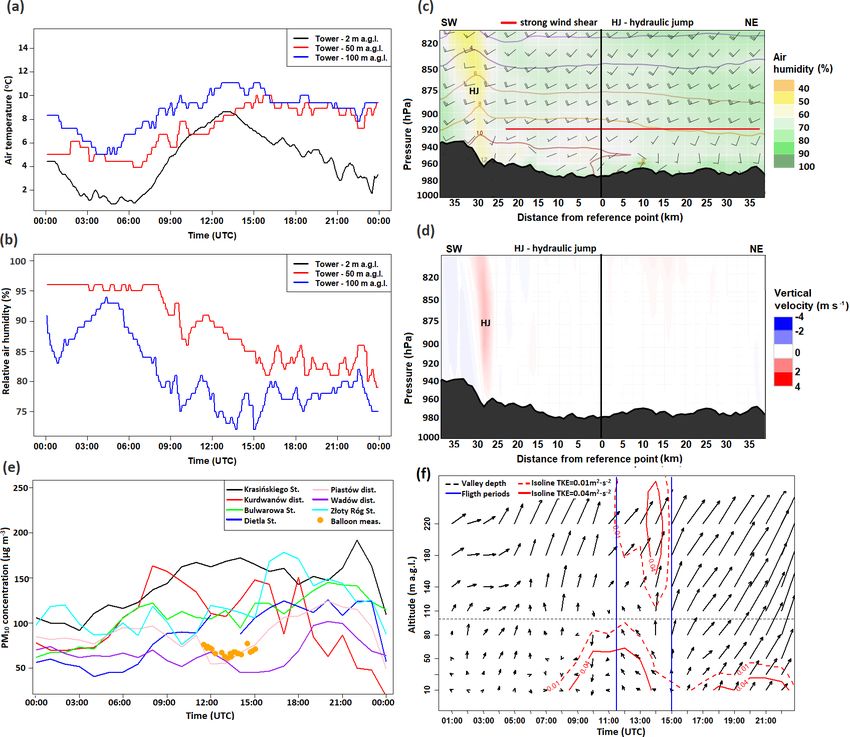
12114        P. Sekuła et al.: Effect of wind shear on PM10 concentration vertical structure in the urban boundary layer

   Local meteorological conditions determine primarily the              and from removal of the pollutants from the upper lay-
dispersion of air pollutants and their removal (Trompetter et           ers;
al., 2013), but they also affect chemical and physical pro-
cesses linked to the origin of the primary and secondary             – the occurrence of a layer with increased concentration
aerosols (Zhou et al., 2020). One of the most studied mete-            of air pollution at a certain height, connected to vertical
orological phenomena is the occurrence of above-ground air             diffusion (Strbova et al., 2017) or diffusion of plumes
temperature gradient inversion, which has a direct impact on           from elevated sources (Xu et al., 2019);
the vertical distribution of the concentration of PM10 and its       – a slight decrease in air pollution with height connected
individual components, e.g. black carbon (Zhou et al., 2020)           to the occurrence of strong vertical movements (Strbova
or organic PM10 tracers like levoglucosan (Marynowski et               et al., 2017) or removal of local air pollution due to syn-
al., 2020). Numerous studies indicate that an important fac-           optic processes linked to the advection of air masses.
tor that affects the pollution profile is the wind profile (Li
and Han, 2016; Zhou et al., 2020), occurrence of low-level         It is noteworthy that many recent studies of air pollution con-
jets (Li et al., 2012, 2019) or downward flows of pollutants       centration’s vertical structure in cities were realized mainly
(Han et al., 2018) which may strongly modify the diurnal           for areas with little variation in the topography (e.g. Paris,
cycle of a pollutant concentration in the lowest part of the       Renard et al., 2020, Tianjin, Han et al., 2018), includ-
troposphere.                                                       ing coastal areas (Guangzhou, Zhou et al., 2020, Shang-
   The vertical structure of the pollutant concentration           hai, Zhang et al., 2017). In fact, the understanding and the
strongly depends on many factors, including season, me-            quantification of pollutant dispersion over complex terrain
teorological conditions (Wang et al., 2018), topography            are much more difficult than over flat areas, as dispersion
(Trompetter et al., 2013; Strbova et al., 2017), and seasonal      processes are affected by atmospheric interactions with the
variability of local emissions and long-range transport (Li        orography at different spatial scales (Giovannini et al., 2020).
and Han, 2016). Due to this fact it is necessary to continu-       Studies presenting vertical profiles of pollutants’ concentra-
ously study the spatial and vertical distributions of air pollu-   tion in urbanized valleys are still necessary to better under-
tion concentration in urbanized areas to better determine its      stand the impact of meteorology and topography on air pollu-
sources and processes leading to abundant air pollution.           tant dispersion (Strbova et al., 2017; Zhao et al., 2019; Samad
   Research on the vertical structure of air pollution has been    et al., 2020).
carried out in the past using several methods: stationary point        A key parameter affecting pollutant concentration during
measurements in the profile using the available infrastructure     the daytime is the height of the atmospheric boundary layer
(e.g. Marynowski et al., 2020), balloon flights (e.g. Han et       (ABL), which determines the volume of atmosphere avail-
al., 2018; Renard et al., 2020), airplane or unmanned aerial       able for pollutant dispersion. Turbulent mixing is a key fac-
vehicle (UAV) (Liu et al., 2020), lidar (Li and Han, 2016;         tor which controls the evolution of the ABL depth (Giovan-
Wang et al., 2020) or the use of satellite data (Ferrero et al.,   nini et al., 2020). One of the important factors is the wind
2019). The highest vertical resolution can be achieved with        shear as it may essentially modify the structure of mean flow
the use of an aircraft (plane, balloon, UAV); however, these       and turbulence in the convective boundary layer (CBL), e.g.
methods have certain limitations, e.g. lifting capacity, limited   by stretching and decoupling of the turbulent structures’ pro-
flight time and limited maximum reachable altitude, and they       duction or separation of a single-layer CBL into a two-layer
cannot operate during unfavourable weather conditions.             structure (Fedorovich and Conzemius, 2008; Rodier et al.,
   Throughout the previously published studies focused on          2017). Studies presenting the impact of ABL dynamics on
the topic of lower-tropospheric air pollution, several types       vertical pollutant structure indicate that a low-level jet com-
of the pollution concentration vertical profiles can be distin-    bined with a strong wind shear affects the transportation of
guished:                                                           the pollution e.g. by removing it (Trompetter et al., 2013) or
                                                                   bringing it in (pushing into the residual layer) and by favour-
  – two layers with significantly different concentration, i.e.    ing the growth of ABL height and weakening the stability of
    high concentration in the stratum from the ground level        the atmosphere (Li et al., 2019).
    to a certain height, then a transition layer with a rapid          The present study is focused on the impact of wind shear
    decrease in pollutant concentration with height and a          on the vertical profile of PM10 concentration in Kraków,
    stratum with a low concentration in the profile above;         southern Poland, a city located in a large valley. The proper-
    usually linked to thermal inversion occurrence (Strbova        ties of the ABL, including the vertical profile of wind speed
    et al., 2017; Wang et al., 2018; Samad et al., 2020);          and direction, are strongly modified by both the relief and
                                                                   the synoptic situation, and so are the air pollution’s disper-
  – a large, constant decrease in a pollutant concentration        sion conditions, which in turn affects the pollutants con-
    with height, resulting e.g. from a strong surface emis-        centration’s profile. Those circumstances are of the highest
    sion of a pollutant during stable conditions, from kata-       importance in a city located in a valley as the built-up ar-
    batic flows bringing the pollutants (Strbova et al., 2017),    eas are located both in the valley bottom as well as on its

Atmos. Chem. Phys., 21, 12113–12139, 2021                                          https://doi.org/10.5194/acp-21-12113-2021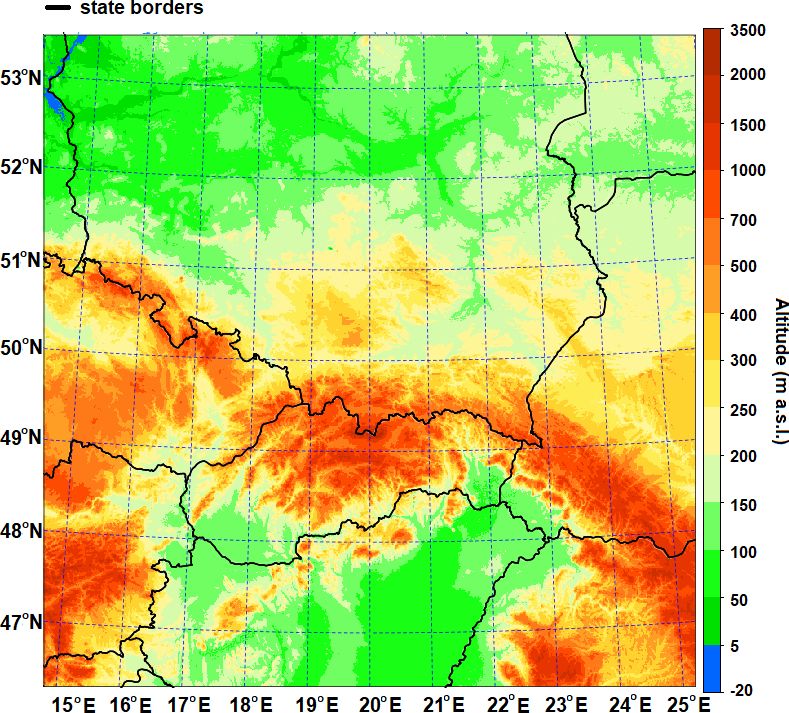
P. Sekuła et al.: Effect of wind shear on PM10 concentration vertical structure in the urban boundary layer                  12115

slopes, i.e. in a vertical profile of the land form. Kraków is    enters the Wisła River with a valley cutting the Carpathian
a good study area for such considerations as it is located        Foothills from the south to the north. The hilltops bordering
in diversified environmental conditions (described in detail      the city to the north and the south reach about 100 m above
in Sect. 2), and despite various legal actions aimed at re-       the river valley floor, similar to the hilltops in the western
ducing local PM10 emissions, daily limit values for PM10          part of the valley, which means that the city is located in a
are still exceeded during cold seasons. Moreover, Kraków          semi-concave land form (open only to the east) and sheltered
is representative of many cities located in central Europe        from the prevailing western winds (Fig. 1). The local-scale
where aerosanitary conditions are relatively worse in com-        processes linked to the impact of relief include, for example,
parison to the cities in the western part of the continent, as    katabatic flows, cold-air pool (CAP) formation, frequent air
presented e.g. in the reports of the European Environment         temperature inversions, and much lower wind speed in the
Agency (EEA, 2020). Poor air quality is, on the one hand,         valley floor than at the hilltops (e.g. Hess, 1974). According
the result of PM10 emissions, which in the case of Poland are     to the studies on thermal stratification obtained for Kraków
among the highest in Europe (Statista, 2021), with however a      by using sodar measurements with hourly resolution, in the
decreasing trend in recent years (Voivodeship Inspectorate of     months from October to March, the mean monthly frequency
Environmental Protection, 2017). However, high PM10 con-          of stable atmosphere conditions varies from 58.1 % in March
centrations are also linked to long-range transport of air pol-   to 74.0 % in December (Godłowska, 2019). All factors men-
lution from other countries (Godłowska et al., 2015). In the      tioned above contribute to the poor natural ventilation of the
Lesser Poland region (Małopolska) where Kraków is located,        city and the occurrence of high PM10 levels, especially in the
the main source of PM10 is the emission from the munici-          heating season.
pal and housing sector (78.9 % of the annual emission), from
transportation (5 %), and from industry (7.8 %). In Kraków,
the emissions related to vehicle traffic account for as much      3     Data and methods
as 12 % of annual emission (Chief Inspectorate of Environ-
mental Protection, 2020). Understanding the meteorological        3.1     Surface measurements
processes leading to the enhanced concentration levels is one
of the key factors to enable the development strategies for in-   The data used consist of background data for two cold sea-
habited areas to further reduce the number of smog episodes.      sons (September 2018 to April 2019 and September 2019 to
To date no studies presenting temporal variability of PM10        April 2020) and data for several case studies from Novem-
concentration in the vertical profile in the cold season have     ber 2019 to March 2020. The background data are composed
been reported in that region.                                     of PM10 measurements from seven stations, model data, and
                                                                  wind speed and direction data from four meteorological sta-
                                                                  tions. The data for case studies come from seven stations with
2   Study area                                                    PM10 measurements, model analyses, and eight meteorolog-
                                                                  ical stations (wind speed and direction, air temperature, air
Kraków is a large valley city located in the Wisła River val-     humidity and cloudiness) (Fig. 2, Tables 1 and 2).
ley, which is parallel to the border of the Carpathian Moun-         Data on PM10 concentrations in Kraków come from
tains to the south and the border of the Polish Uplands to        databases of the National Inspectorate of Environmental Pro-
the north (Fig. 1). About 100 km south of Kraków, there           tection (NIEP) (https://powietrze.gios.gov.pl/pjp/archives,
is the highest ridge of the Carpathians, the Tatra Moun-          last access: 21 April 2021). Mean hourly data from seven
tains. Kraków is the second largest city of Poland, located       measurement points were used (Table 1). The measurement
in the Lesser Poland region (Małopolska), with an area of         points represent several parts of the city and are located in
326.8 km2 and the official number of inhabitants reaching         various types of land form and land use/land cover (see Fig. 2
771 000 (as of December 2018, Statistical Office in Kraków,       for the location of the measurement points):
2019). The Kraków agglomeration consists of the city itself
and highly populated towns and villages which surround it,            A. Krasińskiego St.: street canyon in the city centre, in the
with the total number of inhabitants estimated to exceed 1               bottom of the Wisła River valley, with a very busy mu-
million. The city’s area belongs to three different geographi-           nicipal transportation route and intensive traffic;
cal regions and geological structures, i.e. the Polish Uplands,
the Western Carpathians, and the basins of the Carpathian             B. Dietla St.: a busy cross-road in the city centre, at the
Foredeep in between (Bokwa, 2009). The central part of the               bottom of the Wisła River valley, with intensive tram,
city is located in the Wisła River valley, at an altitude of             bus and car traffic;
about 200 m a.s.l. In the western part of Kraków, the val-
ley is as narrow as 1 km. However, in the eastern part of the         C. Kurdwanów district: suburban area with a large district
city, the valley widens to about 10 km, and there is a system            of blocks of flats, in the southern part of the city, about
of river terraces. East of the city’s borders, the Raba River            50 m above the valley floor;

https://doi.org/10.5194/acp-21-12113-2021                                          Atmos. Chem. Phys., 21, 12113–12139, 2021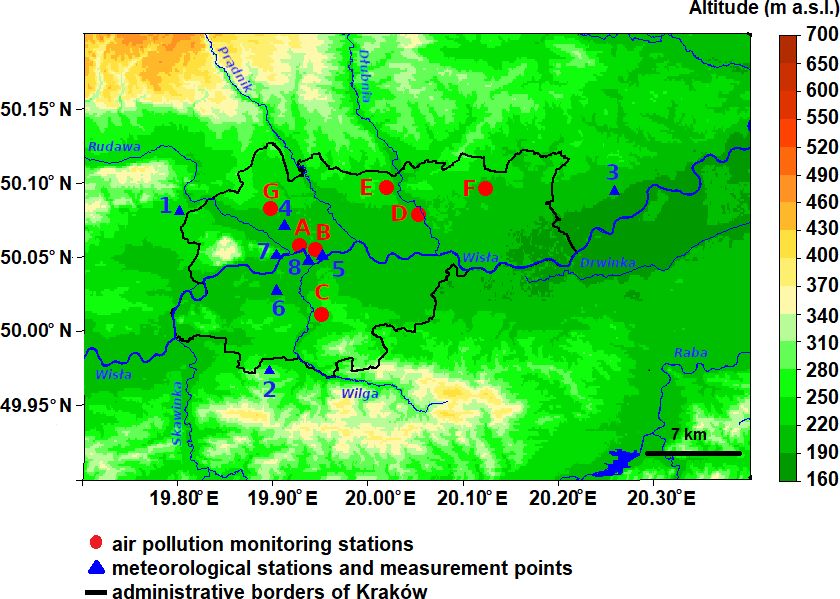
12116        P. Sekuła et al.: Effect of wind shear on PM10 concentration vertical structure in the urban boundary layer

Figure 1. Location of the region studied: (a) in central Europe; (b) in southern Poland. Explanations: station no. 9 as in Table 2. The black
frame in (b) represents the analysed area shown in Fig. 2.

 D. Bulwarowa St.: suburban area with a large district of
    blocks of flats, located close to the steelworks, in the
    eastern part of the city, at a terrace of the Wisła River;

 E. Piastów district: suburban area with a large district of
    blocks of flats, in the eastern part of the city, on the up-
    land slope, about 50 m above the valley floor;

  F. Wadów district: suburban area with agriculture activity
     and loose residential build-up, located close to the steel-
     works, at a river terrace in the eastern part of the Wisła
     valley;

 G. Złoty Róg St.: suburban area with a large district of
    blocks of flats and residential build-up, on the upland
    slope, in the western part of the city.
                                                                         Figure 2. Location of the region studied at the junction of the Wisła
   Background data on wind conditions in the Wisła River                 River valley, Polish Uplands and Western Carpathian Foothills. Ex-
valley and the neighbouring hilltop were obtained from the               planations: numbers and letters as in Tables 1 and 2.
stations of the Institute of Meteorology and Water Manage-
ment – National Research Institute (IMWM-NRI) (Balice,
Igołomia and Libertów) and the station of AGH University of              3.2   Modelling systems
Science and Technology (AGH UST), located in Reymonta
St. (city centre) on the roof of the Faculty of Physics and              The Aire Limitée Adaptation Dynamique Développement In-
Applied Computer Science. Wind speed and direction data                  terNational (ALADIN) system is a numerical weather pre-
of hourly resolution were used. Table 2 and Fig. 2 show the              diction (NWP) system developed by the international AL-
locations of the stations and the range of measurements.                 ADIN consortium for operational weather forecasting and

Atmos. Chem. Phys., 21, 12113–12139, 2021                                                 https://doi.org/10.5194/acp-21-12113-2021
P. Sekuła et al.: Effect of wind shear on PM10 concentration vertical structure in the urban boundary layer 12117
Table 1. Location of air pollution monitoring stations in Kraków.
Symbol Station Lat ◦ N Long ◦ E Altitude Land form
(m a.s.l.)
A Krasińskiego St. 50.06 19.93 207 Valley bottom
B Dietla St. 50.05 19.94 209 Valley bottom
C Kurdwanów district 50.01 19.95 223 Valley slope
D Bulwarowa St. 50.08 20.05 195 Valley bottom
E Piastów district 50.10 20.02 239 Valley slope
F Wadów district 50.10 20.12 218 Valley bottom
G Złoty Róg St. 50.08 19.90 218 Valley slope
research purposes (Termonia et al., 2018). Part of the con- lected points, representing Balice meteorological station, the
sortium’s development work is to provide several configura- TV tower with vertical profile measurements, the city centre,
tions of limited-area models (LAMs), which were precisely and Bulwarowa St. (PM10 measurements). The points men-
validated to be used for operational weather forecasting at the tioned are located along the valley bottom in the W–E cross
16 partner institutes. These configurations are called the AL- section.
ADIN canonical model configurations (CMCs). Currently
there are three canonical model configurations: (1) ALADIN 3.3 Vertical profile observations and data verification
baseline CMC, (2) Application of Research to Operations
at Mesoscale (AROME) CMC, and (3) ALADIN–AROME For the period from November 2019 to March 2020, addi-
(ALARO) CMC. AROME CMC and ALARO CMC are op- tional data for the case studies are available. They consist
erationally used in IMWM-NRI, together with the CY43T2. of measurements of PM10 concentration in the vertical pro-
The background model data come from operational fore- file, performed on 31 d selected. The PM10 profiles’ mea-
cast results of the AROME model. Operational model surements were carried out in cooperation with the com-
AROME CMC 2 km has a horizontal resolution of pany Balon Widokowy sp. z o. o. (http://balonwidokowy.pl/,
2 km × 2 km and 70 vertical levels, and the forecast length is last access: 21 April 2021) which operates commercially
30 h. The size of the AROME CMC 2 km domain is 799×799 the sightseeing balloon in Kraków. The PM10 measure-
points centered on the geographical point 19.3◦ E, 52.3◦ N. ments were conducted up to a maximum altitude of almost
The location of the lowest model level is at 9 m above ground 300 m a.g.l. Balloon flights were performed in the western
level, and the model top is located at 65 km above ground part of the city, at the Wisła River, in the city centre, close
level. During the analysed periods the model version was to the air quality monitoring stations Krasińskiego St. and
changed from CY40T1 to CY43T2 (11 February 2020). Sea- Dietla St.
sonal verification of the AROME CMC model forecast re- Measurements of PM10 concentration in the vertical pro-
sults showed compliance of the new version with the previ- file were conducted by the Personal Dust Monitor (PoDust
ous one (Bochenek et al., 2020). v1.1) system based on the low-cost Plantower PMS1003 op-
The ALARO model was used to prepare lateral bound- tical dust sensor and Arduino platform presented in Fig. 2.
ary data for the AROME model. ALARO CMC CY43T2 The measurement system was attached to the outside of the
is a non-hydrostatic model, with a horizontal resolution of balloon basket. It was built based on the Arduino Mega 2560
4 × 4 km and 70 vertical levels. The model configurations microcontroller, responsible for communication with the sen-
ALARO CMC and AROME CMC have been validated by sors, storing the measurements with 1 s resolution on the
the ALADIN team at IMWM-NRI for CY43T2 for resolu- memory card, and sending information in real time to the
tions 4 km × 4 km and 2 km × 2 km, respectively. Due to on- database using a WiFi connection. To reduce the impact of
going work on the assimilation of surface data in the ALARO water vapour on PM10 measurement during the fog condi-
model in the ALADIN Poland group, data assimilation was tions, the sensor inlet was heated up to 60 ◦ C. To provide
not used in this research, and models were run in dynamical information on an actual location and other environmental
adaptation mode. conditions, the system was equipped with a GPS receiver
Archival forecasts of the AROME CMC model with a tem- and thermo/hygro/baro sensor providing e.g. the altitude es-
poral resolution of 1 h (forecast hours from the 6th to 29th) timated with combined GPS and barometer signals.
were used to study the characteristics of vertical wind and The measurement campaign covered the period from
temperature profiles in the valley, with a special focus on 28 November 2019 to 3 March 2020, during which 317
three height levels (50, 100 and 200 m a.g.l.), as the valley flights were conducted (31 d, 634 vertical profiles). Maxi-
depth is about 100 m. Analyses were conducted at four se- mum flight altitude varied between 78 and 284 m a.g.l., de-
pending on the vertical wind profile and the number of
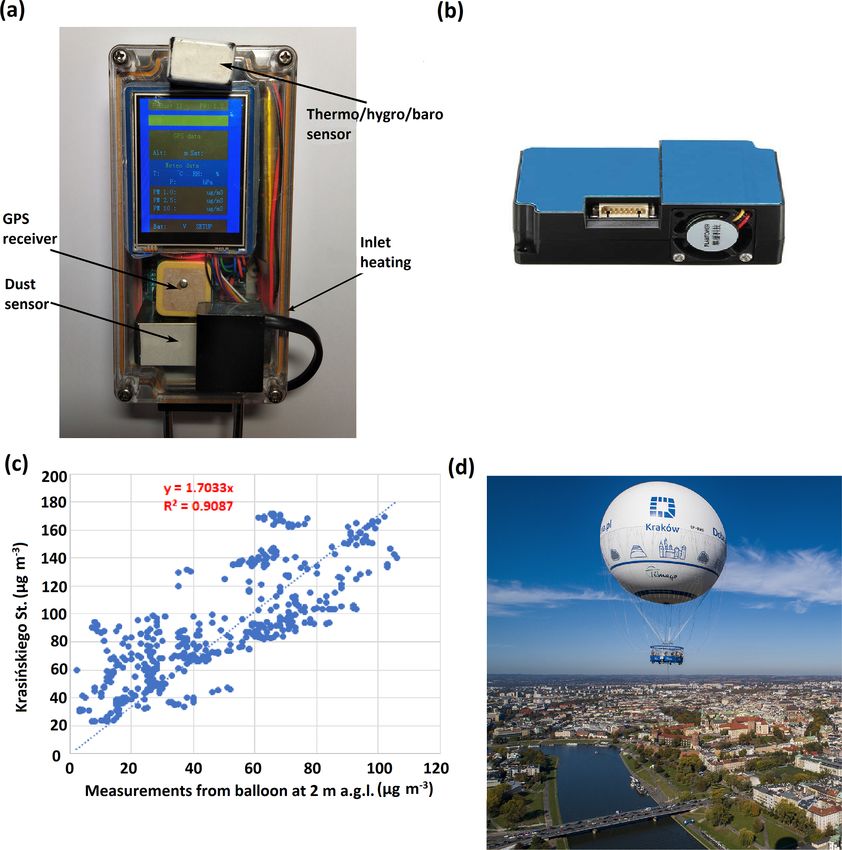
https://doi.org/10.5194/acp-21-12113-2021 Atmos. Chem. Phys., 21, 12113–12139, 202112118 P. Sekuła et al.: Effect of wind shear on PM10 concentration vertical structure in the urban boundary layer passengers. Typical flight altitude during the sightseeing of mountain waves. Information about Ac len cloud occur- flight was 150 m a.g.l., but during low wind speed at higher rence was obtained from the station in the Botanical Garden altitudes and low passenger load, the maximum altitude in Kraków. Data on air temperature in the vertical profile of was increased. The measurements were performed at dif- the Wisła River valley were obtained from stationary mea- ferent hours. The balloon’s flight speed does not exceed surements at the altitudes 2, 50 and 100 m a.g.l. from the TV 1 m s−1 (ascent up to 0.8 m s−1 , descent approximately up tower located in the western part of the valley. Table 2 and to 0.6 m s−1 ); flight time (ascent/descent) depended on the Figs. 1 and 2 show the locations of the stations and the range maximum altitude and ranged from 2–3 min (for maximum of measurements. height 100 m a.g.l.) up to 6–10 min (for maximum height For the analysis of case study data, a different model con- 300 m a.g.l.). figuration was used than for background data from the two The frequency of flights depended on meteorological con- cold seasons. Non-operational configuration of the AROME ditions and the number of customers. The decision to fly on CMC 1 km × 1 km CY43T2 (AROME CMC 1 km) was ap- a given day was first made based on the current forecast plied. Operational model ALARO CY43T2 was used to (available at https://m.meteo.pl/ and https://meteo.imgw.pl, prepare lateral boundary data for AROME model version last access: 21 April 2021) analysed by the flight operator. CY43T2. Non-hydrostatic model AROME CMC 1 km has The factors determining the impossibility of flying are the a horizontal resolution of 1 km × 1 km and 87 vertical levels; occurring or forecasted wind gusts above 8 m s−1 , the risk the forecast length was 30 h. The size of the AROME CMC of storms or the incoming atmospheric front, balloon icing, 1 km domain was 810 × 810 points centered on geographical too low air temperature (below −10 ◦ C), atmospheric precip- point 20◦ E, 50◦ N. The location of the lowest model level itation or low visibility. More than 70 % of the flights were is at 9 m a.g.l., and the model top is located at 50 km a.g.l. performed up to 180 m above ground level, and flights reach- Details concerning the height of the lowest model levels up ing over 200 m above ground level made up only 15 % of to 3 km altitude, information about parametrization schemes the cases. Almost 50 % of the vertical profiles were con- used in the AROME model and a topographic map of the ducted between 12:00 and 15:00 UTC, while profiles from model domain are included in Tables A1 and A2 and Fig. A2. 15:00 to 20:00 UTC constitute 23 % of the cases (Fig. A1). The data obtained with the model were used to provide verti- The flight altitude depended on the wind speed in the whole cal profiles of wind speed and direction, air temperature, rel- vertical profile of the balloon range, which was measured di- ative humidity and turbulent kinetic energy (TKE) with 1 h rectly during the flight. Figure 3 presents a comparison of temporal resolution in the points representative of the west- PM10 measurements from the balloon device, conducted at ern, central and eastern parts of the city, corresponding to the 2 m a.g.l., and measurements from the nearby Krasińskiego measurements in Balice, Bulwarowa St. and the balloon mea- station. As the measurements from the Krasińskiego station surement point, respectively. Additionally, N–S cross sec- are of hourly resolution, linear interpolation of two adjacent tions through the valley at those points were obtained for the measurements was applied to obtain the same data resolution same elements. For selected cases, wind, TKE and air tem- as for the balloon. The intersection point of the straight line perature fields at selected levels were obtained for the whole matching the graph has been set to 0 because tests on the area of Kraków and its surroundings. Plantower sensor have shown the correct measurement for a Verification of forecast results of AROME CMC 1 km was concentration close to 0 µg m−3 . performed for 24 h periods (i.e. from the 6th to 29th hours Data on meteorological conditions, on synoptic and local of forecast with 1 h resolution) for the selected 31 d of the scales, for Kraków for days with balloon flights were ob- case study period. Data obtained from four meteorological tained from the meteorological stations already mentioned stations (Balice, Libertów, Igołomia and Reymonta St.) were above and additionally from two stations administered by the used to verify the model forecast of air temperature, air hu- Jagiellonian University (JU) (Campus JU, Botanical Garden) midity and wind components in the valley bottom and at the and one station administered by IMWM-NRI (Kasprowy hilltop. The values of the root mean square error (RMSE) be- Wierch, in the Tatra Mountains). The JU also administers tween observation and forecast were lower than 2 ◦ C for air measurements at the television tower (the technical details temperature, 1.5 m s−1 for wind speed and 14 % for relative can be found in Bokwa, 2010); the tower belongs to the Emi- humidity at all the meteorological stations. Air temperature tel company. and humidity measurements at 50 and 100 m a.g.l. from the Due to the possible effect of foehn occurrence on ABL TV tower station were used to verify model forecast of at- modification, potential foehn occurrence was determined mosphere stratification in the western part of the Wisła River based on the criteria of Ustrnul (1992) and on the analysis of valley. Values of RMSE and difference (bias) for air temper- the measurement data from the synoptic stations Kasprowy ature and humidity for both altitudes (i.e. 50 and 100 m) are Wierch (wind speed and direction) and Balice (wind speed similar: on average RMSE was equal to 1.5 ◦ C for air tem- and direction and air humidity). One of the criteria determin- perature and 9.5 % for relative humidity. ing foehn occurrence in Kraków is the presence of altocumu- Data analysis for the background period (i.e. two cold sea- lus lenticularis clouds (Ac len), which are one of the effects sons) included calculation of standard characteristics for par- Atmos. Chem. Phys., 21, 12113–12139, 2021 https://doi.org/10.5194/acp-21-12113-2021
P. Sekuła et al.: Effect of wind shear on PM10 concentration vertical structure in the urban boundary layer                                                     12119

Figure 3. Self-designed and built air pollution measuring system (a), low-cost sensor Plantower PMS1003 PM component (b), correlation
of measurements from balloon location and closest air pollution station (Krasińskiego St.) with fitted regression curve and R squared factor
(c) and (d) sightseeing balloon (source: http://balonwidokowy.pl, last access: 21 April 2021).

Table 2. Locations of meteorological stations in Kraków and its vicinities, station Kasprowy Wierch, balloon measurement point and mete-
orological elements used in the study.

  No.     Station                              Lat ◦ N       Long ◦ E       Altitude      Manager of the station         Land form              Elements used
                                                                            (m a.s.l.)
  1       Balice                               50.08         19.80          237           IMWM-NRI                       Valley bottom          V , D, T , RH
  2       Libertów                             49.97         19.90          314           IMWM-NRI                       Hilltop                V , D, T , RH
  3       Igołomia                             50.09         20.26          202           IMWM-NRI                       Valley bottom          V , D, T , RH
  4       Reymonta St.                         50.07         19.91          220           AGH UST                        Valley bottom          V , D, T , RH
  5       Botanical Garden                     50.05         19.95          206           JU                             Valley bottom          V , D, Ac len clouds
  6       Campus JU                            50.03         19.90          233           JU                             Valley bottom          V, D
  7       TV tower:                                                                       JU                             Valley bottom          T , RH
          2 m a.g.l.                                                        222
          50 m a.g.l.                          50.05         19.90          272
          100 m a.g.l.                                                      322
  8       Balloon measurement point            50.05         19.94          200           AGH UST                        Valley bottom          PM10
  9       Kasprowy Wierch                      49.23         19.98          1998          IMWM-NRI                       Mountain peak          V , D, T , RH
Explanations: AGH UST – AGH University of Science and Technology, JU – Jagiellonian University. More information about the measurement points administered by JU can be
found in Bokwa (2010). V – wind speed, D – wind direction, T – air temperature, RH – relative humidity.

https://doi.org/10.5194/acp-21-12113-2021                                                                 Atmos. Chem. Phys., 21, 12113–12139, 2021
12120 P. Sekuła et al.: Effect of wind shear on PM10 concentration vertical structure in the urban boundary layer
ticular elements studied in order (1) to determine their spatial – Group II: the difference between PM10 concentra-
variability in the study area, (2) to define wind shear condi- tion at the ground layer and in the upper layer was
tions, and (3) for further use in the verification of the rep- greater than 25 µg m3 and variable y2 was in the range
resentativeness of the case study period. The indices used [−200; 30] m a.g.l. (determined experimentally for this
included wind roses for the ground stations, wind speed his- data set) (17 vertical profiles).
tograms for three levels (50, 100 and 200 m a.g.l.), air tem-
perature gradients, differences in PM10 concentrations be- – Group III: the difference between PM10 concentration at
tween the stations, and the correlation between PM10 con- the ground layer and in the upper layer was greater than
centrations and wind speed. 25 µg m3 and the variable y2 was greater than 30 m a.g.l.
The analysis of vertical profiles of PM10 concentration for (134 vertical profiles).
individual days of the measurement campaign indicated that
Figure 4 presents an example of vertical profiles from Groups
there were three characteristic vertical profiles of PM10 con-
II and III with a fitted sigmoid curve and variables b, c, d, e,
centration.
y1 and y2 . It should be mentioned that fitting the sigmoid
– Group I: a profile with constant bracing throughout the curve to vertical profiles of PM10 concentration is useful in
vertical profile (slight fluctuations) the analysis due to the estimation of the PM10 concentration
in the upper layer (by assuming that the vertical profile of
– Group II: a profile with a significant linear decrease the parameter has a shape consistent with the function) and
in concentration from the ground level up to a certain determination of the transition layer.
height Three groups/patterns of PM10 concentration vertical pro-
files were obtained, and for each of them all meteorological
– Group III: “S”-shaped profile (sigmoid curve) data were analysed in order to determine their significance in
controlling the air pollution vertical structure.
For the case study period, first the PM10 concentration ver-
tical profiles were classified with a subjective method of fit-
ting the sigmoid curve to each vertical profile. For this pur- 4 Results
pose, the logistic curve was used which was determined by
the equation 4.1 Spatial and temporal variability of anemological
conditions
d −c
Y =c+ , (1) Analysis of the data on wind speed and direction from three
1 + exp (b(X − e))
meteorological stations in the Wisła valley (Balice, Rey-
where b is the slope around the inflection point, c is the lower monta St., Igołomia) and one station at the nearby hilltop
asymptote, d is the higher asymptote, and e is a parame- (Libertów) for the two cold seasons (September 2018 to
ter determining the X value producing a response half way April 2019 and September 2019 to April 2020) indicated sig-
between d and c. The parameter b can be positive or neg- nificant spatial variability of that element due to the complex-
ative and, consequently, Y may increase or decrease as X ity of the land forms and the presence of urban structures.
increases. However, the differences of the wind structure between both
In the first step, all possible parameters b, c, d, and e were seasons were negligible. In terms of spatial variability, the
determined. If the lower asymptote c was below 0, the fitting average frequency of weak wind (up to 2 m s−1 ) varied from
curve was repeated with a default value of parameter c equal 43 % in Balice to 61 % in Reymonta St.; in Libertów and
to 0 (minimum PM10 concentration in the atmosphere). Igołomia the values reached 50 % and 53 %, respectively. For
Additionally, in order to better analyse the S-shaped fitted the wind speed ≥ 4 m s−1 , the highest average frequency was
curve, a linear curve was fitted close to the inflection point to measured in Balice (27 %), while in Libertów and Reymonta
determine the intersection with the asymptotes c and d (vari- St. it did not exceed 10 %, and in Igołomia it reached 21 %.
ables y1 and y2 ). Differences between y1 and y2 represented Wind speed ≥ 10 m s−1 was noted in Igołomia and Balice
transition layer depth. only. Dominant wind directions are strongly linked to the re-
In order to separate vertical profiles into the three groups, lief impact. In Balice those are SW and NE, in Igołomia and
boundary conditions were determined. Reymonta St. W and E, and in Libertów it is the western sec-
tor: SW to WNW (Fig. A3).
– Group I: PM10 concentration at the ground layer (below Similar calculations were also performed for the case
10 m a.g.l.) was lower than 30 µg m−3 (275 vertical pro- study period, i.e. 31 d during which the flights were con-
files) or the difference between PM10 concentration at ducted, within the period from 28 November 2019 to
the ground layer and in the upper layer (i.e. close to the 3 March 2020, in order to check whether these results can
maximum flight altitude) was less than 25 µg m3 (208 be treated as representative of the whole cold period. The
vertical profiles). frequency of wind speed ≤ 2 m s−1 was much larger than
Atmos. Chem. Phys., 21, 12113–12139, 2021 https://doi.org/10.5194/acp-21-12113-2021P. Sekuła et al.: Effect of wind shear on PM10 concentration vertical structure in the urban boundary layer 12121
Figure 4. Vertical profiles of the PM10 concentration with the fitted sigmoid curve and estimated optimal parameters representing the “S”-
shaped profile, group III (a), and significant linear decrease from ground level, group II (b).
the average value for both seasons, from 62 % in Balice to nighttime, respectively. The values for the case study period
83 % in Reymonta St., while the frequency of wind speed reached 42 % and 52 %, and for the wind shear which lasted
≥ 4 m s−1 was much smaller, from 0.1 % in Reymonta St. to over 4 h it was 23.7 % and 46.2 %.
7.9 % in Balice. Dominant wind directions for the case study On the basis of the above comparisons, it is possible to
period did not differ significantly from the average values for conclude that on the days which belong to the case study
both seasons. Therefore, the case study period can be consid- period, wind speed was much lower than on average during
ered to represent days with very low wind speed at the station both cold seasons, while wind shear occurred much more fre-
level. quently.
On the basis of archival forecasts of the AROME opera-
tional model, the characteristics of vertical wind profiles in 4.2 Spatial and temporal PM10 concentrations’
the valley for four points located in the valley bottom in a variability
W–E cross section (i.e. Balice, TV tower, city centre, and
Bulwarowa St.), for the two seasons, were examined at three The analysis of data on PM10 concentration from all monitor-
levels, 50, 100 and 200 m a.g.l., and for every hour of the ing points operated by NIEP and described in Sect. 3, from
day. The analysis did not show significant differences be- both cold periods analysed, was performed in order to deter-
tween the seasons. For nearly 50 % of the cases, the veloc- mine to what extent the measurements of the PM10 vertical
ity at 50 m a.g.l. in the valley did not exceed 4 m s−1 . Wind profile realized close to the city centre, in the western, narrow
speed at levels 100 and 200 m a.g.l. did not exceed 10 and part of the valley, are representative of other areas of the city.
12 m s−1 for more than 90 % of the cases, respectively. First, significant differences were found between both of the
Wind direction forecasts at the three levels were used to analysed cold seasons: in the season 2019–2020, the mean
analyse the frequency of significant wind direction change in concentrations were lower than in the previous cold season at
the vertical profile (wind shear) between levels 50 and 100, all stations, except Bulwarowa St. The number of days with
100 and 200 and 50 and 200 m a.g.l. The minimum value of mean daily concentration ≤ 50 µg m−3 increased by as much
significant wind direction change between two vertical lev- as 15 % in Kurdwanów district and Dietla St., with a simul-
els was set to 20◦ on the basis of analyses. Wind shear stud- taneous decrease in the number of days with mean daily con-
ies were performed for diurnal (i.e. 06:00 to 17:00 UTC) and centration 50–100 (−10 % in Kurdwanów district and −8 %
nocturnal (i.e. 18:00 to 05:00 UTC) periods. For the point in Dietla St.). The number of days with an average daily con-
representing the city centre and located close to the balloon centration ≥ 50 µg m−3 in the season 2019–2020 ranged be-
sounding site, for both cold seasons, the percentage of wind tween 35 and 63 for most of the stations except Krasińskiego
shear which lasted more than 4 h (between levels 50 and St., located close to the balloon site, where the number of
200 m a.g.l.) equalled 9.5 % and 31.9 % during daytime and such days was equal to 101. In the season 2019–2020, days
with a mean daily concentration of 100–150 µg m−3 occurred
https://doi.org/10.5194/acp-21-12113-2021 Atmos. Chem. Phys., 21, 12113–12139, 202112122 P. Sekuła et al.: Effect of wind shear on PM10 concentration vertical structure in the urban boundary layer
at four stations only, Krasińskiego St.: 14 d, Bulwarowa St.: 4.3 Vertical air temperature gradient
7 d, Kurdwanów district: 4 d, and Złoty Róg St.: 3 d, while
in 2018–2019, such high concentrations occurred almost at Based on the high-resolution forecasts of the AROME CMC
the same stations, but the numbers were significantly higher, 1 km model, an analysis of the vertical temperature gradient
e.g. 28 d in Krasińskiego St. and from 12 to 14 d in Złoty between the model level 50 and 220 m a.g.l. for the city cen-
Róg St., Dietla St., and Kurdwanów district. The maximum tre, for the case study period, against the background data
PM10 hourly concentration reached 378 µg m−3 in Dietla St. from two cold seasons, has been performed. The presence of
on 18 February 2019. Therefore, it can be stated that the a thermal inversion is an important factor which limits the
western part of the city, located in the narrow part of the val- PM10 dispersion conditions and therefore contributes to its
ley floor, experiences much worse air pollution concerning high levels. The gradient values were calculated separately
PM10 than the eastern part, located in the wide part of the for the daytime (06:00–17:00 UTC) and nighttime (18:00–
valley. The vertical PM10 measurements can be then consid- 05:00 UTC), as the phenomenon is usually much more fre-
ered representative of the western part of the valley. quent during the nighttime than the daytime. The frequency
As weak winds prevailed during the case study periods, of a gradient greater than 0.5 ◦ C/100 m (i.e. thermal inver-
hourly PM10 concentrations were analysed for particular sion) in the nighttime was rather similar in the case study
wind speed ranges, and wind measurements from Reymonta period (48 %) and in the cold seasons (38 %), while during
St. were used (i.e. representative of the western part of the the daytime, the value for the case study period was much
city). Concerning high PM10 levels, which are the most dan- larger than for both seasons (32 % and 7 %, respectively).
gerous for human health, the percentage of the cases with This means that during the study period, the inversions were
wind speeds below 1 m s−1 (during both the cold seasons) much more frequent than on average in the cold season,
when the concentration was higher than 100 µg m−3 varied which contributed to the much higher PM10 concentrations
from 7.3 % (Wadów district), 10 %–11 % (Dietla St., Bul- mentioned above.
warowa St. and Piastów district), 13.6 % at Złoty Róg St., The frequency of thermal inversion is linked to wind speed
to 15.3 % at Kurdwanów district and 25.7 % at Krasińskiego (Table A3). An analysis of the temperature gradient ver-
St. For cases ≥ 150 µg m−3 , the values varied from 0.7 %– sus wind speed at 50 m a.g.l. was performed for the both
0.8 % (Bulwarowa St., Piastów and Wadów district), 1.6 % cold seasons, jointly. The studies indicated that for wind
at Dietla St., 1.9 % at Złoty Róg St., to 4.1 % at Kurdwanów speed < 2 m s−1 the frequency of the gradient greater than
district and 5.7 % at Krasińskiego St. The data show large dif- 0.5 ◦ C/100 m was 45 %, and for wind speed 2–4 m s−1 it de-
ferences in PM10 horizontal distribution within the city and a creased to 31 % of the cases. High PM10 concentrations in
relatively high frequency of PM10 dangerous concentrations, the study period were then the effect of joint impact of low
as high as double the allowed mean daily level. wind speed and thermal inversion, generated by the city lo-
Figure A4 shows the correlation between PM10 concentra- cation in the concave land form.
tions at individual air pollution stations and the wind speed at
Reymonta St. The logarithmic curves were fitted to the data. 4.4 Vertical profiles of PM10 concentration
Due to the fact that PM10 levels differ significantly be-
tween the two cold periods analysed (i.e. 2018–2019 and There were three types of PM10 vertical profiles distin-
2019–2020), PM10 data for the case study period were guished (Fig. 5):
compared with the data for the whole season 2019–2020
– type I – almost constant value of PM10 concentration in
only in order to check their representativeness for the sea-
the vertical profile (small fluctuations, weak decrease);
son. During the case study period, hourly PM10 concentra-
tions ≤ 50 µg m−3 reached from 23 % for Krasińskiego St. to – type II – strong decrease in PM10 concentration in the
50 %–60 % for the Dietla St., Piastów and Wadów districts, vertical profile;
while during the whole cold season 2019–2020 they were
much more frequent and varied from 57 % for Krasińskiego – type III – the occurrence of three layers of PM10 con-
St. to over 80 % for the Dietla St., Piastów and Wadów dis- centration: (1) constant concentration in the lower part
tricts. In parallel, values ≥ 150 µg m−3 for most of the sta- of the profile, (2) transition layer above, and (3) the up-
tions were up to 3 % (with a minimum in Dietla St. 0.4 %), per layer where a sudden drop in PM10 concentration is
but in Krasinskiego St. they reached 7 %, while for the whole observed.
season the highest value was 1.3 %. That means that the case
studies represent not only the conditions with much lower Out of 31 analysed days, type I was observed on 27 d, type
wind speed than the seasonal average, but also the conditions II on 8 d and type III on 13 d. For 10 out of 31 d, two types of
with a much higher PM10 level than on average. profiles were observed on 4 d and all three types on 6 d (Ta-
ble A4). Occurrence of different profile types during a single
day indicates significant fluctuations of meteorological con-
ditions.
Atmos. Chem. Phys., 21, 12113–12139, 2021 https://doi.org/10.5194/acp-21-12113-2021P. Sekuła et al.: Effect of wind shear on PM10 concentration vertical structure in the urban boundary layer 12123 Figure 5. Classification of PM10 vertical profiles into the three main types: (a) type I (it is presented in two plots due to a wide range of PM10 concentration values); (b) type II; (c) type III. Explanations: grey lines – individual vertical profiles of PM10 concentration; red lines – mean profiles of a certain type. Vertical profiles assigned to type III differ a lot in the posi- wind, did not allow us to continue the measurements higher tion and thickness of the transition layer. The dominant pat- and verify the hypothesis. tern in Fig. 5c is characterized by a sudden drop in pollution at the valley top which is about 100 m a.g.l. The transition 4.5 Impact of relief and meteorological conditions on layer was further determined by using variables y1 and y2 es- PM10 concentration vertical profiles timated from the sigmoidal curve fitted to the data (Sect. 3.3). Figure 6 presents characteristics of the transition layer for 4.5.1 Type I all selected vertical profiles. It should be noted that the vertical profiles in type I could On 18 out of 27 d analysed, mechanical and thermal turbu- have been the lower part of profiles of type III; the low flight lence led to strong convection. However, the effect of me- maximum altitude, associated with the occurrence of a strong chanical turbulence was a quick increase in convection-layer https://doi.org/10.5194/acp-21-12113-2021 Atmos. Chem. Phys., 21, 12113–12139, 2021
12124         P. Sekuła et al.: Effect of wind shear on PM10 concentration vertical structure in the urban boundary layer

Figure 6. Characteristics of the transition layer in the vertical profiles of PM10 concentrations in type 3.

thickness during the day, followed by its sudden decrease in               time phenomenon which can occur during e.g. a momentary
the evening, while thermal turbulence caused gradual devel-                lack of convective movements or a passage of an atmospheric
opment of the convection layer and its lower thickness. The                front.
upper limit of the convection layer was defined with the ap-                  The case study of 27 January 2020 is presented below as an
plication of TKE profiles and reached 300–500 m a.g.l. The                 example of the processes described above (Figs. 7–8). In the
flights’ heights on those days did not exceed those values,                early morning hours until 09:00 UTC, there was a humid cold
which was the reason for the almost constant PM10 concen-                  pool in the valley, and drier and warmer air moved over the
tration observed.                                                          valley from the west. Between 06:00 and 12:00 UTC, there
   On 5 out of 27 d analysed, the convection layer was con-                was a gradual break of the inversion and a decrease in hu-
trolled by the thermal turbulence. Its thickness did not ex-               midity in the profile observed at 50 and 100 m a.g.l. at the
ceed 200 m a.g.l., and wind shear was observed above, but the              tower station (Fig. 7b, c). Until 12:00 UTC, the PM10 con-
flights reached only 150 m a.g.l. Therefore, the upper layer               centration at the ground stations did not change significantly
with – most probably – much lower PM10 concentrations                      (Fig. 7d); after 12:00 UTC an increase in PM10 concentra-
could not be observed. Such a scenario is an example of a                  tion was visible in the vertical profile. The increased con-
modification of the turbulence at the top of CBL, i.e. a reduc-            centration of PM10 at Krasińskiego St. compared to other
tion of vertical mixing efficiency by wind shear, presented                stations was maintained until 17:00 UTC. The difference in
e.g. in Rodier et al. (2017).                                              concentration between the ground-level measurement from
                                                                           the balloon point and Krasińskiego St. was in the range of
4.5.2   Type II                                                            50–70 µg m−3 for most of the time.
                                                                              Figure 8 presents vertical profiles of wind shear direction
                                                                           and speed, calculated with the data from two neighbouring
The sudden decrease in PM10 concentration with height in
                                                                           vertical levels, for the measurement period from 10:00 to
profile type II was an effect of two processes: an increase
                                                                           16:00 UTC on 27 January 2020. Wind speed components
in pollutant emission near the ground and removal of the
                                                                           from the first 14 vertical levels (Table A1) from AROME
pollution from the upper layers. The latter was due to me-
                                                                           model analysis were used in those calculations. Analysis
chanical turbulence caused by the presence of the wind shear.
                                                                           of vertical profiles of wind shear for the period 10:00–
The wind shear was the effect of an increase in wind speed
                                                                           13:00 UTC indicates that in the layer 120–150 m a.g.l., wind
in the vertical profile close to the valley top and significant
                                                                           speed in the vertical profile increased significantly, and above
wind direction change in the vertical profile starting from
                                                                           this layer there was a sudden change in wind direction in the
close to the ground layer caused by the complex topogra-
                                                                           vertical profile. The height of local maximum of wind shear
phy impact (6 of 8 selected days). Sudden decrease in PM10
                                                                           speed coincides with the maximum altitude of balloon flight
concentration at all selected days was observed at evening
                                                                           (from 100 m a.g.l. at first flight to 150 m a.g.l. from the sec-
hours (on 17 December 2019, also at morning hours) after
                                                                           ond to fifth flights).
weakening of convection movements and wind speed close
                                                                              Vertical profiles of TKE indicated that convection layer
to the ground. During 1 d out of 8 d selected, the occurrence
                                                                           during this day reached up to 200–220 m a.g.l.; isolines of
of turbulence was caused by the presence of mountain waves
                                                                           TKE equal to 0.01 and 0.04 m2 s−2 are presented in Fig. 8e.
which strongly modified convection movements. The analy-
                                                                           Flights between 10:00 and 14:00 UTC indicated a constant
sis of the flights showed that vertical distribution of PM10
                                                                           PM10 concentration value in the profile up to 150 m a.g.l.
concentration characterized by a significant decrease with
                                                                           Linear decrease in PM10 concentration above 150 m a.g.l.
height starting from close to the ground level was a short-

Atmos. Chem. Phys., 21, 12113–12139, 2021                                                    https://doi.org/10.5194/acp-21-12113-2021
P. Sekuła et al.: Effect of wind shear on PM10 concentration vertical structure in the urban boundary layer 12125 Figure 7. Vertical profiles of PM10 concentration (a), vertical profiles of air temperature (b) and (c) relative air humidity from the TV tower and (d) hourly concentration of PM10 in air pollution from ground-level measurements during balloon soundings on 27 January 2020. Explanation: valley depth is the altitude of the hilltops surrounding the valley marked at 100 m a.g.l. with a dashed line in (a). was noticed at higher flights around 12:30 and 14:00– in concentration in the layer up to 150 m a.g.l. was related to 14:30 UTC. The consequence of the disappearance of the the occurrence of a wind shear (Fig. 8d). convection layer (which began at 13:00 UTC) and mechan- During the period between 13:00 and 16:00 UTC, verti- ical pollution removal from the layers above the valley was cal profiles of wind shear speed (Fig. 8c) in the layer up to visible at flights after 14:30 UTC. The strongest decrease in 300 m a.g.l. did not exceed 1 m s−1 for most of the cases, the concentration in the vertical profile was observed dur- while wind shear direction changed significantly in layer ing the last flight; the height of the ground layer with stable from ground level up to 300 m a.g.l., with visible local peaks PM10 concentration did not exceed the mean height of the at selected levels. buildings in the city (30 m a.g.l.), and above this layer there During the night, there was a separation of the valley wind was a linear decrease in PM10 concentration. The decrease and topographically channeled airflow; i.e. the wind in the https://doi.org/10.5194/acp-21-12113-2021 Atmos. Chem. Phys., 21, 12113–12139, 2021
12126        P. Sekuła et al.: Effect of wind shear on PM10 concentration vertical structure in the urban boundary layer

valley weakened, and at the valley top the wind speed in-               The height of the transition layer did not exceed the val-
creased (Fig. 8e).                                                   ley top, and the differences between the individual vertical
                                                                     PM10 concentration profiles were not significant (Fig. 10a,
4.5.3   Type III                                                     b). The height of the transition layer was mostly determined
                                                                     by the height of the convection layer (the maximum predicted
Type III of the PM10 concentration vertical profile was found        height of the convection layer was equal to 100 m a.g.l. at
on more than 40 % of measurement days (13 out of 31 d).              12:00 UTC); vertical profiles of wind shear speed between
The vertical wind profiles indicated that during most of the         10:00 and 13:00 UTC indicated the occurrence of a local
selected days a strong wind shear was observed close to the          maximum value above the convection layer at ca. 130 m a.g.l.
valley top (i.e. about 100 m a.g.l.) or at the upper layers. Wind    (Fig. 10c, d). The limited range of the convection layer on
shear occurred either in a thin layer (i.e. as a sudden change       28 November 2019 was the result of high cloudiness during
between two neighbouring vertical model levels, in a layer           the daytime. After 13:00 UTC the wind shear speed in a layer
up to 50 m thick) or in a thick layer (100–200 m). The occur-        up to 300 m a.g.l. decreased to 1–1.5 m s−1 , and the height of
rence of the wind shear was also accompanied by an sudden            the local maximum decreased to 70–100 m a.g.l.
increase in wind speed in the vertical profile (6 of 13 anal-           Similar situations with significant wind direction change
ysed days) or sudden change in wind direction in the verti-          in the vertical profile and weak wind speed were presented
cal profile (3 of 13 analysed days), which was responsible           e.g. in Vergeiner (2004) and Li et al. (2012, 2015) for moun-
for pollution removal from the upper layer. Wind direction           tain valleys, during hydraulic jump occurrence. In the upper
observed at the lower layer was determined by the local to-          layer, wind direction is constant, while wind speed increases
pography (valley wind), whereas at the upper layer there was         with height.
regional topographically channeled airflow. The separation              For the cases classified into group III, the occurrence of
of the two atmospheric layers by a strong wind shear for se-         the transition layer was described by three parameters: half-
lected cases was reinforced by the advection of warmer air           way altitude (parameter e) and the altitude of the lower and
(on 8 d out of 13 analysed). In case of a cold pool occurrence       upper transition layers (Fig. 6). Several meteorological fac-
in the valley (6 of 13 d), the vertical transport of air pollution   tors were considered responsible for changes in those param-
was hindered by the thermal inversion intensification.               eters. One of them was the height of the convection layer
   Data of 28 November 2019 were used as an example of               determined with the TKE vertical profile. It was checked
profile type III. Vertical profiles of air humidity and air tem-     whether predicted TKE for model vertical levels closest to
perature measurements from the TV tower indicated the pres-          the half-way altitude (below and above) decreased below
ence of a persistent ground thermal inversion intensified by         0.01 m2 s−2 . Another condition was whether between two
warm and dry air advection from the south-west (Fig. 9a, b).         model vertical levels closest to the model to half-way alti-
On that day, foehn conditions were not met at Kasprowy               tude (below and above) or for the two closest vertical levels
Wierch and Balice stations; however, the cross section of            above there was significant wind shear defined as wind shear
the AROME CMC 1 km model indicated the occurrence of                 speed > 1.5 m s−1 or whether vertical wind direction change
foehn in the south-western Western Carpathians (not shown).          between two neighbouring levels was greater than 20◦ . Both
This phenomenon could partially contribute to the warm air           conditions for a vertical wind profile were analysed sepa-
advection from the south-west. Additionally, data from the           rately, and in case they were met, the height of the lower
air pollution measurement stations showed significant spa-           model layer from the two analysed ones was considered the
tial variability of PM10 concentration in Kraków (Fig. 9e).          final result.
The maximum hourly PM10 concentration difference be-                    For some cases, the conditions presented above occurred
tween measurement points was equal to 170 µg m−3 . Ground            together at the same moment, in particular cases at the close
measurements at the balloon site were similar to those from          altitude (e.g. TKE and wind shear occurrence on 6 d of 13
Piastów district, and differences between the balloon site and       selected – 44 vertical profiles).
Krasińskiego St. were in the range from 89 to 107 µg m−3 .             Figure 11 presents a comparison of altitude of half way for
   Until 13:00–14:00 UTC on 28 November 2019, the                    the PM10 vertical profile and predicted height of the convec-
AROME model predicted the occurrence of a hydraulic jump             tion layer (based on the TKE) and the layer at which strong
on the southern and south-western slopes of the highlands            wind shear was observed. For 41 of 134 PM10 vertical pro-
at a distance of 25–30 km from the city centre (upward air           files, none of the conditions was met.
movement); this phenomenon has been presented in the SW–                Analysis of results presented in Fig. 11 shows that for 60
NE cross section (Fig. 9c–d, symbol HJ). The occurrence of           vertical profiles of 134 analysed, an important factor in the
hydraulic jump caused a weakening of the horizontal wind in          S-shaped vertical PM10 profile was the height of the con-
the valley and the occurrence of a strong wind shear marked          vection layer (10 measurement days). For 44 of 134 vertical
on the SW–NE cross section (Fig. 9c, marked by horizontal            profiles of the PM10 concentration, the altitude of wind shear
red line).                                                           speed higher than 1.5 m s−1 was close to the height of half-
                                                                     way altitude for PM10 (6 measurement days), while for wind

Atmos. Chem. Phys., 21, 12113–12139, 2021                                            https://doi.org/10.5194/acp-21-12113-2021
You can also read