Enhanced growth rate of atmospheric particles from sulfuric acid
←
→
Page content transcription
If your browser does not render page correctly, please read the page content below
Atmos. Chem. Phys., 20, 7359–7372, 2020
https://doi.org/10.5194/acp-20-7359-2020
© Author(s) 2020. This work is distributed under
the Creative Commons Attribution 4.0 License.

Enhanced growth rate of atmospheric particles from sulfuric acid
Dominik Stolzenburg1,2 , Mario Simon3 , Ananth Ranjithkumar4 , Andreas Kürten3 , Katrianne Lehtipalo2,5 ,
Hamish Gordon4 , Sebastian Ehrhart6 , Henning Finkenzeller7 , Lukas Pichelstorfer2 , Tuomo Nieminen2 ,
Xu-Cheng He2 , Sophia Brilke1 , Mao Xiao8 , António Amorim9 , Rima Baalbaki2 , Andrea Baccarini8 , Lisa Beck2 ,
Steffen Bräkling10 , Lucía Caudillo Murillo3 , Dexian Chen11 , Biwu Chu2 , Lubna Dada2 , António Dias9 ,
Josef Dommen8 , Jonathan Duplissy2 , Imad El Haddad8 , Lukas Fischer12 , Loic Gonzalez Carracedo1 ,
Martin Heinritzi3 , Changhyuk Kim13,14 , Theodore K. Koenig7 , Weimeng Kong13 , Houssni Lamkaddam8 ,
Chuan Ping Lee8 , Markus Leiminger12,15 , Zijun Li16 , Vladimir Makhmutov17 , Hanna E. Manninen18 ,
Guillaume Marie3 , Ruby Marten8 , Tatjana Müller3 , Wei Nie19 , Eva Partoll12 , Tuukka Petäjä2 , Joschka Pfeifer18 ,
Maxim Philippov17 , Matti P. Rissanen2,20 , Birte Rörup2 , Siegfried Schobesberger16 , Simone Schuchmann18 ,
Jiali Shen2 , Mikko Sipilä2 , Gerhard Steiner12 , Yuri Stozhkov17 , Christian Tauber1 , Yee Jun Tham2 , António Tomé21 ,
Miguel Vazquez-Pufleau1 , Andrea C. Wagner3,7 , Mingyi Wang11 , Yonghong Wang2 , Stefan K. Weber18 ,
Daniela Wimmer1,2 , Peter J. Wlasits1 , Yusheng Wu2 , Qing Ye11 , Marcel Zauner-Wieczorek3 , Urs Baltensperger8 ,
Kenneth S. Carslaw4 , Joachim Curtius3 , Neil M. Donahue11 , Richard C. Flagan13 , Armin Hansel12,15 ,
Markku Kulmala2 , Jos Lelieveld6 , Rainer Volkamer7 , Jasper Kirkby3,18 , and Paul M. Winkler1
1 Faculty  of Physics, University of Vienna, 1090 Vienna, Austria
2 Institute for Atmospheric and Earth System Research/Physics, University of Helsinki, 00014 Helsinki, Finland
3 Institute for Atmospheric and Environmental Sciences, Goethe University Frankfurt, 60438 Frankfurt am Main, Germany
4 School of Earth and Environment, University of Leeds, Leeds LS2 9JT, UK
5 Finnish Meteorological Institute, 00560 Helsinki, Finland
6 Atmospheric Chemistry Department, Max Planck Institute for Chemistry, 55128 Mainz, Germany
7 Department of Chemistry and Cooperative Institute for Research in Environmental Sciences,

University of Colorado Boulder, Boulder, CO 80309, USA
8 Laboratory of Atmospheric Chemistry, Paul Scherrer Institute, 5232 Villigen, Switzerland
9 Center for Astrophysics and Gravitation, Faculty of Sciences of the University of Lisbon, 1749-016 Lisbon, Portugal
10 Tofwerk AG, 3600 Thun, Switzerland
11 Center for Atmospheric Particle Studies, Carnegie Mellon University, Pittsburgh, PA 15217, USA
12 Institute for Ion Physics and Applied Physics, University of Innsbruck, 6020 Innsbruck, Austria
13 Division of Chemistry and Chemical Engineering, California Institute of Technology, Pasadena, CA 91125, USA
14 School of Civil and Environmental Engineering, Pusan National University, Busan 46241, Republic of Korea
15 Ionicon Analytik GmbH, 6020 Innsbruck, Austria
16 Department of Applied Physics, University of Eastern Finland, 70211 Kuopio, Finland
17 P.N. Lebedev Physical Institute of the Russian Academy of Sciences, 119991 Moscow, Russia
18 CERN, the European Organization for Nuclear Research, 1211 Geneva, Switzerland
19 Joint International Research Laboratory of Atmospheric and Earth System Sciences, School of Atmospheric Sciences,

Nanjing University, 210023 Nanjing, China
20 Aerosol Physics Laboratory, Tampere University, 33101 Tampere, Finland
21 Institute Infante Dom Luíz, University of Beira Interior, 6200-001 Covilhã, Portugal

Correspondence: Paul M. Winkler (paul.winkler@univie.ac.at)

Received: 22 August 2019 – Discussion started: 15 November 2019
Revised: 12 May 2020 – Accepted: 31 May 2020 – Published: 25 June 2020

Published by Copernicus Publications on behalf of the European Geosciences Union.
7360                              D. Stolzenburg et al.: Enhanced growth rate of atmospheric particles from sulfuric acid

Abstract. In the present-day atmosphere, sulfuric acid is the      Uncertainty about the expected behaviour at the collision
most important vapour for aerosol particle formation and ini-      (“kinetic”) limit influences the interpretation of experimental
tial growth. However, the growth rates of nanoparticles ( <        data. One focus has been on the evaporation rates from small
10 nm) from sulfuric acid remain poorly measured. There-           particles and the potential growth rate enhancement from co-
fore, the effect of stabilizing bases, the contribution of ions    agulation. In earlier laboratory measurements, it has been
and the impact of attractive forces on molecular collisions are    shown that bases like ammonia can have a stabilizing effect
under debate. Here, we present precise growth rate measure-        for growth below 2 nm (Lehtipalo et al., 2016). If amines,
ments of uncharged sulfuric acid particles from 1.8 to 10 nm,      which are stronger bases than ammonia, are added, nucle-
performed under atmospheric conditions in the CERN (Euro-          ation itself can proceed at the kinetic limit, i.e. evaporation
pean Organization for Nuclear Research) CLOUD chamber.             rates from the monomer onwards are zero (Jen et al., 2014;
Our results show that the evaporation of sulfuric acid parti-      Kürten et al., 2014; Olenius et al., 2013). In this case, cluster
cles above 2 nm is negligible, and growth proceeds kineti-         coagulation also plays an important role in the growth pro-
cally even at low ammonia concentrations. The experimental         cess due to the strong clustering behaviour of sulfuric acid
growth rates exceed the hard-sphere kinetic limit for the con-     and amines (Kontkanen et al., 2016; Lehtipalo et al., 2016;
densation of sulfuric acid. We demonstrate that this results       Li and McMurry, 2018). However, in the presence of ammo-
from van der Waals forces between the vapour molecules and         nia, the evaporation rates and the magnitude of cluster co-
particles and disentangle it from charge–dipole interactions.      agulation remain unmeasured, although ammonia is much
The magnitude of the enhancement depends on the assumed            more important than amines globally due to its longer at-
particle hydration and collision kinetics but is increasingly      mospheric lifetime. A second focus is on the collisional rate
important at smaller sizes, resulting in a steep rise in the ob-   coefficients themselves, which may be enhanced by either
served growth rates with decreasing size. Including the ex-        charge–dipole interactions (Nadykto and Yu, 2003) or van
perimental results in a global model, we find that the en-         der Waals forces (Chan and Mozurkewich, 2001). In spite of
hanced growth rate of sulfuric acid particles increases the        the importance of these coefficients, there are only few di-
predicted particle number concentrations in the upper free         rect measurements of the charge effect on growth (Lehtipalo
troposphere by more than 50 %.                                     et al., 2016; Svensmark et al., 2017). Even if the charge–
                                                                   dipole interactions are stronger, an enhancement due to van
                                                                   der Waals forces might be more important at typical atmo-
                                                                   spheric ionization levels. Several atmospheric studies have
1   Introduction                                                   demonstrated that sulfuric acid uptake proceeds at close to a
                                                                   collision-limited rate (Bzdek et al., 2013; Kuang et al., 2010),
Sulfuric acid (H2 SO4 ) is the major atmospheric trace com-        but they could neither provide a measurement of a collision
pound responsible for the nucleation of aerosol particles in       enhancement nor did they consider hydration effects in detail
the present-day atmosphere (Dunne et al., 2016). Sulfuric          (Verheggen and Mozurkewich, 2002). Both of these factors
acid participates in new particle formation (NPF) in the upper     might be significant in the free molecular regime below 5 nm,
troposphere (Brock et al., 1995; Weber et al., 1999; Weigel et     where growth measurements are also affected by larger un-
al., 2011), stratosphere (Deshler, 2008), polar regions (Joki-     certainties (Kangasluoma and Kontkanen, 2017). Here, we
nen et al., 2018), urban or anthropogenically influenced en-       address the questions of evaporation and collision enhance-
vironments (Yao et al., 2018), and when a complex mixture          ment in sulfuric-acid-driven growth with precision measure-
of different condensable vapours is present (Lehtipalo et al.,     ments (Stolzenburg et al., 2017) at the CERN (European Or-
2018). Especially in the initial growth of small atmospheric       ganization for Nuclear Research) CLOUD experiment (Du-
molecular clusters, sulfuric acid is likely of crucial impor-      plissy et al., 2016).
tance (Kulmala et al., 2013). The newly formed particles
need to grow rapidly in order to avoid scavenging by larger,
pre-existing aerosols and, thereby, contribute to the global       2     Methods
cloud condensation nuclei (CCN) budget (Pierce and Adams,
2007). Therefore, the dynamics in this cluster size range of       2.1    Experimental approach
a few nanometres determines the climatic significance of at-
mospheric NPF, which is the major source of CCN (Gordon            The CERN CLOUD chamber is a 26.1 m3 stainless steel
et al., 2017) and can also affect urban air quality (Guo et al.,   aerosol chamber that can be kept at a constant tempera-
2014).                                                             ture within 0.1 K precision. It offers the possibility to study
   The main pathway of cluster and particle growth is con-         new particle formation under different ionization levels. Two
densation of low volatility vapours, like sulfuric acid or         high-voltage electrode grids inside the chamber can effi-
oxidized organics (Stolzenburg et al., 2018). Nanoparticle         ciently clear ions and charged particles from the chamber
growth rates depend on both the evaporation rates of the           within seconds, ensuring neutral conditions. When there is
condensing vapours and the molecular collision frequencies.        no electric field in the chamber, galactic cosmic rays lead to

Atmos. Chem. Phys., 20, 7359–7372, 2020                                              https://doi.org/10.5194/acp-20-7359-2020
D. Stolzenburg et al.: Enhanced growth rate of atmospheric particles from sulfuric acid 7361 an ion production rate of ∼ 2–4 ion pairs cm−3 s−1 . Ion con- size classification. The size ranges of both studies are also centrations can also be elevated to upper tropospheric con- not directly comparable. We show the measurements in the ditions by the illumination of the chamber with a pion beam lower size interval of the DMA-train (1.8–3.2 nm mobility from the CERN Proton Synchrotron. The dry air supply for diameter) as well as the earlier results (size range between the chamber is provided by boil-off oxygen and boil-off ni- 1.5 and 2.5 nm mobility diameter) in Fig. S2. trogen mixed at the atmospheric ratio of 79 : 21. This ensures Another difference between the instruments is the treat- extremely low contaminant levels, especially from organics ment of the sample relative humidity. In the DMA-train, the and sulfuric acid. This was verified by a PTR3 proton transfer aerosol sheath flow is dried using silica gel, achieving a rela- reaction time-of-flight mass spectrometer (Breitenlechner et tive humidity measured at the sheath inlet of the DMA below al., 2017) and a nitrate chemical ionization atmospheric pres- 5 % for all experiments in this study. The nano-SMPS uses a sure interface time-of-flight (nitrate CI-APi-ToF) mass spec- water trap to keep the relative humidity of the DMA sheath trometer (Jokinen et al., 2012). The absence of any contam- flow below 20 % during the reported experiments. The Cal- ination from amines was confirmed by measurements with tech nano-radial DMA, the NAIS and the particle size magni- a water cluster CI-APi-ToF (Pfeifer et al., 2020), which did fier used in Lehtipalo et al. (2016) do not deploy any humid- not register dimethylamine mixing ratios above the detection ity conditioning for the sheath or sample flow, except for the limit of 0.1 pptv. possible decrease in relative humidity as a result of a temper- We performed measurements of particle growth from sul- ature increase between the measurement device and chamber. furic acid and ammonia at either +20 or +5 ◦ C with the rel- This effect occurred for all instruments to some extent, even ative humidity kept constant at either 38 % or 60 %. SO2 if the sampling lines were insulated. The effect of aerosol de- (5 ppb), O3 (∼ 120 ppb) and ammonia (varied between 3 hydration during the measurement is usually described by the and 1000 pptv) were injected into the chamber. The exper- hygroscopic growth factor gf, relating the measured diameter iments were initiated by homogeneous illumination of the dp,m to the actual diameter dp as follows: dp = gf · dp,m . chamber at constant O3 and SO2 levels. The UV light of From the measured aerosol size distributions, we inferred four Hamamatsu UV lamps guided into the chamber with particle growth rates using two complementary methods in fibre optics induced the photo-dissociation of O3 and the order to limit systematic biases in the analysis. In the first production of OH q radicals. Thus, SO2 was oxidized, lead- method, particle growth rates were measured with the ap- ing to the formation of sulfuric acid (varied between 107 pearance time method, which requires a growing particle and 109 cm−3 ). A typical experiment is shown in Fig. S1 in population that can be clearly identified (Dada et al., 2020; the Supplement. Sulfuric acid monomer concentrations were Lehtipalo et al., 2014; Stolzenburg et al., 2018). Figure S1d measured with the nitrate CI-APi-ToF. Calibration of the in- demonstrates how the signal in each size channel is fitted strument’s response to sulfuric acid (Kürten et al., 2012) was by an empirical sigmoidal shape curve estimating the time performed before and after the measurement campaign and at which 50 % of the maximum signal intensity is reached. yielded comparable results. Compared with previous stud- These appearance times are fitted with a linear function over ies, the measurement of gas-phase NH3 also significantly im- the size intervals from 1.8 to 3.2 and from 3.2 to 8 nm, with proved due to the deployment of the calibrated water cluster the slope yielding an average growth rate over the interval CI-APi-ToF. The protonated water cluster reagent ions selec- (shown in Fig. S1b). In the second method, we applied the tively ionize ammonia and amines at ambient pressure reach- size- and time-resolving growth rate analysis method “IN- ing a detection limit of approximately 0.5 pptv for ammonia. SIDE” (INterpreting the change rate of the Size-Integrated Particle growth was monitored using a differential mo- general Dynamic Equation; Pichelstorfer et al., 2018) to bility analyser-train (DMA-train; Stolzenburg et al., 2017) cross-check our results. The INSIDE method uses the mea- for the main size range from 1.8 to 8 nm. We also include sured particle size distribution at a time t1 and simulates the measurements from a Caltech nano-radial DMA (Brunelli expected aerosol dynamics (coagulation, wall losses and di- et al., 2009) with a custom-built diethylene glycol (DEG) lution) until time t2 . By comparing this to the measured data counter for sizes between 4 and 8 nm and a TSI Scanning at t2 and evaluating the general dynamics equation, it in- Mobility Particle Sizer (nano-SMPS; model 3936) for sizes fers the condensational growth rate at specified diameters for larger than 5 nm when investigating the size dependence of this time step. The time- and size-resolved growth rates for the growth. For the growth of the charged fraction, we use a each experiment were time-averaged for all sizes to yield a neutral cluster and air ion spectrometer (NAIS; Manninen et statistically more robust result. Compared to the appearance al., 2009). All four instruments use electrical mobility classi- time method, INSIDE requires accurate absolute number size fication, and the measured mobility diameters are corrected distributions, whereas the appearance time method only de- to mass diameters (Larriba et al., 2011) for the calculation of pends on the relative signal increase. However, INSIDE can collision kinetics. Compared with the scanning particle size confirm the absence of systematic biases like changing pre- magnifier (see e.g. Lehtipalo et al., 2014), which was used in cursor vapour concentrations or coagulation and wall loss ef- Lehtipalo et al. (2016), these instruments that use direct mo- fects. Therefore, a combined assessment with both methods bility analysis have less systematic uncertainty on the actual should yield a solid estimate of the observed growth rates. https://doi.org/10.5194/acp-20-7359-2020 Atmos. Chem. Phys., 20, 7359–7372, 2020
7362 D. Stolzenburg et al.: Enhanced growth rate of atmospheric particles from sulfuric acid
2.2 Growth model description and the enhanced collision frequency for the kinetic regime
described by
If the evaporation rates of the growing particles are effec-
2 8kT 1/2 1 1/2
tively zero due to the extremely low vapour pressure of the π 1
condensing vapour, particle growth rates are limited by the kK = · dv + dp · · + ·E(∞) (5)
4 π mv mp
collision frequencies of vapour molecules with the growing
particles. Our description of particle growth follows the ap- Equation (3) is designed such that it reaches the correct lim-
proach of Nieminen et al. (2010), which, in comparison to its of the free molecular and diffusion regime which is com-
the equations of mass transfer that can be found in e.g. Sein- parable to the approach of Fuchs and Sutugin (1971), i.e.
feld and Pandis (2016), include the non-negligible effect of Eq. (2). However, it includes the collision enhancement fac-
vapour molecular size using a collision frequency between tors E(∞) and E(0). These factors can be linked to the at-
vapour and particle in analogy to coagulation theory (Lehti- tractive potential of van der Waals forces. For the continuum
nen and Kulmala, 2003): regime, this is done by solving the following integral:
dVp −1
ddp dt kcoll dv , dp · Vv · Cv Z∞
GR = = dV = h i rv + rp φ (x)
dt E (0) = exp dx , (6)
p d π 3
ddp ddp d
6 p x2 kT
(rv +rp )
kcoll dv , dp · Vv · Cv
= , (1)
π/2 · dp2 Here, x is the relative distance between the centres of the
two colliding entities, and φ(x) is the van der Waals potential
where dp is the growing particle mass diameter, Vp and Vv are (Hamaker, 1937), which is expressed in terms of the vapour
the volume of the particle and vapour molecule respectively,
and particle radii rv/p :
Cv is the vapour monomer concentration and kcoll dv , dp is
the kinetic collision frequency between particle and vapour. φ (x) 1 A 2rv rp 2rv rp
Following Fuchs and Sutugin (1971), the collision frequency =− 2 + 2
kT 6 kT x2 −
rv + rp x2 − rv − rp
for the transition regime is defined by
2 !!
x 2 − rv + rp
kcoll dv , dp = 2π · dv + dp · Dv + Dp + ln 2 (7)
1 + Kn x 2 − rv − rp
· , (2)
4 4
1 + 0.377 + 3α Kn + 3α Kn2 Chan and Mozurkewich (2001) provide a fit to the solution
of the numerically evaluated integral from Sceats (1989):
where, according to Lehtinen and Kulmala (2003), the
E (0) = 1 + a1 · ln 1 + A0 + a2 · ln3 1 + A0 ,
Knudsen number (Kn) and mean free path (λ) need to (8)
−1
be specified as Kn = 2λ · dv + dp and λ = 3 Dv + Dp ·
−1/2 where an are the fit parameters, and A0 is the reduced
c2v + c2p , which depend on the diameters dv/p , the Hamaker constant, which relates to the Hamaker −2 con-
masses mv/p (within the calculation of the mean thermal ve- stant A by A0 = 4A · k −1 T −1 · dv dp · dv + dp (Chan and
locities cv/p ) and the diffusion coefficients Dv/p of the col- Mozurkewich, 2001; Hamaker, 1937). However, the mea-
liding vapour molecules or particles respectively. Assuming surements of this study are conducted completely in the free
that the accommodation coefficient α is unity and relating the molecular regime; thus, the derivation of the continuum case
volume Vv of the condensing monomer to its molecular mass will not significantly affect our results. For the free molecular
and (bulk) density Vv = mv /ρv , Eqs. (1) and (2) determine regime enhancement factor E (∞), an overview of its rela-
the hard-sphere kinetic limit for particle growth. tion to the Hamaker constant is given in Ouyang et al. (2012).
We then additionally consider a collision enhancement of Chan and Mozurkewich (2001) also used a fit to the solution
neutral vapour monomers and particles due to attractive van from Sceats (1989) with the fit parameters bn :
der Waals forces, where the collision frequency can be de- p
scribed according to Sceats (1989): A0 /3
√ + b1 · ln 1 + A0
E (∞) = 1 +
1 + b0 A 0
s
2
+ b2 · ln3 1 + A0
kK k K (9)
kcoll dv , dp = kK · 1 + − , (3)
2kD 2kD
In this study, we compare the results of Sceats (1989), who
with the enhanced collision frequency for the continuum used Brownian coagulation to describe the collisions, to the
regime described by simple ballistics approach of Fuchs and Sutugin (1965). In
that approach, the minimum distance xmin along the trajec-
kD = 2π · dv + dp · Dv + Dp · E(0) (4) tory of two colliding particles with impact parameter b is
Atmos. Chem. Phys., 20, 7359–7372, 2020 https://doi.org/10.5194/acp-20-7359-2020D. Stolzenburg et al.: Enhanced growth rate of atmospheric particles from sulfuric acid 7363
calculated from the conservation of angular momentum and (assuming two water molecules attached to the sulfuric acid
energy: monomer), where MH2 SO4 and MH2 O are the molecular mass
s of sulfuric acid and water respectively. In the second ap-
2 |φ(xmin )| proach, we assume a dry measurement, and in this case the
b = xmin 1 + , (10) growth of the measured dry particles is described by uptake
µv 2
of sulfuric monomers only, i.e. mv = MH2 SO4 . However, for
where φ is the interaction potential, µ is the reduced mass of the actual vapour and particle size used in the collision ker-
the colliding entities and v is their relative speed. The critical nel kcoll dv , dp , the hydrated sizes are used. We again as-
impact parameter bcrit is obtained as the minimum value of b sume an average hydration for the monomer with two water
for which theminimum distance still takes a real value larger molecules as above and an average hygroscopic growth fac-
than rv + rp . The enhancement factor is than related to the tor of 1.25 for all particle sizes and RH values in our experi-
critical impact parameter bcrit : ments. The latter is an average value of the results of Biskos
r et al. (2009) for highly acidic sulfuric acid sub-10 nm parti-
2
4 bcrit 3 cles at 40 %–60 % relative humidity. In the third approach,
E (∞) = 2 (11)
dv + dp 2 we consider that the extent of hydration might vary with
size and relative humidity. We use modelled composition
Note, that this approach is oversimplified, as the initial veloc- data from MABNAG (Model for Acid–Base chemistry in
ity of the colliding entities is assumed to be fixed but should Nanoparticle Growth; Yli-Juuti et al., 2013) in order to pre-
actually follow a (Maxwell–Boltzmann) distribution. How- dict the sulfuric acid mass fraction w(RH, T ) (see Fig. S4a)
ever, Ouyang et al. (2012) concluded that the difference in and calculate the hygroscopic growth factor:
the derived Hamaker constant is almost negligible.
w (RHm , Tm ) · ρsol (w(RHm , Tm ), Tm ) 1/3
Using the description of an enhanced collision kernel, the gf = , (13)
particle growth rates measured with the DMA-train can be w(RH, T ) · ρsol (w(RH, T ), T )
fitted with the Hamaker constant as the single free parameter
where ρsol is a parametrization of the density of the sulfu-
of the fit. As the theoretical growth rates are compared to
ric acid–water solution (Myhre et al., 1998), and w(RH, T )
the appearance time growth rates, which are measured as a
and w(RHm Tm ) are the mass fractions of sulfuric acid in
time difference in signal appearance 1t over a certain size
the growing and measured particles respectively. We follow
interval 1dp (ranging from dinit to dfinal ), a comparison with
the considerations of Verheggen and Mozurkewich (2002) in
experimental values requires the integration of Eq. (1):
order to separate the growth by sulfuric acid addition and
1dp water uptake by differentiating the hydrated particle volume
GR (dinit , dfinal ) = Vp = mH2 SO4 /(wρsol ). Both the numerator (particle sulfuric
1t
dZfinal acid mass mH2 SO4 ) and the denominator (sulfuric acid mass
π/2 · dp2 fraction and solution density) depend on time. The addition
= (dfinal − dinit ) ddp (12)
of sulfuric acid is again described in analogy to coagulation
kcoll dv , dp · Vv · Cv
dinit theory, resulting in
Equation (12) includes several properties of the condensing π 2 ddp kcoll dv , dp · mv · Cv π dp3 d ln (wρ)
vapour and the growing particles. Sulfuric acid molecules are d = −
2 p dt w ·ρ 6 dt
usually hydrated at typical ambient relative humidity. While 3
the thermodynamic model E-AIM (Extended Aerosol Inor- kcoll dv , dp · mv · Cv π dp d ln(wρ) ddp
ganics Model; Wexler et al., 2002) predicts an average of = − (14)
w·ρ 6 ddp dt
two water molecules attached to a sulfuric acid monomer
at 298 K and 40 %–60 % relative humidity, quantum chem- Equation (14) contains a first term for the addition of pure
ical studies predict an average hydration of one to two water sulfuric acid and a second term for water uptake. It can be
dd
molecules for these conditions (Henschel et al., 2014; Kurtén solved for the particle growth rate dtp :
et al., 2007; Temelso et al., 2012). Moreover, the hydra-
tion state of the particles in the chamber is also not directly 2 · kcoll dv , dp · mv · Cv
GR =
d
(15)
measured and might be altered during the sampling process, d ln(wρ)
w (RH, T ) · ρ (RH, T ) · π · dp2 · 1 + 3p · ddp
which requires information on the hygroscopic growth factor
(see Sect. 2.1). In this case, we assume mv = MH2 SO4 , but we use the hy-
We examine the effect of hydration using three different drated monomer diameter dv in the collision kernel. For the
approaches. In the first naïve approach, we assume that no particles, we now use the hydrated size, i.e. dp = gf·dp,m with
dehydration occurs during measurement and that the parti- gf and w (RH, T ) taken from the model. We compare the
cle sulfuric acid mass fraction is equal to the vapour mass MABNAG predictions in Fig. S4b with SAWNUC (Sulfuric
fraction, i.e. w = MH2 SO4 /mv , with mv = MH2 SO4 + 2MH2 O Acid Water Nucleation model; Ehrhart et al., 2016), which
https://doi.org/10.5194/acp-20-7359-2020 Atmos. Chem. Phys., 20, 7359–7372, 20207364 D. Stolzenburg et al.: Enhanced growth rate of atmospheric particles from sulfuric acid
only takes sulfuric acid and water into account, whereas 3 Results
MABNAG also includes ammonia. MABNAG predicts a sig-
nificantly lower water content at larger sizes (> 2.5 nm), even 3.1 Collision enhancement
at 3 pptv ammonia. In addition, previous experiments in the
CLOUD chamber have suggested that even background level Figure 1 shows the particle growth rates for two size inter-
ammonia has an influence on the hygroscopic growth factor vals (Fig. 1a, 1.8–3.2 nm mobility diameter; Fig. 1b, 3.2–
(Kim et al., 2016); this is similar to Biskos et al. (2009), 8.0 nm mobility diameter) versus the sulfuric acid monomer
who also indicated some extent of neutralization for sub- concentration, which correlate linearly. No significant depen-
10 nm particles at low ammonia. Due to the presumably bet- dence on temperature, ionization levels in the chamber or
ter prediction of the particle hydration by MABNAG for sizes the concentration of ammonia is evident. While the effect
larger than 2.5 nm, we choose the results from Fig. S4a, even of temperature expected from theory is small and cannot be
if they might overestimate the hydration at small sizes. We discerned within the statistical uncertainties of our measure-
have neglected the effect of ammonia addition on collisions ments (Nieminen et al., 2010), the insignificant influence of
in all three approaches so far, but we test the assumption ammonia and the ionization level on the growth rate differs
mv = MH2 SO4 +2MH2 O +1MNH3 and different vapour hydra- from previous findings (Lehtipalo et al., 2016).
tions in our systematic uncertainties estimate in Fig. S5. All We compare the measured growth rates from this study
of the parameters for vapour and particles used for all ap- with the results from Lehtipalo et al. (2016) in Fig. S2. In
proaches are summarized in Table S1 in the Supplement. contrast to our results, elevated ammonia (∼ 1000 pptv) led
to increased growth rates in that study. The major differ-
2.3 Global model description ence is the narrower size range for the growth rate mea-
surements (1.5–2.5 nm mobility diameter) due to different
We implement the results of our growth rate measurements instrumentation. For smaller sizes and at low ammonia, sul-
for sulfuric-acid-driven growth in a global model (Mann furic acid evaporation likely plays a role due to an increased
et al., 2010; Mulcahy et al., 2018), which includes sulfu- Kelvin term. The stabilizing effect of ammonia is certainly
ric acid–water binary nucleation. However, the model does relevant at the sizes of the nucleating clusters (Kirkby et
not include ternary nucleation schemes (Dunne et al., 2016) al., 2011). For our results, we confirm the absence of sig-
and pure biogenic nucleation (Gordon et al., 2016) and will, nificant evaporation rates above 2 nm using an independent
therefore, underestimate the impact of nucleation on the experiment presented in Fig. 2. This demonstrates that, in
global aerosol and CCN budget. In the model, growth be- the absence of gas-phase sulfuric acid, the coagulation- and
tween the nucleation size and 3 nm is treated with the equa- meas − k − k avg )
dilution-corrected loss rates of particles (ktot dil coag
tion from Kerminen and Kulmala (2002), which gives the over all sizes follow the expected size dependence of wall
fraction of particles surviving to 3 nm at a given growth and losses which is inferred from the sulfuric acid monomer de-
loss rate. Here, as a baseline case, we use the geometric hard- cay. Evaporation would cause another term and would distort
sphere kinetic growth rate based on bulk density (Eqs. 1–2) the balance equation (also depending on the relative abun-
and compare this to the collision-enhanced growth (Eqs. 3– dances of the particles during the decay), causing a deviation
9). For larger sizes, aerosol growth in the model is calcu- from the expected wall loss rate.
lated by solving the condensation equations. Therefore, no The insignificant effect of ammonia on growth (Fig. 1)
direct growth parametrization can be altered, but as conden- and the same high ratio (> 100, Fig. S3a) between sulfuric
sational growth scales linearly with the diffusion coefficient acid monomer and dimer concentrations for all experiments
of the condensing vapour, we increased sulfuric acid diffu- point towards a negligible influence of clustering on our mea-
sion for condensation in the nucleation mode (2–10 nm) and sured growth rates (Li and McMurry, 2018). Moreover, in
in the Aitken mode (10–100 nm). The enhancement factors Fig. S3b, using a model including sulfuric acid/ammonia
are derived for the median diameters of the modes (7.6 and clustering and evaporation, we show that no cluster contri-
57 nm respectively) at the cloud-base level (1 km). However, bution is indeed expected, even at elevated ammonia concen-
this constant factor of increase in the diffusion coefficient trations (Kürten, 2019).
(and, hence, flux onto particles) for all particles of the en- In the absence of evaporation and strong clustering, our
tire mode might underestimate the impact of the collision growth rate data provide a direct measurement of the con-
enhancement. Rapid growth is increasingly important for the densational growth at the kinetic limit caused by sulfuric
smallest particles, which actually have a higher collision en- acid monomers only. We find the measured growth rates
hancement than particles with the size of the mode median both with and without the addition of ammonia to be signif-
diameters. icantly above the geometric hard-sphere limit (Eqs. 1–2) of
kinetic condensation (Nieminen et al., 2010). For this com-
parison, we followed a naïve approach, assuming an aver-
age hydration of the monomer by two water molecules and
applied the resulting mass fraction to find the bulk density
Atmos. Chem. Phys., 20, 7359–7372, 2020 https://doi.org/10.5194/acp-20-7359-2020D. Stolzenburg et al.: Enhanced growth rate of atmospheric particles from sulfuric acid 7365
Figure 2. Measurement of zero sulfuric acid evaporation rates. The
total loss rates of sulfuric acid and ammonia particles (with the mo-
bility diameter shown on the x axis) were measured during a de-
cay experiment (5 ◦ C, 60 % relative humidity, 1000 pptv NH3 ) by
switching off the UV lights after a particle growth stage, which
stops the production of sulfuric acid and, subsequently, nucleation
and growth. After sulfuric acid was reduced to the background level,
the exponential decay rate of the remaining particles in the cham-
ber was measured (ktot meas , blue circles), which was not possible for
the 1.8 nm channel due to low statistics. Decay of particles in the
chamber is dominated by wall loss, dilution loss and coagulation
Figure 1. Growth rates of nanoparticles in two size intervals ver- loss to other particles. Particle loss rates are corrected for an aver-
avg
sus the measured gas-phase sulfuric acid monomer concentration. aged coagulation loss during the decay (kcoag ) to all particles larger
Panel (a) shows growth rates for the size interval between 1.8 than dp and for the dilution loss (kdil ; turquoisecircles). They
p agree
and 3.2 nm (mobility diameter; 1.5–2.9 nm in mass diameter), and well with the expected wall loss rate kwall dp = Cwall · Dp (dp )
panel (b) shows growth rates for the size interval between 3.2 (red dashed line) with Cwall = 0.0077 s−0.5 cm−1 inferred from an
and 8.0 nm (mobility diameter; 2.9–7.7 nm in mass diameter). The independent sulfuric acid decay experiment in the absence of a par-
colour code represents the measured NH3 concentration during the ticle sink, where the mobility diameter is assumed to be 0.82 nm
growth period. Squares are measurements at 20 ◦ C, and circles are (Ehrhart et al., 2016; turquoise diamond). This suggests that there
measurements at 5 ◦ C. Filled symbols represent runs under ambient is negligible evaporation from the sulfuric acid particles above ca.
galactic cosmic ray ionization levels, and open symbols represent 2 nm under the above-mentioned experimental conditions, which
runs under neutral conditions. Error bars for the data points repre- would introduce another term that disturbs the balance equation at
sent the statistical uncertainty in the appearance time growth rate each size. As all of our growth rate measurements, independent of
measurements and the maximum variation of the sulfuric acid con- the ammonia concentration and temperature, fall on the same line
centration during the growth period, also explaining the slight de- (see Fig. 1), this also points towards negligible evaporation effects
viations from linearity at high sulfuric acid concentrations, where at reduced ammonia levels (below 10 pptv) and up to 20 ◦ C.
stable conditions are not fully reached. The black line shows the ge-
ometric limit of kinetic condensation assuming the same hydration
for the condensing cluster and the measured particles (Nieminen et
don dispersion forces (London, 1937). The magnitude of
al., 2010). The red solid line shows the fit of Eq. (12) to the data with
the Hamaker constant as the free parameter assuming a Brownian the enhancement is described by the Hamaker constant A
coagulation model for the enhanced collision kernel (Sceats, 1989), (Hamaker, 1937), which we use as the single free parame-
whereas the red dashed line uses a ballistics approach (Fuchs and ter to fit a collision-enhanced kinetic limit. For the Brown-
Sutugin, 1965). ian coagulation model linking the Hamaker constant to the
collision kernel, i.e. Eqs. (3)–(9) (Sceats, 1989), we find
A = (4.6 ± 1.5 (stat.)) × 10−20 J. If we apply a ballistics ap-
(Myhre et al., 1998). The observed enhancement is simi- proach in the free molecular regime (Fuchs and Sutugin,
lar to Lehtipalo et al. (2016) in the case where evaporation 1965; Ouyang et al., 2012), we derive a slightly higher value
was suppressed by ammonia (see Fig. S2). We also mea- of A = 8.7 × 10⁻²⁰ J, but both yield comparable values to
sure a growth rate enhancement for the larger size range previous results (Chan and Mozurkewich, 2001; McMurry,
(Fig. 1b), which should be less sensitive to evaporation. The 1980).
faster growth rates might be due to an enhanced collision An enhancement due to charge–dipole interactions be-
frequency, which can be attributed to van der Waals forces, tween the polar sulfuric acid monomers and charged particles
either permanent dipole–(induced) dipole interactions be- is not significant in our total (neutral plus charged particle)
tween polar sulfuric acid molecules and particles or Lon- growth rate measurements (as shown in Fig. 1), where we ob-
https://doi.org/10.5194/acp-20-7359-2020 Atmos. Chem. Phys., 20, 7359–7372, 20207366 D. Stolzenburg et al.: Enhanced growth rate of atmospheric particles from sulfuric acid
yet been shown experimentally. Furthermore, the collision
enhancement due to van der Waals forces and the collision
enhancement due to charge–dipole interactions also depend
on the comparative size of the condensing vapour and the
growing particle. Figure 4a illustrates the theoretical predic-
tions of the size dependence of the collision rate of sulfuric
acid monomers with larger particles, including van der Waals
forces and charge–dipole interactions. The enhancement fac-
tor compared to the hard-sphere kinetic limit is shown for
both the Brownian coagulation model (Sceats, 1989) and the
ballistics approach (Fuchs and Sutugin, 1965), which is 2.1
and 2.3 for the free molecular regime respectively, and is
Figure 3. The effect of charge on growth. Measured growth rates comparable to previous experimental results (Kürten et al.,
of 1.8–3.2 nm (mobility diameter) particles and ions in experiments 2014; Lehtipalo et al., 2016) and quantum chemical calcula-
with ammonia above 25 pptv. The DMA-train measures both neutral tions (Halonen et al., 2019).
and charged particles (diamonds), whereas the NAIS+/− (Man-
In addition to the approach for calculating the kinetic en-
ninen et al., 2009) measures purely charged particles (triangles).
hancement factor, the description of particle hydration might
Both the positively and negatively charged particle population have
a faster apparent growth rate than the total particle population due also play a crucial role. Until now, we have used the naïve
to an enhanced collision rate from charge–dipole interactions. We assumption that vapour and particle hydration are the same
measure a multiplicative charge enhancement factor of 1.45 in this and that particles are measured at their hydrated size. How-
size range with a combined fit to both polarities (red dotted line), ever, during sampling the measured particles are potentially
which is consistent with estimates from average dipole orientation dried. To investigate the effect of particle hydration, we use
theory (Nadykto and Yu, 2003). At galactic cosmic rays ionization the DMA-train data from Fig. 1 to fit the collision enhance-
levels in the chamber, the charged fraction of the growing particles ment for two alternative approaches: one approach where we
in the size range from 1.8 to 3.2 nm (mobility diameter) is between assume that particles are measured dry and one approach
5 % and 25 %. This is demonstrated by the colour code which in- where we separate the uptake of water and sulfuric acid con-
dicates the integrated total or ion number concentration over the
densation (Verheggen and Mozurkewich, 2002) using mod-
growth rate size interval averaged during the growth period. There-
elled particle composition data from SAWNUC (Ehrhart et
fore, the fit of the appearance time for the total particle population
is affected on a minor level by the small, earlier appearing charged al., 2016) or MABNAG (Yli-Juuti et al., 2013). We compare
fraction. the predictions for the size dependence of all approaches with
the measured growth rates of all instruments normalized to
a sulfuric acid concentration of 107 cm−3 in Fig. 4b. In ad-
serve no difference between growth rates under neutral and dition, we show the growth rates using the time- and size-
galactic cosmic ray ionization levels. From average dipole resolving growth rate analysis method INSIDE (Pichelstorfer
orientation theory (Su and Bowers, 1973), a small enhance- et al., 2018), which agrees with the appearance time method,
ment is expected in the collision frequency for charged parti- demonstrating a minor systematic bias in our growth rate de-
cles above 2 nm (Nadykto and Yu, 2003), which should affect termination. All approaches reproduce the size dependence
the growth rate (Laakso et al., 2003; Lehtipalo et al., 2016). at an acceptable level (R 2 larger than 0.87). The separa-
We find an enhancement factor of 1.45 by comparing the to- tion approach yields higher growth rates at the smallest sizes
tal to the ion growth rate (as shown in Fig. 3), which is in due to the overestimation of hydration by MABNAG below
good agreement with theory. However, the total growth rate 2.5 nm. However, for SAWNUC composition data, which
is influenced on a minor level by faster ion growth because, presumably describe the cluster hydration better, the R 2 is
at the representative galactic cosmic ray ionization levels and only 0.66 and does not reproduce the observed size depen-
sulfuric acid concentrations in our experiments, most (more dence. This is possibly caused by the overly high hydration
than 75 %) of the growing particles are neutral (see Fig. 3). assumed for larger sizes. Thus, the simple dry measurement
However, the effects of ion condensation and charge–dipole approach might be a good approximation for the predictions
enhancement might be stronger at lower sulfuric acid con- of both MABNAG and SAWNUC for the size range of inter-
centrations (Svensmark et al., 2017). est (see Fig. S4b). We estimate the systematic uncertainty of
the results in Fig. S5, including the effects of different vapour
3.2 Size dependence and hydration effects hydration, ammonia addition and sulfuric acid measurement
uncertainty. All approaches overlap
largely within
their sys-
Condensational growth at the geometric kinetic limit predicts +9.7
tematic uncertainties with A = 5.2−3.4 (syst.) × 10−20 J as
increasing growth rates with decreasing particle sizes due to the best estimate of a combined assessment (assuming the
the non-negligible effect of vapour molecule size on the col- Brownian coagulation model). We also give a first-order ap-
lision cross section (Nieminen et al., 2010), which has not
Atmos. Chem. Phys., 20, 7359–7372, 2020 https://doi.org/10.5194/acp-20-7359-2020D. Stolzenburg et al.: Enhanced growth rate of atmospheric particles from sulfuric acid 7367
proximation for our measured growth rates and their size de-
pendence for the conditions in our experiments:
h i
GR(nm h−1 ) = 2.68 · dp (nm)−1.27 + 0.81
h i
· H2 SO4 (cm−3 ) × 10−7 (16)
3.3 Global implications
The observed steep increase of the growth rates with de-
creasing size shows that the collision enhancement due to
van der Waals forces is especially important for the small-
est particles. As these are the most vulnerable for losses
to pre-existing aerosols, their survival probability in the
atmosphere is directly affected, altering the CCN budget
(Pierce and Adams, 2007) or promoting NPF in urban en-
vironments (Kulmala et al., 2017). In order to test the ef-
fects of collision enhancement on sulfuric acid growth on
a global scale, we use the atmosphere-only configuration of
the United Kingdom Earth System Model (UKESM1; Mulc-
ahy et al., 2018; Walters et al., 2019) which includes the
GLOMAP (Global Model of Aerosol Processes) aerosol mi-
crophysics module describing nucleation and growth (Mann
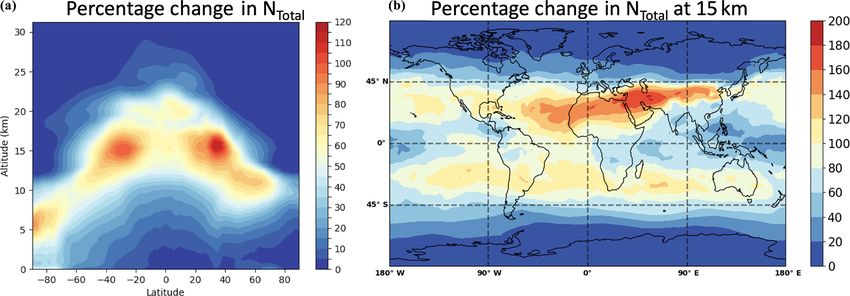
et al., 2010). Figure 5 illustrates the global model results
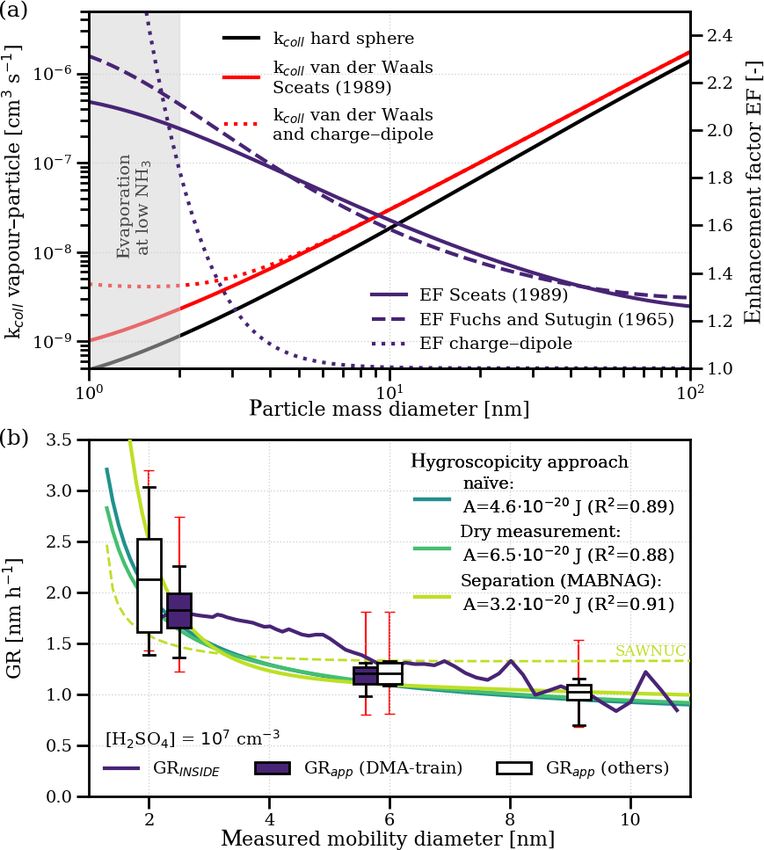
Figure 4. The size dependence of sulfuric acid growth. comparing the baseline case (no collision enhancement) with
Panel (a) shows the theoretical collision rate of hydrated sulfuric a collision enhancement simulation (with enhancement fac-
acid vapour molecules (mv = MH2 SO4 + 2MH2 O ) with particles of tors of 2.2, 1.8 and 1.3 for the cluster, nucleation and Aitken
a certain mass diameter. The black line represents the hard-sphere
modes respectively) for the present-day atmosphere. The ab-
limit, the red solid line also includes a collision enhancement due
solute particle number concentrations averaged over all lon-
to van der Waals forces based on the approach of Sceats (1989;
A = 4.6×10⁻²⁰ J), and the red dashed line is based on the approach gitudes are shown in Fig. 5a, indicating changes of more
of Fuchs and Sutugin (1965; A = 8.7 × 10⁻²⁰ J). The red dotted than 50 %, especially at high altitudes (> 10 km; Fig. 5b)
line additionally includes charge–dipole interactions based on av- where most aerosol particles originate from pure sulfuric-
erage dipole orientation theory. The blue lines show the enhance- acid-driven NPF. The importance of the nucleation process
ment factor of a single attractive force compared to the hard-sphere and, therefore, the growth rate enhancement is lower at lower
limit. Panel (b) shows the measured size dependence of growth rates altitudes and in the Northern Hemisphere, which is mainly
normalized to a sulfuric acid concentration of 107 cm−3 . The solid due to the higher condensation sink and the restriction of
blue line shows the growth rates inferred using the INSIDE method. the model to sulfuric acid–water binary nucleation. However,
Filled boxes represent the appearance time growth rates from the the significant enhancement of sulfuric-acid-driven nanopar-
DMA-train used to fit the Hamaker constant. Empty boxes represent
ticle growth in the upper troposphere may be important in
the appearance time growth rates from other instruments, includ-
quantifying sources of stratospheric aerosols and cirrus CCN
ing the results from Lehtipalo et al. (2016) with high (> 100 pptv)
NH3 concentrations. The boxes indicate the median and the 50 % (Brock et al., 1995; Deshler, 2008) and needs to be accounted
interquartile range of the data, whereas the whiskers represent the for in future model development.
90 % quantile. The small red error bars indicate the −33 %/+50 %
systematic uncertainty in the sulfuric acid measurement. We show
the size dependence of three different approaches for particle hy-
4 Discussion
groscopicity: the naïve approach (solid turquoise line), assuming
the same hydration for vapour and particle; the dry measurement
Understanding nanoparticle growth driven by sulfuric acid
approach (solid light green line), assuming that the DMA-train mea- is extremely important for modelling the present-day atmo-
sures completely dehydrated particles; and the separation approach sphere. Our measured growth rates cover a wide range of
(solid yellow line), assuming that available composition data from representative atmospheric conditions below 20 ◦ C and re-
MABNAG can disentangle water uptake from sulfuric acid conden- veal that sulfuric acid growth proceeds faster than the ge-
sation. The separation approach using SAWNUC composition data ometric hard-sphere kinetic limit. These faster growth rates
is also shown as a dashed yellow line. in the cluster size range could be partially responsible for
the occurrence of NPF in polluted environments (Kulmala
et al., 2017). Our results suggest that this collision enhance-
ment due to van der Waals forces can be more important
https://doi.org/10.5194/acp-20-7359-2020 Atmos. Chem. Phys., 20, 7359–7372, 20207368 D. Stolzenburg et al.: Enhanced growth rate of atmospheric particles from sulfuric acid
Figure 5. Increased global aerosol number concentrations due to collision enhancement. Results from a global modelling study of the
present-day atmosphere. Panel (a) shows the relative change in the total aerosol number concentration (particles larger 3 nm) averaged over
all longitudes in a vertical profile if collision enhancement is considered in sulfuric acid growth. Panel (b) shows the relative increase at an
altitude of 15 km on a global scale where the effects are most significant. Higher relative changes would also be expected at lower altitudes
if the model is adjusted for ternary sulfuric acid–water–ammonia nucleation.
than charge–dipole interactions or base stabilization by am- Author contributions. DS, MSim, AK, KL, HF, XH, SBri, MX,
monia for sizes larger than 2 nm. However, a better knowl- RB, AB, SBrä, LCM, DC, BC, AD, JDo, JDu, IEH, LF, LGC, MH,
edge of the chemical composition of the condensing vapour CK, WK, HL, CPL, ML, ZL, VM, HEM, TM, EP, JP, MP, MPR,
and growing sub-10 nm particles could further improve our SScho, SSchu, JS, MSip, GS, YS, YJT, AT, ACW, MW, YW, SKW,
understanding of molecular collision rates. For smaller sizes, DW, PJW, YW, QY, MZW, UB, JC, RCF, RV, JK and PMW pre-
pared the CLOUD facility or measuring instruments. DS, MSim,
the evaporation of sulfuric acid and charge effects need to be
AR, KL, XH, SBri, MX, AA, RB, AB, LB, SBrä, LCM, DC, LD,
considered, but the size range covered by our measurements
AD, JDu, IEH, HF, LF, LGC, MH, CK, TKK, WK, HL, CPL, ML,
is sufficient for the global model used, which nucleates par- ZL, HEM, RM, TM, WN, EP, JP, MPR, BR, SSchu, GS, CT, YJT,
ticles at 1.7 nm. We find significantly increased upper tropo- AT, MVP, ACW, MW, SKW, DW, PJW, YW, QY and MZW col-
spheric aerosol concentrations, but the global impact of van lected the data. DS, MSim, AR, HG, TN, LP, LD, HF, SE, MH, CK,
der Waals forces in nanoparticle growth might be even higher ACW and SKW analysed the data. DS, MS, AR, AK, KL, TN, XH,
due to the model limitations to binary sulfuric acid–water nu- MX, JDo, JDu, IEH, TKK, TP, MPR, MSip, UB, KSC, JC, NMD,
cleation. Therefore, our results should be considered in fu- RCF, AH, MK, JL, RV, JK and PMW were involved in the scien-
ture model development, especially when discussing the im- tific discussion and the interpretation of the data. DS, AK, KL, HG,
portance of changing sulfuric acid levels due to the reduced NMD, JK and PMW wrote the paper.
anthropogenic emissions of SO2 . Moreover, our parametriza-
tion of pure sulfuric acid growth rates will help to identify the
contribution of other co-condensing vapours in ambient and Competing interests. The authors declare that they have no conflict
of interest.
laboratory experiments to growth, as they set a new baseline
for the kinetic condensation of sulfuric acid. Several simpli-
fications have often been applied to kinetic particle growth,
Special issue statement. This article is part of the special issue
including hard-sphere collision based on bulk density and the “The CERN CLOUD experiment (ACP/AMT inter-journal SI)”. It
omission of vapour size in the collision cross section; our re- is not associated with a conference.
sults provide clear experimental verification that these sim-
plifications are no longer fit for increasingly accurate mea-
surements at these tiny yet critical sizes. Acknowledgements. We thank CERN for supporting CLOUD with
technical and financial resources and for providing a particle
beam from the CERN Proton Synchrotron. We are also grate-
Data availability. All of the datasets presented in this paper are ful to Patrick Carrie, Louis-Philippe De Menezes, Jonathan Du-
available from the corresponding author upon reasonable request. mollard, Katja Ivanova, Francisco Josa, Timo Keber, Ilia Krasin,
Robert Kristic, Abdelmajid Laassiri, Osman Maksumov, Ben-
jamin Marichy, Herve Martinati, Robert Sitals, Albin Wasem,
Supplement. The supplement related to this article is available on- Sergey Vitaljevich Mizin and Mats Wilhelmsson for their contri-
line at: https://doi.org/10.5194/acp-20-7359-2020-supplement. butions to the experiment.
Atmos. Chem. Phys., 20, 7359–7372, 2020 https://doi.org/10.5194/acp-20-7359-2020D. Stolzenburg et al.: Enhanced growth rate of atmospheric particles from sulfuric acid 7369
Financial support. This research has received funding from Deshler, T.: A review of global stratospheric aerosol:
the European Commission Seventh Framework Programme Measurements, importance, life cycle, and local
and the European Union’s Horizon 2020 programme (Marie stratospheric aerosol, Atmos. Res., 90, 223–232,
Skłodowska-Curie action no. 764991 “CLOUD-MOTION”; https://doi.org/10.1016/j.atmosres.2008.03.016, 2008.
MC-COFUND grant no. 665779 and ERC projects nos. 616075 Dunne, E. M., Gordon, H., Kürten, A., Almeida, J., Duplissy,
“NANODYNAMITE” and 714621 “GASPARCON”), the J., Williamson, C., Ortega, I. K., Pringle, K. J., Adamov, A.,
German Federal Ministry of Education and Research (grant Baltensperger, U., Barmet, P., Benduhn, F., Bianchi, F., Breit-
no. 01LK1601A “CLOUD-16”), the Swiss National Science enlechner, M., Clarke, A., Curtius, J., Dommen, J., Donahue,
Foundation (project nos. 200020_152907, 20FI20_159851, N. M., Ehrhart, S., Flagan, R. C., Franchin, A., Guida, R.,
200021_169090, 200020_172602 and 20FI20_172622), the Hakala, J., Hansel, A., Heinritzi, M., Jokinen, T., Kangasluoma,
Academy of Finland (project nos. 296628, 299574, 307331 and J., Kirkby, J., Kulmala, M., Kupc, A., Lawler, M. J., Lehti-
310682), the Austrian Science Fund (FWF; project nos. J-3951, palo, K., Makhmutov, V., Mann, G., Mathot, S., Merikanto,
P27295-N20 and J-4241), the Portuguese Foundation for Science J., Miettinen, P., Nenes, A., Onnela, A., Rap, A., Reddington,
and Technology (FCT; project no. CERN/FIS-COM/0014/2017), C. L. S., Riccobono, F., Richards, N. A. D., Rissanen, M. P.,
the U.S. National Science Foundation (grant nos. AGS-1649147, Rondo, L., Sarnela, N., Schobesberger, S., Sengupta, K., Simon,
AGS-1801280, AGS-1602086 and AGS-1801329). Open access M., Sipilä, M., Smith, J. N., Stozkhov, Y., Tomé, A., Tröstl,
funding was provided by University of Vienna. J., Wagner, P. E., Wimmer, D., Winkler, P. M., Worsnop, D.
R., and Carslaw, K. S.: Global atmospheric particle formation
from CERN CLOUD measurements, Science, 354, 1119–1124,
Review statement. This paper was edited by Jonathan Abbatt and https://doi.org/10.1126/science.aaf2649, 2016.
reviewed by David R. Hanson and two anonymous referees. Duplissy, J., Merikanto, J., Franchin, A., Tsagkogeorgas, G., Kan-
gasluoma, J., Wimmer, D., Vuollekoski, H., Schobesberger,
S., Lehtipalo, K., Flagan, R. C., Brus, D., Donahue, N. M.,
Vehkamäki, H., Almeida, J., Amorim, A., Barmet, P., Bianchi,
References F., Breitenlechner, M., Dunne, E. M., Guida, R., Henschel, H.,
Junninen, H., Kirkby, J., Kürten, A., Kupc, A., Määttänen, A.,
Biskos, G., Buseck, P. R., and Martin, S. T.: Hygroscopic growth Makhmutov, V., Mathot, S., Nieminen, T., Onnela, A., Pra-
of nucleation-mode acidic sulfate particles, J. Aerosol Sci., 40, plan, A. P., Riccobono, F., Rondo, L., Steiner, G., Tome, A.,
338–347, https://doi.org/10.1016/j.jaerosci.2008.12.003, 2009. Walther, H., Baltensperger, U., Carslaw, K. S., Dommen, J.,
Breitenlechner, M., Fischer, L., Hainer, M., Heinritzi, M., Curtius, Hansel, A., Petäjä, T., Sipilä, M., Stratmann, F., Vrtala, A., Wag-
J., and Hansel, A.: PTR3: An Instrument for Studying the Lifecy- ner, P. E., Worsnop, D. R., Curtius, J., and Kulmala, M.: Ef-
cle of Reactive Organic Carbon in the Atmosphere, Anal. Chem., fect of ions on sulfuric acid-water binary particle formation: 2.
89, 5824–5831, https://doi.org/10.1021/acs.analchem.6b05110, Experimental data and comparison with QC-normalized classi-
2017. cal nucleation theory, J. Geophys. Res.-Atmos., 121, 1752–1775,
Brock, C. A., Hamill, P., Wilson, J. C., Jonsson, H. H., and Chan, https://doi.org/10.1002/2015JD023539, 2016.
K. R.: Particle Formation in the Upper Tropical Troposphere: Ehrhart, S., Ickes, L., Almeida, J., Amorim, A., Barmet, P.,
A Source of Nuclei for the Stratospheric Aerosol, Science, Bianchi, F., Dommen, J., Dunne, E. M., Duplissy, J., Franchin,
270, 1650–1653, https://doi.org/10.1126/science.270.5242.1650, A., Kangasluoma, J., Kirkby, J., Kürten, A., Kupc, A., Lehti-
1995. palo, K., Nieminen, T., Riccobono, F., Rondo, L., Schobes-
Brunelli, N. A., Flagan, R. C., and Giapis, K. P.: Ra- berger, S., Steiner, G., Tomé, A., Wimmer, D., Baltensperger,
dial Differential Mobility Analyzer for One Nanome- U., Wagner, P. E., and Curtius, J.: Comparison of the
ter Particle Classification, Aerosol Sci. Tech., 43, 53–59, SAWNUC model with CLOUD measurements of sulphuric acid-
https://doi.org/10.1080/02786820802464302, 2009. water nucleation, J. Geophys. Res.-Atmos., 121, 12401–12414,
Bzdek, B. R., Horan, A. J., Pennington, M. R., DePalma, J. W., https://doi.org/10.1002/2015JD023723, 2016.
Zhao, J., Jen, C. N., Hanson, D. R., Smith, J. N., McMurry, P. H., Fuchs, N. A. and Sutugin, A. G.: Coagulation rate of
and Johnston, M. V: Quantitative and time-resolved nanoparticle highly dispersed aerosols, J. Colloid Sci., 20, 492–500,
composition measurements during new particle formation, Fara- https://doi.org/10.1016/0095-8522(65)90031-0, 1965.
day Discuss., 165, 25–43, https://doi.org/10.1039/C3FD00039G, Fuchs, N. A. and Sutugin, A. G.: High dispersed aerosols, in: Topics
2013. in Current Aerosol Research (Part 2), edited by: Hidy, G. M. and
Chan, T. W. and Mozurkewich, M.: Measurement of the co- Brock, J. R., 1–200, Pergamon, New York, 1971.
agulation rate constant for sulfuric acid particles as a func- Gordon, H., Sengupta, K., Rap, A., Duplissy, J., Frege, C.,
tion of particle size using tandem differential mobility analy- Williamson, C., Heinritzi, M., Simon, M., Yan, C., Almeida,
sis, J. Aerosol Sci., 32, 321–339, https://doi.org/10.1016/S0021- J., Tröstl, J., Nieminen, T., Ortega, I. K., Wagner, R., Dunne,
8502(00)00081-1, 2001. E. M., Adamov, A., Amorim, A., Bernhammer, A.-K., Bianchi,
Dada, L., Lehtipalo, K., Kontkanen, J., Nieminen, T., Baalbaki, F., Breitenlechner, M., Brilke, S., Chen, X., Craven, J. S., Dias,
R., Ahonen, L., Duplissy, J., Yan, C., Chu, B., Petäjä, T., A., Ehrhart, S., Fischer, L., Flagan, R. C., Franchin, A., Fuchs,
Lehtinen, K., Kerminen, V.-M., Kulmala, M., and Kangaslu- C., Guida, R., Hakala, J., Hoyle, C. R., Jokinen, T., Junninen,
oma, J.: Formation and growth of sub-3-nm aerosol parti- H., Kangasluoma, J., Kim, J., Kirkby, J., Krapf, M., Kürten,
cles in experimental chambers, Nat. Protoc., 15, 1013–1040, A., Laaksonen, A., Lehtipalo, K., Makhmutov, V., Mathot, S.,
https://doi.org/10.1038/s41596-019-0274-z, 2020.
https://doi.org/10.5194/acp-20-7359-2020 Atmos. Chem. Phys., 20, 7359–7372, 2020You can also read