Structural transformation, inequality, and inclusive growth in South Africa - Haroon Bhorat, Kezia Lilenstein, Morné Oosthuizen, and Amy Thornton* ...
←
→
Page content transcription
If your browser does not render page correctly, please read the page content below

WIDER Working Paper 2020/50

Structural transformation, inequality, and
inclusive growth in South Africa

Haroon Bhorat, Kezia Lilenstein, Morné Oosthuizen, and Amy
Thornton*

April 2020
Abstract: This paper evaluates structural change, inequality dynamics, and industrial policy in
South Africa between 1960 and the present day. We find that South Africa experienced growth-
enhancing structural transformation until the early 1970s, before entering a period of premature
deindustrialization. Today, the services sector has become the primary driver of growth and
employment in the country, while the agriculture, mining, and manufacturing sectors have declined
in relative importance. While the post-apartheid government has systematically strengthened its
pro-poor policies, the high levels of poverty, unemployment, and inequality forged under the past
race-based colonial and apartheid regimes remain stagnant. The future of South Africa’s structural
transformation and inclusive growth path rests on the ability of the country to move into more
skills-intensive and higher value-added manufacturing, while also promoting employment-
enhancing services subsectors.
Key words: structural transformation, inclusive growth, South Africa, industrial policy, inequality
JEL classification: H00, I38, O14, O25
Acknowledgements: The authors gratefully acknowledge support from UNU-WIDER.

*All authors: University of Cape Town, South Africa; corresponding author: kezia.lilenstein@uct.ac.za.
This study has been prepared within the UNU-WIDER project Varieties of structural transformation, as part of the subproject
‘The developer’s dilemma: structural transformation, inequality, and inclusive growth’.
Copyright © UNU-WIDER 2020
Information and requests: publications@wider.unu.edu
ISSN 1798-7237 ISBN 978-92-9256-807-8
https://doi.org/10.35188/UNU-WIDER/2020/807-8
Typescript prepared by Luke Finley.
The United Nations University World Institute for Development Economics Research provides economic analysis and policy
advice with the aim of promoting sustainable and equitable development. The Institute began operations in 1985 in Helsinki,
Finland, as the first research and training centre of the United Nations University. Today it is a unique blend of think tank, research
institute, and UN agency—providing a range of services from policy advice to governments as well as freely available original
research.
The Institute is funded through income from an endowment fund with additional contributions to its work programme from
Finland, Sweden, and the United Kingdom as well as earmarked contributions for specific projects from a variety of donors.
Katajanokanlaituri 6 B, 00160 Helsinki, Finland
The views expressed in this paper are those of the author(s), and do not necessarily reflect the views of the Institute or the United
Nations University, nor the programme/project donors.
1       Introduction

This paper evaluates structural change and inequality dynamics in South Africa. The first half of
the paper focuses on the economic history prior to the 1960s, before discussing structural
transformation in three distinct periods: (1) 1960–80, the period of industrialization; (2) 1981–93,
the period of decline; and (3) 1994–present, the post-apartheid period. The analysis shows that
South Africa enjoyed growth-enhancing structural transformation until about the early 1970s. This
period of rapid economic growth and industrialization saw industry overtaking the combined share
of agriculture and mining. Following this, South Africa went through a period of premature
deindustrialization and low growth, driven by poor global economic conditions that were
compounded by growing political turmoil within the country. In the post-apartheid period, South
Africa has experienced services-led structural transformation. The services sector has become the
primary driver of growth and employment, while agriculture, mining, and manufacturing have
declined.

The second half of the paper examines South Africa’s outcomes in these three periods in terms of
inclusive growth, poverty, and employment. The origin of the high inequality in South Africa can
be traced back to race-based policies under colonialization and apartheid, which sought to promote
high living standards for white South Africans by limiting the economic prospects of black 1 South
Africans through their forced removal from urban centres and discriminatory employment and
education policies. Inequality was further exacerbated in the first half of period I as the economic
boom disproportionately benefited high-skilled, white workers. The combination of growth-
enhancing structural transformation in the presence of growing inequality indicates a strong
Kuznetsian tension in South Africa, at least until about 1975. Thereafter, growth faltered while
inequality continued to grow throughout both the period of decline and the post-apartheid period.
This indicates a weak Kuznetsian tension in South Africa during the latter two periods.

The post-apartheid state has progressively intensified its pro-poor policies through increased
spending on education, an expansion of social security provisions, an expansion of basic services,
the implementation of Black Economic Empowerment programme policies, and a number of
labour market policies, including minimum wages and public works programmes. However, while
there has been an expansion in policies aimed at improving the livelihoods of the most vulnerable
in South Africa, poverty, unemployment, and inequality remain stagnant. Today, the inclusive
growth path is not straightforward for South Africa. The skills-intensive services industry, as the
primary driver of GDP growth, is not equipped to generate the number of jobs needed to combat
the country’s severe unemployment problem. While there are subsectors of the service industry
with the capacity to absorb low- and medium-skilled workers, the potential of the manufacturing
industry to promote employment-enhancing growth cannot be ignored. However, the obstacles to
increasing the growth of South African manufacturing industry are formidable in today’s global
conditions. The challenge facing South Africa is that of climbing the international ladder of
industrial production to more high-tech, more skills-intensive, and higher value-added
manufacturing activities. The balance of these strategies around revitalization of the flagging
manufacturing industry and promotion of employment-enhancing services subsectors is critical,
as establishing a successful pro-poor growth path is essential to creating sustainable livelihoods for
marginalized South Africans.

1 ‘Black’ in this context is a generic term referring to previously disadvantaged individuals, including African, Asian, and coloured

South Africans.

                                                                 1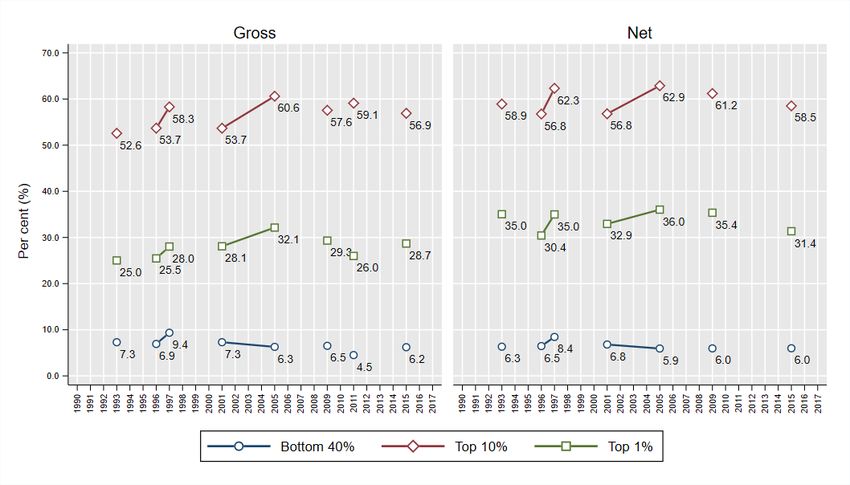
2     Economic history to 1960

During the late nineteenth and early twentieth centuries, South African economic development
was well on the conventional track of structural transformation. In the 1870s and 1890s, black
African farmers enjoyed a viable peasant agriculture which was able to compete with large-scale
white-owned farms. However, this had shifted substantially by the early twentieth century through
the economic marginalization of the black peasantry. Bundy (1979) describes the government
regulations—driven by political alliance with white farmers—which restricted black South
Africans’ access to land. This all but eliminated the black African agriculture sector and created a
mass of workers whose only option in terms of livelihood was to labour on white farms or in white
mines (Bundy 1979). In particular, the Natives Land Act of 1913 legalized territorial segregation,
prohibiting black Africans from owning land in white-owned areas, and demarcating only 7 per
cent of South Africa’s land for their use. This, in conjunction with the discovery of first diamonds
and then particularly gold on the Witwatersrand in 1886, was to transform what was an agriculture-
dominated economy to one that was minerals-driven (Nattrass and Seekings 2010).

The first three decades of the twentieth century saw relatively stagnant growth. The economy grew
but GDP per capita lagged behind that of similar settler colonies such as Australia, New Zealand,
Canada, and Argentina (Maddison 2001). Major exports were agricultural: wool, ostrich feathers,
maize, and sugar. Pockets of economic activity existed along the strip of gold mines that emerged
along the Witwatersrand, in the city of Johannesburg, and to a lesser extent in Cape Town. In
1911, agriculture accounted for 22 per cent of South African national income, and mining for just
less than 27 per cent (Feinstein 2005). By 1930, though, gold accounted for 50 per cent of all
exports from the Union and a third of world supply at the time, and was undoubtedly the most
important industry in South Africa. The mines were critical in attracting capital and stimulating
growth in other industrializing sectors, such as timber, food, and transport (Nattrass and Seekings
2010).

Recession hit the economy in the early 1930s with the onset of the Great Depression, but the
South African economy was cushioned by relatively inelastic global demand for gold and an
agricultural sector that was, by then, producing mainly for the domestic market. South Africa
belatedly abandoned the gold standard in 1932 and devalued the currency, raising the income of
the gold mines by 45 per cent (Terblanche 2002) and unleashing a period of enrichment and three
decades of strong sustained growth. Depreciation of the exchange rate, combined with an increase
in the dollar price of gold, led to a 30-year boom in gold production revenue, tax revenues, and
employment growth. South Africa was still responsible for about one-third of the global gold
supply in 1939, which rose further during the Second World War despite severe labour shortages.
This allowed South Africa to weather the war period relatively well. During this time, the country
ran a budget surplus, accumulated gold reserves, and managed to repay government and private
debt (Nattrass 2005). Total factor productivity between 1939 and 1945 grew faster than in any
other period in South African history (Moll 1991).

The importance of the mines meant that their labour dynamics were cause for policy intervention.
Most of the gold was buried in reefs deep underground and deep-level mining activity was required
to extract the ore. Gold mining therefore came with high fixed capital costs, and the easiest way
to make the industry profitable was by keeping the cost of labour low. There is general consensus
that the mines would not have been profitable if it were not for low-skilled black African migrant
labourers, whose wages were kept low despite chronic labour shortages at the time (Feinstein 2005;
Wilson 1972). When the mines sought to adjust their labour mix to one that was more profitable—
by increasing employment of skilled black African labour at the expense of costly white workers—
white workers resisted with industrial action and violence in the 1922 Rand Revolt. Government

                                                 2
wanted to maintain the profitability of the mines due to the industry’s importance for the economy
as a whole, but was also concerned with the living standards of the white population, which
demanded a ‘living’ or ‘civilized’ wage in line with their Australian and other settler counterparts
(Nattrass and Seekings 2010). To balance these two priorities, the government sought to find other
sectors of the economy in which to employ white workers at high wages.
Government set up a series of incentives to stimulate industrialization, and in 1925 the Customs
Tariff and Excise Duty Amendment Act increased and expanded tariffs. With strong state support,
high wartime demand, and protection from foreign competition, the manufacturing sector thrived.
Manufacturing output tripled between 1924 and 1939, despite the depression, and its share of
GDP increased from 12 per cent in 1939 to 19 per cent in 1949 (Richards 1940). The tariffs helped
employers to cope with the high cost of white labour, even if this brought about a cost in terms
of efficiency. Just before the war, manufacturing overtook agriculture’s share of value added, and
soon after it overtook mining. A consequence of the state incentives to increase the share of capital
was that farms also started intensifying their use of capital, and soon small farms were being
absorbed by bigger, more efficient capital-intensive ones. During the war period and while the
more organized elements of white labour were absent, employers in most sectors took the
opportunity to mechanize and deskill, a precursor to a trend that would continue into the twenty-
first century.
In 1948, the National Party was elected and swiftly introduced a slew of legislation that structured
apartheid. O’Meara (1983) describes this system as volkskapitalisme, a politically led system of
Afrikaner capitalism which took the form of vigorous state support for burgeoning Afrikaner
business. During its first decade in power, the National Party set up a series of exclusionary labour
market institutions that protected white workers’ jobs and wages, to the cost of black South
Africans and also, potentially at the cost of future growth (Nattrass and Seekings 2010). Carried
by the beginning of the boom in the late 1930s, this was a period of strong growth until about the
early 1970s. Real GDP tripled and real GDP per capita almost doubled between 1948 and 1970.
Industrialization gained momentum as the share of industry (including construction, electricity,
and manufacturing) came to exceed the combined share of agriculture and mining in the 1950s.
However, this institutional structure rendered the economy less efficient and less competitive
internationally and undermined the buying power of the domestic population. The economic
consequences of these institutions dovetailed during the apartheid period and were reinforced well
into the post-apartheid era to preclude inclusive growth, and they have proven to be highly
persistent and difficult to uproot. While overall the period saw a transition from agriculture
towards manufacturing, the extent to which the apartheid government’s race-based strategies
played a role in this is unclear. In other words, it is uncertain whether South Africa would have
organically followed this pattern of structural transformation in the absence of the oppression of
the black African agriculture peasantry and state-supported Afrikaner industrialization. It may
therefore be the case that South Africa’s growth path follows a unique ‘race-based’ pattern of
structural transformation, rather than one which would have naturally occurred in the absence of
these policies.
3 Trends in structural transformation
The post-1960 period is known as the ‘winds of change’ period, when the process of
decolonization and the separation of Britain from its Southern African colonies was formalized.
However, this process stalled at the South African borders as separate development took over in
the form of formal apartheid systems. Overall, the post-1960 period has been a turbulent period
3both politically and economically in South Africa. Considering growth trends and economic
structure, the period can be divided into three. The first period was characterized by relatively
rapid GDP and GDP per capita growth (Figure 1), and a growing manufacturing sector, ending in
1981. The second period was characterized by a combination of challenges—including the after-
effects of the oil crisis, the gold boom and bust, and increasing internal and external opposition to
apartheid—and culminated in the 1994 democratic elections. The third period, the post-apartheid
era, has seen the reintegration of South Africa into the global economy and a recovery in economic
growth.
Figure 1: Five-year real GDP and GDP per capita growth rates in South Africa
Note: figures are for preceding five-year period in each case.
Source: authors’ illustration based on South African Reserve Bank (2019).
3.1 Period I: industrialization (pre-1981)
Real GDP growth was at its highest since the Second World War during the 1960s, averaging 6.3
per cent per annum over the 1960–65 period, often referred to as the ‘golden age of growth’ in
South Africa. Growth lost momentum in the 1970s, as manufacturing went into decline and the
effects of the oil crisis were felt, and would only really recover after apartheid was dismantled in
the mid-1990s. Both real GDP and GDP per capita growth decelerated throughout the 1960s and
1970s, averaging 3.1 per cent and 0.7 per cent per annum in 1975–80.
The period to 1981 was characterized by growth in the share of value added and employment
accounted for by manufacturing. At its peak in 1981, manufacturing accounted for 24.5 per cent
of value added and 16.8 per cent of employment (Figure 2). At the same time, there was a steep
decline in the non-manufacturing industry share and a very slight decline in the agricultural share
of value added. In employment terms, agriculture collapsed from 48.8 per cent of total
employment in 1960 to 25.9 per cent in 1981, while non-manufacturing industry employment was
marginally higher over the period (Figure 4). The growth in services was also substantial, with the
share in value added increasing from 47.4 to 51.6 per cent and the share of employment increasing
from 28.7 to 42.0 per cent over the period. While in 1960 the agriculture sector dominated in terms
of employment, by 1980 the services sector was the largest employer in the South African
economy.
4Figure 2: Composition of value added, South Africa, 1960–2011
(% of value added)
100
90
80
70
60
50
40
30
20
10
0
1960 1970 1980 1990 2000 2010
Agriculture Mining Manufacturing
Utilities and construction Non-business services Business services
Notes: business services are financial intermediation, renting, business activities. Non-business services are (a)
wholesale and retail trade, repair of motor vehicles, motorcycles, and personal and household goods, hotels and
restaurants, (b) transport, storage, communications, (c) public administration, defence, education, health, social
work, and (d) other community, social, and personal service activities, activities of private households.
Source: authors’ calculations based on GGDC (Groningen Growth and Development Centre) 10-Sector Database
Version 2015 (Timmer et al. 2015).
Figure 3: Growth decomposition by sector, South Africa, 1961–2011
(% of HP filtered value added growth)
120.0
100.0
80.0
60.0
40.0
20.0
0.0
1960 1970 1980 1990 2000 2010
-20.0
Agriculture Mining Manufacturing
Utilities and construction Non-business services Business services
Source: authors’ calculations based on GGDC 10-Sector Database Version 2015 (Timmer et al. 2015).
5By the 1970s, a combination of investment subsidies, tax breaks, and negative real interest rates
encouraged capital intensification even though the productivity of capital was declining: from the
1960s to the 1980s, the cost of capital relative to labour fell by 50 per cent, as wages for all
population groups increased (Nattrass and Seekings 2010). Terblanche (2002) further argues that
the trend towards greater capital intensity of production had its roots in the experience of state-
owned enterprises in the 1920s and 1930s. These were initially unable to compete with foreign-
owned companies which had access to cheap European capital, and had to compensate by using
‘highly mechanised production methods, a small elite of skilled white workers, and large numbers
of unskilled, disenfranchised, and cheap African workers’ (Terblanche 2002). This represented a
continuation of the existing approach of the gold mines and served to further entrench this
approach in the rest of the economy.
Figure 4: Composition of employment, South Africa, 1960–2011
(% of employment)
100
90
80
70
60
50
40
30
20
10
0
1960 1970 1980 1990 2000 2010
Agriculture Mining Manufacturing
Utilities and construction Non-business services Business services
Source: authors’ calculations based on GGDC 10-Sector Database Version 2015 (Timmer et al. 2015).
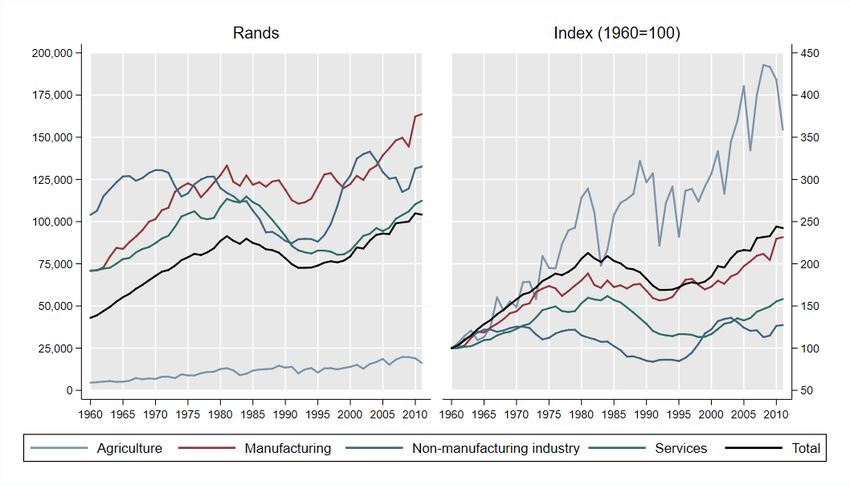
Between 1960 and 1981, overall labour productivity more than doubled from an index value of
100 to 212.7, equivalent to an average annual growth rate of 3.6 per cent (Figure 5). The most
rapid increase was observed in agriculture, where labour productivity almost tripled to an index
value of 289.2 in 1981, primarily driven by a large decrease in employment in the sector over the
period. Increases in labour productivity were weakest in non-manufacturing industry (a 12.5 per
cent increase over the period) and services (an increase of 59.8 per cent). Nevertheless, in absolute
terms, agricultural labour productivity remained only a fraction of that in other sectors.
6Figure 5: Labour productivity by sector since 1960
Source: authors’ calculations based on GGDC 10-Sector Database Version 2015 (Timmer et al. 2015).
Despite these shifts in sectoral labour productivity, Figure 6 indicates that growth in labour
productivity was primarily driven by between-sector rather than within-sector changes in this
period. Figure 7 gives the ratio of sectoral to economy-wide labour productivity against
employment share. The industries in bold are those sectors with higher than economy-wide
average labour productivity that also experienced an increase in employment share. It is clear that
in this period the manufacturing, mining, and services sectors all experienced higher than
economy-wide labour productivity growth coupled with growing employment. This is indicative
of the increasing importance of the manufacturing and services sectors in driving structural
transformation.
Figure 6: Decomposition of labour productivity growth, South Africa, 1960–2011
1960–2012
1960–1980
1981–1993
1994–2011
-3 -2 -1 0 1 2 3 4
Per cent per annum
Within Between
Note: decomposition uses the methodology of McMillan and Rodrik (2011).
Source: authors’ calculations based on GGDC 10-Sector Database Version 2015 (Timmer et al. 2015).
7The gold-led commodity price boom of the 1970s also played a substantial role in the changing
structure of exports of the period. The dollar price of total exports grew by 5 per cent per year
between 1965 and 1970, but between 1970 and 1980 this had increased to 12.4 per cent (Bell and
Madula 2002), led by an increase in the price of gold and other mined goods. With the influx of
foreign exchange came a substantial real appreciation of the rand and a change in the relative prices
of manufactured goods. The result was a considerable change in the composition of manufacturing
exports. The shares of light manufacturing such as food, beverages, and tobacco were in decline
as the competitiveness of downstream manufactured goods declined with the increase in the
exchange rate. There was a simultaneous growth in natural-resource-based manufacturing such as
iron and steel, machinery, and paper. With natural-resource-based manufacturing exports
protected by high international prices for commodity-based goods, the share of these goods in
manufactured exports grew from 24.3 per cent to 37.1 per cent between 1970 and 1980 (Bell and
Madula 2001).
Figure 7: Changes in labour productivity and employment share, South Africa, 1960–2011
7a: 1960–80
Ratio of sectoral productivity to total productivity (log)
1.2
1
0.8 Mining
0.6 Business services
Non-business
0.4 services
Manufacturing
0.2 Utilities and
construction
0
0 5 10 15 20 25 30 35 40 45
Employment share (%)
7b: 1981–93
Ratio of sectoral productivity to total productivity (log)
0.8
0.6 Mining
0.4 Business
services Manufacturing Non-business
0.2 services
0
0 10 20 30 40 50
-0.2 Utilities and
construction
-0.4
Employment share (%)
87c: 1994–2011
Ratio of sectoral productivity to total productivity (log)
1.2
Mining
1
0.8
Business
0.6 services
0.4
Manufacturing
0.2
0
0 5 10 15 20 25 30 35 40 45 50 55
-0.2 Non-business
Utilities and
-0.4 construction services
Employment share (%)
Note: sectors with higher than economy-wide average labour productivity that experienced an increase in
employment share are in bold.
Source: authors’ calculations based on GGDC 10-Sector Database Version 2015 (Timmer et al. 2015).
3.2 Period II: decline (1981–93)
Economic growth decelerated even further during the 1980s, to the extent that real GDP per capita
growth contracted in each of the five-year periods between 1980 and 1995. This was a result of
both internal and external factors. Slow growth was not unique to South Africa, with the Western
world only just emerging from the recession of the early 1970s, which was at least partially driven
by the oil crises in the same period. The mid-1980s also saw a decline in gold exports and a
depreciation of the rand after the collapse of the commodity price boom (Bell and Madula 2001),
which resulted directly in a declining level of output. At the same time, there was growing
international opposition to apartheid as well as rising political instability in South Africa. This
contributed to a substantial increase in debt and a sharp fall in foreign direct investment (FDI)
inflows. By the 1985–1992 period, foreign capital outflows were equivalent to 4.1 per cent of GDP
per annum on average (Terblanche 2002).
This period of decline also saw a significant weakening of the manufacturing sector relative to the
rest of the economy. The sector’s share of value added declined by more than six percentage points
to 18.3 per cent in 2011, and its share of employment by more than five percentage points to 11.6
per cent (Figure 2). Manufacturing’s share of total employment also declined, from 16.5 per cent
to 13.5 per cent between 1981 and 1993 (Figure 4). Only the utilities and services sector saw a
growth in employment share over this period of decline. In 1980, the combined business and non-
business services sector contributed 42 per cent to overall employment. By 1993, this had increased
to 51.9 per cent.
Labour productivity suffered too, falling from an index value of 212.7 in 1981 to 169.4 in 1994—
a level previously seen prior to the oil crisis—representing a decline of more than one-fifth (Figure
5). This weakness in labour productivity was observed across sectors: it fell by roughly 15 per cent
in manufacturing, 24 per cent in non-manufacturing industry, and 29 per cent in services. While
labour productivity fell over the period, only the services sector experienced growth and
employment-enhancing structural transformation in the period (Figure 7). Figure 6 indicates that
there was very little change in sector labour productivity growth between 1981 and 1993. However,
the services sector continued on its pre-1981 trajectory as the only sector experiencing higher than
average sectoral productivity coupled with an increase in employment. Non-manufacturing
9industry began to move more or less in tandem with manufacturing, losing ground in both value
added and employment.
This decline in manufacturing and general collapse of the economy is related to the deterioration
of economy-wide investment, as downstream manufacturing goods are particularly sensitive to
levels of investment in the economy (Bell and Madula 2001). Manufacturing in general is an
import-intensive industry and was particularly badly hit by the increase in the price of imports that
accompanied the deterioration of the exchange rate over the period (Bell and Madula 2001). This
collapse in the manufacturing sector was mirrored in South Africa’s dismal performance in the
export markets. By the mid-1980s, manufactures accounted for less than one-fifth of exports, with
over half of exports in the ‘unclassified’ category, which would have included gold (Figure 8).
Between 1960 and 2004, South Africa’s manufacturing exports grew by only 34 per cent, compared
with 169 per cent in Argentina, 385 per cent in Brazil, and 1,887 per cent in Botswana (Hausman,
2008). This decline in manufacturing exports can also be linked to increased competition in the
market coming from the intrusion of Asian newly industrialized countries (NICs) into the world
market. Furthermore, South Africa had become increasingly globally isolated in the face of
stringent economic sanctions put in place in opposition to the apartheid government.
Overall, this period can be described as one in which South Africa experienced premature
deindustrialization, as growth in the industrial sectors declined before the full benefit of such
structural transformation could be gained. Hausmann (2008) explains that this had two key
consequences. The failure to diversify and grow exports meant that later in the post-apartheid
period, when growth did improve, the current account went into deficit because growth was largely
stimulated by the business and financial services sector—which used, rather than generated,
foreign exchange. The result was a foreign exchange constraint, which severely undermined the
ability of import-reliant sectors to grow. In addition, this resulted in inflationary pressure, which
led to restrictive economic policies in general. The second key consequence of an underperforming
export sector was an inhibitive effect on employment because the sectors leading growth were
relatively more skills-intensive.
3.3 Period III: the post-apartheid period (1994–present)
With the end of apartheid in 1994, the economy went through important changes as the country
underwent a process of state-building to dismantle the existing discriminatory legal framework and
rebuild one that would reflect the new democratic and inclusive constitution. Economic sanctions
were removed, FDI surged, and tariffs were slashed in most sectors in the late 1990s (Bhorat and
Rooney 2017). Economic growth was relatively robust, at least until the global financial crisis.
From a low of 0.9 per cent per annum in 1990–95, GDP growth averaged above 3 per cent in the
2000–05 and 2005–10 periods, before moderating during the 2010s (Figure 1). However, the
structure of the economy inherited from the apartheid era was such that the gains of growth largely
accrued to a small already-privileged segment of the population, compounding their advantage.
After decades of isolation, it was not a surprise that the industrial sector struggled to cope with the
onslaught of foreign competition and quickly contracted (Bhorat and Rooney 2017; Edwards
2005). Adjustments in labour market institutions soon led to similar trends in agriculture and
mining, as the benefits and comparatively high wages previously only enjoyed by white workers
were extended to all (Nattrass and Seekings 2010). Mining and manufacturing contracted by a third
and a fifth, respectively, between 2001 and 2014 in terms of value added; the finance sector, in
contrast, expanded by 30 per cent. Figure 3 shows that the services sector contributed 84 per cent
to GDP growth in 1994, and the majority of movement was seen in the business services sector
in particular. While this subsector contributed 21.9 per cent to the growth of value added in 1993,
this increased to 32.3 per cent in 2011 (Figure 3). Employment changes moved in tandem: the
10employment share of the tertiary sector soared, while employment in the secondary sector
remained stable and employment in the primary sector halved (Bhorat and Rooney 2017). Financial
services and community, social, and personal (CSP) services together accounted for almost 80 per
cent of the change in employment between 2001 and 2014.
At the same time, labour productivity began to recover (Figure 5). At the national level, labour
productivity rose by 43.1 per cent between 1994 and 2011, surpassing the 1981 peak in 2004.
Improvements have been observed across all sectors, particularly in non-manufacturing industry
(47.9 per cent), manufacturing (44.1 per cent), and services (38.5 per cent), although non-
manufacturing industry has shown weakness since around 2000. However, unlike in period I,
increases in labour productivity during this period have been driven by within- rather than between-
sector changes (Figure 6). There was also a shift in the structure of exports over the period, with
manufactures gaining ground during the 1990s but then being crowded out to some extent by ores
and metals (Figure 8).
Figure 8: Export composition, South Africa, 1974–2012
100
90
80
Share of exports (%)
70
60
50
40
30
20
10
0
1974 1984 1994 2004
Agricultural raw materials Food Fuel Ores and metals Manufactures Unclassified
Source: authors’ calculations based on World Development Indicators, Version June 2019 (World Bank 2019b).
In the post-apartheid period, the productivity of capital has increased and employers have resumed
the process of capital intensification, though for reasons different to those in the 1960s and 1970s.
After 1995, this process was stimulated less by state incentives (e.g. negative interest rates) than by
the high cost of labour and skills shortages. Given weaker international competitiveness, employers
have struggled to cope with rising labour costs without concomitant increases in labour
productivity (Nattrass and Seekings 2010). As such, incentives to mechanize and intensify capital
remain, and South African industry has become increasingly mechanized even in a context of high
open unemployment. Low-wage informal work, by contrast, constitutes a relatively small share of
total employment.
Overall, there has been a general inability of the manufacturing sector to drive substantial increases
in output and employment. The reasons for this may be numerous. Bell and Madula (2001) argue
that the manufacturing sector’s general inability to recover as a key driver of growth in South Africa
is related to the foreign exchange constraint generated by the falling price of commodities and
generally adverse conditions for investment over the period, which is an important factor in this
important intensive industry. In addition, there has been continual downward pressure on
manufacturing output prices due to increased global competition. Furthermore, South Africa is
experiencing a scarcity of high-skilled workers directly related to its race-based policies enacted
during apartheid. Bhorat (2001) shows that there have been substantial increases in the demand
11for highly skilled workers in the manufacturing sector, coupled with a decline in demand for skilled
and unskilled workers. With the services sector also demanding more relatively highly skilled
workers, the manufacturing sector is struggling to compete with these skills-intensive industries
for workers. This has contributed to an inability to penetrate skills-intensive, high-tech
manufacturing subsectors. This inability of manufacturing to contribute meaningfully to growth
in recent decades has seen South Africa transition to a services-led economy, and this sector is
now the dominant source of output and employment growth.
4 Income inequality, employment, and inclusive growth
4.1 Period I: industrialization (pre-1981)
Inequality at the start of period I was high in South Africa, with the Gini estimated at 54.9 (Figure
9). Over the next two decades the Gini fluctuated, rising to 65.2 in 1975 before falling to 53.3 in
1980, its lowest level over the period. Overall, inequality in this period was unstable. It appears
that inequality was increasing in the beginning of the period when real GDP was growing fastest.
During this period, white South Africans were the primary beneficiaries of this boom due to the
growing need for skilled workers. Higher export prices associated with the commodity boom also
disproportionately benefited white capital. This is also the period of the most concentrated
industrialization, with growth in the manufacturing share of value added at its highest. Inequality
therefore appears to have been positively related to manufacturing-led structural transformation
until about 1975 (Figure 10 and Figure 11).
Figure 9: Gross and net income Gini, South Africa, 1960–2015
75
70
65
60
55
50
45
1960 1970 1980 1990 2000 2010
Gross income Gini
Net income Gini
Source: authors’ calculations based on UNU-WIDER’s World Income Inequality Database (WIID).
Inequality underwent a large decline towards the end of the period (Figure 9). Van der Berg and
Bhorat (1999) relate this to the unprecedented decrease in the racial wage gap in the 1970s.
Between 1972 and 1980, average black African wages in mining almost tripled (a 184 per cent
increase), while wages in manufacturing and construction also saw a large increase (van der Berg
and Bhorat 1999). Higher levels of education and the rise of powerful black trade unions are both
contributing factors to the narrowing of the racial wage gap (van der Berg and Bhorat 1999), and
are both related in turn to the changing political landscape of the period, discussed in the following
section.
12Figure 10: Gross income Gini and manufacturing value added share, South Africa, 1964–2011
(Gross income Gini)
75
70 2005
2010 1975
65
2000
1995 1990
60
55 1965
1970
1980
50
1985
45
15 17 19 21 23 25
(Manufacturing value added share, %)
Notes: (i) the missing Gini coefficients were calculated using linear interpolation (see Figure 12 for the original
data); (ii) manufacturing value added and employment shares are five-year moving averages: for example, the
data for 1975 is an average of data for 1971–75 (see Figures 1 and 2 for the original data). These notes apply to
Figures 7, 8, 9, and 10.
Source: authors’ calculations based on GGDC 10-Sector Database Version 2015 (Timmer et al. 2015) and WIID
(UNU-WIDER).
Figure 11: Gross income Gini and manufacturing employment share, South Africa, 1964–2011
(Gross income Gini)
75
70 2005
2010
65 2000 1975
1995 1990
60
55 1965
1970
1980
50
1985
45
9 10 11 12 13 14 15 16 17 18
(Manufacturing employment share, %)
Source: authors’ calculations based on GGDC 10-Sector Database Version 2015 (Timmer et al. 2015) and WIID
(UNU-WIDER).
134.2 Period II: decline (1981–93)
Inequality almost unequivocally rose during this period of deindustrialization, with the Gini
moving from 53.3 in 1980 to 63.8 in 1993 (Figure 9). The relationship between inequality and
manufacturing-led structural transformation is also less ambiguous in this period. Figure 10 and
Figure 11 indicate a clear inverse relationship, with inequality rising throughout the period as the
manufacturing share of value added and employment declined. Conversely, the relationship with
changes in the services sector is positive. Figure 12 and Figure 13 indicate a clear increase in the
services share of value added and employment during this period of rising inequality.
Figure 12: Gross income Gini and non-business services value added share, South Africa, 1964–2011
(Gross income Gini)
75
70
2005
1975 2010 2000
65
1990 1995
60
55 1965
1970 1980
50
1985
45
40 42 44 46 48 50
(Non-business services value added share, %)
Source: authors’ calculations based on GGDC 10-Sector Database Version 2015 (Timmer et al. 2015) and WIID
(UNU-WIDER).
At the same time, the racial wage gap in South Africa continued to narrow. In manufacturing, for
example, black African wages increased from 23 per cent of white wages in 1980, to 29 per cent
in 1994 (van der Berg and Bhorat 1999). This was mirrored in overall income, with black African
per capita income as a percentage of white income rising from 8.5 per cent in 1980 to 13.5 per
cent in 1995 (van der Berg et al. 2001). Accompanying this was an increase in the occupational
mobility for black South Africans, as the need to promote economic growth increased. However,
employment growth lagged labour market growth, leading to rising unemployment in the period.
By 1994, about half of all economically active South Africans were unable to find formal sector
employment (van der Berg and Bhorat 1999). These shifting dynamics contributed to the structure
of inequality in South Africa changing over time. Whiteford and van Seventer (2000) show that
the driver of income inequality in South Africa shifted over the period: in 1975, 62 per cent of
inequality was driven by between-group inequality, while in 1996 within-group inequality
contributed 67 per cent to overall inequality (groups defined here according to race). Overall, these
patterns of changing inequality, unemployment, and poverty have been persistent in the post-
14apartheid years. While poverty has decreased and wages for black South Africans have increased,
inequality and unemployment continue to rise.
Figure 13: Gross income Gini and non-business services employment share, South Africa, 1964–2011
(Gross income Gini)
75
70 2005
1975 2010
65
1995 2000
1990
60
55 1965
1970 1980
50
1985
45
25 30 35 40 45 50 55
(Non-business services employment share %)
Source: authors’ calculations based on GGDC 10-Sector Database Version 2015 (Timmer et al. 2015) and WIID
(UNU-WIDER).
4.3 Period III: the post-apartheid period (1994–present)
The high levels of inequality faced by South Africa during apartheid were persistent in the post-
apartheid era. While there have been some fluctuations, inequality has remained almost unchanged
between 1993 and the present day, with a Gini of 69.3 in 2015 (Figure 9). Overall, the consensus
is that inequality either has not changed or has increased since 1994, despite the dismantling of
discriminatory legislation (Wittenberg 2017). This increase comes mainly from a rise in within-race
inequality among black Africans, as some members of the population have succeeded in advancing
economically (Wittenberg 2017). Today South Africa has what may be the highest level of income
inequality in the world (Statistics South Africa 2017). From the perspective of income shares, a
similar pattern emerges: Figure 14 shows that in both 1993 and 2015, the bottom 40 per cent of
the distribution had around a 6 per cent share of net income. In contrast, the top 1 per cent of
income earners accounted for 35.0 per cent of total net income in 1993 and 31.4 per cent in 2015.
15Figure 14: Estimated income shares by income group since 1993
Source: authors’ calculations based on WIID (UNU-WIDER).
The relationship between structural transformation and inequality follows that of the preceding
period. Figure 10 and Figure 11 indicate rising inequality in this continued period of
deindustrialization. At the same time, Figure 12 and Figure 13 show continued services-led
structural transformation. The increase in inequality associated with the expanding services sector
may be related to existing inequalities within that sector, as well as a shifting skills profile of the
employed. A large proportion of employment generated by the services sector is in the form of
temporary employment services (TES) (Bhorat et al. 2016b). TES workers are employed through
third-party companies and perform activities such as cleaning or security services at formal sector
firms. Bhorat et al. (2016c) find that TES employment has risen substantially in the post-apartheid
period and that in 2014, TES employment made up 61 per cent of total business services
employment. This type of employment, as well as that of other low-skilled service sector workers,
is associated with negative earnings premiums (Bhorat et al. 2015). Simultaneously, there has been
growth in skilled employment in the sector. Between 2001 and 2012, more than 70 per cent of the
increase in tertiary sector employment came from medium- and high-skilled workers, with high-
skilled workers accounting for almost 30 per cent of services sector employment in 2012 (Bhorat
et al. 2015). These workers are likely to be located in more modern subsectors of the services
sector—namely business, finance, and communications services—and are able to garner a
substantial wage premium (Bhorat et al. 2016b).
While overall income inequality has increased, inequality in the years of schooling obtained has
decreased: in 1994 only 15 per cent of Africans over the age of 25 had completed high school,
while in 2017 this figure had increased to 34 per cent (own calculations, data from Kerr et al. 2017).
However, it will take a significant amount of time to undo centuries of racially discriminatory
education policies. Despite some improvement, South Africa still has the worst education system
of all middle-income countries that participate in cross-national assessments of educational
achievement, and also performs worse than many low-income countries (Spaull 2013). Only 50
per cent of pupils entering the school system make it to grade 12, only 40 per cent pass grade 12,
and only 12 per cent qualify for university. Regardless of the metric used, South African students
16persistently test below where they should be in terms of the curriculum and have not reached a
host of normal numeracy and literacy milestones (Spaull 2013).
This has led to a severe skills shortage in the economy, which hampers South Africa’s ability to
drive economic growth in general and inclusive growth more specifically. The combination of the
sluggish transformation of the education system and increasing demand for high-skilled workers
associated with services-led structural transformation has only exacerbated South Africa’s
unemployment problem, with the unemployment rate estimated at 29.1 per cent in 2019 (Statistics
South Africa 2020). The overall result is a shortage of highly educated, high-skilled workers and
insufficient demand for low-skilled workers. Unemployment in South Africa is also racially
delineated: the unemployment rate of 7.6 per cent for whites is a quarter of that for black Africans
(32.4 per cent) (Statistics South Africa 2020).
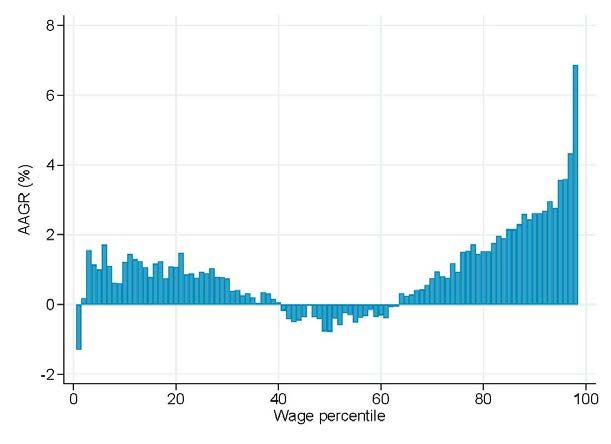
The relationship between structural transformation and inequality can also be viewed in terms of
changes in wage income across the distribution. Figure 15 gives the average annualized growth
rate of real monthly earnings between 2000 and 2015 plotted against wage percentiles. The change
in wages in this period is clearly U-shaped, with wages at the bottom and top of the distribution
increasing overall, and wages in the middle of the distribution remaining stagnant or decreasing.
Growth at the bottom of the distribution can be linked to the implementation of and increases in
minimum wages over the period, discussed in the following section. There has also been a
proliferation of low-paid jobs associated with the burgeoning services sector (Bhorat et al.
forthcoming).
Figure 15: Annual average growth rate (AAGR) of real earnings for employees in South Africa, 2000–15
Note: calculations adjusted using sampling weights; sample consists of all employees of working age with non-
missing wage and hours of work data.
Source: authors’ calculations based on Post-Apartheid Labour Market Series (Kerr et al. 2017).
The stagnation of wages in the middle of the distribution can be attributed at least partially to the
changing structure of the economy, specifically through the collapse of the manufacturing industry.
At the same time, education shares of the employed have shifted over time, and increases in the
general level of education in South Africa have been undermined by changes in the way in which
education is remunerated. The period has seen a rapid increase in medium-skilled workers who are
qualified to do the types of routine and manual work commonly found in the manufacturing sector,
17which are easily offshored by technology. The top of the distribution saw the biggest real increase
in wages, which grew at about 3 per cent per annum in the top decile. This dramatic increase in
wages for the top earners is associated with increasing returns to high-skilled work as well as more
analytical, decision-making, and creative tasks being required by the high-skilled business and
finance services sector (Bhorat et al. forthcoming). Therefore, the skills-biased wage structure in
place today has undermined some of South Africa’s post-apartheid advances.
Despite this, there have been overall decreases in poverty levels in South Africa over the period.
Figure 16 indicates that South Africa has seen declining poverty since 1993. While headcount
poverty at the US$1.90 line was 29.3 per cent in 1993, this had declined to 18.8 per cent by 2014.
Additionally, while poverty rates remain high, asset-based poverty has been steadily falling. The
percentage of households living in a formal dwelling increased from 68 per cent in 1993 to 77 per
cent in 2011, while access rates for piped water, electricity, and flush toilets have increased from
59 per cent, 45 per cent, and 53 per cent to 72 per cent, 73 per cent, and 61 per cent, respectively
(Bhorat et al. 2014). Overall, asset poverty halved between 1993 and 2011. The profile of the poor
has evolved over time in accordance with changes in the labour market structure. Labour shortages
at the beginning of the twentieth century meant that African poverty was usually associated with
the inability to work or a lack of access to wage labour and was concentrated among the elderly or
those without access to remittance income. By the end of the twentieth century, many of the poor
were of working age but without access to social grant income.
Figure 16: Poverty rates, South Africa, 1993–2014
(%)
100
90
80
70
60
50
40
30
20
10
0
1993 1998 2003 2008 2013
Headcount ($1.90) Headcount ($3.20)
Headcount ($10.00) Poly. (Headcount ($1.90))
Poly. (Headcount ($3.20)) Poly. (Headcount ($10.00))
Source: authors’ calculations based on PovcalNet, Version March 2019 (World Bank 2019a).
In summary, South Africa entered the post-apartheid period with a socially engineered high level
of inequality and poverty established along racial lines. Today, whites are more educated, earn
more in the labour market, and are much less likely to be poor or unemployed than black Africans
(Statistics South Africa 2017; DPRU 2018). The inability to substantially shift poverty and
inequality levels is linked to a failure of the economy to generate inclusive pro-poor growth, in part
due to the generally tepid performance of the economy. Economic growth rates peaked at about
5.6 per cent in 2006 and have been lacklustre since the global financial crisis. The past five years
have seen growth falter at less than 2 per cent. Although similar to Latin America, South Africa
18has lagged far behind South-East Asia (Rodrik 2008). As growth has continued to be weak, the
economy has failed to create jobs even close to the rate needed to employ all active labour market
participants. A critical economic policy debate in South Africa revolves around the wage level,
which is often argued to be high relative to productivity. While organized labour is committed to
a ‘living or ‘decent’ wage, the economy does not appear to be sufficiently competitive or dynamic
to employ everyone searching for work at such a wage level. High unemployment rates coexist
with skills shortages, and continued capital intensification by employers and the concentration of
ownership by powerful business interests have led to the persistence of income inequality and
poverty, as the poor have been unable to benefit from the current growth path.
5 Political economy and policies shaping structural transformation, inequality, and
inclusive growth
5.1 Period I: industrialization (pre-1981)
The origin and character of inequality in South Africa can be traced back to its colonial roots,
which were further entrenched after the discovery of gold at the end of the nineteenth century.
Keeping labour costs low was a critical way in which the profit of the mines was sustained. A series
of sophisticated labour market institutions were set up between 1910 and 1930 to preserve a
‘civilized’ standard of living in order to secure the socioeconomic privilege of the white population
over other groups. This involved reserving jobs and skilled work for whites as well as a bargaining
council set-up where employers and white unions could jointly determine white minimum wages.
Thus, the ratio of earnings of white to black African workers was about 10:1 during the inter-war
period. The government also set up a white welfare state (Nattrass and Seekings 2010), including
the introduction of a state non-contributory pension and other social assistance, as well as generous
state investment in white public education.
In order to establish an black African labour base to supply the white economic centres with
labour, the apartheid government spatially segregated the country, establishing ten nominally self-
governing territories (‘homelands’) where black African people were expected to live. Africans
living in the cities were evicted and forcibly relocated to the homelands, which were rural and
marginalized from economic opportunities. Apartheid policies served to keep the black African
population landless, largely unskilled, and, while concentrated far from work opportunities,
dependent on wage labour (Nattrass and Seekings 2010). As discussed, this spatial dislocation,
through the destruction of the black African peasantry, may have uniquely contributed to the onset
of the period of industrialization in South Africa.
A key factor contributing to South Africa’s period of industrialization was the import-substituting
policies pursued by the government between 1925 to 1973, the aim of which was to stimulate
domestic manufacturing and state investment (Schneider 2000). This, as well the development of
a ‘mineral energy complex’—the extraction of raw materials coupled with state support, including
low-cost energy—was a driving factor in the growth of the manufacturing industry (Black et al.
2016). Indeed, the period was one of direct and indirect state support for industry, in the form of
cheap energy and other incentives, with the state-owned Industrial Development Corporation
(IDC) playing a central role in promoting the development of heavy industry (Black et al. 2016).
Other large state-owned corporations were run with the aim of stimulating domestic
manufacturing and providing cheap imports for the mining industry. By the 1960s, for example,
the state-run steel-producing industry (ISCOR) had prices which were substantially lower than in
the leading iron- and steel-producing countries (Norval 1962).
19The period of unprecedented economic growth and manufacturing-led industrialization initially
resulted in a period of increasing inequality, as the returns to skilled workers exacerbated the
existing wage gap between white and black African workers. However, it was also associated with
at least a partial weakening of some of South Africa’s race-based labour market policies. The
ongoing need to promote economic growth eventually led to shifts in occupational mobility and
increased wages for black workers. With industry booming, it was increasingly difficult to rely
solely on white employees (van der Berg et al. 2001). This resulted in a reclassification of jobs
which allowed for restricted movement of black South Africans into jobs which were previously
demarcated for white workers. This increase in bargaining power was mirrored in the marked
increase in unionization after black unions were legalized in 1979 (van der Berg et al. 2001). Thus,
the political landscape was inextricably linked to the movements of structural transformation and
inequality at the time.
5.2 Period II: decline (1981–93)
While the growth in the manufacturing sector in period I has been attributed to the government’s
policy of import substitution, its continued pursuit of this and other protectionist policies
contributed to its period of decline. These policies weakened the efficiency of South African
producers (Edwards 2005; Hausman 2008), and the manufacturing sector’s competitiveness vis-à-
vis foreign manufacturers was undermined. This led to a shift towards a policy of export-orientated
industrialization in what were essentially the conditions of an economic crisis. In 1983, a deliberate
process of import liberalization was instituted, and in 1989 systems of duty-free imports-for-
exports were instilled in downstream manufacturing subsectors such as textiles and clothing (Bell
and Madula 2001). Between 1990 and 1995, export subsidies were introduced and import
surcharges were removed. However, Edwards and Lawrence (2008) argue that, overall, there was
a strong shift towards protectionism in the mid- to late 1980s. Regardless, the outcome was that
the economy did not recover and growth in real GDP per capita was negative over the period.
While the economy struggled due to poor economic conditions globally, South Africa’s specific
history also exacerbated this period of poor growth and deindustrialization. This was a period of
growing opposition to the apartheid government, and South Africa became increasingly
economically isolated. Political turmoil was increasing in the form of both violent and non-violent
active resistance such as mass strikes, boycotts, and protests. This culminated in the government
declaring a state of emergency in 1986 and detaining thousands of its political opponents without
trial. In the same year, the Comprehensive Anti-Apartheid Act was passed by the US Congress,
imposing sanctions on South Africa and bolstering an ongoing disinvestment campaign.
The combination of factors external and internal to South Africa contributed to the economic
stagnation of the economy. This period of decline also saw an increase in levels of inequality.
Despite this, there was an increase in social spending for black Africans. In 1975 black African
social expenditure was 12 per cent of white levels, but this had increased to 51 per cent in 1993
(van der Berg and Bhorat 1999). Social grant allocations in particular were equalized before the
political transition in 1994 (van der Berg 2011). Similarly, in 1975 spending on black African
education per potential student was 4 per cent of white spending but by 1991 this had increased
to 19 per cent (De Villiers 1996). The racial wage gap also continued to decline, albeit slowly.
However, fiscal redistribution and the modest decrease in the racial wage gap were not able to
compensate for the socially engineered, severely unequal distribution of wage income.
20You can also read