PACIFICORP CONSERVATION POTENTIAL ASSESSMENT FOR 2021-2040 - Volume 1 February 26, 2021
←
→
Page content transcription
If your browser does not render page correctly, please read the page content below

PACIFICORP CONSERVATION POTENTIAL
ASSESSMENT FOR 2021-2040
Volume 1
F ebr uar y 26 , 20 21

             Report prepared for:
             PACIFICORP

Energy Solutions. Delivered.
This work was performed by
                      Applied Energy Group, Inc. (AEG)
                      2300 Clayton Road, Suite 1370
                      Concord, CA 94520
Project Director:     E. Morris
Project Team:         K. Marrin      D. Burdjalov
                      K. Walter      C. Arzbaecher
                      M. McBride     T. Williams
                      N. Perkins
PacifiCorp Conservation Potential Assessment for 2021-2040|Executive Summary

CONTENTS
EXECUTIVE SUMMARY ......................................................................................................................................... v
ES-1                     Note to the Reader ............................................................................................................... v
ES-2                     Stakeholder Engagement .................................................................................................... v
ES-3                     Energy Efficiency Resources ............................................................................................... v
ES-4                     Demand Response Resources ..........................................................................................viii
ES-5                     Demand-Side Rates ................................................................................................................ ix
Abbreviations and Acronyms .............................................................................................................................. x

1           INTRODUCTION ............................................................................................ 1
1.1                      Resource Assessed ................................................................................................................... 1
1.2                      Interactions Among Resources ............................................................................................... 2
1.3                      Stakeholder Engagement ....................................................................................................... 2
1.4                      Report Organization................................................................................................................. 3

2           ANALYSIS APPROACH ................................................................................... 4
2.1                      Energy Efficiency ...................................................................................................................... 4
2.2                      Demand Response ................................................................................................................ 12
2.3                      Demand-Side Rates ............................................................................................................... 18

3           DATA DEVELOPMENT ....................................................................................23
3.1                      Data Sources .......................................................................................................................... 23
3.2                      Energy Efficiency Measure Development ........................................................................... 25
3.3                      Codes and Standards............................................................................................................ 27

4           ENERGY EFFICIENCY POTENTIAL RESULTS .......................................................30
4.1                      Summary of Overall Energy Savings ..................................................................................... 30
4.2                      Residential Sector ................................................................................................................... 32
4.3                      Commercial Sector ................................................................................................................ 35
4.4                      Industrial Sector ...................................................................................................................... 39
4.5                      Irrigation Sector ...................................................................................................................... 42

5           DEMAND RESPONSE POTENTIAL .....................................................................44
5.1                      Summary Program Potential Results ..................................................................................... 44
5.2                      State-Level Program Potential and Levelized Costs ........................................................... 45
5.3                      Pacific Power Levelized Cost Scenarios............................................................................... 48

6           DEMAND-SIDE RATES POTENTIAL ...................................................................50
6.1                      Summary Potential Results ..................................................................................................... 50
6.2                      Detailed Potential Results by State and Customer Sector ................................................. 51

7           COMPARISON WITH PREVIOUS STUDY ............................................................53
7.1                      Energy Efficiency .................................................................................................................... 53
7.2                      Demand Response ................................................................................................................ 54
7.3                      Demand-Side Rates ............................................................................................................... 55

Applied Energy Group • www.appliedenergygroup.com                                                                                                                      |i
PacifiCorp Conservation Potential Assessment for 2021-2040|Executive Summary

LIST OF FIGURES
Figure 2-1   Approach for EE Measure Assessment ...................................................................................... 8
Figure 4-1   Cumulative Energy Efficiency Achievable Technical Potential by Sector .......................... 31
Figure 4-2   Residential Cumulative Achievable Technical Potential by Segment in 2040.................... 34
Figure 4-3   Residential Cumulative Achievable Technical Potential by End Use in 2040...................... 35
Figure 4-4   Commercial Cumulative Achievable Technical Potential by Segment in 2040 ................. 37
Figure 4-5   Commercial Cumulative Achievable Technical Potential by End Use in 2040 ................... 38
Figure 4-6   Industrial Cumulative Achievable Technical Potential by Segment in 2040 ....................... 40
Figure 4-7   Industrial Cumulative Achievable Technical Potential by End Use in 2040 ......................... 41

Applied Energy Group • www.appliedenergygroup.com                                                                                          | ii
PacifiCorp Conservation Potential Assessment for 2021-2040|Executive Summary

LIST OF TABLES
Table ES-1   Cumulative Energy Efficiency Achievable Technical Potential by 2040 (MWh @
             generator) ................................................................................................................................... vi
Table ES-2   Demand Response Program Potential by Season and Event Type, 2040 ...........................viii
Table ES-3   Demand-Side Rates Potential in 2040 ....................................................................................... x
Table ES-4   Abbreviations and Acronyms ..................................................................................................... x
Table 2-1    Overview of Segmentation Scheme for Energy Efficiency Potentials Modeling .................. 6
Table 2-2    Economic Components of Levelized Cost by State .............................................................. 12
Table 2-3    Demand Response Grid Services Definitions .......................................................................... 13
Table 2-4    Demand Response Products Assessed in the Study .............................................................. 16
Table 2-5    Demand Response Participant Cost Scenario Assumptions – Pacific Power Only ............. 18
Table 2-6    Analysis Segmentation .............................................................................................................. 19
Table 2-7    Demand-Side Rates Assessed .................................................................................................. 20
Table 3-1    Line Loss Percentages ............................................................................................................... 23
Table 3-2    Energy Efficiency Measures Assessed ...................................................................................... 25
Table 3-3    Energy Efficiency Measure Source Hierarchy ......................................................................... 26
Table 3-4    Residential Electric Equipment Standards............................................................................... 27
Table 3-5    Commercial Electric Equipment Standards............................................................................ 28
Table 3-6    Guidance for Building Codes ................................................................................................... 28
Table 4-1    Cumulative Energy Efficiency Potential by Sector in 2040 .................................................... 31
Table 4-2    Cumulative Energy Efficiency Potential by State in 2040 ...................................................... 32
Table 4-3    Cumulative Energy Efficiency Achievable Technical Potential Through 2030 .................... 32
Table 4-4    Residential Cumulative Energy Efficiency Potential by State in 2040................................... 33
Table 4-5    Residential Cumulative Energy Efficiency Achievable Technical Potential Through
             2030 ............................................................................................................................................. 33
Table 4-6    Residential Cumulative Energy Efficiency Potential by End Use in 2040 .............................. 35
Table 4-7    Commercial Cumulative Energy Efficiency Potential by State in 2040................................ 36
Table 4-8    Commercial Cumulative Energy Efficiency Achievable Technical Potential Through
             2030 ............................................................................................................................................. 36
Table 4-9    Commercial Cumulative Energy Efficiency Potential by End Use in 2040 ........................... 38
Table 4-10   Industrial Cumulative Energy Efficiency Potential by State in 2040 ...................................... 39
Table 4-11   Industrial Cumulative Energy Efficiency Achievable Technical Potential Through 2030.... 39
Table 4-12   Industrial Cumulative Energy Efficiency Potential by End Use in 2040 ................................. 41
Table 4-13   Irrigation Cumulative Energy Efficiency Potential by State in 2040 ...................................... 42
Table 4-14   Irrigation Cumulative Energy Efficiency Achievable Technical Potential Through 2030 .... 42
Table 5-1    Demand Response Program Potential by Season and Event Type, 2040 ........................... 44
Table 5-2    Sustained Duration Demand Response Program Potential by State, 2040 (Summer
             Peak MW) ................................................................................................................................... 45
Table 5-3    Demand Response Summer Levelized Costs ($/kW-year) .................................................... 46
Table 5-4    Sustained Duration Demand Response Program Potential State, 2040 (Winter Peak
             MW) ............................................................................................................................................. 47
Table 5-5    Demand Response Winter Levelized Costs ($/kW-year) ....................................................... 47
Table 5-6    Demand Response Summer Levelized Cost Scenarios ($/kW-year) ........................... 49

Applied Energy Group • www.appliedenergygroup.com                                                                                                                    | iii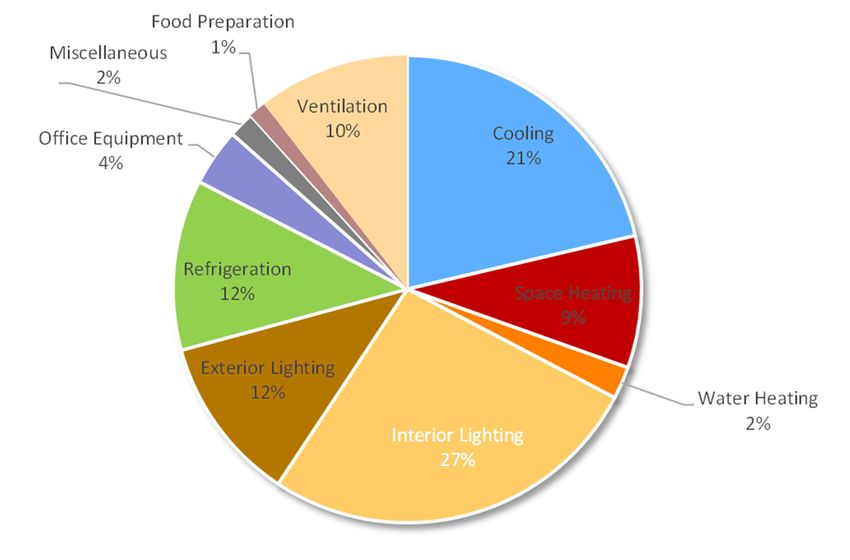
PacifiCorp Conservation Potential Assessment for 2021-2040|Executive Summary

Table 5-7   Demand Response Winter Levelized Cost Scenarios ($/kW-year) ....................................... 49
Table 6-1   Demand-Side Rates Potential in 2040 ..................................................................................... 51
Table 6-2   Demand-Side Rates Potential by Option and State in 2040 (Summer Peak MW) .............. 52
Table 6-3   Demand-Side Rates Potential by Option and State in 2040 (Winter Peak MW) ................. 52
Table 7-1   Comparison of Energy efficiency Potential with Previous Assessment ................................ 54
Table 7-2   Comparison of Demand Response Potential with Previous Assessment (Summer) ............ 55
Table 7-3   Comparison of Demand Response Potential with Previous Assessment (Winter) ............... 55
Table 7-4   Comparison of Demand-Side Rates Potential with Previous Assessment (Summer) .......... 56
Table 7-5   Comparison of Demand-Side Rates Potential with Previous Assessment (Winter) ............. 56

Applied Energy Group • www.appliedenergygroup.com                                                                                          | iv

EXECUTIVE SUMMARY
This Executive Summary presents a summary of the identified cumulative potential in 2040 from energy
efficiency, demand response, and demand-side rates across PacifiCorp’s six-state service territory. 1 This 0F
Conservation Potential Assessment (CPA) builds upon previous studies completed by AEG for PacifiCorp
in 2019, 2017, and 2015, incorporating the best information available and continuing to apply industry
standard practices to provide accurate projections of available DSM opportunities to inform PacifiCorp’s
planning efforts.
ES-1 Note to the Reader
In previous assessments of conservation potential in PacifiCorp’s service territory, demand-side resources
were categorized into numerical classes (1-3) based on their level of relative reliability and customer
choice. To increase alignment with standard industry terminology, resource types have been renamed for
the current analysis as follows:
Class 1 DSM is now referred to as “Demand Response”
Class 2 DSM is now referred to as “Energy Efficiency”
Class 3 DSM is now referred to as “Demand-Side Rates” or “DSR”
Demand-side resource types have been renamed throughout this report accordingly.
ES-2 Stakeholder Engagement
To ensure that this CPA would be transparent and informative for all interested parties, AEG and PacifiCorp
led a robust stakeholder engagement process, allowing DSM and IRP stakeholders to provide input into
the assessment work plan, recommend sources to incorporate in the analysis, and review and provide
feedback on draft results. This stakeholder engagement process included:
Sharing the CPA Work Plan for review and comment
Presenting at four public CPA workshops and one IRP public input meeting
Soliciting and incorporating input on key CPA assumptions and draft results
Posting draft and final materials to PacifiCorp’s IRP website
Providing responses to stakeholder feedback forms
The remainder of this section presents summary results for each type of demand-side resource analyzed
in the CPA, followed by detailed chapters on methodology, data sources, and analysis results. 2 1F
ES-3 Energy Efficiency Resources
Table ES-1 summarizes the 2040 cumulative technical and achievable technical potential for energy
efficiency resources sector, both in megawatt-hours (MWh) and as a percentage of projected 2040
baseline sector loads. At the system level, the identified achievable technical potential by 2040 is over ten
terawatt-hours, or approximately 20 percent of projected baseline loads. Achievable technical potential
represents savings opportunities which can reasonably be achieved, regardless of how conservation is
1
Energy efficiency analysis for Oregon is excluded from this report because it is assessed statewide by the Energy Trust of Oregon
2
The previous CPA reports can be found at: http://www.pacificorp.com/es/dsm.html
Applied Energy Group • www.appliedenergygroup.com |vPacifiCorp Conservation Potential Assessment for 2021-2040|Executive Summary
acquired (including both utility and non-utility interventions) and ignoring cost-effectiveness
considerations. The cost-effectiveness of the identified potential is assessed within PacifiCorp’s IRP model
through direct comparison with supply-side resource alternatives.
The commercial sector accounts for the largest portion of the achievable technical potential, followed by
residential then industrial. Irrigation, with much smaller baseline loads, contribute a smaller amount of
potential relative to the larger sectors. Although previous CPAs have included potential in the street
lighting sector, the current CPA excluded this sector, as PacifiCorp’s load forecast assumes that all
streetlights will be converted to LEDs by the end of the 20-year study period.
Table ES-1 Cumulative Energy Efficiency Achievable Technical Potential by 2040 (MWh @ generator)
All States
Technical Achievable % of
Sector California Idaho Utah Washington Wyoming
Potential Baseline
Residential 83,753 213,121 2,607,996 437,213 276,214 3,618,297 20.1%
Commercial 59,223 183,486 3,460,144 456,636 476,057 4,635,547 26.8%
Industrial 7,961 55,630 1,219,204 177,729 912,234 2,372,759 13.8%
Irrigation 19,029 82,127 30,191 35,892 4,041 171,279 13.8%
Total 169,966 534,365 7,317,535 1,107,470 1,668,547 10,797,882 20.1%
Key energy efficiency findings by market sector are described below:
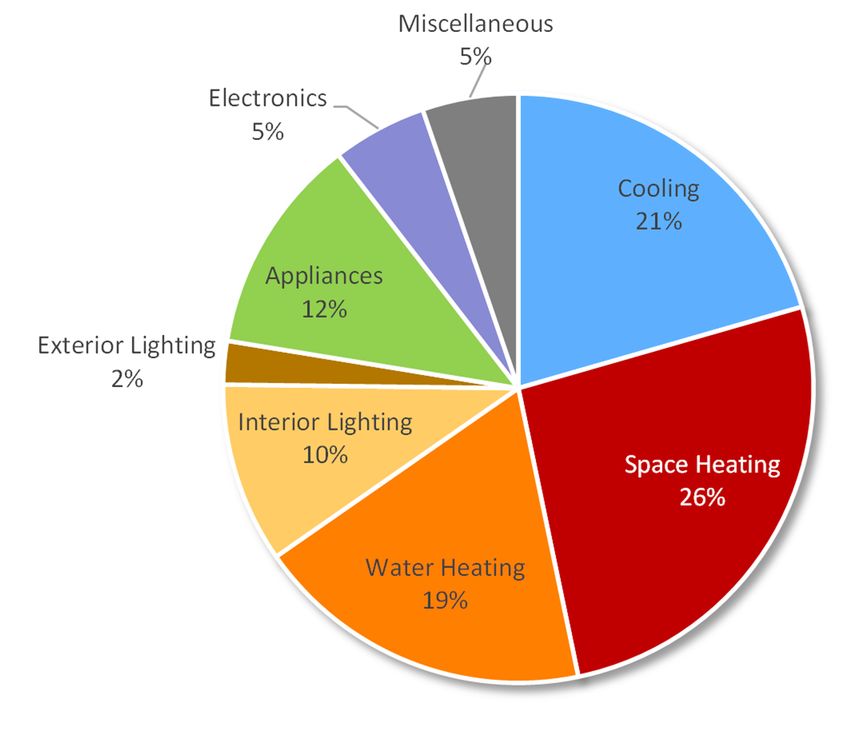
ES-3.1 Energy Efficiency Residential Sector Key Findings
The 20-year residential achievable technical potential is 3.6 million MWh or 20.1% of the 2040 baseline.
Key residential findings include:
By 2040, Utah is projected to represent over 70% of both the residential sales and energy efficiency
potential across the five states
Nearly half of the achievable technical potential (46%) comes from HVAC systems through the
application of equipment upgrades and building shell measures.
o The space heating end use provides the largest share of potential, at 26% of total residential
achievable technical potential, particularly driven by Washington, Idaho, and California where
electric resistance heating is common.
o The cooling end use comprises 20% of total residential achievable technical potential, driven by
large air-conditioning loads in Utah.
Water heating savings comprise 18% of the total achievable technical potential through the installation
of efficient heat pump water heater systems and upgrades to water-consuming equipment (low flow
showerheads, clothes washers, etc.)
The lighting end uses accounts for 12% of the residential achievable technical potential, primarily due
to LED lamps, which are modeled with lumen-per-Watt performance substantially increasing over the
lifetime of the study.
The appliances, electronics, and miscellaneous end uses represent the remaining 24% of the potential.
Applied Energy Group • www.appliedenergygroup.com | viPacifiCorp Conservation Potential Assessment for 2021-2040|Executive Summary
ES-3.2 Energy Efficiency Commercial Sector Key Findings
The 20-year commercial achievable technical potential is 4.6 million MWh or 26.8% of the 2040 baseline.
Savings as a percent of baseline are very consistent across states. Key commercial findings and
observations include:
Lighting opportunities represent roughly 38% of the identified commercial achievable technical
potential, largely attributable to LED lighting. Based on the best projections available at the time of
the analysis, these lamps are expected to become significantly more available and efficient over the
study time period and be widely applicable for linear fluorescent, high bay, and screw-in applications.
There is significant achievable technical potential from HVAC systems through the application of
equipment upgrades and building shell measures within the cooling, heating, and ventilation end uses
(41% of the potential). The largest of these three is cooling, driven by large air conditioning loads in
Utah.
Refrigeration makes up 12% of the total commercial potential, primarily from grocery stores
throughout the region and the controlled atmosphere segment in Washington.
The water heating, food preparation, office equipment, and miscellaneous end uses make up the
remaining 9% of potential.
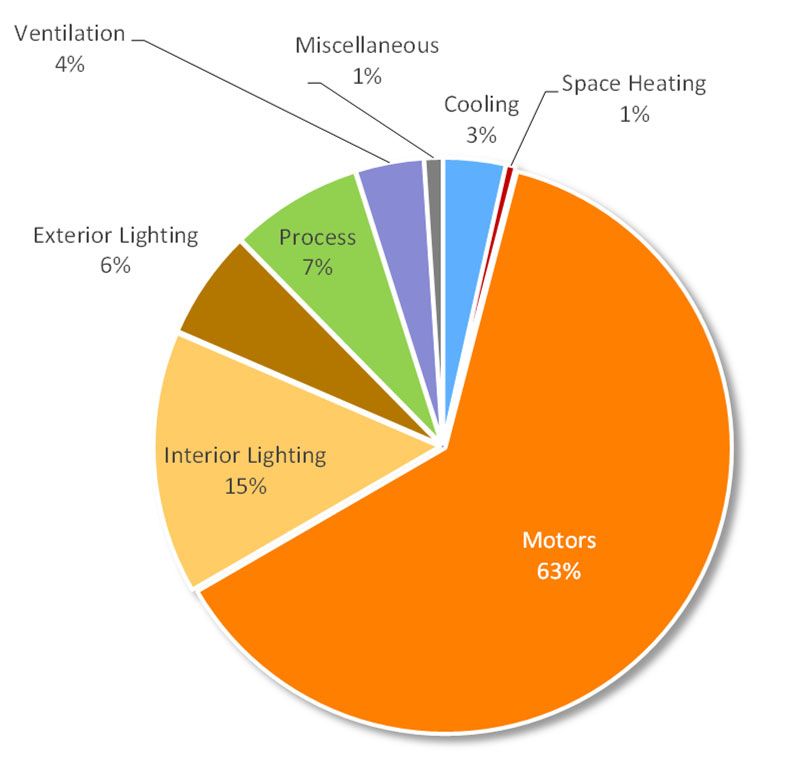
ES-3.3 Energy Efficiency Industrial Sector Key Findings
The 20-year industrial achievable technical potential is 2.4 million MWh or 14% of the 2040 baseline.
Savings as a percent of baseline are relatively consistent across states. Key industrial findings and
observations include:
Motor and process loads represent the largest share of end use consumption in the industrial sector
(68% of savings) and, correspondingly, have the largest identified achievable technical potential.
Motor savings comprise 63% of the total sector potential, while process savings account for an
additional 8%. 3 Potential savings for motor equipment change-outs have been essentially eliminated
2F
by the National Electrical Manufacturer’s Association (NEMA) standards, which now make premium
efficiency motors the baseline efficiency level for many motors. As a result, the savings opportunities
in this end use come from controls, system optimization, and variable frequency drives, which improve
system efficiencies where motors are utilized.
Like the residential and commercial sectors, the projected improvements in performance and
applicability of LED lighting technologies provides a large potential opportunity in the industrial
sector, leading to lighting representing 21% of the identified achievable technical potential.
Potential for the heating, cooling, ventilation, and miscellaneous end uses, represent the remaining
9% of potential, mainly realized within the non-industrial portions of the space (e.g. warehouse and
office spaces).
ES-3.4 Energy Efficiency Irrigation Sector Key Findings
The 20-year irrigation achievable technical potential is 0.2 million MWh or 14% of the 2040 baseline. Key
irrigation findings and observations include:
3
It is often difficult to distinguish between motors used for industrial process and non-process purposes, so in many ways, these two end-
use categories can be viewed as a group.
Applied Energy Group • www.appliedenergygroup.com | viiPacifiCorp Conservation Potential Assessment for 2021-2040|Executive Summary
Roughly half of the irrigation potential is in Idaho, driven by the size of baseline loads relative to other
states.
Similar to the industrial sector, potential savings for motor equipment change-outs have been
essentially eliminated by the National Electrical Manufacturer’s Association (NEMA) standards, which
now make premium efficiency motors the baseline efficiency level. As a result, the savings
opportunities for irrigation pumps come from discretionary, or non-equipment measures, such as
controls, pressure regulation, and variable speed drives, which improve system efficiencies where
motors are utilized.
Energy consumption varies by state, based on the presence of surface water, type of crop, and the
size of the irrigation market sector. In Pacific Power service territories, surface water and specialty
crops are more prevalent, leading to smaller pump sizes. In Rocky Mountain Power territories, larger
row crop fields and deeper water reservoirs require larger pumps.
ES-4 Demand Response Resources
This section presents high-level potential analysis results for demand response resources using the
methodology outlined in Chapter 2 of this report. As discussed in that chapter, the demand response
analysis builds off of the energy efficiency assessment, assuming that PacifiCorp would first pursue energy
efficiency resources, and that these programs may create new opportunities for demand response (e.g.,
connected thermostats). To avoid double-counting potential within the demand response analysis, results
account for competition between program options. For example, a customer with a central air conditioner
cannot participate in both a DLC program and a smart thermostat program, as both programs curtail the
same piece of equipment. Additionally, in cases where PacifiCorp has existing demand response programs,
results are addition to, not inclusive of, impacts from existing programs. 4 3F
Table ES-2 presents summary program potential in 2040 by season and event type. Whereas previous
PacifiCorp CPAs have only considered demand response’s ability to shave system peaks over multiple
hours (sustained duration events), the current CPA also assessed the potential for short-duration events
to provide additional insight into how demand response may be used to provide a variety of grid services
to bring additional value to PacifiCorp’s system. As shown, the impacts for short duration events tend to
be higher than for sustained duration because equipment can be completely curtailed for a short period
of time, rather than cycled over a longer period. Key observations from the demand-side rates analysis
are:
The study identified limited opportunity to expand PacifiCorp’s existing summer demand response
programs.
Battery Energy Storage DLC represents a large, emerging demand response opportunity.
The emergence of Grid-Interactive Water Heaters presents a large new opportunity for utility demand
response, particularly as a means of reducing winter peaks.
Third Party Contracts continue to represent a significant opportunity to reduce non-residential
customer demand during system peak periods.
Table ES-2 Demand Response Program Potential by Season and Event Type, 2040
4
PacifiCorp’s current demand response programs target air conditioning and irrigation loads that are only available in the summer. As
such, the winter potential represents both the incremental and total identified potential.
Applied Energy Group • www.appliedenergygroup.com | viiiPacifiCorp Conservation Potential Assessment for 2021-2040|Executive Summary
Summer MW Winter MW
Sustained
Program Short Duration Short Duration Sustained Duration
Duration
HVAC Direct Load Control (DLC) 117 60 198 132
Domestic Hot Water Heater (DHW) DLC 5 4 12 10
Grid‐Interactive Water Heaters 57 46 158 133
Connected Thermostat DLC 148 80 57 32
Smart Appliance DLC 27 15 10 6
Pool Pump DLC 1 1 1 1
Electric Vehicle Connected Charger DLC 51 51 52 52
Battery Energy Storage DLC 676 417 676 417
Third Party Contracts 198 208 157 173
Irrigation Load Control 21 21 0 0
Total All Sectors 1,300 904 1,322 957
ES-5 Demand-Side Rates
This section presents potential analysis results for demand-side rates using the methodology outlined in
Chapter 2 of this report. Because the results of this analysis are not being used to inform resource
planning, options are assessed independently of one another to illustrate the relative magnitude of each
option if offered in isolation. That is, the analysis does not consider interactive effects between competing
options, such as a time-of-use with or without a critical peak pricing component. Because of this, impacts
should not be totaled across options, as this would overstate the total possible demand reduction from
demand-side rates.
Table ES-3 presents the potential from demand-side rate options in 2040 during summer and winter peak
periods. This potential captures any expansion opportunities for existing pricing options and new options
that have incremental potential in future years. Key observations from the demand-side rates analysis are:
In Idaho, roughly half of the savings opportunities from pricing options are in the irrigation sector.
In Utah, residential CPP has the highest potential. The three C&I pricing options combined have
roughly equal potential to residential CPP.
Oregon has the second highest potential, after Utah. Residential pricing (TOU, TOU Demand Rate
w/EV, and CPP) constitute more than half of the potential in Oregon.
Wyoming ranks third in terms of potential contribution from pricing options. Most of the potential is
derived from C&I customers, particularly large sized industrial customers.
In Washington and California, the residential sector constitutes nearly half the total savings potential
from pricing options.
Similar trend continues in the winter peak season, with Utah and Oregon contributing the most
potential due to the residential rate programs and C&I CPP.
Applied Energy Group • www.appliedenergygroup.com | ixPacifiCorp Conservation Potential Assessment for 2021-2040|Executive Summary Table ES-3 Demand-Side Rates Potential in 2040 Rate Option Summer Potential (MW) Winter Potential (MW) Residential TOU 77.4 40.7 Residential TOU with EV 17.1 7.0 Residential CPP 105.7 68.2 Residential Behavioral DR 18.5 9.3 C&I TOU 0.3 0.2 C&I CPP 91.0 39.5 C&I RTP 16.2 6.9 Irrigation TOU 4.3 ‐ Irrigation CPP 17.4 ‐ Abbreviations and Acronyms Table ES-4 provides a list of key abbreviation or acronyms used throughout the remainder of the report. Table ES-4 Abbreviations and Acronyms Acronym Explanation ACEEE American Council for an Energy‐Efficient Economy ACS American Community Survey AEO Annual Energy Outlook AMI Advanced Metering Infrastructure C&I Commercial and Industrial CEE Consortium for Energy Efficiency COMMEND EPRI’s “Commercial End‐Use” model CPP Critical Peak Pricing CPUC California Public Utilities Commission Council Northwest Power and Conservation Council (NWPCC) CBSA Commercial Building Stock Assessment CPA Conservation Potential Assessment CPP Critical Peak Pricing DEER California’s Database for Energy Efficient Resources DSM Demand‐Side Management DSR Demand‐Side Rates DLC Direct Load Control E3T Energy Efficient Emerging Technologies Database EIA Energy Information Administration Applied Energy Group • www.appliedenergygroup.com |x
PacifiCorp Conservation Potential Assessment for 2021-2040|Executive Summary

 Acronym                  Explanation

 EISA                     Energy Independence and Security Act of 2007
 EPA                      Environmental Protection Agency

 EUL                      Effective Useful Life
 EUI                      Energy Utilization Index

 HPWH                     Heat Pump Water Heater
 HVAC                     Heating, Ventilation, and Air Conditioning

 IECC                     International Energy Conservation Code
 IFSA                     Industrial Facilities Site Assessment

 IRP                      Integrated Resource Plan
 LED                      Light‐emitting diode

 NAPEE                    National Action Plan for Energy‐Efficiency
 NEEA                     Northwest Energy Efficiency Alliance

 NEEP                     Northeast Energy Efficiency Partnerships
 NEMA                     National Electrical Manufacturer’s Association

 O&M                      Operations and Maintenance
 RBSA                     Residential Building Stock Assessment

 REEPS                    EPRI’s Residential End‐Use Energy Policy System
 RTP                      Real‐Time Pricing

 RTF                      Regional Technical Forum
 SEEM                     Simple Energy Enthalpy Model

 SIC                      Standard Industrial Classification
 TRC                      Total Resource Cost

 TOU                      Time‐of‐Use
 UCT                      Utility Cost Test, also known as the Program Administrator Cost Test (PACT)

 UEC                      Unit Energy Consumption
 UES                      Unit Energy Savings

 WSEC                     Washington State Energy Code

Applied Energy Group • www.appliedenergygroup.com                                                       | xi
1
INTRODUCTION
In 2019, PacifiCorp commissioned Applied Energy Group (AEG) to conduct this Conservation Potential
Assessment (CPA) to inform its biennial Integrated Resource Plan (IRP) planning process, to satisfy other
state-specific DSM planning requirements, and to assist PacifiCorp in reviewing designs of existing
demand-side management (DSM) programs and in developing new programs. The study’s scope
encompasses multi-sector assessments of long-term potential for DSM resources in PacifiCorp’s Pacific
Power (California, Oregon, and Washington) and Rocky Mountain Power (Idaho, Utah, and Wyoming)
service territories. 5 This study includes supply curves for the 20-year planning horizon (2021–2040) to
4F
inform the development of PacifiCorp’s 2021 IRP and assist in satisfying state-specific requirements
associated with planning for and pursuing DSM resource acquisition.
Since 1989, PacifiCorp has developed biennial Integrated Resource Plans (IRPs) to identify an optimal mix
of resources that balance considerations of cost, risk, uncertainty, supply reliability/deliverability, and long-
term public policy goals. The IRP’s optimization process accounts for capital, energy, and ongoing
operation costs as well as the risk profiles of various resources, including; traditional generation, market
purchases, renewable generation, and DSM resources such as energy efficiency and demand response.
Since the 2008 IRP, DSM resources have competed directly against supply-side options, allowing the IRP
model to select the right mix of resources to meet the needs of PacifiCorp’s customers while minimizing
cost and risk. Thus, this study does not assess the cost-effectiveness of DSM resources.
This study provides reliable estimates of the magnitude, timing, and costs of DSM resources that are likely
available to PacifiCorp over a 20-year planning horizon. The study focuses on resources assumed
achievable during the planning horizon, recognizing that known market dynamics may hinder resource
acquisition. Study results will be incorporated into PacifiCorp’s 2021 IRP and subsequent DSM planning
and program development efforts. This study serves as an update to similar studies completed previously
for the IRP. 6 5F
1.1 Resource Assessed
As in previous assessments, the current CPA analyzed the potential of three distinct types of customer-
sited resources:
Energy Efficiency: Resources from non-dispatchable, firm energy and capacity product
offerings/programs: Energy Efficiency programs are energy and related capacity savings which are
achieved through facilitation of technological advancements in equipment, appliances, structures, or
repeatable and predictable voluntary actions on a customer’s part to manage the energy use at their
business or home. These programs generally provide financial incentives or services to customers to
improve the efficiency of existing or new residential or commercial buildings through: (1) the
installation of more efficient equipment, such as lighting, motors, air conditioners, or appliances; (2)
increasing building efficiency, such as improved insulation levels or windows; or (3) behavioral
modifications, such as strategic energy management efforts at business or home energy reports for
5
Energy efficiency analysis for Oregon is excluded from this report because it is assessed statewide by the Energy Trust of Oregon
6
The previous CPA reports can be found at: http://www.pacificorp.com/es/dsm.html
Applied Energy Group • www.appliedenergygroup.com |1PacifiCorp Conservation Potential Assessment for 2021-2040| Introduction
residential customers. The savings are considered firm over the life of the improvement or customer
action.
Demand Response: Resources from fully dispatchable or scheduled firm capacity product
offerings/programs: Demand Response programs are those for which capacity savings occur as a
result of active company control or advanced scheduling. Once customers agree to participate in these
programs, the timing and persistence of the load reduction is involuntary on their part within the
agreed upon limits and parameters of the program. Program examples include residential and small
commercial central air conditioner load control programs that are dispatchable, and irrigation load
management and interruptible or curtailment programs (which may be dispatchable or scheduled
firm, depending on the particular program design or event noticing requirements). Savings are
typically only sustained for the duration of the event and there may also be return energy associated
with the program.
Demand-Side Rates: Resources from price-responsive energy and capacity product
offerings/programs: Price response and load shifting programs seek to achieve short-duration (hour
by hour) energy and capacity savings from actions taken by customers voluntarily, based on a financial
incentive or signal. As a result of their voluntary nature, participation tends to be low and savings are
less predictable, making these resources less suitable to incorporate into resource planning, at least
until their size and customer behavior profile provide sufficient information needed to model and plan
for a reliable and predictable impact. The impacts of these resources may not be explicitly considered
in the resource planning process; however, they are captured naturally in long-term load growth
patterns and forecasts. Program examples include time-of-use pricing plans, critical peak pricing
plans, and inverted block tariff designs. Savings are typically only sustained for the duration of the
incentive offering and, in many cases, loads tend to be shifted rather than being avoided.
This study excludes an assessment of Oregon’s energy efficiency potential, as this potential has been
captured in assessment work conducted by the Energy Trust of Oregon. Unless otherwise noted, all results
presented in this report represent savings at generation; that is, savings at the customer meter have been
grossed up to account for line losses using values consistent with other PacifiCorp DSM planning projects.
1.2 Interactions Among Resources
This assessment includes multiple resources, actions, and interventions that would interact with each other
if implemented in parallel. As explained in more detail later in this report, AEG takes specific actions to
account for these interactions to avoid double-counting the available potential. The interactive effects
analyzed occur within the major analysis sections; meaning that the interactions of energy efficiency
resources are considered across all energy efficiency resources. Likewise, the analysis of demand response
resources explicitly considers interactions.
Previous CPAs have not attempted to account for interaction between resource types due to uncertainties
regarding resources likely to be found economic and pursued. As an enhancement for the current CPA,
the technology adoption forecast from the energy efficiency analysis now informs the demand response
analysis, allowing opportunities for demand response to expand as DR-ready technologies (e.g.,
connected thermostats) are assumed to be adopted.
1.3 Stakeholder Engagement
To ensure that this CPA would be transparent and informative for all interested parties, AEG and PacifiCorp
led a robust stakeholder engagement process, allowing DSM and IRP stakeholders to provide input into
Applied Energy Group • www.appliedenergygroup.com |2PacifiCorp Conservation Potential Assessment for 2021-2040| Introduction the assessment work plan, recommend sources to incorporate in the analysis, and review and provide feedback on draft results. This stakeholder engagement process included: Sharing the CPA Work Plan for review and comment Presenting at four public CPA workshops and one IRP public input meeting Soliciting and incorporating input on key CPA assumptions and draft results Posting draft and final materials to PacifiCorp’s IRP website Providing timely responses to stakeholder feedback forms 1.4 Report Organization This report is presented in two volumes as outlined below. This document is Volume 1, presenting an overview of study methodology, data sources, and results. Volume 2 contains the study appendices, including detailed analysis inputs and outputs. Applied Energy Group • www.appliedenergygroup.com |3
2
ANALYSIS APPROACH
This chapter describes AEG’s approach for assessing potential within each of the three resource categories.

2.1 Energy Efficiency
Energy efficiency resources reduce the energy required to power end-use technologies while continuing
to provide the same level of service to the customer. In this chapter, we discuss the approach used to
estimate the energy efficiency resource potential. This approach is largely similar to the energy efficiency
analysis in the previous CPA; however, all assumptions have been updated using the most recent and
applicable sources available. New areas of analysis in this CPA include an analysis of historical incentive
levels by state and an assessment of current program participation to inform ramp rate starting points.

2.1.1        Overview of Analysis Steps
To perform the energy efficiency analysis, AEG used a rigorous data-driven approach that follows the
major steps listed below.
1.      Perform a market characterization to describe sector-level electricity use for the residential,
        commercial, industrial, and irrigation sectors 7 for the base year, 2018, 8 in five states within PacifiCorp’s
                                                                 6F                              7F

        service territory: California, Washington, Idaho, Utah, and Wyoming. Oregon is not covered in this
        analysis since the Energy Trust of Oregon handles the planning and implementation of all energy
        efficiency within PacifiCorp’s Oregon service territory. 9 To perform the market characterization, AEG
                                                                              8F

        used results from primary market research conducted by PacifiCorp wherever possible, supplemented
        by other secondary data sources available from regional and national organizations such as the
        Northwest Energy Efficiency Alliance (NEEA) and the Energy Information Administration (EIA).
2.      Develop a baseline projection of energy consumption by state, sector, segment, and end use for 2021
        through 2040, building upon the base-year characterization performed in Step 1 above.
3.      Define and characterize energy efficiency measures to be applied to all sectors, segments, and end
        uses.
4.      Estimate the potential from the efficiency measures. While this analysis ultimately develops estimates
        of the annual potential for each year in the 20-year planning horizon for use in PacifiCorp’s Integrated
        Resource Plan (IRP), results presented in this volume focus on cumulative impacts at the end of the
        planning horizon, 2040.
5.      Compare the results of the present study with those from the previous 10 to identify important trends
                                                                                                      9F

        and changes.
We describe these analysis steps in more detail throughout the remainder of this chapter.

7
 Previous CPAs have included an assessment of potential in the street lighting sector. However, because PacifiCorp’s load forecast now
assumes that all street lights will be converted to LEDs during the planning period, this sector was excluded from the current CPA analysis.
8
  2018 was selected as the base year for analysis, as it was the most recent calendar year with complete account data available at this step
in the process.
9
  In 2018, PacifiCorp worked with the Energy Trust of Oregon and Public Utility Commission of Oregon Staff to compare and identify
differences in study methodologies. As such, AEG will not be comparing Energy efficiency results for CA, ID, UT, WA, and WY with OR as
part of this report.
10
     All five volumes of the 2019 study are available on the PacifiCorp website, http://www.pacificorp.com/es/dsm.html

Applied Energy Group • www.appliedenergygroup.com                                                                                    |4
PacifiCorp Conservation Potential Assessment for 2021-2040| Analysis Approach
2.1.1.1 Definition of Potential
To assess the various levels of resource potential available in PacifiCorp’s service territory, AEG investigated
the following cases:
Technical Potential – This case is defined as the theoretical upper limit of energy efficiency potential.
It assumes that customers adopt all feasible measures regardless of their cost or customer preferences.
At the time of existing equipment failure, customers replace their equipment with the most efficient
option available relative to applicable standards. In new construction, customers and developers also
choose the most efficient equipment option relative to applicable codes and standards. These are
generally considered lost opportunity measures. Non-equipment, or discretionary, measures which
may be realistically installed apart from equipment replacements are implemented according to ramp
rates developed by the Northwest Power and Conservation Council (The Council) for its 2021 Power
Plan, applied to 100% of the applicable market. This case is a theoretical construct and is provided
primarily for planning and informational purposes.
Achievable Technical Potential - This case refines technical potential by applying customer
participation rates that account for market barriers, customer awareness and attitudes, program
maturity, and other factors that may affect market penetration of DSM measures. For the current CPA,
AEG used achievability assumptions from The Council’s Draft 2021 Power Plan as the customer
adoption rates, which typically assume that 85% of the technical potential could be acquired over ra
20-year period. This achievability factor represents potential which can reasonably be acquired by all
mechanisms available, including utility programs, codes and standards, and market transformation.
Thus, the market applicability assumptions utilized in this study include savings outside of utility
programs. 1110F
2.1.1.2 AEG’s LoadMAP Model
AEG performed the energy efficiency potential analysis using its Load Management Analysis and Planning
tool (LoadMAPTM) to develop both the baseline projection and the estimates of potential. AEG developed
LoadMAP in 2007 and has enhanced it over time, using it for more than 80 utility-specific forecasting and
potential studies. Built-in Microsoft Excel, the LoadMAP framework has the following key features.
Embodies the basic principles of rigorous end-use models (such as EPRI’s REEPS and COMMEND) but
in a simplified and more accessible form.
Includes stock-accounting algorithms that treat older, less efficient appliance/equipment stock
separately from newer, more efficient equipment. Equipment is replaced according to the measure life
and appliance vintage distributions.
Balances the competing needs of simplicity and robustness by incorporating important modeling
details related to equipment saturations, efficiencies, vintage, and the like, where market data are
available, and treats end uses separately to account for varying importance and availability of data
resources.
Isolates new construction from existing equipment and buildings and treats purchase decisions for
new construction and existing buildings separately.
Uses a simple logic for appliance and equipment decisions, rather than complex decision choice
algorithms or diffusion assumptions which tend to be difficult to estimate or observe and sometimes
produce anomalous results that require calibration or manual adjustment.
11
Northwest Power and Conservation Council’s Seventh Power Plan applicability assumptions reference an “Achievable Savings” report
published August 1, 2007. http://www.nwcouncil.org/reports/2007/2007-13/
Applied Energy Group • www.appliedenergygroup.com |5PacifiCorp Conservation Potential Assessment for 2021-2040| Analysis Approach
Includes appliance and equipment models customized by end use. For example, the logic for lighting
is distinct from refrigerators and freezers.
Accommodates various levels of segmentation. Analysis can be performed at the sector-level (e.g.,
total residential) or for customized segments within sectors (e.g., housing type or income level).
Consistent with the segmentation scheme and the market profiles described below, the LoadMAP model
provides forecasts of baseline energy use by sector, segment, end use, and technology for existing and
new buildings. It also provides forecasts of total energy use and energy-efficiency savings associated with
the various levels of potential.
2.1.2 Market Characterization
In order to estimate the savings potential from energy-efficient measures, it is necessary to understand
the equipment that is currently being used and its associated energy consumption. This characterization
begins with a segmentation of PacifiCorp’s electricity footprint to quantify base-year energy use by state,
sector, segment, end-use application, and the current set of technologies used.
2.1.2.1 Customer Segmentation
The market characterization first defined the market segments (building types, end uses, and other
dimensions) that are relevant to PacifiCorp’s service territory. The segmentation scheme for the current
CPA is presented in Table 2-1 and is the same as in the previous CPA, with the exception of the removal
of the street lighting segment, as noted above.
Table 2-1 Overview of Segmentation Scheme for Energy Efficiency Potentials Modeling 12 11F
Segmentation
Dimension Description
Variable
Pacific Power: California and Washington
1 State
Rocky Mountain Power: Idaho, Utah, Wyoming
2 Sector Residential, commercial, industrial, and irrigation
Residential: single family, multifamily, manufactured home
Market Commercial: by building type
3
Segment Industrial: by industry type
Irrigation: by pump horsepower
4 Vintage Existing and new construction
5 End uses Cooling, space heating, lighting, water heating, motors, etc. (as appropriate by sector)
Appliances/end
Technologies such as lamp and fixture type, air conditioning equipment type, motors
6 uses and
by application, etc.
technologies
Equipment
7 efficiency for Baseline and higher‐efficiency options as appropriate for each technology
new purchases
2.1.2.2 Market Profiles
Market profiles define base-year energy use for each sector, market segment, end use, and technology
using the following elements:
12
For complete listings of the segmentation categories, please see Energy Market Profiles and Baseline Projections in Appendix A in Volume
2 of this report.
Applied Energy Group • www.appliedenergygroup.com |6PacifiCorp Conservation Potential Assessment for 2021-2040| Analysis Approach
Market size is a representation of the number of customers in the segment. For the residential sector,
this is the number of households. In the commercial sector, it is the floor space, measured in square
feet. For the industrial sector, it is the number of employees. For irrigation, it is the number of service
points. Note that while market size is derived from customer counts provided by PacifiCorp, the units
listed above are used to normalize consumption across customers of varying size within a market
segment.
Saturations define the fraction of the market where various technologies are installed. (e.g., percent
of homes with electric space heating). In the case of end uses such as appliances and electronics,
saturations of greater than 100% indicate that more than one of a given technology is present in an
average home.
UEC (unit energy consumption) or EUI (energy utilization index) describes the average energy
consumed in 2018 by a specific technology within buildings where that technology is present. UECs
are expressed in kWh/household for the residential sector, and EUIs are expressed in kWh/square foot
or kWh/employee for the commercial and industrial sectors, respectively.
Intensity for the residential sector represents the average energy use for the technology across all
homes in 2018 and is computed as the product of the saturation and the UEC. For the commercial and
industrial sectors, intensity, computed as the product of the saturation and the EUI, represents the
average use for the technology per square foot or per employees in 2018. The sum of all energy
intensities in a specific market segment will yield the total consumption per market unit (e.g., total
kWh per household).
Usage is the total annual energy use by an end-use technology within a given segment. It is the
product of the market size and intensity and is quantified in gigawatt-hours (GWh). As mentioned
above, this usage is calibrated to actual sales in the base year.
The market profiles are presented in Appendix A in Volume 2 of this report.
2.1.3 Baseline Projection
The next step in the analysis is to develop the baseline projection of annual electricity use for 2021 through
2040 by state, sector, customer segment, end use and technology. To avoid understating the remaining
energy efficiency potential, this projection excludes the impacts of future market intervention through
utility DSM programs or other efforts. The end-use projection includes the impacts of building codes and
equipment efficiency standards that were enacted as of April 2020, even if they would not go into effect
until a future date. The study does not, however, attempt to speculate on future changes to codes and
standards beyond those which already have a known effective date. For a list of equipment efficiency
standards included in residential and commercial baseline projections, see Table 3-4 and Table 3-5.
The baseline projection is not only the foundation for the analysis of savings from future energy efficiency
efforts, but also the metric against which potential savings are measured, as presenting the potential as a
percentage of the baseline projection allows for simpler comparison across assessments than comparing
absolute energy savings. AEG’s baseline projection uses many of the same input assumptions and aligns
very closely with PacifiCorp’s official load forecast. However, the baseline projection for the potential model
was developed as an independent projection to ensure that baseline assumptions were consistent with
Applied Energy Group • www.appliedenergygroup.com |7PacifiCorp Conservation Potential Assessment for 2021-2040| Analysis Approach
those used to assess energy efficiency measure savings and applicability. Detailed baseline-projection
results are provided in Appendix A in Volume 2 of this report.
2.1.4 Energy Efficiency Measure Analysis
This section describes the framework used to assess the savings, costs, and other attributes of energy
efficiency measures. These characteristics form the basis for determining measure-level savings and
levelized costs as well as the subsequent build up to sector- and state-level savings and levelized costs.
For all measures, AEG assembled information to reflect equipment performance, incremental costs, and
equipment lifetimes. Figure 2-1 outlines the framework for measure analysis.
Figure 2-1 Approach for EE Measure Assessment
Inputs Process
AEG universal
measure list
PacifiCorp and
Stakeholder
PacifiCorp Measure Feedback
Measure
Data Library
(TRL, evaluation reports, etc.)
descriptions
AEG Database of Energy Measure characterization
Efficiency Measures
(DEEM) Energy savings Costs and NEIs
Saturation and
Building Simulations Lifetime
applicability
The framework for assessing savings, costs, and other attributes of energy efficiency measures involves
identifying the list of energy efficiency measures to include in the analysis, determining their applicability
to each market sector and segment, fully characterizing each measure, and preparing for integration with
the greater potential modeling process.
AEG compiled a robust list of energy efficiency measures for each customer sector, drawing upon
PacifiCorp’s program experience, The Council’s Draft 2021 Power Plan, the Regional Technical Forum (RTF),
California Database for Energy Efficient Resources (DEER), AEG’s own measure databases and building
simulation models, other secondary sources, and a comprehensive screen of emerging technologies within
the region and country. This universal list of energy efficiency measures covers all major types of end-use
equipment, as well as devices and actions which reduce energy consumption when installed or
implemented.
The selected measures are categorized into two types according to the LoadMAP taxonomy: equipment
measures and non-equipment measures.
Equipment measures are efficient energy-consuming pieces of equipment that save energy by
providing the same service with a lower energy requirement than a standard unit. An example is an
ENERGY STAR® refrigerator that replaces a standard efficiency refrigerator. For equipment measures,
many efficiency levels may be available for a given technology, ranging from the baseline unit (often
determined by code or standard) up to the most efficient product commercially available. For instance,
Applied Energy Group • www.appliedenergygroup.com |8PacifiCorp Conservation Potential Assessment for 2021-2040| Analysis Approach
in the case of central air conditioners, this list begins with the current federal standard SEER 13 unit
and spans a broad spectrum up to a maximum efficiency of a SEER 24 unit. These measures are applied
on a stock-turnover basis, and in general, are referred to as lost opportunity measures because once
a purchasing decision is made, there will not be another opportunity to improve the efficiency of that
equipment item until the lifetime expires again.
Non-equipment measures save energy by reducing the need for delivered energy, but do not involve
replacement or purchase of major end-use equipment on a stock-turnover schedule (such as a
refrigerator or air conditioner). For this reason, these measures are generally termed “discretionary”
or “retrofit” measures. An example is a connected thermostat, which can be configured to run space
heating and cooling systems only when people are home, and which can be installed at any time, not
only when end-use equipment is being replaced. Non-equipment measures can apply to more than
one end use. For instance, adding wall insulation will reduce the energy use of both space heating
and cooling systems. Non-equipment measures typically fall into one of the following categories:
o Building shell (windows, insulation, roofing material)
o Equipment controls (thermostats, integrated lighting fixture controls)
o Equipment maintenance (heat pump commissioning, setpoint adjustments)
o Displacement measures (destratification fan to reduce use of HVAC systems)
o Commissioning, retrocommissioning, and energy management
o Residential behavioral programs. Impacts of PacifiCorp’s existing Home Energy Reports program
are captured in the baseline projection, however, the CPA considers the potential to expand this
program to additional customers.
Similar to equipment measures, non-equipment measures in new construction are considered lost
opportunities, since decisions about measure installation are made at the time of construction.
To develop the list of measures to include in this CPA, AEG started with all measures analyzed in the
previous study, introduced new emerging technologies, and updated or excluded obsolete measures. A
preliminary list of energy efficiency measures to assess was distributed to the PacifiCorp project team for
review and then to stakeholders as part of the IRP Public Input Process. 13 12F
2.1.5 Calculating Energy Efficiency Potential
The approach used to calculate the energy efficiency potential adheres to the approaches and conventions
outlined in the National Action Plan for Energy-Efficiency (NAPEE) Guide for Conducting Potential Studies
(2007) 14 and The Council’s Draft 2021 Power Plan (2016) These sources represent authoritative and
13F
comprehensive industry standard practices for estimating energy-efficiency potential.
2.1.5.1 Energy Efficiency Measure Application
Energy efficiency potential is estimated by developing an alternate projection of energy consumption if
efficient measures are adopted and calculating the difference form the baseline forecast. In these alternate
projections, measures are only allowed to be adopted where they are applicable (e.g., insulation will only
save electricity in homes with electric heating or cooling) and where the measure is not already installed
13
Additional details are provided in the February 18, 2020 CPA Workshop as part of the 2021 IRP Public Input Process.
https://www.pacificorp.com/energy/integrated-resource-plan/public-input-process.html
14
National Action Plan for Energy Efficiency (2007). National Action Plan for Energy Efficiency Vision for 2025: Developing a Framework for
Change. www.epa.gov/eeactionplan.
Applied Energy Group • www.appliedenergygroup.com |9You can also read