N25 Waterford to Glenmore - Phase 2: Environmental Route Options Report - Stage 2 (Project Appraisal Matrix)
←
→
Page content transcription
If your browser does not render page correctly, please read the page content below
N25 Waterford to Glenmore
Phase 2: Environmental Route Options Report –
Stage 2 (Project Appraisal Matrix)
Kilkenny County Council
March 2021

5190130-ATK-ZZ-ZZ-RP-EC-0001

Notice
This document and its contents have been prepared and are intended solely as information for Kilkenny County
Council and use in relation to the N25 Waterford to Glenmore scheme.
Atkins Limited assumes no responsibility to any other party in respect of or arising out of or in connection with
this document and/or its contents.

Document history
Document title: Phase 2: Environmental Route Options Report – Stage 2 (Project Appraisal Matrix)
Document reference: 5190130-ATK-ZZ-ZZ-RP-EC-0001
  Revision       Purpose description        Originated         Checked   Reviewed     Authorised         Date
 Rev 1.0       Draft for Client                LMN               CG       MML             RN          July 2020
               Comment
 Rev 2.0       Updated following               LMN               CA       MML             RN        August 2020
               Internal Review
 Rev 3.0       Client issue for                LMN               CA       MML             RN         September
               comment                                                                                 2020
 Rev 4.0       Update Based on                 LMN               CA       MML             RN         September
               Client                                                                                  2020
               Feedback/Updated
               Internal Review
 Rev 5.0       Update Based on                 LMN               CA       MML             RN           October
               Client                                                                                   2020
               Feedback/Updated
               Internal Review
 Rev 6.0       Draft Submission                LMN               CA       MML             RN           October
                                                                                                        2020
 Rev 7.0       Final                           LMN               CA       MML             RN         March 2021

Client signoff
 Client                  Kilkenny County Council Kilkenny County Council
 Project                 N25 Waterford to Glenmore
 Job number               5190130
 Client
 signature/date
                         Seamus Foley March 2021

5190130-ATK-ZZ-ZZ-RP-EC-0001 | March 2021
Atkins | 5190130-ATK-ZZ-ZZ-RP-EC-0001 P2 Stage 2 Report V7.0                                            Page 2 of 69
Contents Chapter Page 1. Introduction 4 1.1. Option Selection Process 4 1.2. Stage 1 (Preliminary Option Assessment) Summary 4 2. Stage 2 Assessment - Environmental Sub-criteria 7 2.1. Air Quality 9 2.2. Climate 13 2.3. Noise 16 2.4. Landscape and Visual 20 2.5. Flora and Fauna 25 2.6. Waste 29 2.7. Soils and Geology 31 2.8. Hydrology 36 2.9. Hydrogeology 39 2.10. Cultural Heritage 42 2.11. Non-agricultural Properties 46 2.12. Agriculture 49 2.13. Planning / Human Beings 52 2.14. Human Health 56 3. Summary of Stage 2 Assessment Matrices 59 Appendices 60 Appendix 1.1 Phase 2: Stage 1 – Preliminary Option Assessment Matrices Appendix 2.3 Noise Appendix 2.4 Landscape and Visual Appendix 2.5 Flora and Fauna Appendix 2.7 Soils and Geology Appendix 2.9 Hydrology and Hydrogeology Appendix 2.10 Cultural Heritage Appendix 3.1 Phase 2: Stage 2 – Project Appraisal Matrices 5190130-ATK-ZZ-ZZ-RP-EC-0001 | March 2021 Atkins | 5190130-ATK-ZZ-ZZ-RP-EC-0001 P2 Stage 2 Report V7.0 Page 3 of 69
1. Introduction
The N25 is a vital link in the national road network in the south east of Ireland. The N25 connects Cork at one
end to the port of Rosslare at the other end, with a link to Waterford City from the N25 between these locations.
It provides access to 4 of the country’s major ports, Cork, Waterford, New Ross and Rosslare. It also provides
access to 2 airports, Cork and Waterford. This section of the national road network is rural in nature and is
situated between Waterford City (to the south) and the New Ross Bypass (just north of Glenmore Village),
County Kilkenny.
The purpose of this report is to document the Environmental Assessment process undertaken at Phase 2 Stage
2 of the option selection process. The process is detailed within Transport Infrastructure Ireland (TII) Project
Management Guidelines (PMG) and associated Project Appraisal Guidelines (PAG).
1.1. Option Selection Process
The Option Selection Process is a three-stage process as outlined within Project Appraisal Guidelines (PAG)
Unit 4.0 – Consideration of Alternatives and Options and is summarised as follows:
• Stage 1 – Preliminary Options Assessment;
• Stage 2 – Project Appraisal Matrix; and
• Stage 3 – Preferred Option.
1.2. Stage 1 (Preliminary Option Assessment) Summary
For Stage 1 the Preliminary Option Assessment was carried out on all feasible options which were developed
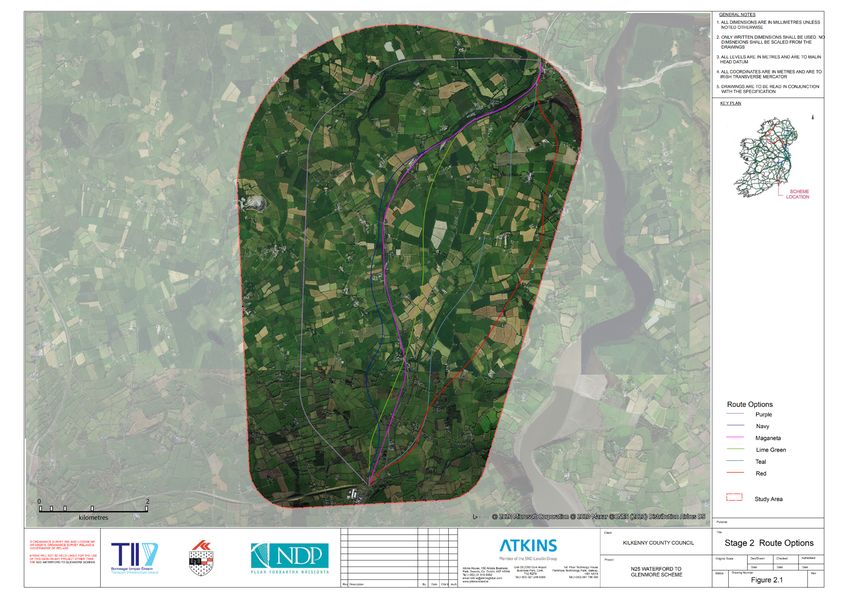
for the scheme. Fifteen routes were assessed, and these are displayed on Figure 1.1.
.
5190130-ATK-ZZ-ZZ-RP-EC-0001 | March 2021
Atkins | 5190130-ATK-ZZ-ZZ-RP-EC-0001 P2 Stage 2 Report V7.0 Page 4 of 69Figure 1.1 Preliminary Route Options
The Environmental Assessment of each route was carried out as a comparative exercise, utilising matrices that
are located in Appendix 1.1, in line with TII’s PMG and PAG. The environmental sub-criteria for each
preliminary option assessment are summarised as follows:
    •    Human Beings (including compatibility with development policy);
    •    Flora and Fauna (comparative impact on designated sites / species and other areas of
         national, regional or local ecological value);
    •    Water Quality (comparative impact on watercourses, water supplies and aquatic ecology);
    •    Geology & Hydrogeology (comparative impact on vulnerable rocks and soils, aquifers and
         wells of national, regional or local importance);
    •    Air Quality (existing air quality environment and number of sensitive receptors);
    •    Noise & Vibration (identification of sensitive receptors, characteristics of the prevailing noise climate
         and opportunities for noise mitigation);
    •    Landscape & Visual (comparative impact on landscape character, topography, vegetation,
         natural features, views and obstructions);
    •    Material Assets (comparative impact on utilities, properties, quarries, transport and
         infrastructure, etc);
    •    Agriculture (comparative impact on farm operations, farm types, livestock and other agri-businesses);
         and
    •   Archaeology & Cultural Heritage (comparative impact on Recorded Monuments and Places, area of
        archaeological potential, Arch. Heritage, and any other areas of cultural significance as per TII
        Guidelines for the Assessment of Archaeological Heritage Impacts of National Road Schemes and TII
        Guidelines for the Assessment of Archaeological Heritage Impacts of National Road Schemes).
Each impact was assessed using both a qualitative and quantitative method and was then scored on a seven-
point scale as follows as detailed in PAG Unit 7.0: Multi Criteria Analysis (MCA):
    •    7 – Major of Highly positive
    •    6 – Moderately Positive
    •    5 – Minor or slightly positive
    •    4 – Not significant or neutral
    •    3 – Minor or slightly negative
    •    2 – Moderately Negative
    •    1 – Major or highly negative
The high-level ranking of options is given by the sum of all the preference scores based on the scoring for each
of the main criterion. It is not intended that the sum of each of the individual scores will be used in selecting a
preferred option. The overall impact will depend on the strength of individual impacts and it is up to the
assessor to weigh up the individual impacts and form a view as to the likely overall impact of the options. The
environmental scoring and assessment were considered along with other assessment parameters i.e.
engineering and economic. Six route corridor options were brought forward into Stage 2 for further assessment,
i.e.:
    •    Purple (11.6 km);
    •    Navy (9.5 km);
    •    Magenta (9.3 km);
    •    Red (9.0 km);
    •    Teal (8.7 km); and
    •    Lime Green (8.9 km).

5190130-ATK-ZZ-ZZ-RP-EC-0001 | March 2021
Atkins | 5190130-ATK-ZZ-ZZ-RP-EC-0001 P2 Stage 2 Report V7.0                                               Page 6 of 69
2. Stage 2 Assessment - Environmental
Sub-criteria
A Phase 2 Stage 2 Project Appraisal has been undertaken for each of the six route options identified from the
overall Stage 1 Preliminary Options Assessment.
The Stage 2 Environmental Appraisal has been undertaken by an experienced environmental team comprising
Atkins’ environmental consultants and specialist sub-consultants. Each consultant undertook the environmental
appraisal for their discipline in accordance with relevant TII and industry standard best practice guidance.
Specific details in relation to the methodology and assessment criteria, along with the findings of each detailed
environmental appraisal are presented in each of the following sub-sections (within Chapter 2) and associated
appendices (where required).
A collaborative approach was adopted by the environmental team particularly where environmental interactions
warranted consideration (for example between cultural heritage and landscape and visual, and between
ecology and hydrology).
The Environmental Sub-Criteria assessed during Phase 2 Stage 2 is as follows:
• Air quality;
• Climate;
• Noise;
• Landscape and Visual;
• Flora and Fauna;
• Waste;
• Soils and Geology;
• Hydrology;
• Hydrogeology;
• Cultural Heritage (including architectural and archaeological heritage);
• Non-agricultural properties;
• Agriculture;
• Human Beings (including compatibility with planning policy); and
• Human Health.
The sub-criteria are based on topics contained within PAG Unit 7.0: MCA. Please note that additional
environmental sub-criteria have been added, i.e. human health to reflect updates in the most recent EIA
directive. Human beings (including compatibility with planning policy) has also been added. The six route
options assessed against the environmental sub criteria are displayed on Figure 2.1.
Each of the sub-criteria have specific methods of assessment however each sub-criterion has been scored
using the seven-point scale as described in Chapter 1. Summary scores are presented in tables at the end of
each sub-criteria assessment. Detailed Stage 2 Project Appraisal Matrices are included within Appendix 3.1.
5190130-ATK-ZZ-ZZ-RP-EC-0001 | March 2021
Atkins | 5190130-ATK-ZZ-ZZ-RP-EC-0001 P2 Stage 2 Report V7.0 Page 7 of 692.1. Air Quality
2.1.1. Introduction
AWN Consulting Limited have prepared an air quality route options assessment for six route options. This
assesses the various route options in line with TII guidance and provides a comparison of the air quality impact
on people of each route option.
2.1.2. Method of Assessment
Assessment Criteria
TII’s document entitled “Guidelines for the Treatment of Air Quality during the Planning and Construction of
National Road Schemes”1 provides guidance on the route selection assessment procedures in “Chapter 2 –
Route Selection”. The primary aspects of the assessment relate to the existing ambient air quality, proximity of
sensitive locations and a review of the overall significance of potential changes in air quality.
The objective at this stage of the route selection process is to indicate whether there are likely to be significant
air quality impacts associated with the proposed route options. In the current assessment, the number of
residential properties within 50m of the carriageway 2 of each route have been identified. Traffic data obtained
for the opening year of 2030 has been used in the model as per the TII guidelines 3. A comparison of the
proposed routes has been carried out based on a calculation of the Index of the Overall Change in Exposure to
Nitrogen Oxides (NOx) and Particulate Matter (PM10) resulting from each individual route.
The calculation of the Index of Overall Change in Exposure allows a comparison of the overall air quality impact
on people from each route option to be carried out. The Index is based on identifying the number of sensitive
receptor locations (e.g. residential properties) within 50m of the carriageway of all road links that would
experience a significant change in traffic for each of the routes. The change in emissions is influenced by
changes in traffic flow, composition and speed. The analysis was carried out using the methodology of TII1
using the UK DMRB air dispersion model.
The comparison calculated as per the “Guidelines for the Treatment of Air Quality during the Planning and
Construction of National Road Schemes” was then used to inform the Stage 2 project appraisal matrix. The
comparative evaluation of options was assisted by scoring of impacts to sensitive receptors using the Stage 2
project appraisal matrix similar to that shown in the Project Appraisal Guidelines for National Roads Unit 7.0 -
Multi Criteria Analysis4. An assessment was undertaken on each option to include both a quantitative and
qualitative assessment. Each impact is scored based on the seven-point scale as described in Chapter 1.
2.1.3. Key Findings
Air Pollution Sources
The major source of air pollution within the study area is road traffic, predominantly that from the existing N25,
the New Ross Bypass at the northern end of the study area and the N29 and N25 Waterford Bypass at the
southern end of the study area. Air quality is variable and subject to significant spatial variation, with
concentrations generally reducing significantly with distance from major road sources. The higher levels of air
pollution are experienced within 50m of the existing national roads in the study area with the remainder of the
study area generally experiencing rural background concentrations of pollutants.
A review of IPPC / IED licences issued by the EPA 5 for the region show that there are no licenced facilities with
emissions to the atmosphere within the study area for this project.
Meteorological Data
A key factor in assessing temporal and spatial variations in air quality are the prevailing meteorological
conditions. Depending on wind speed and direction, individual receptors may experience very significant
variations in pollutant levels under the same source strength (i.e. traffic levels). Wind is of key importance in
1 Transport Infrastructure Ireland (2011) Guidelines for the Treatment of Air Quality during the Planning and Construction of National Road Schemes
2 Carriageway is indicative alignment within corridor for assessment purposes
3 UK DEFRA (2007) Design Manual for Roads and Bridges Vol 11 Chapter 3 (Document & Calculation Spreadsheet)
4 Transport Infrastructure Ireland (2016) Project Appraisal Guidelines for National Roads Unit 7.0 - Multi Criteria Analysis. PE-PAG-02031.
5 EPA (2020) http://www.epa.ie/Licensing/IPPCLicensing
5190130-ATK-ZZ-ZZ-RP-EC-0001 | March 2021
Atkins | 5190130-ATK-ZZ-ZZ-RP-EC-0001 P2 Stage 2 Report V7.0 Page 9 of 69dispersing air pollutants and for ground level sources, such as traffic emissions, pollutant concentrations are
generally inversely related to wind speed. Thus, concentrations of pollutants derived from traffic sources will
generally be greatest under very calm conditions and low wind speeds when the movement of air is restricted.
In relation to PM10 (particulate matter less than 10 microns), the situation is more complex due to the range of
sources of this pollutant, and thus measured levels of PM10 can be a non-linear function of wind speed.
The nearest representative weather station collating detailed weather records is Johnstown Castle
meteorological station. This station is located approximately 37 km east of the existing N25. Windroses for the
most recent 5 years of data collected (2014 – 2018) show that the prevailing wind is south-westerly in direction
with a mean wind speed of approximate 4.0 m/s over the period 2004 – 20186.
Existing Air Quality – Review of EPA Monitoring Data
As part of the implementation of the Framework Directive on Air Quality (1996/62/EC), four air quality zones
have been defined in Ireland for air quality management and assessment purposes. In terms of air monitoring,
the study area is categorised as Zone D (rural areas and towns with a population of less than 15,000).
Air quality monitoring programs have been undertaken throughout Ireland in recent years by the EPA and Local
Authorities. The most recent EPA annual report on air quality monitoring undertaken throughout Ireland is
entitled "Air Quality in Ireland 2018'. The TII guidelines state that the local air quality assessment should focus
on NO2 and PM10, as these are the pollutants of greatest concern with respect to road traffic conditions. A
review of data from representative Zone D locations in Ireland can be used to provide an indication of the
prevailing air quality conditions within the study area.
NO2 monitoring was carried out at two rural Zone D locations in Emo and Kilkitt in recent years6. The NO2
annual average in 2018 was 3 μg/m3 at both rural sites. Hence long-term average concentrations measured at
all locations were significantly lower than the annual average limit value of 40 µg/m 3. The maximum 1-hour limit
value of 200 μg/m3 (measured as a 99.8th percentile i.e. 18 exceedances are allowed per year) was not
exceeded in any year for any of the Zone D locations. The average results at rural Zone D locations over the
last five years suggests an average of 3 µg/m3 as a background concentration. Based on the above
information, a conservative estimate of the current background NO 2 concentration for the region of the
development is 5 µg/m3.
Long-term PM10 measurements carried out at the rural Zone D location in Kilkitt in 2018 gave an average level
of 9 μg/m3 7. Results are also available for Kilkitt to observe the trend in concentrations over the last five years.
The average result at Kilkitt over the last five years is 9 µg/m3 Based on the above information a conservative
estimate of the current background PM10 concentration for the region of the development is 10 µg/m3.
Traffic Pollution
Pollution from traffic sources increases at low traffic speeds and during congested traffic conditions. An
improvement in the road infrastructure is likely to improve traffic flow, relative to the current alignment. In
addition, the number of receptors directly impacted by the proposed routes will be less than the current route,
thus all the proposed routes are preferable to the existing alignment with respect to air quality.
The residual impact on the existing N25 has been accounted for when assessing the impact of each of the
route options in the ‘Do Something’ scenario (Table 2-1). The route with the lowest exposure index is the
preferred option from an air quality perspective, as it leads to the smallest increases, or greatest decreases in
air pollution at sensitive receptors. A negative score indicates an overall improvement in air quality as a result
of the route option.
Purple
The purple route is of intermediate preference as it results in a slightly positive impact on local air quality at the
sensitive receptors along the existing alignment. There are no residential properties within 50m of the
carriageway of the purple route, however, diverting the traffic away from the properties within 50m of the
carriageway of the existing route results in the overall beneficial impact calculated.
Navy
The navy route is moderately positive in terms of local air quality impacts. There is a total of 4 sensitive
receptors within 50m of the navy route carriageway. These sensitive receptors are within the mostly online
6 Met Eireann (2020) www.met.ie
7 PA (2019) Air Quality in Ireland 2018 (and previous reports)
5190130-ATK-ZZ-ZZ-RP-EC-0001 | March 2021
Atkins | 5190130-ATK-ZZ-ZZ-RP-EC-0001 P2 Stage 2 Report V7.0 Page 10 of 69northern portion of the route option and therefore these properties will already experience a certain level of
traffic related air pollutants from the existing N25. The more southerly portion of the navy route diverts traffic
away from the existing N25 and therefore results in a positive impact on the existing properties on the
remainder of the N25.
The resultant NOX and PM10 scores are moderately positive by diverting traffic away from the existing N25.
Magenta
The magenta route option is considered neutral in terms of air quality impacts. It is the most online option and
therefore has the highest number of receptors (26) within 50m of the route carriageway, however, as these
receptors are already impacted by the existing traffic along the N25 the change in NO X and PM10
concentrations is lessened.
The resultant NOX and PM10 scores are slightly positive but the overall change in emission compared with the
other route options is minimal and overall results in a neutral score.
Red
The red route has a moderately positive impact on local air quality. There is a total of 3 sensitive receptors
within 50m of the road carriageway of this route option, these newly impacted receptors will experience an
increase in air pollutant concentrations compared with predicted baseline levels. However, the overall impact of
the red route option is positive as a result of diverting the traffic away from the properties along the existing
N25.
Teal
The teal route has a highly positive impact on local air quality and is the preferred route option from an air
quality perspective. There are no sensitive receptors within 50m of the road carriageway of this route option
and therefore no negative air quality impacts are predicted. The teal route will result in a positive impact by
diverting traffic away from the sensitive receptors along the existing N25 thus, improving air quality in this area.
Lime Green
The lime green route has a moderately positive impact on local air quality. There is a total of 4 sensitive
receptors within 50m of the road carriageway of this route option, these newly impacted receptors will
experience an increase in air pollutant concentrations compared with predicted baseline levels. However, the
overall impact of the lime green route option is positive as a result of diverting the traffic away from the
properties along the existing N25.
Impacts on Sensitive Ecosystems
The EC Directive 92/43/EEC on the Conservation of Natural Habitats and of Wild Fauna and Flora (the
“Habitats Directive”) requires an Appropriate Assessment to be carried out where there is likely to be a
significant impact upon a European protected site. TII requires the Air Quality Specialist to liaise with an
ecologist on schemes where there is a European protected site within 2km of the route. However, as the
potential impact of a scheme is limited to local level, detailed consideration need only be given to roads where
there is a significant change to traffic flows (>5%) and the designated site lies within 200m of the road centre
line. Where these two requirements are fulfilled, the assessment at the route selection stage involves a
calculation of nitrogen oxides (NOx) concentrations using the UK DMRB screening method as recommended by
TII.
All route options, including the existing N25 route directly cross a section of the River Barrow & River Nore SAC
(site code 002162) at the northern point of the route towards Glenmore. As the existing route already crosses
this section of the SAC and all route options are also proposed to cross the same section there is no preference
to any route option in terms of air quality impacts on designated sites.
5190130-ATK-ZZ-ZZ-RP-EC-0001 | March 2021
Atkins | 5190130-ATK-ZZ-ZZ-RP-EC-0001 P2 Stage 2 Report V7.0 Page 11 of 69Table 2-1 - Results of Air Quality Assessment
Average AADT (2030)
No. NOX PM10
Route Receptors
Route Residual Traffic Exposure Exposure
Route Length (km)
on Existing (0 - 50m) Index Index
Option
N25
Purple 6,118 8,717 11.6 0 -18,255 -1,434
Navy 14,307 730 9.5 4 -85,138 -2,736
Magenta 14,989 n/a Note 1 9.3 26 -1,138 -28
Red 13,870 969 9.0 3 -78,047 -2,497
Teal 13,871 969 8.7 0 -90,891 -2,898
Lime Green 14,310 699 8.9 4 -80,937 -2,604
Note 1Magenta
Route is online option therefore no residual traffic flows
2.1.4. Summary and Conclusion
The route option with the greatest potential improvement in pollutant exposure is the preferred option from an
air quality perspective. The results of the Index of Overall Change in Exposure have been used to rank the
route options in order of their potential impact on air quality. The results (see Table 2.2) show that the teal route
is the preferred option in terms of air quality, however, the lime green, navy and red routes will result in
moderately positive impacts and would also be suitable choices. All route options are preferred over the
existing alignment as the majority of routes divert traffic away from the high numbers of receptors along the
existing alignment and impact very few new additional receptors. The magenta route is the least preferred
option from an air quality perspective in comparison to the other route options, excluding the existing alignment.
This is due to the fact that the magenta route is a largely online option and therefore a higher number of
sensitive receptors are impacted when compared with the other routes.
Table 2-2 - Summary of Route Scoring – Air Quality
Route Scoring Description
Purple 5 Minor / slightly positive
Navy 6 Moderately positive
Magenta 4 Not significant / neutral
Red 6 Moderately positive
Teal 7 Major / highly positive
Lime Green 6 Moderately positive
5190130-ATK-ZZ-ZZ-RP-EC-0001 | March 2021
Atkins | 5190130-ATK-ZZ-ZZ-RP-EC-0001 P2 Stage 2 Report V7.0 Page 12 of 692.2. Climate 2.2.1. Introduction AWN Consulting Limited have prepared a climate route options assessment for six route options for the proposed N25 Waterford to Glenmore scheme. This assesses the various route options in line with TII and other relevant guidance on the national impact of climate change. 2.2.2. Method of Assessment The TII guidance document “Guidelines for the Treatment of Air Quality During the Planning and Construction of National Road Schemes” does not provide an assessment method for route selection based on climate impacts. However, since this guidance was published there has been an increased focus on the impact of climate change and the anthropogenic contribution to it. TII have recently published a Carbon Tool (version 2.0)8 which allows carbon emissions associated with a road scheme to be calculated. TII recommend the use of this tool at all stages in the project, including route selection, environmental impact assessment and detailed design stages. The tool allows for inputs associated with the construction phase, operational phase and decommissioning phase to be calculated. Construction phase inputs include details on pre-construction activities such as land clearance, construction materials, construction activities and construction waste materials. Operational stage inputs include details on the number of vehicles using the route as well as ongoing maintenance of the route. Decommissioning activities were not considered relevant to this stage of the development and have not been considered within this assessment. The TII Carbon Tool uses emission factors from recognized sources including the Civil Engineering Standard Method of Measurement (CESSM) Carbon and Price Book database 9. The carbon emissions are calculated by multiplying the emission factor by the quantity of the material that will be used over the entire construction / maintenance phase. The outputs are expressed in terms of kgCO2e (kilograms of carbon dioxide equivalent). Information on construction activities and materials as well as operational phase information was inputted into the Carbon Tool for each route option. Full detailed information for each route is not known at this stage of the project, however, inputs were kept consistent for each route option to provide for an adequate comparison across all routes. The carbon dioxide equivalent (CO2e) concentrations calculated for each route option were compared and a score assigned using the seven-point scale. 2.2.3. Existing Environment Anthropogenic emissions of greenhouse gases in Ireland included in the EU 2020 strategy are outlined in the most recent review by the EPA which details emissions up to 2018. Agriculture is predicted to be the largest contributor in 2018 at 34% of the total, with the transport sector accounting for 20.2% of emissions of CO 210. Greenhouse gas emissions from the transport sector increased by 1.6% or 0.20 Mt CO2eq in 2018. This is the fifth year out of the last six with increased emissions in transport. Private diesel cars increased by 7.7% in 2018 while the number of passenger petrol cars decreased by 4.5%. Railways contributed 130.49 kt CO2eq in 2018 or 0.2% of total emissions which was up 1% on 2017 emissions. Road transportation accounted for 11,677 kt CO2eq which is 19.2% of the total 2018 emissions and an increase of 1.4% on 2017. The data published in 2020 predicts that Ireland will exceed its 2018 annual limit set under the EU’s Effort Sharing Decision (ESD), 406/2009/EC1 by 5.17 Mt. For 2018, total national greenhouse gas emissions are estimated to be 60.51 million tonnes carbon dioxide equivalent (Mt CO 2e). This is 0.2% lower (0.14 Mt CO2e) than emissions in 2017. The EPA 2019 GHG Emissions Projections Report for 2018 – 2040 notes that there is a long-term projected decrease in greenhouse gas emissions as a result of inclusion of new climate mitigation policies and measures that formed part of the National Development Plan (NDP) which was published in 2018. Implementation of these are classed as a “With Additional Measures scenario” for future scenarios. A change from generating electricity using coal and peat to wind power and diesel vehicle engines to electric vehicle engines are envisaged under this scenario. While emissions are projected to decrease in these areas, emissions from agriculture are projected to grow steadily due to an increase in animal numbers. However, over the period 2013 – 2020 Ireland is projected to cumulatively exceed its compliance obligations with the EU’s Effort Sharing 8 Transport Infrastructure Ireland (2011) Carbon Calculator Tool, Version 2.0 9 MacDonald, Mott (2013) Civil Engineering Standard Method of Measurement (CESSM) Carbon and Price Book 10 EPA (2020) Ireland's Final Greenhouse Gas emissions 1990 - 2018 5190130-ATK-ZZ-ZZ-RP-EC-0001 | March 2021 Atkins | 5190130-ATK-ZZ-ZZ-RP-EC-0001 P2 Stage 2 Report V7.0 Page 13 of 69
Decision (Decision No. 406/2009/EC) 2020 targets by approximately 10 Mt CO 2e under the With Existing
Measures scenario and 9 Mt CO2e under the With Additional Measures scenario11.
There are currently no sector specific emissions targets outlined for the reduction of GHG emissions. The
proposed scheme will reduce congestion and will allow for better, more efficient driving thus reducing emissions
of air pollutants and CO2 thereby reducing the impact on climate

2.2.4.        Key Findings
The CO2e emissions associated with each route option has been calculated as per the TII Carbon Tool. There
is minimal difference between all route options in terms of CO2e emissions as they are all of a similar length.
No route option will result in a positive impact to climate. As the magenta route is the primarily online route
option with 65% online, it has the lowest construction stage embodied CO2 emissions due to the lower volume
of materials required. The purple route option is the longest route and therefore has the highest embodied CO 2
emissions due to the greater amount of material and works involved at the construction stage.

            Purple
The purple route results in a slight negative impact to climate. This is the route option with the longest length
and therefore has the highest volume of construction materials and construction works involved. In addition,
due to the longer length this results in a further distance to travel and a large volume of traffic remains on the
existing N25 due to the longer journey time on the purple route. Therefore, there is a lesser difference between
the Do Nothing and Do Something operational scenarios with the purple route. The purple route option is the
least preferred in terms of climate.

            Navy
The navy route results in a slight negative impact to climate as a result of embodied CO 2e emissions. The navy
route is approximately 25% online. However, there is minimal difference between the emissions from the navy
route and the other route options.

           Magenta
The magenta route results in a slight negative impact to climate due to the CO 2 emissions from construction
works and traffic on the route. However, as this is a 65% online option construction will involve less materials
and therefore embodied construction stage carbon emissions will be lower than for the other route options
which would involve full construction of a new road alignment.

             Red
The red route results in a slight negative impact to climate due to the CO 2 emissions from construction works
and traffic on the route. However, there is minimal difference between the emissions from the red route and the
other route options.

             Teal
The teal route results in a slight negative impact to climate due to the CO 2 emissions from construction works
and traffic on the route. While there is minimal difference between the emissions from the teal route and the
other route options the teal route is the preferred route in terms of climate impacts as it has the lowest overall
carbon emissions of all the route options. This is due to the lesser operational emissions associated with
vehicles using the route. In addition, the teal route is marginally shorter than the other routes.

            Lime Green
The lime green route results in a slight negative impact to climate as a result of CO2 emissions from
construction works and traffic on the route. A portion of the lime green route remains online.

11 EPA (2019) GHG Emissions Projections Report – Ireland’s Greenhouse Gas Emissions Projections 2018 – 2040

5190130-ATK-ZZ-ZZ-RP-EC-0001 | March 2021
Atkins | 5190130-ATK-ZZ-ZZ-RP-EC-0001 P2 Stage 2 Report V7.0                                                  Page 14 of 69
Table 2-3 - Results of Climate Assessment
Route Construction Operational Stage (kgCO2e) Total excluding
Route Length Stage Vehicles using the vehicle use Total (kgCO2e)
Maintenance
(km) (kgCO2e) infrastructure Note 1 (kgCO2e)
Purple 11.5 201,091,334 12,940,436 11,087,030 214,031,770 225,118,800
Navy 9.4 197,517,101 10,860,309 -2,954,970 208,377,410 205,422,440
Magenta 9.3 193,059,376 6,775,959 -2,568,970 199,835,336 197,266,366
Red 8.9 198,043,294 9,958,653 -20,713,970 208,001,947 187,287,977
Teal 8.7 198,691,780 10,541,728 -27,505,970 209,233,508 181,727,538
Lime
8.9 200,219,633 11,400,889 -17,192,970 211,620,522 194,427,552
Green
Note 1 Operational Vehicle (Non Maintenance) Figures are the difference between the Do Nothing and Do Something
scenarios.
Figure 2.1 – Breakdown of Embodied Carbon for Each Route Option (Operational Figures are the
difference between the Do Nothing and Do Something scenarios)
2.2.5. Summary and Conclusions
There is minimal difference in the route options (relative to national climate targets) in terms of potential climate
impacts. This is due to the routes all having a relatively similar length. All routes will result in a slightly negative
impact to climate as a result of embodied carbon and no positive climate impacts are predicted. The teal route
is the preferred option from a climate perspective as it results in slightly lower CO 2 emissions compared with
the other route options. The teal route is the shortest of the route options. The purple route is the least
preferred option as it results in the highest CO2 emissions of all the route options due to its longer length.
Table 2-4 - Summary of Route Preference – Climate
Route Score Description
Purple 3 Minor/slightly negative
Navy 3 Minor/slightly negative
Magenta 3 Minor/slightly negative
Red 3 Minor/slightly negative
Teal 3 Minor/slightly negative
Lime Green 3 Minor/slightly negative
5190130-ATK-ZZ-ZZ-RP-EC-0001 | March 2021
Atkins | 5190130-ATK-ZZ-ZZ-RP-EC-0001 P2 Stage 2 Report V7.0 Page 15 of 692.3. Noise
2.3.1. Introduction
AWN Consulting Limited have prepared a noise route option assessment of the proposed scheme. This section
presents an assessment of the route options with respect to their potential noise impact, in line with the relevant
guidance set down in accordance with the TII documents “Guidelines for the Treatment of Noise and Vibration
in National Road Schemes (TII 2004)”, “Good Practice Guidance for the Treatment of Noise during the
Planning of National Road Schemes (TII 2014)” and the requirements of the TII Project Management
Guidelines 2010 and the TII Project Appraisal Guidelines for National Roads Unit 7.0 - Multi Criteria Analysis
PE-PAG-02031, October 2016.
2.3.2. Method of Assessment
Assessment Criteria
To establish a methodology for the options assessment, the following approach has been adopted in line with
the guidelines set out in Chapter 5 of TII 2004 and Chapter 2 of TII 2014 documents.
The assessment of potential noise impacts for the Stage 2 options assessment is based primarily upon
receptor counts (Quantitative), the likely changes in traffic flows and the likely requirement for mitigation
measures (Qualitative). In terms of operational noise, the TII 2004 and 20014 Noise Guidelines considers it
appropriate to set the design goal for road traffic noise for new national roads in Ireland as follows:
• Day-evening-night 60dB Lden (free field).
Both documents acknowledge that it may not always be sustainable to achieve this design goal. In such
circumstances, nevertheless, a structured approach should be taken in order to as far as practicable,
ameliorate road traffic noise through the consideration of measures such as the alignment, physical mitigation
e.g. earth mounds, noise barriers or low noise road surfaces.
The six route options have been compared with reference to their Potential Impact Ratings (PIR) based on
property counts between 0 and 300m from the road centreline. An assessment was also made of the likely
range of noise levels at distances from the routes in addition to the likely requirement for noise mitigation.
Whilst the PIR assessment provides information on the number of noise properties in the vicinity of each route
option, the Guidelines acknowledge that the PIR process only provides an initial high-level screening for the
options assessment. This is particularly true for studies where on-line upgrades form part of the route corridor
options. Consideration must also be given to the potential change in traffic noise levels at properties to further
determine potential overall noise impacts. In addition to property counts, other factors which also dictate the
potential noise impact from an option relate to its vertical alignment (cuttings, embankments, at grade, tunnels
etc.), road traffic flows and potential for noise mitigation.
Full details of the noise assessment methodology are outlined in Appendix 2.3 of this document.
2.3.3. Existing Environment
The baseline noise environment in the vicinity of existing noise sensitive locations (NSL’s) adjacent to the
existing N25 road will be dominated by road traffic movements along the existing route option. The round 3
road traffic noise maps published by the EPA 12 as part of the Environmental Noise Regulations have been
reviewed to determine the range of predicted traffic noise in the vicinity of the existing section of the N25 under
consideration within this study area. These maps indicate that road traffic noise levels are typically greater than
60dB Lden. within 50m from the edge of existing section of the N25.
NSL’s in the vicinity of the off-line sections of the six route corridors are influenced by distant traffic along the
N25, local traffic movements, agricultural activity, and other anthropogenic noise sources typical of rural and
semi-rural areas and in turn the study area under consideration. A full and detailed baseline noise survey will
be undertaken in accordance with the TII Noise Guidelines at EIAR stage to characterise the existing noise
environment associated with the emerging preferred route.
12 Environmental Protection Agency (EPA) - Noise Round 3 Road – Lden [Online Maps] Available from gis.epa.ie/EPAMaps/ [Accessed 12 June
2020]
5190130-ATK-ZZ-ZZ-RP-EC-0001 | March 2021
Atkins | 5190130-ATK-ZZ-ZZ-RP-EC-0001 P2 Stage 2 Report V7.0 Page 16 of 692.3.4. Key Findings
In all cases the PIR is lower in all proposed routes when compared to the existing Do-Nothing alignment. The
existing route has 78 no. NSLs that are calculated to have a traffic noise level above 60dB L den, with no other
route exceeding this quantity. The residual impact on the existing N25 has been accounted for when assessing
the impact of each of the route options in the ‘Do Something’ scenario (see Table 2-5). All route options, with
the exception of the Purple route, will divert traffic from the existing N25 resulting in moderate to major
reductions in noise levels to existing properties along this existing route. All routes have moderate to major
negative impacts along their respective route alignments in comparison to the existing route, with the exception
of the Magenta route, which has no negative impacts but fewer positive impacts than the other proposed
routes. With the exception of the Purple route, there are a small number of properties that require mitigation on
each route.
Purple
The Purple route is the least preferred of the proposed routes as it results in the least amount of traffic diversion
off the existing route. While it has the lowest PIR, it has the highest number of properties likely to experience a
moderate to major negative change in noise levels compared to other routes, with no likely significant reduction
in noise levels calculated at existing properties. Overall, the Purple route is determined to have a moderately
negative impact.
Navy
The Navy route is considered of intermediate preference as is it determined to result in a minor negative
impact, with a PIR of 247. The 60dB Lden traffic noise level is exceeded at 22no. NSLs along this route and
mitigation is likely required at 2no. properties. The route diverts traffic from the existing route and introduces
road traffic noise (RTN) as the dominant noise source in rural areas to west of the route. Nonetheless this route
has the second smallest number of properties likely to experience a major negative change in noise levels,
second only to the Magenta route. There is a comparable noise environment for properties to the east of the
route, which were previously affected by N25 on their front facades, now relocated to the rear facades, at a
greater distance. Earthworks provide screening at rear of properties along the route. This route option results
in a lower number of properties likely to experience a moderate to major positive change (reduction) in traffic
noise levels when compared against the Teal, Red or Lime Green routes and has a higher PIR compared to the
Teal and Red routes.
Magenta
The Magenta route is considered of intermediate preference as it is determined to result in a minor negative
impact, with a PIR of 360. The 60dB Lden traffic noise level is exceeded at 59no. NSLs along this route and
mitigation is likely required at 13no. properties. This route has the highest PIR compared to the other options
due to its close alignment to the existing N25. The existing noise environment at properties along sections 7, 9
and 10 (from transport model) of the existing N25 will, however, be improved (reduced) due to the realignment
of the existing route away from NSL’s. Similar to Navy route, the PIR is higher than Teal, Red and Lime Green
routes. The number of properties likely to experience a moderate to major positive change (reduction) in traffic
noise levels is, however, lower compared to the above-mentioned routes. This route is ranked higher in
preference than the Navy route as it has no negative impacts unlike the Navy route which introduces RTN as
dominant source to some rural areas along proposed route.
Red
The Red route is considered of intermediate preference as it is determined to result in a minor negative impact.
It is the furthest eastern route in the study area and passes through a rural environment with clusters of
properties, giving it a higher PIR than the proposed Teal route, also to the east of the existing route. It has a
PIR of 155. The 60dB Lden traffic noise level is exceeded at 29no. NSLs along this route and mitigation is
required at 18no. properties, the highest value along all routes. Earthworks provide screening to NSLs to the
northern section of the corridor. The number of properties likely to experience a major positive change in noise
levels is, however, highest along this route compared to the other route options (172no.) with Teal route second
highest at 141no. NSLs. This route is ranked below Navy due to the number of mitigation clusters required. The
Teal route has lower PIR with less mitigation and comparable positive impacts calculated overall.
Teal
The Teal route is considered minor negative and is the preferred route. This is determined on the basis of that it
has no properties within the 0-50m PIR band, has the lowest number of NSLs exceeding the design goal of
5190130-ATK-ZZ-ZZ-RP-EC-0001 | March 2021
Atkins | 5190130-ATK-ZZ-ZZ-RP-EC-0001 P2 Stage 2 Report V7.0 Page 17 of 6960dB Lden, it has the second highest number of properties likely to experience a major positive change in noise
levels when compared to all other routes (Red highest) with at least 100 more NSLs experiencing a reduction in
traffic noise levels compared to other routes. Mitigation is required for 6no. NSLs towards southern end of
route. This route has a lower PIR than Lime Green route. Earthworks provide beneficial screening at northern
section of the route near cluster of properties.
Lime Green
The Lime Green route is considered of intermediate preference as it has a minor negative impact. The corridor
passes through a rural noise environment with a higher PIR than all other proposed routes with the exception of
the Magenta route. This route has a comparable number of properties likely to experience a moderate to major
positive change in traffic noise to the to the Navy route due to extensive diversion of traffic off the existing N25.
Increase in traffic noise will be experienced in this rural environment but due to earthworks screening many
clusters of properties experience a likely lower moderate to major increase in noise levels compared to the Teal
route. The Teal route, however, has significantly more NSLs that experience a moderate to major reduction in
traffic noise levels along the existing N25. Lime Green route has slightly more properties requiring mitigation in
comparison to Teal and Navy routes.
2.3.5. Summary and Conclusions
The Stage 2 noise impact assessment has been conducted in accordance with the relevant TII noise guidance
documents. The PIR assessment demonstrates the range of values for each of the route corridors under
assessment. Based on a count of properties within 300m of each route, the assessment has determined that
the Purple Route has lowest PIR value. The Magenta route has the highest PIR with a high proportion of
receivers along this route corridor in the vicinity of the existing N25 alignment.
Taking account of indicative noise levels associated with the future traffic flow along each route corridor option,
the number of properties that have the potential to require noise mitigation in accordance with the criteria set
out in the TII guidelines for national road schemes has been calculated. All routes have a small number of
properties that require mitigation, with the exception of the Purple route.
The Teal route is the preferred route, as it has no properties within the 0-50m PIR band, lowest number of
properties that exceed 60dB Lden and similar to the Red route it has the highest number of properties likely to
experience a moderate to major positive reduction in traffic noise levels and with fewer properties requiring
mitigation.
The Purple route is the least preferred route as it has the highest number of properties that exceed 60dB Lden
and the least number of properties likely to experience moderate to major reductions in traffic noise levels.
The remaining proposed options have been determined to have a minor negative impact and are of
intermediate preference.
Taking into account all of the above considerations, the matrix scoring for each of the route corridors is
summarised in Table 2-5.
5190130-ATK-ZZ-ZZ-RP-EC-0001 | March 2021
Atkins | 5190130-ATK-ZZ-ZZ-RP-EC-0001 P2 Stage 2 Report V7.0 Page 18 of 69Table 2-5 - Summary of Scoring Assessment for each Route Corridor Option
Assessment Criteria Purple Route Navy Route Magenta Route Red Route Teal Route Lime Green Route
Potential Impact Rating (PIR) 98 247 360 155 107 299
No. of properties likely above 60dB 51 22 59 29 13 24
Lden
No. of Properties likely to experience 39 38 0 13 39 30
a Moderate Negative Impact
No. of Properties likely to experience 53 1 0 33 29 13
a Major Negative Impact
No. of Properties likely to experience 0 37 11 38 55 51
a Moderate Positive Impact
No. of Properties likely to experience 0 25 2 172 141 24
a Major Positive Impact
No. of properties likely to require 0 2 13 18 6 8
noise mitigation
Score description Moderately Minor or slightly Minor or Minor or slightly Minor or slightly Minor or slightly
negative negative slightly negative negative negative
negative
Score 2 3 3 3 3 3
5190130-ATK-ZZ-ZZ-RP-EC-0001 | March 2021
Atkins | 5190130-ATK-ZZ-ZZ-RP-EC-0001 P2 Stage 2 Report V7.0 Page 19 of 692.4. Landscape and Visual
2.4.1. Introduction
The Landscape and Visual Assessment has been prepared by Eamonn Byrne Landscape Architects (EBLA).
Landscape impact may be defined as changes in the physical landscape, which may give rise to changes in its
character and how it is experienced. Visual impact comprises the change in the composition of available views
from dwellings and public areas resulting from the proposals. The section provides a summary of the detailed
Landscape and Visual Assessment which is included as Appendix 2.4.
2.4.2. Method of Assessment
TII are currently developing a set of guidelines with regard to landscape and visual impact assessment. In the
absence of final published guidelines, landscape and visual impact assessments were carried out based on
methods described in the following publications:
• Landscape Institute and Institute of Environmental Management and Assessment (2013). Guidelines
for Landscape and Visual Impact Assessment, 3rd Edition, Oxon: Routledge;
• Department for Transport (UK). TAG (Transport Analysis Guidance) Unit A3, Environmental Impact
Appraisal;
• Highways England (2020). LA107 Landscape and Visual Effects (formerly DMRB Volume 11 Section 3
Part 5 Landscape Effects and IAN 135/10), Revision 2;
• Environmental Protection Agency (EPA) (2017). Draft Guidelines on the information to be contained in
Environmental Impact Assessment Report; and
• Transport Infrastructure Ireland (2016). Project Appraisal Guidelines for National Roads Unit 7.0- Multi
Criteria Analysis.
Detailed methodologies are included within Appendix 2.4.
2.4.3. Key Findings
This section summarises the effects of the proposed development on landscape and visual receptors, and the
significance of the effects identified.
Comparison of Route Options
Landscape Effects
The assessment of landscape impact is based on the division of character areas derived from the county
landscape character assessment. The effect of each route option on the individual landscape character area is
considered in the context of local landscape sensitivity to derive an overall impact score for the proposals in
accordance with the TAG criteria that are set out in Appendix 2.4. The eight-point scale used to judge is Slight,
Moderate or Large Beneficial or Adverse, Very Large Adverse plus Neutral as set out in TAG.
The overall impact score of the route options on landscape character areas within the study area are
summarised in the following table.
Table 2-6 - Summary of Landscape Effect
Route Option Summary
Purple Landscape Character Area E: South Eastern Uplands
• The proposed route travels through greenfield land for circa. 7.1km through this
character area.
• Horizontal alignment of carriageways travels in close proximity to narrow stream
valleys west of Glenmore. The straight alignment at odds with the pattern of these
valleys. Some field pattern severance.
• Vertical alignment cutting and embankment slopes would lead some disruption to
existing landform.
• The route travels in close proximity to the lower slopes and wooded vegetation of
the system of narrow stream valleys north and west of Glenmore (travels close to
this intimate valley system especially at Mullennahone).
5190130-ATK-ZZ-ZZ-RP-EC-0001 | March 2021
Atkins | 5190130-ATK-ZZ-ZZ-RP-EC-0001 P2 Stage 2 Report V7.0 Page 20 of 69• Significant adverse effects on landscape character of this valley system.
• From south of Ardbeg towards Grogan and Nicholastown the route travels across/
sidelong on the steep side slopes of a locally prominent ridge of higher ground (a
Principal Ridgeline, Refer to Figure 8.3 Landscape Sensitivities, Kilkenny County
Development Plan). The side slopes are integral to the ridge and provide large
scale views over the surrounding countryside. The side slopes of this ridge are
visible from a wide surrounding area extending far to the west, and the route in
this location may be widely visible.
• Will lead to adverse effects on the tranquillity of land and wooded stream valleys
currently located to the west of the existing N25 road and other lands located far
to the west of the existing N25.
• Loss of some areas of woodland, hedgerows and hedgerow trees and loss of
agricultural land.
Landscape Impact Significance: Large adverse (negative) effect
Landscape Character Area C: South Western Uplands
• The proposed route travels through greenfield land for circa. 4km through this
character area.
• Long straight sections of route alignment are at odds with the curved landscape
pattern. Some field pattern severance. Vertical alignment cutting and embankment
slopes would lead to some limited disruption to existing landform.
• Immediately east of Ardbeg this route travels close to a prominent hill of high
ground at Ballinclare. From south of Ardbeg towards Grogan and Nicholastown
the route travels across/ sidelong on the steep side slopes of a locally prominent
ridge of higher ground (a Principal Ridgeline, Refer to Figure 8.3 Landscape
Sensitivities, Kilkenny County Development Plan). The side slopes are integral to
the ridge and provide large scale views over the surrounding countryside. The
side slopes of this ridge are visible from a wide surrounding area extending far to
the west, and the route in this location may be widely visible. Significant adverse
effects on side slopes of ridge of high ground from Ardbeg to Grogan and
Nicholstown.
• Will lead to adverse effects on the tranquillity of land currently located to the west
of the existing N25 road.
• Loss of some areas of woodland, hedgerows and hedgerow trees and loss of
agricultural land.
Landscape Impact Significance: Large adverse (negative) effect
Landscape Character Area C2: South Hills Transition Area, South
• The proposed route travels through greenfield land for circa. 400m through this
character area.
• Route travels across/ sidelong on the steep side slopes of a locally prominent
ridge of higher ground (a Principal Ridgeline, Refer to Figure 8.3 Landscape
Sensitivities, Kilkenny County Development Plan). The side slopes are integral to
the ridge and provide large scale views over the surrounding countryside. The
side slopes of this ridge are visible from a wide surrounding area extending far to
the west, and the route in this location may be widely visible.
• Loss of some areas of woodland, hedgerows and hedgerow trees.
• Will lead to adverse effects on the tranquillity of land currently located to the west
of the existing N25 road.
• Loss of some areas of woodland, hedgerows and hedgerow trees and loss of
agricultural land.
Landscape Impact Significance: Moderate adverse (negative) effect.
Overall Landscape Impact Significance (all landscape character areas combined): Large
adverse (negative) effect.
Navy Landscape Character Area E: South Eastern Uplands
5190130-ATK-ZZ-ZZ-RP-EC-0001 | March 2021
Atkins | 5190130-ATK-ZZ-ZZ-RP-EC-0001 P2 Stage 2 Report V7.0 Page 21 of 69• The proposed route travels for circa. 9.5km through this character area of which
circa. 6.8km of carriageway will cross through greenfield land and circa. 2.6km
online.
• Vertical alignment cutting and embankment slopes would lead to no significant
disruption to existing landform. No significant areas of cut and fill except for one
area of large fill between chainage; 5800 and 6280 (Max depth fill 14m). In
general, the route follows existing contours/ levels very well.
• Follows the existing N25 road alignment south of Glenmore, thus avoiding effects
on Glenmore and adjacent narrow stream valleys.
• From Ballinclare to south of Davidstown the route continues generally parallel to
the existing N25 road corridor and travels along the lower side slopes of a ridge of
high ground, avoiding the higher contours.
• Travels on higher contours of ridge of higher ground from Davidstown to
Carriganurra, however vertical alignment follows existing contours well and cut
and fill is generally not significant.
• Limited effects to no change on tranquillity. The route travels through areas
already on/ adjacent to the existing N25 road corridor. The traffic on the existing
N25 road already affects tranquillity.
• Loss of some areas of woodland, hedgerows and hedgerow trees and loss of
agricultural land.
Overall Landscape Impact Significance: Slight adverse (negative) effect
Magenta Landscape Character Area E: South Eastern Uplands
• The proposed route travels for circa. 9.3km through this character area of which
circa. 4.1km of carriageway will cross through greenfield land and circa. 5.2km
online. Generally, the route follows the existing N25 alignment towards
Ballyrownagh. Thus, avoiding effects on; Glenmore, narrow stream valleys and
ridges of surrounding higher ground either side of the existing N25 Road.
• The route diverts west from the existing N25 towards Carriganurra. At
Carriganurra the route travels close to a local rock outcrop (with cross on top)
which is a prominent local landmark. With mitigation this landmark may be
successfully integrated.
• Limited effects to no change on tranquillity. The route travels through areas
already on/ adjacent to the existing N25 road corridor. The traffic on the existing
N25 road already affects tranquillity.
• Loss of some areas of woodland, hedgerows and hedgerow trees and loss of
agricultural land.
Overall Landscape Impact Significance: Slight adverse (negative) effect
Red Landscape Character Area E: South Eastern Uplands
• The proposed route travels for circa. 9.0km through this character area of which
circa. 8.65km of carriageway will cross through greenfield land. Most of the route
within this character area travels in lands to the east of the existing N25 Road (up
to 2.8km distance to the east of the existing N25 Road in places). Horizontal
alignment of carriageways would be in keeping with existing route patterns.
However vertical alignment cutting, and embankment slopes would disrupt
existing landform. In particular; where the route travels up a steep hillside and
over a stream valley from Craiguenakil to Carrickcloney, there would be significant
adverse effects on the landscape character from fill embankments within this
sloping land which also connects visually with the River Barrow valley.
• Where the route cuts through the side of a ridge of high ground at Aylwardstown
and south to Rathinure, there would be significant adverse effects on this ridge of
high ground and to the character of the wider River Barrow valley landscape.
• Where the route travels through a local valley on embankments between
Rathinure and Redgap and sidelong of a hill in a cutting at Redgap there is likely
5190130-ATK-ZZ-ZZ-RP-EC-0001 | March 2021
Atkins | 5190130-ATK-ZZ-ZZ-RP-EC-0001 P2 Stage 2 Report V7.0 Page 22 of 69You can also read