MONITORING AND EARLY WARNING PLANNING FOR SELECTED AREA IN SOACHA
←
→
Page content transcription
If your browser does not render page correctly, please read the page content below
PART 3
   MONITORING AND EARLY WARNING
PLANNING FOR SELECTED AREA IN SOACHA
CHAPTER 8 Landslides in Soacha Municipality
8.1 Outline of Landslides
8.1.1 Outline
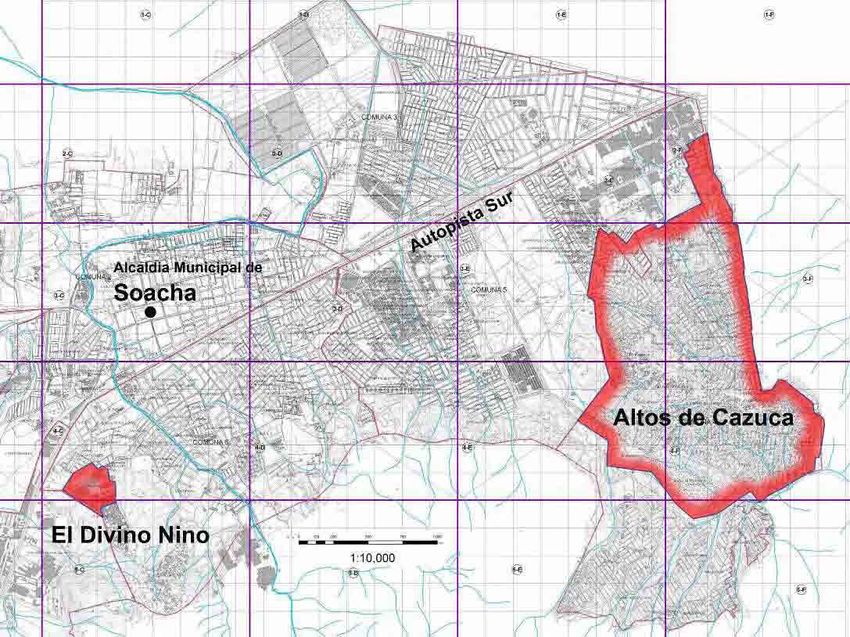
The study areas are parts of commune 4 named Altos de Cazuca area and El Divino Niño area in
commune 6. Altos de Cazuca area located near at the boundary of the southern urban area of Bogota
city is divided into 32 districts named Barrios. El Divino Niño area is one of the “barrios” in commune
6.
Landslides, mostly classified into rock fall and surface collapses, in the study areas are found at
abandoned quarries in Altos de Cazuca area where houses gathered in the upper and lower area close
to steep slopes and landslide hazard areas, also, houses gathered in landslide hazard area formed by a
quarry in El Divino Niño area.
Term “landslide”: the perceptible downward sliding or falling of a mass of earth, rock, or mixture of
the two. The term landslide includes a wide range of ground movement, such as rock falls, deep failure
of slopes, and debris flows.
Figure 8-1 Guide Map of the Landslide Study Areas in Soacha Municipality
The area is underlain by Guaduas Formation (KTg) and Guadalupe Group (Ksglt). Both Guaduas
Formtion (KTg) and Guadalupe Group (Ksglt) covered with Quaternary (Qta) in areas of low
topographic relieves consist of sandstone layers with mudstone layers and some coal layers. These
layers are classified into soft rocks. Ktg and Ksglt are partially covered with high terrace deposit (Qta).
8-1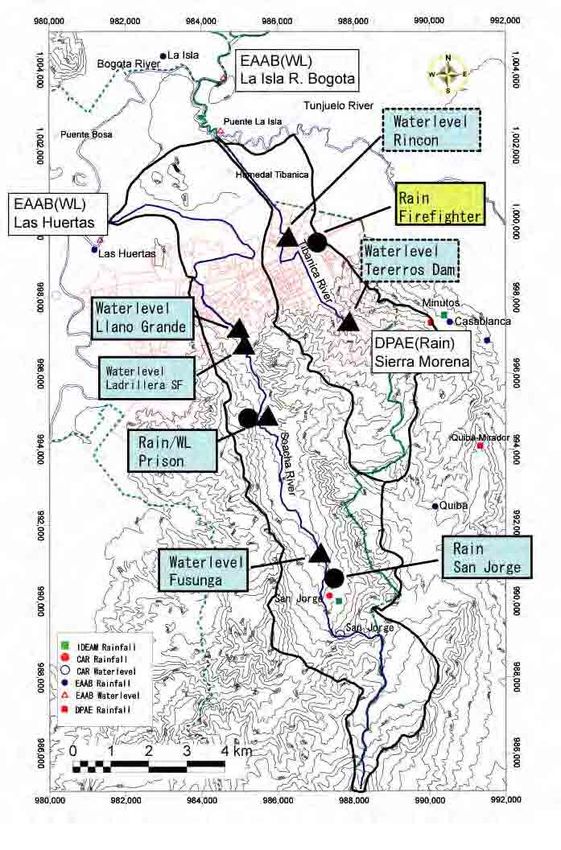
8.2 Existing Studies
8.2.1 Existing Studies
In the study by INGEOMINAS (1996 study in La Capilla area), topography survey was made and
topography map of 1/500 scale with 1-meter interval contour was made. By interpretation of aerial
photos with 1/5,000 scale and field works to identification and mapping of geological and
geomorphologic unit, a geological map of 1/500 scale was made. For subsoil exploration studies, five
lines of geophysical exploration, two trenches, and three borings with depth between from 8 m to 22 m
and laboratory tests were made. The study made four assumed models of rotational landslide hazard
areas and made stability analysis using modified Bishop’s limit equilibrium method. Based on the
results of analysis, it proposed mitigation works for different part of the slope.
INGEOMINAS (2000) study in Villa Esperanza area was made on an emergency visit. The study
undertook a preliminary zoning map of 1/10,000 scale for the short term purpose. The zoning map was
made using hazard zoning map of 1/25,000 by INGEOMINAS in 1988 and a topographic map of
1/10,000 scale in 1989, in which Villa Esperanza is not yet figured.
A study made by National University (2004) basically from the viewpoint of urban planning, it
includes location of infrastructures such as water pipelines
The Study by INGEOMINAS (2006-2007) financed by Soacha Municipality covers the entire
municipality urban area, and is based on geology and geomorphology to identify high risk areas. The
Study was completed as initial stage in 2007.
There are a few more potentially useful but unconfirmed information at the time of preparation of this
document. Hearing from a resident in Villa Esperanza in Altos de Cazuca area mentions a study as
mitigation works by corps of military engineer was made in seven years ago, but the document was
not found. Another one is a study by Medicos Sin Frontera that was mentioned elsewhere, but is not
yet found so far. Any study regarding El Divino Niño area was not found elsewhere. Any significant
landslide monitoring has not been implemented by Soacha Municipality.
8.2.2 Past Disasters
Some statistical data have been prepared even though records of individual disasters have not been
prepared properly. There are some descriptions about landslides in the area as follows;
According to a study by the Chamber of Commerce cited in the report of Soacha Municipality in 1992,
16,500 people lived in Altos de Cazuca area and 228 people in Villa Esperanza at that time. It was also
reported that 163 people or 37 families needed urgent evacuation.
In Villa Esperanza, the study by INGEOMINAS in 1988 already mentioned the area as high risk area.
Due to the rainy season at the end of 1999, landslide occurred in January 6, 2000. Emergency visit and
study was made in February 29, 2000 by INGEOMINAS.
In 2001, historical landslide records in recent years in Soacha were compiled by Ingeniería y
Geotecnia Ltda. (IGL) in JICA study. The purpose was to develop a slope disaster database in Bogota
and eight municipalities in Cundinamarca department using uniform format.
In El Divino Niño area, there was a fall of a rock larger than one meter in size in 2004, with no human
injury.
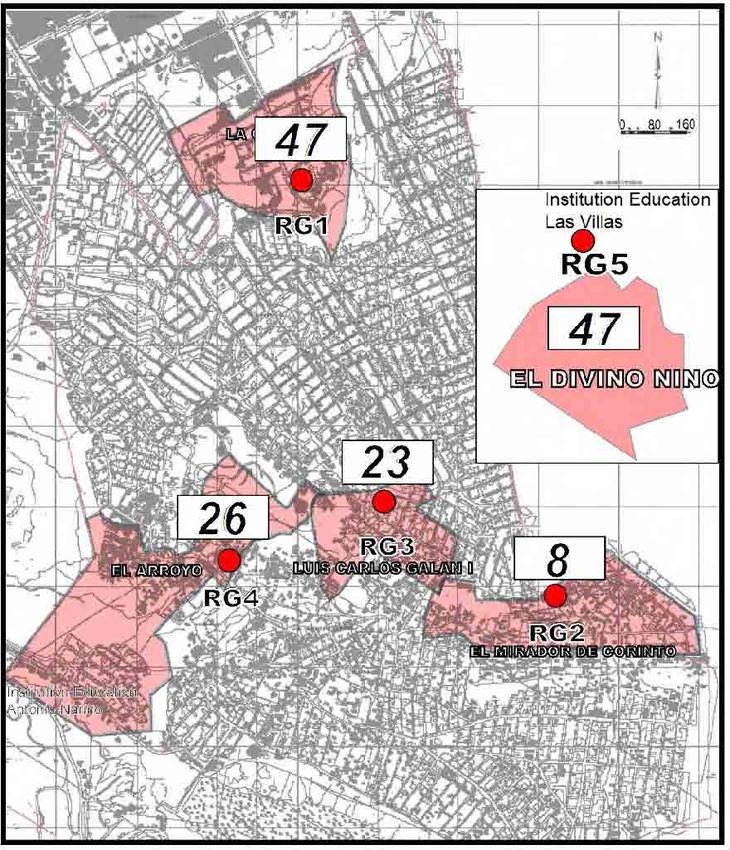
According to the record of fire fighter response to landslide disasters in the municipality in last 5 years,
nine times of dispatches to La Capilla area in Altos de Cazuca area were most, and five times of
dispatches to El Divino Niño area were second.
8-2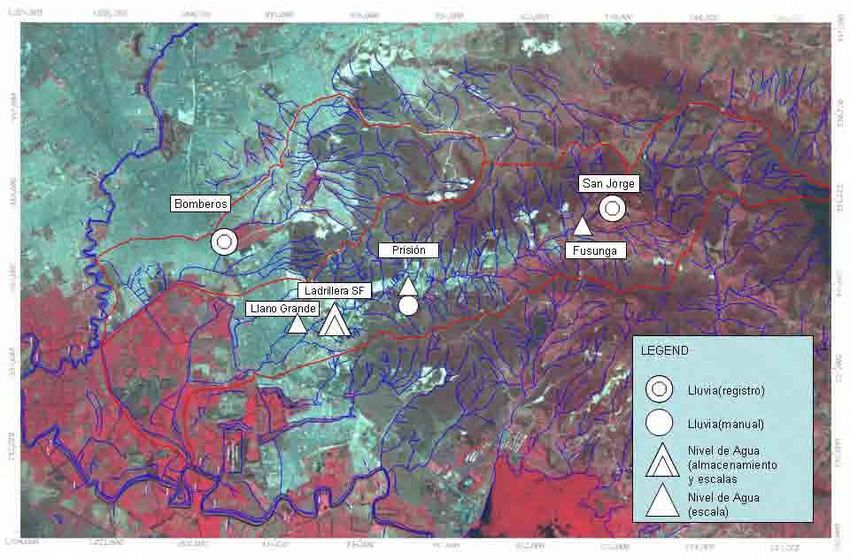
All of above-mentioned descriptions about the landslide in the Soacha Municipality do not show the
spots of affaires.

The Soacha Municipality implements a special survey program after the landslide event of May 11,
2006, in order to estimate the number of inhabitants (families) and houses affected. Social
Development Secretariat was designed as leader for all municipality staffs in order to compile the
social information to provide, initially basic household as sprung mattress, blankets, etc and then, a
monetary subsidy to the families who accepted to be evacuated. At first moment, the municipality
surveyed 1200 families for basic household help and then, almost 700 families were surveyed again
for monetary subsidy. This second survey was directed in Altos de Cazuca area and El Divino Niño
area. The Survey Data Base was done applying a special format, which includes property of land,
inhabitants of houses, structural features, observation results, and priority to intervene. The actual
spots of houses surveyed were specified on the map as shown in Figure S5-2-4 of Supporting Report,
based on names of house owners and address on the format of survey. Most of houses are not only
affected by landslides but also water and mud flows. Generally, lack of slope protection after
exploitation and improper treatment of sewage water due to shortage of sewer system can be major
inducing factors. The average annual rainfall for several years at nearby Casablanca station by EAAB
is 575 mm (INGEOMINAS, 1996). The rainfall has not been a major inducing factor in general.
However, the rainfall in May 2006 was so heavy that this could be main inducing factor.

8.2.3    Critical Areas in the Study Area

According to the statistic record mentioned above, the number of residential houses that suffered from
landslides especially in La Capilla area of Altos de Cazuca area and El Divino Niño area is highest in
Soacha Municipality. Prompt measures should be taken to protect people in these areas.

8.3     Landslide Maps

8.3.1    Inventory Survey

Rock fall, collapse, mass movement and mudflow are seen in the study area, Altos de Cazuca area and
El Divino Niño area.

(1) Existing slope disasters

A disaster inventory survey in Altos de Cazuca area and El Divino Niño area was carried out by
aerophoto analysis and site reconnaissance. The results of the disaster inventory survey are shown in
Disaster Inventory Map which is compiled in the attached figures of Supporting Report S5. The map
shows existing steep slopes, mass movement, traces of collapses and traces of mud flows. Steep slopes
were formed in abandoned quarry and with 30 degree inclination do not constitute disasters, however,
rock falls and surface collapses occur frequently on the steep slopes.

8.3.2    Steep Slopes in Abandoned Quarries

Steep slopes in the abandoned quarries represent the most critical conditions among many disasters in
Altos de Cazuca area. In this project, only steep slopes in the abandoned quarries are the object of the
studies, since INGEOMINAS is studying landslide disasters in the areas based on an agreement
between Soacha Municipality and INGEOMINAS, and steep slopes in the abandoned quarries are
most critical areas with respect to mass movements and others.

(1) Phenomenon on Steep Slopes

The features of the steep slopes in abandoned quarries are as follows;

a) Quarries which were exploited in the 50’s and 60’s to obtain sand and clay from geological layers,
   therefore slopes in abandoned quarries are very steep and they are mostly gentle above and below

                                                 8-3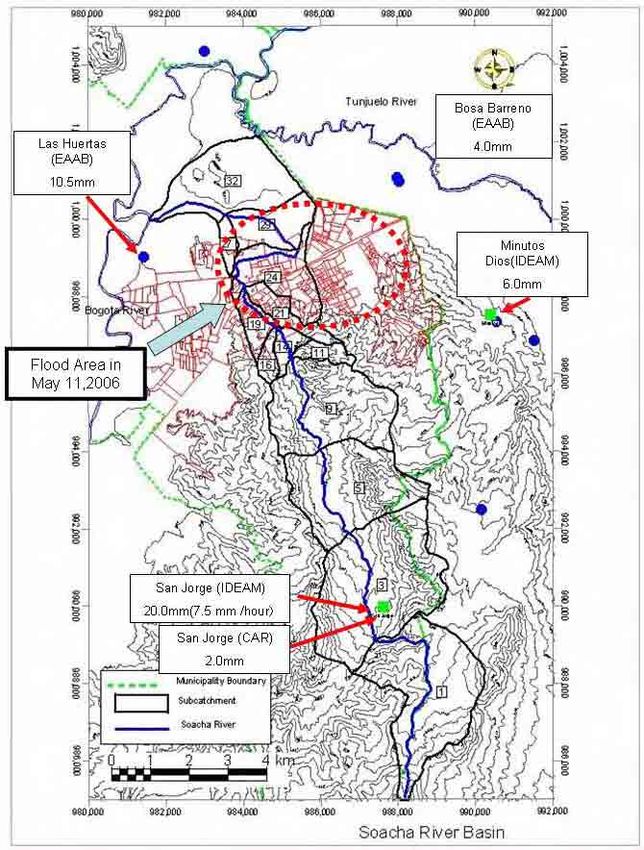
the slopes.

b) Because above and below the slopes are gentle, it is easier to build houses there. There are many
   residential houses close to the steep slopes. Most of these residential houses are illegal, and most
   of residents in the houses are not well-off economically.

c) Small rock falls and collapses occur frequently on the slopes.

d) The areas are underlain by alternation of sandstone and mudstone as base rocks in the areas. The
   base rocks exposed on the steep slopes are soft rocks (geotechnical term; compression strength
   (qu) < 40N/mm2) with cracks. It easy for soft rocks to be weathered, and sometimes gully erosion
   can be seen on the slopes.

e) Therefore rock falls or small collapses could occur in future and larger collapse or mass movement
   may occur on steep slopes. This is hazardous for residents living close to the slopes.

8.3.3   Critical Zones in El Divino Niño area and La Capilla area

In the study area, Critical Zones has been set to verify the critical area in the barrios, El Divino Niño
area and La Capilla area in Altos de Cazuca area where houses are dense, slopes are high and
landslides occur frequently.

(1) Setting of Critical Zones

The Critical Zones are set above and below the steep slopes. Steep slopes are defined in the Study as
steep slopes of over 5 m in height with an incline of over 30 degrees formed through quarrying.
Critical Zone is defined as the area within the distance of twice of the slope height (2h) from toe of the
slope and the area within the same distance as the slope height from top of the slope as shown in
Figure 8-2.

                         Figure 8-2 Definition of Critical Zone of Steep Slope

(2) Critical Zones in El Divino Niño area and La Capilla area

Critical Zone in El Divino Niño area is shown in the Figure below. Maxim height of the steep slope is
about 40 m, and Critical Zone is extended to a maxim of 80 m from the slope. Many houses are
involved in Critical Zone.

Critical Zone in La Capilla area is shown in Figure 8-4. Maxim height of the steep slope is about 40 m,
and Critical Zone is extended to a maxim of 80 m from the slope. Many houses are involved in Critical
Zone.

                                                  8-4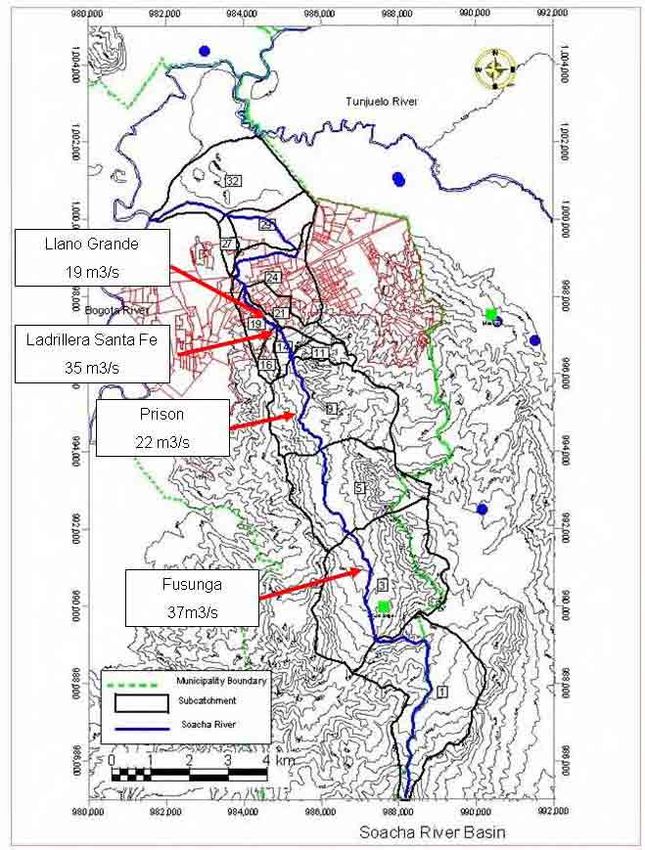
Figure 8-3 Critical Zones in El Divino Niño area

                Figure 8-4 Critical Zones in La Capilla area in Altos de Cazuca area

(3) Setting of Emergency Zone

Soacha Municipality introduced a scheme for relocation of houses from high risk areas in a disaster
prevention program. The Critical Zone maps could provide useful information for Soacha
Municipality’s relocation scheme. It is obvious, however, that the early relocation of houses in the
Critical Zones in El Divino Niño area and La Capilla area is difficult, since many houses are settled in
the Critical Zones. For the information of the relocation scheme of Soacha Municipality, the
Emergency Zone is set in the Critical Zones in El Divino Niño area where is found the most critical

                                                 8-5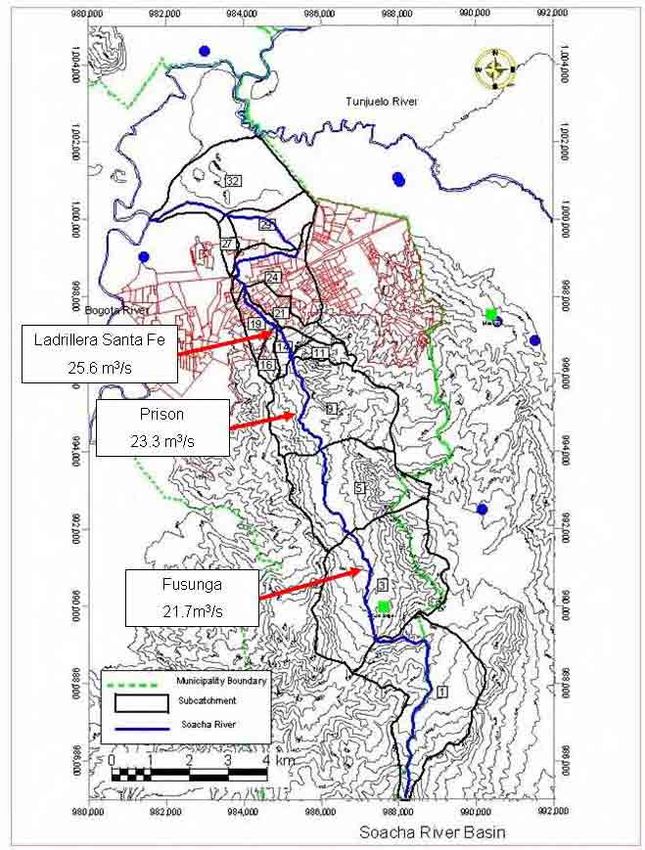
area in Soacha city. It is imperative that the houses in Emergency Zone be relocated urgently. The
criterion of Emergency Zone should be within the limits of 10 m or 2 houses from toe of the slope as
shown in Figure below; however, a final decision of Emergency Zone in El Divino Niño area was
done by the Study Team with site survey. The Emergency Zone in El Divino Niño area is shown in
Figure 8-6.

                      Figure 8-5 Definition of Emergency Zone of Steep Slope

                         Figure 8-6 Emergency Zone in El Divino Niño area

8.3.4   Community Hazard Map

For the relocation program in El Divino Niño area, the relocation of all people from Critical Zones and
even from the Emergency Zones may take a long time. Therefore, it is important to protect the peoples
who stay in the Emergency and Critical Zones until they are relocated. To do end, the people should
know whether they are settled in the zones or not using the Critical Zone Maps. The public in the
zones should be well informed by referring to Community Hazard Map attached.

a)   People in Emergency Zones and Critical Zones are always exposed to danger.
b)   People should always watch any unusual things on the slopes.
c)   People should take care of the slopes in case of rain.
d)   If people find any unusual occurrence on the slopes during rain or even in case of fine weather,
     they should inform Soacha Municipality and seek refugee according to their own judgments.

                                                 8-6
8.4     Measures for Critical Zones

8.4.1    Consideration of Structural Countermeasures

Many houses were built and many people lives near the toe and upper part of steep slopes formed
through mining in Soacha municipality. Rock falls and slope collapses frequently occur in this area
even in case of fine weather as well as in rainy weather. These areas have suffered from not only rock
falls and slope collapses but from also large mass movements. It is known that quarries, which were
exploited until about 50 years ago, triggered the mass movement in Altos de la Estancia in the capital
district of Bogota. In Villa Esperanza in Soacha municipality, in order to prevent the mass movement
occurred at the abandoned quarry, earth-filling works were implemented by the army. It is quite
difficult to stop the movement of landslide once it is generated by human activities because the
imbalance of landslide body is substantially larger than in any natural circumstances. For example in
El Divino Niño area, the steep slopes are covered with clayey material created during the weathering
of sandstone and mudstone. Cuboid blocks and boulders through the development of cracks on
outcrops can be observed on the slope. These blocks and boulders can fall in situation of rock fall or
slope collapses. In addition, open cracks observed on the slopes indicate that the entire body of the
slopes have been continuously moving from the past. Therefore, it is necessary to pay attention to the
phenomena of transition to mass movement.

It is well known that small-scale slope cut and excavation can trigger mass movements in which slopes
have similar topographical and geological conditions to Altos de la Estancia. In reality in Altos de La
Estancia, slope cutting and excavation through human activities promoted transition phenomena, and
finally triggered the mass movement. Consequently, further cutting on steep slopes in abandoned
quarries should not be carried out because the slope is deemed an unstable condition caused by the
former quarry activities. For the emergency protection works against rock fall and slope collapse, it is
effective to form gentle slopes in order to limit the scale of the rock falls and slope collapses
phenomena.

However, forming gentle slopes corresponds to the removal of toe of the slope and this activity
increase the risk of mass movement. In that case it is impractical from the viewpoint of prevention of
landslide. It is difficult to stop the mass movement after the effect of human activities as for the mass
movement which is relatively small as observed in Villa Esperanza. It is theoretically possible to form
gentle steep slope with the landslide prevention works such as piling works and anchors, but these
stabilization works are quite expensive. As a basic rule, these expensive works should be done after
the completion of counter-weight filling works at the toe of landslide. These works would be of
large-scale on flatland where many houses are presently settled and it would be similar to recovery
works to the original land shape. Therefore the “emergency protection works” on steep slopes in
abandoned quarries in El Divino Niño area and Altos de Cazuca area are impracticable to implement
from the technical viewpoints.

8.4.2    Recommendation to Mitigate Landslide Damages

As a measure against slope disasters on steep slopes in abandoned quarries, it is recommended to
relocate people from the Critical Zones. The houses found close to the steep slopes should be relocated
to safe areas, outside the Critical Zones. The relocation programs should be realized in the following
order, because it could take a long time to relocate from many Critical Zones in which there are many
houses.

   a)    People in the Critical Zones should be relocated. A priority of relocation should be given to the
         people settled in the most hazardous area of the Critical Zones.
   b)    Until all the people in the Critical Zones are relocated, Soacha municipality should take care
         of safety of people remaining in the Critical Zones.
   c)    People remaining in the Critical Zones should be informed that they are found in the Critical

                                                   8-7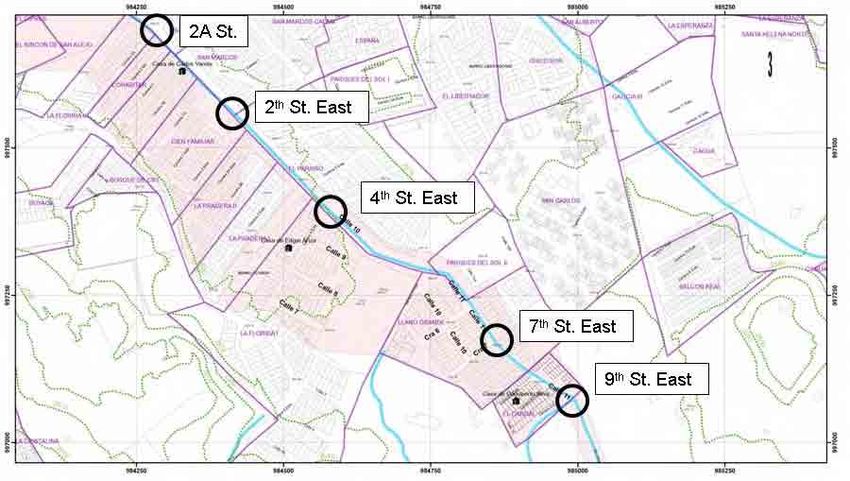
Zones and they may be affected by danger even in case of fine weather.
    d) In case of heavy rain, Soacha municipality should stay on the alert for people found in the
        Critical Zones
    e) To obtain the basic information about the alert level of rainfall, Soacha municipality should
        collect rain fall data.
However, further investigation for possibility of measure works on each steep slope is recommendable
after completion of all relocation program from Emergency Zones before commence of the relocation
program from Critical Zones.

8.4.3   Process for Relocation

The relocation from all Critical Zones in Soacha municipality is necessary to protect the people’s lives
and properties. It could take a long time to complete the plan, and the relocation from more hazardous
areas is necessary observing the following measures.

    a) Complete the relocation program from Emergency Zone in El Divino Niño area
    b) Set up Emergency Zones in La Capilla area. (Critical Zones in La Capilla area have been set
       up in the study. Figure 8-4).
    c) Proceed with the relocation program from Emergency Zones in La Capilla area in accordance
       with the process in El Divino Niño area.
    d) Set up Critical and Emergency Zones in El Arroyo area (Villa Esperanza area) where they are
       surrounded by steep slopes formed by mining activities too.
    e) Proceed with the relocation program from Emergency Zones in El Arroyo area (Villa
       Esperanza area) in accordance with the process in El Divino Niño area.
    f) Set up Critical and Emergency Zones in other areas where steep slopes in abandoned quarries
       are found (refer figure attached below), and proceed with the relocation program from the
       Emergency Zones.
    g) After the completion the relocation program from the Emergency Zones, proceed with the
       relocation program from the Critical Zones in El Divino Niño area, and continue with the
       same orders as relocation program from the Emergency Zones.

                                                 8-8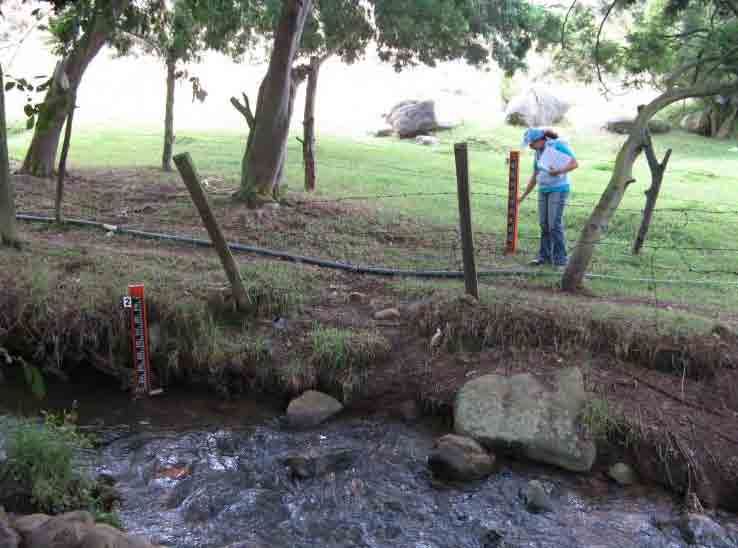
Figure 8-7 Process of Relocation from Emergency Zones

8.4.4   Measures until Completion of Relocation Program

In the process of the relocation program in El Divino Niño area, we found that relocation of people
could take a long time. Therefore, it is important to protect the peoples who stay in the Emergency and
Critical Zones using the Community Hazard Map as mentioned in Section 8.3.4.

8.4.5   Time Schedule of Measure Works and Monitoring

The recommendable time schedule until 2020 is shown in Figure 8-8.

                                                 8-9
Figure 8-8 Time Schedule of Measure Works and Monitoring
8.5 Pilot Project
8.5.1 Necessity of Precipitation Monitoring and Disaster Records
(1) Background
Many landslide disasters occurred during or after heavy rain in Altos de Cazuca area and El Divino
Niño area in Soacha Municipality. In May, 2006, many houses were affected by the slope collapses
and rock falls due to heavy rain. Meanwhile, some landslide disasters occur even in dry season. It may
be true that the rainfall causes many landslides in Soacha Municipality, but this is not certain without
any support data. The information collection of precipitation and disasters are critical for prevention
against the landslide disasters. The following questions should be verified for a future plan of disaster
measures, such as early warning systems serving the people remaining in the Critical Zones.
- Is it true that landslides occur more frequently with heavy rain fall?
- How much rainfall triggers off landslides?
- What type of landslides occurs in case of rainfall?
- Do the relations between rainfall and landslides differ in area by area, or barrio by barrio?
- How many landslides and what type of landslides occur in dry surroundings (without rain)?
- Does occurrence of landslides change by the way of rain fall (less and long / heavy and short)?
- Do intensities of rainfall differ from one small area (barrio) to another?
The relation between rainfall and occurrence of landslides should be studied while collecting
information about precipitation and occurrence of landslides. If we can solve above questions, we
might be able to build early warning system with rainfall monitoring.
8 - 10(2) Purpose
Precipitation monitoring and record of landslides are carried out in order to collect and accumulate the
basic information for analysis of the relation between rainfall and occurrence of landslide and to study
landslide disaster prevention measures especially early warning systems in future. In order to install
the rain gauges as many as possible for the purpose, the simple gauges which are low cost and easy to
be read were installed in the pilot project area. To monitor many rain gauges constantly, the monitoring
works were left to the community in where the rain gauges are installed. It is expected also that
community’s awareness of disaster prevention becomes higher with the monitoring works. The record
of landslide is being carried out by Soacha Municipality, since recording of landslides requests more
expertise.
8.5.2 Method of Precipitation Monitoring
(1) Locations of Installation of Rain Gauges
Precipitation monitoring was carried out in the pilot project area where is Altos de Cazuca area and El
Divino Niño area in Soacha Municipality. Five rain gauges were installed in five schools in the pilot
project area as shown in Table 8-1.
Table 8-1 Locations of Rain Gauges
area gauge no. school barrio
Altos de Cazuca RG1 Institution Educativa Cazuca area La Capilla area
area
RG2 Gimnasio Moderno Colombiano El Mirador De Corinto
RG3 Institution Educativa Luis Carlos Galan Luis Carlos Galan
RG4 Institution Educativa Antonio Narino Sede El Arroyo
El Divino Niño area RG5 Institution Education Las Villas Escuela La Panamericana
For the following reason, the schools are selected for the location of rain gauges installation.
- There are more than one school in Altos de Cazuca area.
- Monitoring can be executed in night time by a security guard as security guards stay in the
schools for 24 hours a day.
- The rain gauges can be protected from burglaries as securities of schools are adequate.
- The rain gauges may be able to be useful for a part of education for school children, and the
children’s awareness of disaster prevention become higher.
(2) Rain Gauge Monitoring
The rain gauge consists of funnel and Cylinders and sub cylinder for reading minutely is attached. It is
very simple rain gauge without any mechanical parts and electric power.
Person who monitor
Basically, monitoring works are carried out by the person in each school who is assigned by the
principal of each school. During the school holiday, the person in charge in each school assigns and
instructs a security person who stays in the school in holiday to monitor the rain gauge.
When
The rain gauges are read three times a day at 6:30, 14:00, and 18:00. The water in the rain gauge is
emptied every time immediately after the rain gauge is read.
Record Format
The record format of rain gauge monitoring is shown on Figure 8-9.
8 - 11Figure 8-9 Rain Gauge Monitoring Record Format
(3) Report
The record should be submitted once a week to Ing. Sandra Vásques of the Soacha municipality. In the
case the accumulate rainfall is more than 20mm/24h, the person who read the rain gauge should call
the firefighter station in Soacha Municipality with following steps.
Excess 20 mm in 24 hours * - Call to Firefighter Station
“Excess 20 mm in 24 hours”
“xx mm in 24 hours from xx:xx hour”
After 20 mm in 24 hours until the rain is over
- Call to Firefighter Station
“Accumulated precipitation is xx mm from xx:xx hour”
(20 mm in 24 hours : normally accumulation of three readings)
8.5.3 Landslide Record
(1) Objective Area
All of landslides in Soacha Municipality should be recorded immediately after the occurrence of the
landslide. Especially, the pilot project areas, Altos de Cazuca area and El Divino Niño area, are
emphasized.
(2) Landslides Recorded
Only the landslides which caused damages to persons, houses, facilities and others are recorded.
(3) Record Format
8 - 12The format is shown in Figure 8-10. Figure 8-11 shows the type of landslides which is to be filled in
the format.
(4) Persons
The format are filled by the engineer immediately after he visited the landslide site, and the following
two persons should be responsible for the record and the custody.
Dr. Iván Demóstenes Calderón*-1 : manager of the landslide record
Ing. Sandra Vásquez*-2 : civil engineer in charge of landslide record
(*-1 Technical Director, Justice Support Direction, CLOPAD’s Coordinator)
(*-2 University Professional, Planning Secretariat, CLOPAD)
(5) Report
The report of monitoring contains an analysis of the relation between the rain fall and the landslide
disasters.
(6) Filing
Record format which has been recorded should be filed in Ing. Sandra Vásques’s office.
Figure 8-10 Landslide Record Format, page 1 (left) and page 2 (right)
8 - 13Figure 8-11 Type of Landslides (Tipo=Type)
8.5.4 Results
(1) Excursion of Precipitation Monitoring
Reading of rain gauge has been done by the school teachers and security guards. In the first stage of
the monitoring, some mistake such as in case of failure of the unit may be found in record sheets. A
reliable monitoring can be achieved after workshop to be held following one month monitoring.
(2) Results of Precipitation Monitoring
Though the precipitation monitoring has been carried out for five months, the precipitation data must
be accumulated for longer periods in order to have information on rainfall. At the moment, the
following situation is observed in the monitoring.
Figure 8-12 Monthly Precipitation in September and October
a) Monthly precipitations in August occur more frequently than in September. This shows different
trends from the average normal year.
b) Monthly precipitations are different in each point in August, and are not different in each point
in September.
c) Maximum monthly precipitations were observed with RG-4 by 141.8 mm in October 2007.
8 - 14d) Maximum daily precipitations were observed with RG-4 by 58.2 mm on 13th October. 2007
e) With a lower altitude, rainfall will fall more frequently especially in August.
Figure 8-13 Monthly Precipitation of September at Each Monitoring Points
(3) Relation between Precipitation and Landslide Disasters
Three landslide disasters occurred in the period from 13th October 2007 to 15th October 2007 in Los
Robbles, Terranova and La Capilla area in Altos de Cazuca area. Rain continued falling intermittently
from 6th October to 14th October in Altos de Cazuca area. The nearest rain gauge points to Los Robbles
is RG-4, to Terranova is RG-3 and to La Capilla area is RG-1. According to Figure 8-14, an excess of
20 mm of accumulate precipitation may be appropriate for Alert Level 1 and an excess of 50 mm of
accumulate precipitation may be appropriate for Alert Level 2.
8 - 15Figure 8-14 Precipitation before Landside Disasters in October 2007
8 - 16CHAPTER 9 FLOOD
9.1 Rivers in Study Area
The Study Area in Soacha Municipality covers the Soacha River and the Tibanica River. The
catchment area of the Soacha river and the Tibanica river is 44.3 km2 and 19.2 km2, respectively.
The Soacha River is a tributary of the Bogota River, which is joining at Las Huertas upstream. The
length of the Soacha river is 24 km, originating from San Jorge whose elevation is about 3,300 m
above sea level. Figure 9-1 shows the longitudinal profile of the Soacha River. At 11.5 km from the
Bogota river, there is a step which is corresponding to the end of glacial gorge. From 10.0 km, the
river is running down in the alluvial area.
Annual rainfall in San Jorge (IDEAM) which is located in the upper part of the Soacha river is 691
mm as an average value between 1960 and 2002.
Perfil de Rio Soacha
3,300
3,200
24+007 Vereda San Jorge
3,100
17+673 ICA entrance
3,000
Elevacion (m)
11+676 Prison
2,900
9+335 Ladrillera Santa Fe
7+877 Autopista Sur
1/18
2,800
6+827 El Silo
0+000 R.Bogota
2,700
1/50
2,600
1/1650 1/400 1/175
2,500
0 5,000 10,000 15,000 20,000 25,000
Distancia (m)
river bed left bank right bank
Figure 9-1 Profile of Soacha River
The reach between Ladrillera Santa Fe (a brick company) and Autopista Sur used to be wetland
according to the aerial photo in 1941. In this reach at present the Soacha river is straight along the
right edge of the previous wetland.
The area downstream of El Silo (6+827) can be regarded as within the floodplain of the Bogota River
and low-lying area. The present river course of the Soacha river is running as such it is avoiding the
low area. In this low area there are some residential areas such as El Silo. Figure 9-2 shows the most
downstream reach of the Soacha river. The ground elevation is lower than the river bed elevation in
some sections. It is regarded that the present river course was made selecting the higher location in
order to make the drainage of the Soacha river itself easily, however, it means that the surrounding
area is always lower than the Soacha river waterlevel resulting into the frequent inland flood when it is
raining.
9-1Profile between Rio Bogota and El Silo
2561
6+827 Soacha St.(El Silo)
2560
0+000 Rio Bogota -Las Huertas
2559
2558
2557
2556
2555
2554
2553
2552
2551
2550
Elevation (m)
2549
2548
2547
2546
2545
2544 1/400
2543
2542
2541
2540
1/1650
2539
2538 1/750
2537
2536
2535
0 500 1000 1500 2000 2500 3000 3500 4000 4500 5000 5500 6000 6500 7000 7500 8000 8500
Station (m)
River Bed Left Bank Right Bank Left GL Right GL
Figure 9-2 Profile of Downstream of Soacha River
The Tibanica River (it is called Claro River in the downstream reach of Autopista Sur) is a tributary of
the Tunjuelo River, which is joining at Punete La Isla. In the upstream there is Tererros Dam, which
was constructed in 1950’s for irrigation purpose. The length of the Tibanica river is 6.6 km, starting
from the spillway of the Terreros Dam whose elevation is about 2,614 m above sea level (IGAC
datum). The surface area is about 17.5 ha and the storage volume is 1,200,000 m3. However at present
the dam is filled up until spillway crest.
Figure 9-3 shows the longitudinal profile of the Tibanica River. From the dam to Autopista Sur, the
bed slope is 1/50 to 1/140. From the Autopista Sur to the Tunjuelo River confluence the riverbed is
quite mild, 1/1,000 to 1/2,800.
In the downstream of Autopista Sur, the present Tibanica river is canalized (excavated and
straightened) in the urban area, however, due to the flat topography and sedimentation, small scale
inundation can easily happen by local rainfall.
Longitudinal Profile of Tibanica River
2,630
6+635 Spillway
3+603 Autopista Sur
0+000 Tunjuelo R.
2,620
2,610
2,600
2,590
Elevation (m)
2,580
2,570
2,560
1/50
2,550
2,540 1/140
1/2800 1/1000
2,530
0 1000 2000 3000 4000 5000 6000 7000
Distance from Tunjuelo River (m)
River Bed
Figure 9-3 Profile of Tibanica River
9-2Figure 9-4 Catchment of Soacha River and Tibanica River
9-39.2 Past Floods
9.2.1 Investigation of Past Floods
(1) Newspaper “El Tiempo” Article
The Study Team collected the recent newspaper articles of “El Tiempo”, which is one of the major
newspapers in Colombia, regarding the inundation, stream names in the study area and landslide.
The total number of the articles is one hundred two (102) since 1992.
It was found that in Soacha there were flood disasters in December 1992 and May in 2006.
According to the article dated on December 13, 1992, one dead person, more than 12 districts of Bosa
and one part of its industrial sector was affected, the same as one Soacha neighborhood. The strong
Wet Season that is affecting the capital of the country caused one person’s death and left 20 families
damaged, and affected twelve neighborhoods most of them Soacha districts and one Soacha
settlement.
In Soacha Municipality, they suffered from serious flood on May 2006, which was the most serious
flood in recent 20 years. It is regarded as the maximum flood in Soacha on people’s memory. In order
to confirm the frequency and magnitude of the past floods, the interview for affected people and
collection of local newspaper articles were considered in this Study.
(2) Interview Survey
The Study Team undertook an interview survey for past flooding in Soacha on September 2006. In
Soacha, they suffered from serious flood on May 2006, which was the most serious flood in recent 20
years. The Study Team assumed that people in Soacha remembered the latest flood very well, so
prepared the questionnaire focusing on the May 2006 flood as shown in Figure 9-5.
The Study Team organized two (2) teams for the interview survey, one team composed of two (2)
researchers and one (1) car with driver. The Study Team received information on the past affected
areas such as barrio name from the Soacha City in advance. Based on that information, the Study
Team made schedule for the interview survey. The survey was conducted by visiting of houses in the
affected area, however for selecting houses to be interviewed, the Study Team asked JAC leader for
their advice.
The total number of houses which the Study Team visited in this Study is about two hundred (200).
The interview results table for the Soacha city is attached in Supporting Report S6.
The total number of barrios which the Study Team made interview is seventy one (71). Among them,
twenty three interviews were done in El Cardal and Llano Grande where the inundation depth was
over 1 m in May 11, 2006.
9-4Table 9-1 List of Barrios which the Interview was made by the Study Team
Date and Time
Interviewer
Name of Barrio / address
Name of Interviewee
1. General
How many years have you lived in
the house?
How many times have you suffered
from inundation in the house?
Which were the year and month in Year Month
which you suffered from those Year Month
inundations?
When was the maximum (most
serious) flood in your house ?
2. May 2006 flood
Do you remember the day and time May XX, AM/PM
of the highest waterlevel ?
If you have some marks of the ZZ cm above the floor
waterlevel, please show me ? YY cm above the ground.
How many hours did the high hours
waterlevel last ?
Did the flood water include
sediment? If it did, what kind of
sediment it was ?
Did you evacuate to other places ? If
so, where ?
What kind of damage did you suffer
from ? If you can estimate the
damage, how much was it ?
3. Other flood
Do you remember the day and time May XX, AM/PM
of the highest waterlevel ?
If you have some marks of the ZZ cm above the floor.
waterlevel, please show me ?
How many hours did the high hours
waterlevel last ?
Did the flood water include
sediment? If it did, what kind of
sediment it was ?
Figure 9-5 Interview Sheet for Soacha
9-5Figure 9-6 shows the inundated area in the May 2006 flood according to the interview results. The
Soacha River was affected more heavily than the Tibanica river. At San Jorge Station (IDEAM,
self-recording gauge) the daily rainfall 20 mm was recorded on May 11, 2006. The hourly rainfall was
7.5 mm from 8:40AM, May 11, 2006. The most seriously affected area in the Soacha river was Llano
Grande, which is located in the left bank of the upper stream of the Autopista Sur. The maximum
inundation depth was slightly higher than 1 m. A child was rescued by boat supplied by the Soacha
firefighter. The area around Llano Grande is lowland area compared with the Soacha River. The
Soacha River is affected by the sediment runoff from the upstream area, especially from the brick
factories. So, that the river bed has been getting higher due to the sedimentation, which causes a flood
easily. According to the interview results, the inundation was caused by the backwater of sewerage
pipe from the river.
The most downstream reach of the Soacha River near the confluence to the Bogota River was also
inundated; however, this area is rural area such as livestock farming area.
Tibanica
Soacha
Figure 9-6 Inundation Area by Flood in May 11-12, 2006 in Soacha
In the Tibanica basin, the upstream and the downstream of the Autopista Sur were affected locally.
According to a Soacha City official, because of the lack of capacity of culvert passing the Autopista
Sur, the same areas have suffered from inundation very frequently. In the Tibanica basin, there is the
Terreros Dam in the middle part, which has flood water storage function. It is regarded that at May
2006 flood the Terreros Dam was effective, however, local improper drainage system caused
inundations.
9.2.2 Characteristics of Floods
(1) Soacha River
There are three (3) main flood-prone areas in the Soacha river. One is El Cardal to Autopista Sur,
Another is the area around El Silo. And the rural area neat the confluence of the Bogota river is also
flood-prone area.
9-6The area between El Cardal and Autopista Sur used to be wetland of the Soacha river, according to the
aerial photo in 1941. The present residential area is low-lying area along the Soacha river. The
inundation usually starts inland flood, sewage water returning from the river side because of the
low-elevation. The May 2006 flood was very serious inundation because the inundation was caused by
the overflow of the Soacha river. The flooded water remained in the low-lying area for several hours.
The more frequent flood can be said the inland flood such as backwater of sewage system and water
accumulation in the low area.
The area around El Silo is located at very low elevation compared with the Soacha river channel. El
Silo is a residential complex area. According to the digital elevation map near this area, it was found
that El Silo and El Danubio, El Prado de las Vegas are located at lower than the Soacha river.
Therefore once the Soacha river overflows, the flood water are going toward these barrios.
The rural area neat the confluence of the Bogota river is also low-lying area. The river bed of the
Soacha river is higher than the ground, so when the river water is high, the surrounding area suffers
from inland flood easily. Also this rural area is affected by the Bogota river high water.
(2) Tibanica River
The Tererros Dam is regulating the rainfall runoff from the upper part of the Tibanica river. According
to the EAAB’s Soacha Master Plan, the outflow from the Dam for 100 years return period is only 2.7
m3/s. In this sense, the inundation in the area downstream of the Dam is caused by the local rainfall
itself.
The flood-prone area is concentrating in the area around the Autopista Sur. Since the channel slope is
milder than 1/1,000 in that area and the channel crossing structure such as bridge culvert are affected
by sedimentation and accumulated garbage. Therefore the riverine area is easily affected by local
rainfall stagnation. In present condition, the rainfall runoff from the Cazuca area is accumulating in the
canal along the Autopista Sur, however, due to the small drainage capacity of the crossing structure
under the Autopista Sur, the inundation is quite outstanding.
9.3 Existing Monitoring System
9.3.1 Existing Operated Stations
In and around the Study Area for Soacha, there are several rainfall stations and waterlevel stations.
Figure 9-7 shows the location of monitoring stations in and around the Study Area. They are the
stations of DPAE, IDEAM, CAR and EAAB. The Soacha city does not have its own monitoring
station, even conventional type. Table 9-2 is the list of currently operating stations, of which the Study
Team could collect some data.
Table 9-2 List of Monitoring Stations in and around the Study Area
Area Rain/WL Name Features
Rainfall San Jorge(IDEAM) Conventional gauge with recording chart. Once a
month the data is sent to IDEAM by postal mail.
Upstream area
Rainfall San Jorge(CAR) Conventional gauge with recording chart. It is
of Soacha River
maintained by CAR.
WL San Jorge(CAR) Staff gauge in mountainous creek.
Rainfall Las Huertas(EAAB) Conventional gauge with recording chart.
Bogota River WL Las Huertas(EAAB) Automatic gauge with telemeter system
WL La Isla(EAAB) Automatic gauge with telemeter system
Tunjuelo River WL Puente La Isla (EAAB) Staff gauge
Upstream area Rainfall Sierra Morena(DPAE) Automatic gauge with telemeter system
of Tibanica Rainfall Minutos(IDEAM) Automatic gauge with telemeter system
River Rainfall Casablanca((EAAB) Conventional gauge with recording chart.
9-7The flooding area in May 11, 2006 flood is mainly downstream area of the Soacha river and the
Tibanica river.
In the Soacha river upstream there are San Jorge (IDEAM Climatology), San Jorge (CAR rain) and
San Jorge (CAR waterlevel). Among them the IDEAM San Jorge station has been operated and
maintained well by IDEAM.
In the Tibanica river upstream there are three (3) rainfall stations closely each other, which are Sierra
Morena, Minutos and Casablanca operated by DPAE, IDEAM and EAAB, respectively. They are
located in Bogota city, just on the catchment boundary of the Tibanica river. The Sierra Morena
(DPAE) station is the closest one to the Tibanica river catchment and one of DPAE monitoring stations
with telemeter system.
Along the Bogota river, there are two (2) important waterlevel stations. One is Las Huertas (EAAB)
and another is La isla (EAAB). The Las Huertas station is located downstream of the confluence of the
Soacha river to the Bogota river. The La Isla station is located just upstream of the confluence of
Tunjuelo river to the Bogota river. They are EAAB telemeter stations and the real time data can be
seen in the EAAB web-site.
9.3.2 Soacha City’s Accessibility to Monitored Data
Soacha city does not have any official, routine line to DPAE, IDEAM, CAR and EAAB regarding the
monitored data exchange.
9-8Figure 9-7 Main Monitoring Stations in and around the Study Area
9-99.4 Flood Analysis and Mapping
9.4.1 Conditions of May 11, 2006 Flood
(1) Rainfall Condition in San Jorge (IDEAM)
In the Soacha river basin, IDEAM’s San Jorge Station recorded rainfall during the May 11 flood. San
Jorge station is located in the upstream area of the basin.
The daily rainfall of May 11, 2006 at San Jorge was 20 mm according to IDEAM interpretation of the
self-recording paper.
Figure 9-8 shows the daily rainfall at IDEAM San Jorge since March 2006. In March 8 and March 18,
the rainfalls over than 35 mm per day are registered. The Study Team collected the original
self-recording paper of those days and checked the rainfall amount, however, the ink was not drawn on
the paper clearly and it might be that actual rainfall amount were 10 mm less than the registered
amount.
45
40
35
30
May 11, 2006
Dialy Rainfall (mm)
20mm/day
25
20
15
10
5
0
2006/3/1
2006/3/2
2006/3/3
2006/3/4
2006/3/5
2006/3/6
2006/3/7
2006/3/8
2006/3/9
2006/3/10
2006/3/11
2006/3/12
2006/3/13
2006/3/14
2006/3/15
2006/3/16
2006/3/17
2006/3/18
2006/3/19
2006/3/20
2006/3/21
2006/3/22
2006/3/23
2006/3/24
2006/3/25
2006/3/26
2006/3/27
2006/3/28
2006/3/29
2006/3/30
2006/3/31
2006/4/1
2006/4/2
2006/4/3
2006/4/4
2006/4/5
2006/4/6
2006/4/7
2006/4/8
2006/4/9
2006/4/10
2006/4/11
2006/4/12
2006/4/13
2006/4/14
2006/4/15
2006/4/16
2006/4/17
2006/4/18
2006/4/19
2006/4/20
2006/4/21
2006/4/22
2006/4/23
2006/4/24
2006/4/25
2006/4/26
2006/4/27
2006/4/28
2006/4/29
2006/4/30
2006/5/1
2006/5/2
2006/5/3
2006/5/4
2006/5/5
2006/5/6
2006/5/7
2006/5/8
2006/5/9
2006/5/10
2006/5/11
2006/5/12
Date of 2006
Figure 9-8 Daily Rainfall in San Jorge (IDEAM) in 2006
The Study Team checked the original recording paper on May 2006. The maximum hourly rainfall in
May 11, 2006 was 7.5 mm from 8:40AM to 9:40AM according to the self-recording paper.
9 - 10Figure 9-9 Daily Rainfall in San Jorge (IDEAM) in 2006
(2) Flooding Time in Soacha River
The flood level at Fusunga was about 50 cm above the left -bank ground elevation. The peak water
level took place at 11:45 AM on May 11, 2006 and lasted about 4 hours according to a resident living
at the riverside. In the photo below, the water level was just 1 meter 40 cm on the staff gauge at
8:00AM and the heavy rainfall happened at 10:30 AM on that day.
9 - 11Photo 9-1 Flood Level of Fusunga Section
3,300
0+000 Bogota R.
6+827 El Silo
11+676 Prison
17+286 Fusunga
17+673 San Jorge ICA
7+877 Autopista Sur
8+972 Llano Grande
9+335 Ladrillera Santa Fe
Rainfall at San Jorge
7.5mm/hr at 9AM
3,200
24+007 Vereda San Jorge
3,100
Flooding in Fusunga
3,000 11:45AM
Flooding May 11, 2006
Elevacion (m)
grazing land、rural area urban area
2,900
Llano Grande
Flooding
1/18
2,800 11AM-12AM
2,700
1/50
2,600
1/1650 1/400 1/175
2,500
0 5,000 10,000 15,000 20,000 25,000
Distance from Bogota River confluence (m)
river bed left bank right bank
Figure 9-10 Flooding Time in May 11, 2006 in Soacha River
The flooding in Llano Grande (El Cardal to Autopista Sur) took place from 11AM to 12AM.
According to the communities in Llano Grande, there was no rain in their area and the river overflow
suddenly happened.
9.4.2 Channel Capacity and Flood Discharge
(1) Flood Discharge
The Study Team obtained flood elevation by interviewing to the communities regarding May 11, 2006
flood in the Soacha River. The locations are Fusunga, Prison, Ladrillera Santa Fe and Llano Grande.
The area between El Cardal to Autopista Sur has quite a few flood marks.
9 - 12For Fusunga, Prison, Ladrillera Santa Fe and Llano Grande, the flood peak discharges were assumed
by uniform flow calculation.
Fusunga Station (17+286)
4.0
3.5
staff gauge
Nivel de Agua 3.0m
3.0
May 11, 2006 Maximum Level 2.5m
2.5
Staff Gauge (m)
Nivel de Agua 2.0m
2.0
1.5
staff gauge
1.0
0.5
0.0
-10 -5 0 5 10 15 20
Station (m)
Figure 9-11 Cross Section and Flood Elevation at Fusunga
Fusunga Station (17+286)(0+054)
3.5
3.0
May 11, 2006
Flood Level 2.5m
2.5
Gauge (m)
2.0
1.5
Assumed discharge
37 m3/s
Slope 1/18
1.0
0 20 40 60 80 100 120 140 160 180 200
Discharge (m3/s)
Figure 9-12 Waterlevel and Discharge Curve at Fusunga
9 - 13Prison Station(11+676)(0+053)
7.0
6.0
5.0
staff gauge
Staff Gauge (m)
May 11, 2006 Maximum Level 3.4m
4.0
waterlevel 3.0m
3.0
waterlevel 2.0m
2.0
staff gauge
1.0
0.0
-20 -15 -10 -5 0 5 10 15 20 25 30
Station (m)
Figure 9-13 Cross Section and Flood Elevation at Prison
Prison Station (11+676)(0+053)
5.0
4.5
4.0
May 11, 2006 Flood
Level 3.4 m
3.5
3.0
Elevation (m)
2.5
2.0
1.5
1.0
Assumed discharge
0.5 Slope 1/50
22 m3/s
0.0
0 20 40 60 80 100 120
Discharge (m3/s)
Figure 9-14 Waterlevel and Discharge Curve at Prison
9 - 14Ladrillera Santa Fe Station(9+470)(0+060)
4.5
4.0
May 11, 2006 Maximum Level
3.5
Nivel de Agua 3.0m
3.0
Elevation (m)
2.5
Nivel de Agua 2.0m
2.0
1.5
Nivel de Agua 1.0m
1.0
0.5
Limnimetro
0.0
-15 -10 -5 0 5 10 15 20
Station (m)
Figure 9-15 Cross Section and Flood Elevation at Ladrillera Santa Fe
Ladrillera Santa Fe Station (9+470)(0+060)
4.5
4.0
May 11, 2006
Flood Level 3.5 m
3.5
3.0
2.5
Elevation (m)
2.0
1.5
1.0
Assumed discharge
0.5
35 m3/s
Slope 1/70
0.0
0 10 20 30 40 50 60 70 80 90 100
Discharge (m3/s)
Figure 9-16 Waterlevel and Discharge Curve at Ladrillera Santa Fe
9 - 15Llano Grande(8+972)(0+050)
5.5
5.0
May 11, 2006 Maximum Level (4.5m)
4.5
4.0
Staff Gauge (m)
3.5
staff gauge
3.0
2.5
2.0
1.5
-8 -6 -4 -2 0 2 4 6 8 10 12
Station (m)
Figure 9-17 Cross Section and Flood Elevation at Llano Grande
Llano Grande Station (8+972)(0+050)
6.0
5.0 May 11, 2006 Flood
Level 4.5 m
before dredging
4.0
after dredging
Gauge (m)
3.0
2.0
1.0
Assumed discharge
19 m3/s
Slope 1/130
0.0
0 5 10 15 20 25 30 35 40 45 50
Discharge (m3/s)
Figure 9-18 Waterlevel and Discharge Curve at Llano Grande
9 - 16Figure 9- 19 Flood Mark-Assumed Peak Discharge in May 11, 2006 Flood
Figure 9- 19 shows the estimated peak discharge in May 11, 2006 flood based on the flood marks
obtained from the community’s evidence. The Ladrillera Santa Fe and Llano Grande are 500 m apart.
The Ladrillera Santa Fe is so confined section that the peak discharge can be regarded as more reliable.
The assumed discharge at Llano Grande is that of discharge after overflow.
Figure 9-20 shows the calculated peak discharge from the measured rainfall. The measured rainfall is
the distribution of San Jorge station (IDEAM) in May 11, 2006. The rational method was used
considering the concentration time at Fusunga, Prison and Ladrillera Santa Fe. The peak discharge at
Prison and Ladrillera Santa Fe seems lower than the assumed discharge from the flood mark. From
this result, there is possibility that more rainfall had in the middle part of the catchment. This is one
reason for the new rainfall observation point is recommended in the Study.
9 - 17Figure 9-20 Rainfall-Assumed Peak Discharge in May 11, 2006 Flood
(2) Channel Capacity
The flow capacity of river cross section is defined by passable water discharge within both banks at
the bank elevation. Usually the elevations of left and right banks are different, so the flow capacity
was evaluated for each bank elevation. The conveyance value “K” at the given bank elevation for each
cross section. The Manning roughness coefficient is set 0.04 for conservative side. If the river bed
slope is given, the flow capacity can be calculated as follows,
9 - 18Qc = K × S
K : conveyance (m3/s)
S : River bed slope for flow capacity calculation
Qc : Flow capacity in m3/s
Figure 9-21 is the longitudinal profile of the channel capacity of the Soacha river. The reach between
Fusunga and Carcel has a low capacity due to the mild longitudinal slope. The reach from Ladrillera
Santa Fe and el Silo has a capacity of 15 m3/s at minimum. The section below 5+000 is quite low
capacity, less than 10 m3/s.
Soacha City conducted river channel dredging after May 2006 flood, especially the section below El
Cardal to Autopista Sur. The channel capacity in Figure 9-21 already considered the channel after
dredging. The capacity around El Silo is comparatively still smaller than the upstream.
6+827 Soacha St.(El Silo)
17+673 San Jorge ICA
8+972 Llano Grande
7+877 Autopista Sur
0+000 Bogota River
9+335 Ladrillera SF
17+286 Fusunga
11+645 Carcel
200
150
Flow Capacity (m3/s)
100
50
0
0 5000 10000 15000 20000 25000
Distance from Bogota R. (m)
Left Bank Right Bank
Figure 9-21 Channel Capacity of Soacha River
Figure 9-22 is the longitudinal profile of the channel capacity of the Tibanica river. The reach between
spillway and Autopista Sur is high capacity because of the dike. The reach from Autopista Sur and
1+600 has the capacity less than 10 m3/s.
9 - 19Tibanica River
300
6+635 Spillway
3+603 Autopista Sur
250
200
Flow Capacity (m3/s)
150
100
50
0
0 1000 2000 3000 4000 5000 6000 7000
Distance from Tunjuelo R. (m)
Left Bank Right Bank
Figure 9-22 Channel Capacity of Tibanica River
9.4.3 Flood Mapping
(1) Methodology
The methodology for flood mapping in the Study Area of Soacha composed of three (3) ways. One is
the mapping of past flood (May 11, 2006) based on the interview survey by the Study Team. And one
is the hydraulic mapping based on one (1) dimensional calculation. Another method is inland flood
mapping based on the waterlevel in the Bogota river.
The hydraulic mapping was done using software called HEC-RAS. This software was also used in the
evaluation of flow capacity of rivers in the Study Area.
(2) Mapping of May 11, 2006 Flood
Using the results of flood interview survey for May 11, 2006 flood, the affected area was delineated on
the topographical map as shown in Figure 9-23. The exact boundary of affected areas was decided
based on the people’s answers during the interview survey. In the flood map, the areas whose
inundation depth was less than 1 meter and more than 1 meter were distinguished.
9 - 209 – 21
Figure 9-23 Flood Area and Depth for May 11, 2006 in Soacha River and Tibanica River(3) Hydraulic Mapping of Soacha River
1) Used Basic Data
In the Study, river cross section survey was conducted along the Soacha river and the Tibanica river.
The cross section interval was basically 100 m and 50 m in urban area. The elevation in the floodplain
along the surveyed cross section was supplemented by topographical data of 2 m contour line and
SRTM3 data.
2) Results
The hydraulic mapping using software called HEC-RAS is shown in the Data Book 1 as the case of
May 11, 2006 flood scale.
(4) Inland Flood Mapping by EAAB Las Huertas Waterlevel
The area near the Bogota river confluence is affected by the high water of the Bogota river. There is a
telemeter watelevel station of EAAB called Las Huertas just downstream of the Soacha river
confluence. The waterlevel 2,541.5 m at Las Huertas could cause inland flood in the rural area of
Soacha. The area whose ground elevation is below 2,541.5 m was mapped as probable inland flood
area. The map is included in the Data Book 1.
9.5 Monitoring and Early Warning Plan
9.5.1 Introduction
Soacha Municipality is frequently suffering from flood and landslide disasters. Most recently, floods
and landslide occurred in May 2006, and affected thousands of people living near the river and the
sleep slope and their economic activities in the municipality.
There are two types of countermeasures such as structural countermeasures and non-structural
countermeasures to mitigate the damage of disasters. It is obvious that structural countermeasures are
effective to reduce the damage of disaster, however implementing them sometimes take longer time
due to various reasons (e.g. large scale investment, resettlement and land acquisition, etc.) comparing
to the implementation of non-structural one (e.g. installation of monitoring and early warning system,
land use regulation and relocation, community based disaster management (CBDM) activities, etc.).
With consideration of the seriousness of disaster situation, insufficient technical resources and budget
limitation of the municipality, installation of the monitoring and early warning system (MEWS) with
CBDM would be the most effective solution to minimize the damages at this moment. On the other
hand, it is understood that the MEWS is not perfect, and it is effective only if it is operated properly. It
is also understood that MEWS has limitation to minimize the damage of disaster especially damage to
immovable and some movables like cars, furniture, etc.
The proposed Plan on Monitoring and Early Warning System for Soacha Municipality will be
presented in the following sections with close examination and consideration of the existing problems
and above-mentioned MEWS characteristics. The scope of the system planning includes the design of
the monitoring and the early warning system for short, middle and long term, determination of
requirement for data analysis and processing system, determination of threshold level for issuing
warning, and community based evacuation planning.
Since the main contents of the plan is the MEWS, other effective measures such as relocation and
structural measures may not be include the proposed plan and are described as optional
recommendations in chapter 13 of this Report.
9 - 229.5.2 Objectives and Purposes
The overall objectives of the proposed plan are to protect the citizens (to avoid any human loss)
especially victims of past disaster, from future one, and to minimize the damage (to minimize loss of
assets and properties, to minimize stop of economic activities) of flood and landslide disaster in
Soacha Municipality by evacuating them appropriately in time.
To achieve the overall objective, the followings are set as planning purpose of the proposed plan:
- To establish effective monitoring and early warning system in Soacha Municipality
- To set warning criteria
- To propose institutional arrangement
- To enhance the capacity on disaster management in Alcaldía de Soacha by establishing of
MEWS
- To enhance the capacity on disaster management in communities by preparing of the
community based early warning and evacuation plan.
9.5.3 Planning Principle
(1) Target Year and Area
The proposed MEWS plan was prepared for the short, middle and long terms. The target year of the
plan is set up for 2020. Since the pilot project(s) implemented in the study which is considered to be a
part of the proposed plan, the implementation starts in 2007 and takes fourteen (14) years for the
completion. The target area of the plan is Soacha Municipality including the Soacha river, Tibanica
river.
(2) Planning Concept
In order to formulate the effective MEWS plan, the following planning concepts are applied.
Provision of warning and evacuation information to communities in secure and timely manner
To mitigate the damage, people living in hazard area and agencies concerned should take proper action.
In this connection, the warning and evacuation information should be provided with security and
timely manner with appropriate accuracy. Therefore, the proposed MEWS will be set up with careful
examination of information transmission method and reliability of the system.
Maximum utilization of existing information monitored by other organizations
As for Soacha Municipality, meteo-hydrological monitoring stations and communication system
owned by the municipality have not been installed at this moment. On the other hand, there are several
stations operated by other organizations in and around the city. Therefore, existing information
monitored by other organizations will be utilized as much as possible to reduce initial investment cost
and avoid duplication efforts for monitoring.
Maximum mobilization of local resources
Since floods and landslide events in Soacha are mostly local event, hazard monitoring at hazardous
areas are key to mitigate the damage. Automated monitoring system may be useful for monitoring
activities in real-time basis however the cost for the equipment will be high. It is also important to take
local actions during the disasters to reduce the damage. Therefore, maximum utilization of local
resources (e.g. community organization, people, commercial and industry) will be considered for
monitoring activities and actions when disaster happens.
Optimum combination of advanced technology and “low”-technology
To provide the information to the community security and timely, optimum combination of advanced
technology (e.g. telemetric observation system, the Internet technology, etc.) and “low”-technology
9 - 23You can also read