Whistler Young Adult Survey 2021 - Communities that Care Whistler - With support from
←
→
Page content transcription
If your browser does not render page correctly, please read the page content below
Whistler
Young Adult
Survey 2021
Communities that Care Whistler
Lizi McLoughlin

With support from:
Acknowledgements
We acknowledge and deeply thank the 898 young adults in Whistler who shared their
experiences with us in this survey. Thank you for taking the time to share your experiences,
perspectives, and ideas with Communities that Care. We are extremely grateful that, during a
difficult time, you chose to help us better understand the needs and experiences of young
people in Whistler.
We would also like to thank Whistler Community Services Society, who sponsored the 2021
Young Adult Survey and supported this project at every step. Thank you also to Coastal
Culture, Cross Country Connection, the Resort Municipality of Whistler, Vail Resorts Epic
Promise Foundation, Vallea Lumina (The Adventure Group), Kathleen Collins and Cathy
Jewett for donating prizes to the 2021 survey.
Finally, we gratefully acknowledge that the land now known as Whistler lies in the shared,
unceded territories of the Squamish and Lil’wat Nations. We’re thankful to do this work on
their land.

Communities that Care Whistler Board 2021
Cathy Jewett         Community Volunteer– Chair
Elizabeth Turner     Community Volunteer
Kathleen Collins     Ministry of Children and Family Development
Pam Deane            Resort Municipality of Whistler
Melissa Kish         Resort Municipality of Whistler
Clare Hanbury        School District 48
Jeff Maynard         School District 48
Jaye Russell         Sea to Sky Community Services
Cydney Lyons         Sea to Sky Community Services
Krista Germyn        Sea to Sky Community Services
Nicole Baudisch      Vail Resorts
Caprii Doucet        Vancouver Coastal Health
Shelagh Smith        Vancouver Coastal Health
Jackie Dickinson     Whistler Community Services Society
Nathan Miller        Whistler RCMP
Bev Baker            Whistler RCMP

                                              2
Contents
Acknowledgements .................................................................................................................................... 2
Executive Summary.................................................................................................................................... 4
Introduction ................................................................................................................................................ 8
Methodology .............................................................................................................................................. 10
Demographic Data .................................................................................................................................... 12
Mental Health ........................................................................................................................................... 17
Employment .............................................................................................................................................. 23
Housing....................................................................................................................................................... 31
Physical and Sexual Health..................................................................................................................... 37
Substance Use ........................................................................................................................................... 42
Community Connections ......................................................................................................................... 46
Final Impressions ...................................................................................................................................... 52
Opportunities for Improvement ............................................................................................................. 53
Conclusions and Recommendations ...................................................................................................... 57
3Executive Summary
This survey is the first Young Adult Survey completed in Whistler since 2016. It coincided with the
COVID-19 pandemic, and in particular, an outbreak of COVID-19 among young adults in Whistler.
As such, this data set provides a snapshot of a unique and difficult moment in the lives of young
adults in Whistler.
The goal of the survey was to understand the experiences of young adults living in Whistler, and
how those experiences have changed over the last 5 years. In addition, we hoped to understand
how the pandemic has impacted many aspects of young adults’ lives over the last year.
Methodology
From January 15 – February 15, 2021 an online survey was made available to young adults aged 18-
30 living and/or working in Whistler. Qualitative and quantitative data was collected on several
themes:
• Demographic data
• Housing
• Employment
• Physical and sexual health
• Mental health
• Substance use
• Community connections
Prizes were offered as incentives for young adults to participate, with one prize winner drawn
every day. 898 young adults responded to the survey, and after the data was cleaned, 809
sufficiently complete responses were analysed.
The data were analysed using Microsoft Excel 2010, as well as manual coding of qualitative
responses.
Demographic Data
Respondents to the survey were largely representative of the young adult population in Whistler,
when compared with 2016 census data.
Age and education
Young adults aged 18-30 responded to the survey. Those aged 30 were overrepresented compared
to census data, and over 80% of respondents were aged 23 or older. 39% of respondents had been
in Whistler more than 3 years, while 33% had been here less than one year. 73% of respondents
had at least some post-secondary education, a slight decrease since 2016.
Nationality, race, and Immigration status
Almost half (49%) of respondents were Canadian, the majority from outside BC. A further 20%
were from the UK, and 13% from Australia. 54% of respondents were Canadian citizens, while 15%
had Permanent Resident status, and 29% were on temporary work permits. In total, respondents
came from 36 different countries.
Respondents’ racial identities were representative of the Whistler population based on census
data. 87% were white, while 4% were Asian and 2% Indigenous. English was the most common first
language (77%), while 4% spoke French as a mother tongue. A total of 21 other first languages
were represented.
4Gender and sexual identity
Women were overrepresented in survey responses, with 53% of respondents identifying as
cisgender women. 34% identified as cisgender male, with a small number identifying as
transgender, non-binary, and Two-Spirit, respectively. 12% of respondents chose not to provide a
response.
77% of respondents identified as straight, while 8% identified as asexual, and 8% as bisexual. A
small number also identified as gay, queer, lesbian, and pansexual. Again, 12% of respondents
chose not to answer this question.
Mental Health
The data painted a concerning picture of young adult mental health in Whistler. Respondents
reported high levels of anxiety (65%) and depression (51%) since living in Whistler. There are high
levels of stress among young adults, with 46% saying their level of stress has been “poor” or “very
poor” over the last month.
The pandemic has had a significant negative impact on mental health. 70% said their mental
health had deteriorated since the beginning of the pandemic, and 71% said they had been stressed
about the pandemic “somewhat” or “very” often over the last month. 31% reported feeling “sad
or hopeless almost every day for two weeks” due to the pandemic, and 4% seriously considered
suicide. Aside from the pandemic, young adults are most worried about their future (68%) and
their finances (52%).
Young adults expressed concerns about many lifestyle factors that contribute to poor mental
health, including poor housing and affordability challenges living in Whistler. They also identified
significant challenges related to the pandemic, in particular social isolation and anxiety related to
working in frontline roles. Young adults were also concerned about access to affordable mental
healthcare in Whistler, which they felt was lacking.
Employment
There is some good news surrounding employment. Young adults are working slightly less than in
2016, with fewer young adults reporting they are working multiple jobs (15%), and fewer reporting
working more than 40 hours per week (22%). Food and beverage, hospitality, outdoor recreation,
and retail remain the sectors that employ the majority of young adults in Whistler.
Wages in Whistler have increased notably over the last 5 years, with 48% of respondents now
earning over $17/hr. However, the vast majority of young adults are still earning less than the
living wage of $21.22 for Whistler.1 While most young adults (89%) have access to some additional
benefits through work, only 31% have access to Extended Health benefits, and 25% receive tips.
The pandemic has had a major impact on employment among young adults. 62% of young adults
collected pandemic-related benefits over the last year. 38% reported losing their job at some
point in the last year, and 43% are now working less as a direct result of the pandemic.
Young adults identified needs for better wages that match living costs in Whistler, better access
to benefits, and a need for more consistent hours. They also hoped for better recognition and
professional development opportunities within their roles. Many young adults expressed concerns
about the safety risks of working frontline tourism roles during the pandemic, along with worry
about the instability of work in the sector as a result of the pandemic.
5Housing
Housing remains a major concern for young adults in Whistler. 54% of young adults are spending
more than 30% of their before-tax income on housing costs, a level which is deemed to be
unaffordable. As a result, 55% report feeling “somewhat” or “very” concerned about their housing
costs.
Relatively few young adults are accessing WHA housing. 19% of respondents are on the waitlist for
rental properties and 11% for purchase. Instead, 57% of respondents live in rented
accommodation, with a further 30% in staff or employee housing. Very few young adults own their
own property.
The majority of young adults in Whistler share a home with 1-4 other people, with 38% of
respondents sharing a bedroom. Overall, 63% report being “somewhat” or “very” satisfied with
their housing, while 24% are unsatisfied.
The biggest concerns related to housing were cost and stability. These issues appeared frequently
among responses in this survey, demonstrating the links between housing and mental health and
wellbeing. In addition, the pandemic has increased concerns about overcrowded housing and
privacy.
Physical and Sexual Health
Young adults painted a mixed picture of their physical health while in Whistler. Only 47% reported
their physical health as “good” or “very good”. In comparison, in April 2020, 68.6% of Canadians
reported their perceived health as good, very good, or excellent.2 47% had also accessed
healthcare for an injury since living in Whistler, while 35% had taken a COVID-19 test. Cost of
healthcare is a concern for 55% of young adults in Whistler, despite the fact that 96% have access
to some form of insurance.
There is work to do on access to sexual healthcare in Whistler. Only 31% of respondents had
received an STD test since living in Whistler, with a high diagnosis rate of 10% of respondents.
Respondents commented on lack of access to sexual healthcare as a barrier to good healthcare in
Whistler.
Young adults expressed high levels of concern about the lack of access to family doctors in
Whistler, in addition to concerns about lack of sexual healthcare. Some young adults also reported
negative experiences of care in Whistler, and increased barriers to care since the beginning of the
COVID-19 pandemic.
Substance Use
Despite restrictions on social gatherings, levels of substance use remain high among young adults
in Whistler. 53% of respondents said they were concerned about the level of substance use they
observe in Whistler.
Alcohol is by far the most commonly used substance, with 74% of respondents saying they used it
at least once per week. Binge drinking (consuming five or more drinks on one occasion) is
common, with 31% saying they have done so at least once per week over the last month. Given
that this survey data was collected while there were limitations on indoor dining, events, and
nightlife, it appears much of this binge drinking must be taking place at home or in public spaces.
Other substances are less frequently used, but there are still causes for concern. 7% report using
cocaine at least once per week, and a further 13% once or twice per month. 10% of respondents
had witnessed an overdose since living in Whistler, and 3% reported overdosing themselves.
There is a strong appetite among young adults for alternative, alcohol-free recreation activities.
Knowledge of LUNA was relatively poor, with 56% unaware of events organized by LUNA (Late and
6Unique Nighttime Alternatives). Respondents expressed interest in a range of alternative
activities, including night skiing, outdoor concerts, drive-through movie nights, social and drop-in
sports, and activities such as bowling and laser tag.
Community Connections
Young adults have mixed feelings about their connection to the Whistler community. 40% agreed
that they feel connected to the Whistler community, while 25% disagreed. More conclusively, 54%
felt their sense of connection had decreased since the beginning of the pandemic. Only 57% of
respondents agreed that Whistler is a welcoming community.
The greatest barriers to young adults feeling connected to the community were: affordability and
lack of opportunity to “build a life” in Whistler; COVID restrictions; negative attitudes of other
locals; and lack of community events.
Respondents also reported relatively poor knowledge of services and resources available in
Whistler. Only 55% knew how to access mental health services, and 61% knew how to access sexual
health services. Some of the greatest barriers were not knowing how to access support (34%),
embarrassment (22%) and fear of not being taken seriously (22%). Young adults mostly access
information about services through social media (70%), implying there is an opportunity for service
providers to better reach young adults in this way.
Recommendations and Opportunities
Regardless of the challenges outlined here, young adults are mostly happy to call Whistler home.
83% are somewhat or very satisfied with Whistler as a place to live, and 44% plan to stay for
several years or longer.
However, there are major barriers to young adults settling in Whistler and feeling connected to
the community. Chief among them are: lack of access to housing; affordability and low wages;
lack of access to healthcare and mental health care; lack of opportunities to connect with the
community; and a perception of over-emphasis on tourism at the expense of locals.
Young adults provided a range of suggestions for how Whistler could become a better place to
live, related to the concerns listed in the previous paragraph. Throughout their responses, young
adults expressed strong positive feelings about Whistler, while also a clear sense of frustration at
the barriers they face to a sustainable lifestyle in the town. This report highlights the major
challenges facing young adults in Whistler and identifies gaps that need to be filled in order for
young adults to live sustainable and healthy lifestyles in our community.
7Introduction
Since 2006, Communities that Care Whistler has surveyed young adults to understand their
experiences living in Whistler. The goal of these surveys is to understand the factors that
influence the wellbeing of young adults in Whistler, including housing, employment, physical and
mental health, substance use, and community connections.
This latest survey, carried out from January 15 – February 15, 2021, is the first survey since 2016.
The Committee had been preparing the survey for 2020 but missed the prescribed time and opted
to wait. As the pandemic wore on, survey questions were re-designed to explore the impact of
the pandemic on all aspects of young adults’ lives. Unexpectedly, the survey data collection
coincided with what was at the time Whistler’s largest outbreak of COVID cases since the
beginning of the pandemic (Figure 1)3.
Figure 1 COVID-19 cases in the Howe Sound Local Health Area from January to February 2021
During this time, the vast majority of COVID cases in Whistler were among young adults working in
frontline hospitality roles and living in shared accommodation.4 In addition to those affected by
illness, many more were required to self-isolate, quarantine, and stay home from work during this
time. So, unintentionally, this survey captured a unique, stressful, and difficult time in the lives of
Whistler’s young adults.
To demonstrate the extent of the challenges facing young adults during this time, in January and
February 2021, Whistler Community Services reported 1391 food bank visits, including 569
contactless deliveries for people self-isolating. For comparison, in 2018 the foodbank received
2773 visits in the entire year.5
During the same period, they received 1112 visits to their Outreach Workers, including 297 clients
in crisis. Of those, the vast majority (870) were in their 20s and 30s. This compares to 618 total
visits in the period January - February 2020 (an 80% increase), with 109 clients in crisis (172%
increase).
8Visits to WCSS Outreach Workers, 2019-
2021
700
600
500
400
300
200
100
0
Jan Feb Mar Apr May Jun Jul Aug Sep Oct Nov Dec
2019 Total Client Visits 180 229 286 240 381 360 234 257 235 259 300 272
2020 Total Client Visits 272 346 290 331 501 393 273 312 395 576 621 312
2021 Total Client Visits 501 611
Figure 2 Visits to WCSS Outreach Workers, 2019-2021
There were also restrictions on day-to-day life that were reflected in the responses to this survey.
Restrictions on gathering with those outside your household were imposed in early November 2020
and remained in place throughout the period of data collection. Other restrictions, including bans
on large gatherings, recommendations against non-local travel, and a two-week quarantine for
international travellers were also in place.
As a result, the experiences reported here differ in many ways from past survey data. It is
impossible to say how this data set would have differed had the pandemic not occurred.
Nonetheless, the data brings to light important issues related to the needs of young adults in
Whistler as we move towards recovery from the pandemic. Many of these impacts will continue to
be felt long after the pandemic is over.
At the same time, many of the issues raised here will be familiar to the Whistler community.
Challenges related to housing, living costs, and fair wages have not disappeared during the
pandemic. This survey sought to understand both these ongoing challenges, the acute challenges
caused by the pandemic, and the interplay of both.
9Methodology
The goal of this survey was to describe the experience of young adults in Whistler, rather than to
answer a specific hypothesis. The primary data for this report was collected via an online survey
distributed to young adults (ages 18 - 30) living in Whistler, in the same way it was distributed in
2016. Previous survey data was collected via paper surveys.
In addition, supporting data from Statistics Canada, the BC CDC, Vital Signs Whistler, and Whistler
Community Services Society were accessed to provide contextual and comparative data.
Survey Design
The survey asked both quantitative and qualitative questions, which were based on the previous
2016 Young Adult Survey. Several changes were made, including:
• The addition of questions related to the COVID-19 pandemic
• Updates to question design (e.g. addition of Likert scales)
• Removal of irrelevant or dated questions
In addition to collecting demographic data, the survey asked questions about six aspects of the
young adults’ lives:
• Housing
• Employment
• Physical and sexual health
• Mental health
• Substance use
• Community connections
Questions included forced-choice (i.e. asked to choose from a predetermined set of answers) and
open-ended response questions. Respondents were able to opt out of answering any question.
Survey Distribution
The survey was made available online (hosted on SurveyMonkey) from January 15 – February 15,
2021. It was promoted through paid and organic social media advertising, Pique Newsmagazine,
employers, media coverage, community organizations including WCSS and LUNA.
Incentives
To encourage participation, survey respondents were offered the chance to enter a daily prize
draw upon completion of the survey. Participation in the draw was optional, and identifying data
was collected separately from anonymous survey data.
Respondents who opted in were entered into a daily prize draw, drawn using a random number
generator. Prizes including gift cards for local businesses were purchased by Communities That
Care Whistler, or donated. All respondents were entered into a Grand Prize draw for a $500
Whistler Blackcomb gift certificate on the final day of the survey.
Data Analysis
898 responses were provided to the survey. The data was cleaned, and 89 responses were
removed as they were deemed too incomplete to include in the final analysis.
The remaining 809 responses were exported, and the data analysed using Microsoft Excel 2010. In
addition, qualitative data was analysed using manual inductive coding to identify themes among
responses.
10Survey Limitations
Despite our best efforts to disseminate this survey widely, we recognize there are limitations and
potential biases in the design, distribution, and data analysis of the survey. This survey asked
questions about a range of personal experiences that respondents may not feel comfortable
responding to accurately.
Data was collected only online, which may create barriers to participation. While SurveyMonkey
meets accessibility standards, we recognize that an online survey may not always be accessible to
those with disabilities. In addition, the survey was only made available in English, which could
reduce participation from those for whom English is not their first language.
We also recognize that certain marginalized populations may be less likely to complete a survey of
this kind. There are complex historical and sociocultural reasons why Indigenous people and
people of colour may be underrepresented in the data here.
Finally, we recognize that in any qualitative data analysis, there is the possibility of bias in
researcher coding of data. In order to obtain objectivity, quantitative data were collected to
support the qualitative conclusions, peers reviewed the findings, with consideration and discussion
of alternative explanations.
11Demographic Data
The following data offers a demographic picture of respondents to this survey. For the most part,
they represented the Whistler young adult population, as understood through 2016 Census data6.
Age
Respondents ranged in age from 18 – 30. Responses were skewed to the older end of the range,
with 80% of respondents aged 23 or older. There was a significant over-representation of people
aged 30 compared to other age groups. The same was true in the 2016 survey, although to a lesser
extent. It is possible that some of these responses come from young adults who are older than 30
who still identify with the target audience of the survey.
Figure 3 Age of survey respondents
Time Spent in Whistler
The largest group of respondents had been in Whistler for three or more years (39%). This is in
contrast to 2016, when the largest group (46%) of respondents said they had been here less than a
year. In this survey, only 33% said they had been here less than a year. It is likely that these data
have been affected by the pandemic and limitations on travel and working holiday visas.
How long have you lived in Whister?
350
300
250
200
150
100
50
0
1-3 4-6 6-12
1-2 years 2-3 years 4+ years Other
months months months
2021 74 116 48 101 84 286 17
2016 226 110 49 111 129 125 118
Figure 4 How long respondents have lived in Whistler
12Place of Birth
49% of respondents were born in Canada, an increase from 38% in 2016. Of those, the majority
(34%) were born outside BC, while only 4% were born in Whistler. There is likely a significant
impact of the COVID-19 pandemic on these data, as many Working Holiday Visa holders returned
to their home countries in spring 2020. The Working Holiday Visa program was also put on hold and
amended during 2020 due to the pandemic, likely reducing the number of young people moving to
Whistler from abroad.
Place of birth
600
500
400
300
200
100
0
Elsewhere Elsewhere
Whistler Squamish Pemberton Other
in BC in Canada
2021 30 4 1 79 244 366
2016 19 4 2 74 224 501
Figure 5 Respondents' place of birth
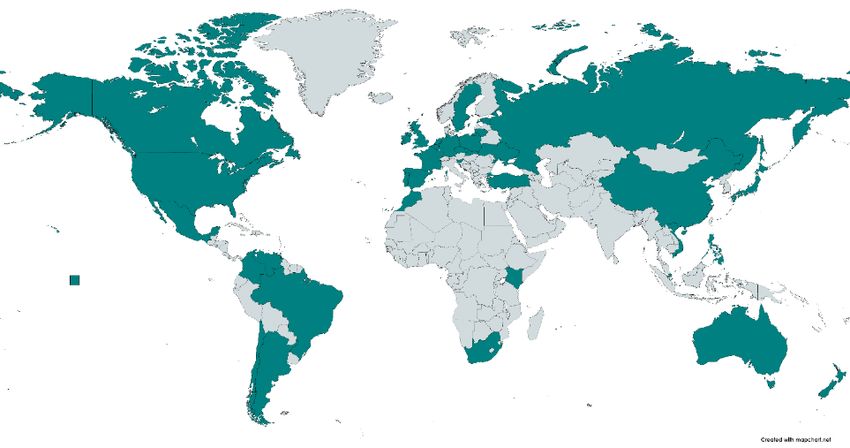
Outside of Canada, the most common place of birth was the UK (20%), an increase from 12% in
2016. Fewer respondents were born in Australia (13%) than in 2016 (20%). These changes are likely
due in part to travel restrictions related to the pandemic. It became more difficult to secure
working holiday visas, and countries like Australia had strict travel rules that discouraged
international travel. In all, respondents represented 36 different countries of birth, as shown on
the map below. This number is very similar to the data from 2016 (37 countries).
Figure 6 Map showing respondents’ place of birth
13Immigration Status
54% of respondents were Canadian citizens, while a further 15% were Permanent Residents.
29% were temporary foreign workers, either through the Working Holiday program or other
temporary work permits. A very small number identified other immigration statuses e.g.
visitor visa or implied status.
Gender and Sexual Identity
Women were overrepresented in survey responses, with 53% of respondents identifying as
cisgender women. 34% identified as cisgender men, while fewer than 1% identified as transgender
women, Two-Spirit, and non-binary, respectively. A relatively high number of respondents chose
not to answer this question (12%)
Count %
Woman (cisgender) 431 53.28%
Man (cisgender) 271 33.50%
Woman (transgender) 1 0.12%
Two-Spirit 4 0.49%
Non-binary 4 0.49%
Prefer not to say 15 1.85%
No response 83 10.26%
Figure 7 Respondents' gender identities
The majority of respondents to the survey identified their sexual orientation as straight (77%).
Also relatively common were asexual (8%) and bisexual (8%) orientations. A small number also
identified as gay, lesbian, pansexual, and queer. Again, 12% of respondents opted not to answer
this question. Overall, responses to this question represent a diverse range of sexual orientations
among young adults in Whistler.
Sexual orientation Asexual
8%
Bisexual
Other 8%
0% Gay
2%
Prefer not to say Lesbian
2% 1%
Pansexual
2%
Queer
0%
Straight
77%
Figure 8 Respondents' sexual orientation
14Racial Identity
The majority of respondents to this survey were white (87%). The next most common racial
identity was Asian, followed by Indigenous and Latin American. These data are very similar to
2016 Census data, with a slightly higher representation of Latin American identities, implying this
survey captured a relatively accurate cross-section of the population of Whistler.
Asian Black
Indigenous
Don’t Know 4% 0%
2%
1%
Latin American
Prefer not to say 2%
2%
South Asian
1%
West Asian
1%
White
87%
Figure 9 Respondents' racial identities
Languages
77% of respondents spoke English as their first language, while 4% spoke French. This is in line with
the 2016 Census data for Whistler, which found 4.7% of Whistler residents spoke French as their
mother tongue7.
Beyond that, there were 21 mother tongues represented in the survey, the most common of which
were German and Spanish. These data differ from the Whistler Vital Signs data from 2017, which
found Japanese and Tagalog to be the most common languages after English and French8. This
could imply that those languages are spoken less among the young adult population, or
alternatively that there were limitations with this survey design that led to underrepresentation of
those languages.
Level of Education
As in 2016, the survey data continues to show that Whistler’s young adult population is highly
educated. 73% of respondents had attended some post-secondary education, with 48% having a
Bachelor’s degree or higher. The percentage of respondents with post-secondary education has
decreased slightly since 2016, when 79% reported having post-secondary education. A slightly
higher proportion than in 2016 indicated that they had not completed high school (2% vs. 0.05%).
15Respondents' highest level of education
350
300
250
200
150
100
50
0
High school Some college Vocational
Some high Bachelors Masters Postgraduate
diploma or or vocational training Other (blank)
school degree degree degree
equivalent training certificate
Count 17 153 124 64 292 42 10 22
% 2.35% 21.13% 17.13% 8.84% 40.33% 5.80% 1.38% 3.04% 0.00%
Figure 10 Respondents' highest level of education
16Mental Health
Of all the data collected in this survey, the findings relating to mental health were of greatest
concern. It is clear that the pandemic has had a substantial impact on the mental health of young
adults in Whistler. As such, we chose to present these findings first, to provide context for later
sections of the report.
Overall Mental Health
Respondents reported an alarming level of mental health concerns since living in Whistler, with
65% experiencing anxiety and 51% depression. For comparison, the Canadian Mental Health
Association estimates that 8% of Canadian adults will experience depression9 and 11% will
experience anxiety in their lifetime10. This implies the rates of reported mental health concerns in
Whistler are worryingly high and should be a cause for concern in our community.
Since you have lived in Whistler, have you experienced:
Anxiety 65%
Depression 51%
Social anxiety 39%
Panic disorder 12%
OCD 12%
Figure 11 Prevalence of mental health concerns among young adults in Whistler
Respondents also reported high levels of stress, with 46% rating their level of stress as poor or very
poor, and only 6% rating it as “very good”. This shows a significant increase in stress among young
adults since 2016, when only 10% were experiencing “high” or “extreme” stress and 44% felt “low”
or “no” stress.
The greatest cause of stress among young adults was the COVID-19 pandemic, with 71% saying they
had felt stressed “fairly” or “very” often during the last month. The next most common causes of
stress were “your future” (68%) and “your financial situation” (52%).
Thinking about the last month, how would
you rate your level of stress?
300
250
200
150
100
50
0
Very poor Poor Okay Good Very good (blank)
Count 109 262 258 134 45
% 13.49% 32.43% 31.93% 16.58% 5.57% 0.00%
Figure 12 Respondents' self-rating of stress level over the last month
17How would you rate your usual stress level?
- 2016
350
300
250
200
150
100
50
0
Extreme Moderate
High Stress Low Stress No Stress
Stress Stress
Count 2016 8 75 307 326 58 94
% 2016 0.92% 8.64% 35.37% 37.56% 6.68% 10.83%
Figure 13 Respondents' self-rating of stress level in 2016
In the last month, how often have you felt stressed about:
Fairly or very often
The COVID-19 pandemic 71%
Your future 68%
Your financial situation 52%
The climate crisis 44%
Your weight or appearance 39%
Other global events 36%
Figure 14 Most common causes of stress among respondents
Impact of COVID-19 Pandemic on Mental Health
The mental health impact of the COVID-19 pandemic on young adults is starkly demonstrated in
this data. Only 30% of respondents rated their mental health as “good” or “very good”. Of the
remaining respondents, 37% said “okay”, and 32% said “poor” or “very poor”.
In 2016, 77% of respondents rated their mental health as “good”, “very good” or “excellent”, with
only 3% saying their mental health was “poor”. This is a dramatic contrast and suggests the COVID-
19 pandemic was having a significant negative impact on young adult mental health during the
time of data collection in 2021.
18Thinking about the last month, how would you rate your
overall mental health?
350
300
250
200
150
100
50
0
Very poor Poor Okay Good Very good
Count 70 186 300 190 63
% 8.65% 22.99% 37.08% 23.49% 7.79%
Figure 15 Respondents’ self-rating of overall mental health, 2021
How would you rate your overall mental
health - 2016?
300
250
200
150
100
50
0
Poor Fair Good Very Good Excellent
Count 2016 23 74 169 271 234 97
% 2016 2.65% 8.53% 19.47% 31.22% 26.96% 11.18%
Figure 16 Respondents’ self-rating of overall mental health, 2016
For comparison, across Canada mental health has declined since the onset of the pandemic. 46%
of adults aged 25-34 reported “very good” or “excellent” mental health in July 2020, compared to
63% in 201911.
70% of respondents said their mental health had “somewhat” or “significantly” deteriorated since
the beginning of the COVID-19 pandemic.
19A worrying 31% said they had felt “sad or hopeless almost every day for at least two weeks in a
row” because of COVID-19. A greater cause for concern is the 36 respondents (4%) who said they
had seriously considered suicide because of the pandemic.
The pandemic is not, however, the only cause of stress for young adults in Whistler. The other
most common responses were stress about the future (68%), their financial situation (52%), and
the climate crisis (44%).
Because of COVID-19, did you:
Feel sad or hopeless almost every day for at least two weeks in a row 31%
Seriously consider attempting suicide 4%
Figure 17 Mental health impacts of COVID-19 pandemic
Has your overall mental health changed since the beginning of the
COVID-19 pandemic?
450
400
350
300
250
200
150
100
50
0
Significantly Somewhat Somewhat Significantly
No change N/A (blank)
deteriorated deteriorated improved improved
Count 142 424 149 64 14 9
% 17.71% 52.87% 18.58% 7.98% 1.75% 1.12% 0.00%
Figure 18 Impact of COVID-19 on respondents' overall mental health
20Concerns About Mental Health
132 respondents provided an answer to the question “do you have any other concerns about
mental health in Whistler?”. Some of the most common themes that emerged included:
Access to mental health care
Respondents were concerned about lack of access to specific mental health services, including
counsellors and psychiatrists, as well as general access to healthcare including family doctors.
Several also commented on the affordability of mental healthcare for those without Extended
Health Benefits, with some indicating that they did not access care because of the prohibitive
costs.
“I would love therapy but cannot afford it. I am not a citizen or have PR so I am ineligible for
many support services. It makes me feel hopeless.”
At the same time, several respondents recognized the quality of some services available in
Whistler. Whistler Community Services Society was highlighted several times for the support they
provide to young adults. Some respondents felt these resources were well-communicated, while
others felt they still lacked knowledge of what supports were available.
“Although my mental health has taken a toll during the pandemic the services provided from
the Whistler community centre were amazing and the staff are incredible!!”
Factors that contribute to mental health
Many respondents described the lifestyle factors that contributed to mental health issues in
Whistler. They drew links between mental health challenges and unstable housing, high living
costs, stressful employment, and high levels of uncertainty in their lives.
The sentiments of these responses are summed up in this quote from one respondent:
“Affordable housing is mental health care. Transportation, jobs, not living 8 people to a 2
bed 1 bath is mental healthcare. Good wages, working conditions and not working 60+ hours
a week to share said 2 bed is mental healthcare. Mental health care is not ONLY yoga + a
phone number for a therapist that costs more than you make in a week.”
“I think due to stress of job security and seasonal jobs many people are feeling overwhelmed
and at a loss for purpose.”
Mental health impacts of the COVID-19 pandemic
The final theme that emerged was the impact of the COVID-19 pandemic on mental health. Many
respondents commented on how increased isolation and lack of social support has created mental
health challenges during the last year. Some also commented on how the uncertainty and lack of
ability to make plans was detrimental to mental health.
“Knowing several people in isolation/quarantine, and having experienced it myself, I'm
concerned about the mental state of people waiting on results or having to isolate with
people that [sic] might not feel comfortable around.”
Others reflected on the stress and anxiety of working in frontline tourism jobs during a pandemic,
where young adults feel at risk of catching COVID-19 through their workplace. Some commented
on the disparity between tourist behaviour and the limitations on socializing for locals, which have
been damaging for mental health.
21“There's a lot of people that come through whistler[sic] that seem very unconcerned with
the impact they have on the area. We're a tourist town, but our customers don't seem to
care about spreading the virus or being unnecessarily rude to people that live and work
here.”
Finally, some commented on how the pandemic has further restricted access to mental health
care, or limited it to online provision only, which can be less effective.
“Online resources are not the same as in person care for mental health. The ongoing
pandemic has seriously hindered people’s ability for mental health care.”
22Employment
The following data on employment in Whistler were collected during a volatile time in Whistler’s
tourism industry. Due to the COVID-19 pandemic, a range of Public Health Orders were in place
from March 2020 until this report was published which restricted tourist activities. These included,
at various times, bans on international travel, restrictions on national and local travel, restrictions
on indoor dining and alcohol service, and closures of restaurants and other non-essential
businesses. Some of these orders were introduced on short notice and extended several times.
The cumulative impact of these Public Health Orders was significant for local businesses and
employees. Many of the findings below will be heavily influenced by this unique set of quickly
changing circumstances.
Type of Employment
Fewer young adults are working multiple jobs than in 2016 (15% vs. 21%), and more are employed
in just one role (76% vs. 65%), either part-time or full-time. Fewer people are choosing not to
work (1% vs. 3%) and slightly more are seeking employment (5% vs 3%).
Current employment status
700
600
500
400
300
200
100
0
Employed Laid off,
Employed (1 Seeking Not seeking
full time (2+ waiting to be Student Other
job) employment employment
jobs) called back
Count 2021 122 621 42 30 6 33 27
Count 2016 191 572 22 30 70
Figure 19 Employment status (total % adds up to more than 100% as respondents could choose multiple options)
It appears that, overall, young adults are working less than they were in 2016. Significantly fewer
respondents reported working 40+ hrs/wk, although more than 1 in 5 young adults still works
longer than a 40-hour week. Similarly, fewer respondents are working 31-40 hrs/wk, while more
are working from 0-30 hrs/wk.
23Hours worked per week, 2021 vs. 2016
50%
45%
40%
35%
30%
25%
20%
15%
10%
5%
0%
Other
Less than 10
11-20 hours 21-30 hours 31-40 hours 40+ hours (please
hours
specify)
2021 5% 11% 22% 37% 22% 2%
2016 2% 2% 10% 48% 35% 3%
Figure 20 Hours of work per week by respondents in 2021 and 2016
The four most common jobs remain the same as in 2016: food & beverage, hospitality, outdoor
recreation, and retail.
In contrast to previous years, 16% of respondents answered “other” to this question. While a
number of these responses fall under traditional frontline tourism roles (e.g. lift operations, base
area operations, rentals, guest services, ski patrol), many others are less expected,
e.g. education, emergency services, healthcare, marketing, IT, non-profit, and transportation.
Compared to the 2016 data, this implies a diversification of employment in Whistler and
potentially more young people working in “professional” jobs than previously. Alternatively, it
could imply that the survey reached a different demographic of young adults in 2021 compared to
2016, due to different methods of distribution and promotion. There could also be an impact due
to COVID-19, as many businesses reduced their staff teams, and those with more stable,
permanent jobs were more likely to maintain employment.
24Other
16%
Food & Beverage
Human Resources Finance 23%
1% 1%
Administration
4%
Childcare
Housekeeping 3%
2%
Beauty Services
1%
Retail
Construction
14%
3%
Outdoor Recreation Grocery
(e.g. ski school, 2%
zipline instructor)
14% Hospitality
16%
Figure 21 Respondents’ industry of employment in Whistler
Wages and Benefits
There has been a clear growth in wages in Whistler since 2016, when 56% of respondents were
earning less than $15/hr. Now, only 16% of respondents reported earning below the minimum
wage of $14.60. In 2016, only 24% reported earning over $17/hr, a figure which has doubled to 48%
in 2021. It is worth noting that between 2016 and 2021, the minimum wage in BC has increased
from $10.65/hr to $14.60/hr.
Unfortunately, the vast majority of young adults in Whistler still earn less than the living wage of
$21.22/hr1 for a 35-hour week (2019). Some of this wage growth is offset by inflation over the five-
year period between surveys. This growth also does not consider the increasing cost of living in
Whistler. Further, as noted above, a greater proportion of young adults were working outside of
the tourism industry, which could be a factor in the reporting of higher wages.
25On average, what is your hourly wage?
300
250
200
150
100
50
0
Prefer
$14.60 - $17.01- $20.01- $23.01-
>$14.60 $26.00< not to (blank)
$17.00 $20.00 23.00 26.00
say
Count 132 253 123 104 66 91 37
% 16% 31% 15% 13% 8% 11% 5% 0%
Figure 22 Respondents' average hourly wage
Food discounts 57%
Ski pass 51%
Retail discounts 43%
Access to housing 32%
Extended health benefits 31%
Activities discounts 27%
Wellness benefit 15%
RRSP contributions 14%
None 11%
Transportation discounts 7%
Pension 6%
Other 2%
Figure 23 Most common employee benefits provided to respondents
Most young adults have access to some benefits which reduce their cost of living or increase their
total compensation package. However, 11% of respondents reported receiving no additional
benefits at all. The most common discounts available to young adults were food discounts (57%),
ski pass (51%), retail discounts (43%), access to housing (32%), and extended health benefits (31%).
Only 31% of respondents had access to extended health benefits through their employer, and only
14% received employer RRSP-matching contributions. Noticeably fewer respondents reported
receiving tips than in 2016 (25% vs. 35%). It is possible that the reduction in those receiving tips
reflects that fewer jobs were available in industries where tips are standard practices (e.g. food
and beverage, ski instruction).
26COVID-19 Impacts on Employment
It is clear that COVID-19 had a significant impact on young adults’ employment. 38% of
respondents reported losing their job due to COVID-19. In addition, the majority (62%) - of
respondents collected the Canada Emergency Recovery Benefit (CERB) or other COVID-19 related
benefits at some point in 2020.
While the data shows that the majority of young adults have since found employment again, 43%
reported a lasting reduction in their hours of work due to COVID-19, while a small number (6%)
reported that they remained unemployed. It’s worth noting that 1 in 10 young adults in Whistler is
actually working more because of COVID-19.
Concerningly 38% of respondents reported reducing the size of their meals, or skipping meals, at
least once per month because of COVID-19, including 7% doing so almost every day. This implies
that the benefits available to young adults were not always sufficient to cover basic costs such as
food.
Has your employment status changed since the start of
the COVID-19 pandemic?
400
350
300
250
200
150
100
50
0
Yes - I'm now Yes - I'm now Yes - I'm now Other (please
No
working more working less unemployed specify)
Count 108 348 47 245 54
% 13% 43% 6% 31% 7%
Figure 24 Respondents' change in employment status due to the COVID-19 pandemic
Because of COVID-19, did you:
Lose your job 38%
One or more people living in your home lost their job 30%
Had to move or change home 26%
Had to eat less food than you thought you should 16%
Figure 25 Frequency of impacts of the COVID-19 pandemic
27Job Satisfaction
The majority (58%) of young adults in Whistler are at least somewhat satisfied with their job,
while 20% are not. The majority (52%) also agree that their employer takes a personal interest in
them, while 24% do not. This compares unfavourably to 2016, when 13% felt their employer took
“no interest”, 54% felt they took “some interest”, and 34% felt they took “a lot of interest”.
"My employer takes a personal interest in me."
250
200
150
100
50
0
Strongly Somewhat Somewhat Strongly
Neutral N/A (blank)
disagree disagree agree agree
Count 99 99 154 224 197 34
% 12% 12% 19% 28% 24% 4% 0%
Figure 26 Agreement with the statement “My employer takes a personal interest in me.”
"I am satisfied with my job(s)."
350
300
250
200
150
100
50
0
Strongly Somewhat Somewhat Strongly
Neutral N/A (blank)
disagree disagree agree agree
Count 54 106 162 289 177 19
% 7% 13% 20% 36% 22% 2% 0%
Figure 27 Agreement with the statement “I am satisfied with my job.”
28Concerns about Employment
431 respondents provided an answer to the open-ended question “what, if anything, would
improve your job satisfaction?”. The most common responses fit into several themes:
Better Wages, Benefits, and Hours
An increased wage, or living wage, was the most common response to this question. Many
respondents commented on needing a wage that met the high living costs in Whistler. Others also
commented on needing access to benefits, in particular Extended Health Benefits, to improve
their quality of life.
“Planed[sic] raise to match inflation as Whistler gets more and more expensive every year
but wages don't match.”
“A fair wage for the role I am conducting. Whistler is expensive but my wage does not reflect
this. Most [sic] the workers, less those that get tips, scrape by, whilst surrounded by a lot of
wealth.”
Respondents also expressed a desire for better or more consistent hours. Some respondents
needed more hours of work to meet these living costs, while others were working too many hours
already in order to meet those costs. Many commented on the inconsistency of hours due to the
pandemic, which makes it hard to financially plan.
“A consistent and reliable source of hours and cash flow coming in.”
Finally, some comments on this theme spoke to a desire for a better work-life balance, and in
particular, time to ski or ride on the mountain.
Recognition and Career Development
Many respondents expressed a desire for greater recognition from their employer for their work.
Several responses reflected a sense of frontline workers being far removed from management in
larger companies. These sentiments appeared heightened by the increased stress and challenge of
working in frontline roles during the pandemic. Many respondents commented that recognition did
not have to be a big gesture, but that thanks and recognition are highly valued by young adults.
“Upper management caring about the people on the ground level actually doing the hard
work.”
“Never under estimate the power of being thanked by your employer. There's a common
misconception that people only work for money. This is false. They also like to be
recognized for what they've accomplished. This is where their motivation to go above &
beyond comes in.”
Respondents also expressed a clear desire for more professional development opportunities and
opportunities for career progression. Several of these responses indicated a desire to progress in a
company, but frustration at the lack of opportunities.
“Time to personally developed[sic] and grow with the company, learn new skills and
opportunities to move up in the system.”
29COVID-19 Impacts on Employment
The final group of responses commented on the significant impact of COVID-19 on employment in
Whistler. Some spoke to the challenge of quiet shifts and expressed a desire for more work and
busier shifts. As noted above, others needed more consistent hours of work.
Others expressed safety concerns about going into work during the COVID-19 pandemic, and a
sense that they had no choice but to risk catching COVID-19 by working on the frontlines. Coupled
with these were comments about the financial stress of having to self-isolate or quarantine and
not being able to make money.
“Most of the customers I come into contact with at the restaurant are unmasked non-
essential travellers, who don’t seem to know/care about any of the health orders. I’m scared
to go to work but I don’t want to lose my job.”
“If it was safe to be at work. I feel vulnerable working in a restaurant.”
“Sometimes I have a sore throat/ mild cough and feel very anxious about the financial
implications of having to quarantine. I would like to have the financial security to take care
of my health, both physically and mentally. I am very stressed and very tired.”
Finally, some comments spoke to the loss of the social aspects of work during the pandemic. For
example, a lack of staff gatherings and parties, or “cohorts” where staff work with only a limited
number of others, has reduced young adults’ opportunities for social connection through work.
It should be noted that several people responded “nothing” to this question, implying a high level
of job satisfaction. Some respondents also recognized that their employers were doing the best
they could in a challenging situation.
30Housing
Housing Affordability
Housing affordability remains a major concern for young adults in Whistler. It is worth noting that
this survey took place during a time when real estate prices in Whistler were increasing rapidly,
perhaps contributing to increase instability in the rental market in Whistler.
More than half (54%) of respondents reported that their housing is not affordable under the
accepted definition (housing costs less than 30% of income). A corresponding 55% of respondents
said they were “somewhat” or “very” concerned about their housing costs.
Is your current housing affordable (costs less than 30% of
you income)?
Not sure
8%
Yes
38%
No
54%
Figure 28 Housing affordability
To what extent are you concerned about your housing costs?
300
250
200
150
100
50
0
Very Somewhat Somewhat Very
Neutral N/A
unconcerned unconcerned concerned concerned
Count 101 130 121 272 175 10
% 12% 16% 15% 34% 22% 1%
Figure 29 Respondents' level of concern about housing costs
31Whistler Housing Authority (WHA)
As of the end of 2020, the Whistler Housing Authority (WHA)† offers 2596 rental beds and 3993
ownership beds within Whistler. This includes 275 beds added since 2018 across four new
developments. In total there are 1253 people on the WHA rental waitlist and 864 on the purchase
waitlist.11
Only 16 (2%) respondents reported living in a WHA property which they owned. A further 23 (3%)
reported living in a WHA rental. Given than 39% of respondents have lived in Whistler for four or
more years, and a further 12% for 2-3 years, this cannot be attributed entirely to a transient, non-
permanent workforce responding to the survey.
Similarly, only a minority of young adults surveyed are on the WHA waitlists: 151 (19%) on the
rental waitlist and 89 (11%) on the purchase waitlist. Of those, the majority had been on each
respective waitlist for less than 2 years. A small but significant number had been on each waitlist
longer than 5 years.
It is worth noting that there are barriers that exist to young adults being on the WHA waitlists,
including: the requirement to have Permanent Residency or Citizenship; the requirement to
declare and continually update personal information; and the cost of maintaining a place on the
WHA purchase waitlist.
Together, these data suggest that the vast majority of young adults in Whistler are not benefitting
from WHA provision of affordable housing. Those who are facing the biggest economic challenges
in Whistler are rarely benefitting from the stability and affordability of Whistler’s large stock of
WHA housing.
†
More information on the Whistler Housing Authority can be found at https://whistlerhousing.ca/
32Quality and Type of Housing
Overall, respondents report a relatively high level of satisfaction with their current housing
situation. 63% are “somewhat” or “very” satisfied with their housing, while 24% are unsatisfied.
Overall, how satisfied are you with your
current housing situation?
300
250
200
150
100
50
0
Very Somewhat Somewhat Very
Neutral N/A (blank)
unsatisfied unsatisfied satisfied satisfied
Count 55 134 104 253 254 4
% 7% 17% 13% 31% 32% 0% 0%
Figure 32 Respondents' level of satisfaction with their housing
Most respondents reside in relatively small dwellings. The most common size of dwelling was a 2-
bedroom (40%), with only 7% living in houses with over 5 bedrooms. The vast majority of
respondents (77%) live with 1-4 other people, while 11% live with 5-8 others. These data represent
very little change since 2016.
What is the size of your current dwelling?
350
300
250
200
150
100
50
0
Vehicle or
Other
5+ non-
Studio 1 bedroom 2 bedroom 3 bedroom 4 bedroom (please (blank)
bedroom permanent
specify)
structure
Count 45 123 321 172 74 55 9 2
% 6% 15% 40% 21% 9% 7% 1% 0% 0%
Figure 33 Size of respondents' dwellings
The most common housing situation was to rent a room in a shared property (36%) followed by
employee housing (30%). Notably, only 5% of respondents were housed in WHA housing, including
3% in WHA rentals and 2% in WHA ownership properties.
Fewer respondents reported sharing a bedroom than in 2016 (38% vs. 51%), and 58% reported
having their own bedroom. This could be related to the fact that Whistler Blackcomb HOUSE saw
significantly lower occupancy in 2021 due to the pandemic (approx. 50%), and more young adults
were housed in private bedrooms than in previous years due to COVID-19 precautions.
33Type of bedroom
500
450
400
350
300
250
200
150
100
50
0
I don't have
Private Shared my own room Other (please
(blank)
bedroom bedroom (e.g. couch, specify)
closet)
Count 462 304 8 27
% 58% 38% 1% 3% 0%
Figure 34 Respondents' bedroom type
Rental (room in a shared property) 36.0%
Employee housing 29.7%
Rental (whole property) 20.8%
Your own property 6.6%
Other* 4.2%
Rental (WHA) 2.8%
Your own property (WHA) 2%
Airbnb/Short-term rental 0.2%
Couch surfing 0.2%
Vehicle 0.2%
Outdoors 0.1%
Figure 35 Type of property respondents' live in
*Majority of other responses were with family or partner’s family
34Housing Concerns
Thinking about your dwelling, to what extent are you concerned about:
Somewhat or very concerned
Housing costs 55%
Ability to self-isolate/quarantine 45%
Roommate attitudes to COVID-19 30%
Late night noise 21%
Roommate conflicts 20%
Maintenance and repair 16%
Drug or alcohol use 14%
Your personal safety at home 13%
Theft 11%
Figure 36 Respondents' main concerns about housing
218 people provided a response to the open-ended question “are there any other concerns
you have about your housing?”
Affordability
Overwhelmingly, the most common responses related to housing affordability. In particular, many
commented on the lack of affordable options for those who wish to stay in Whistler long-term.
There was clearly a high level of concern with the affordability of housing compared to wages in
Whistler.
“My housing costs 100% of my income.”
“I live paycheck to paycheck to paycheck. Cost of the rental is almost 75% of my pay.
Remaining 25% is for shared hydro and internet, my phone bill and food.”
Other comments noted that the increased prices of WHA rental properties has made them
unaffordable to many on middle incomes in Whistler.
“Having to find a new rental if I get kicked. WHA rentals are too expensive for me now that I
make a reasonable income.”
Housing Stability
Many other comments reflected respondents’ desire to stay in Whistler long-term, and the lack of
options available to them. Several commented that they expected they would have to leave
Whistler in the future due to lack of suitable housing.
“Just lack of affordable options for people who are trying to stay permanently in Whistler.
This would be the main reason if we ever decided to leave.”
Many also commented on the stress of potentially losing their housing in future. Even those in
housing they perceived to be stable currently, did not have confidence that it would remain that
way. They expressed concern that they would not find suitable housing again. It is clear that
housing stability causes a high level of stress for young adults in Whistler.
“I have a partner, 2 dogs and a child. If my housing becomes unavailable, it'll be impossible
to find another place that would take us, let alone affordable. People here charge ridiculous
amounts for rent for a tiny place. Trying to find suitable housing to raise a family here is
next to impossible.”
35You can also read