The Healthy Auckland Together Plan
             2015-2020
←
→
Page content transcription
If your browser does not render page correctly, please read the page content below
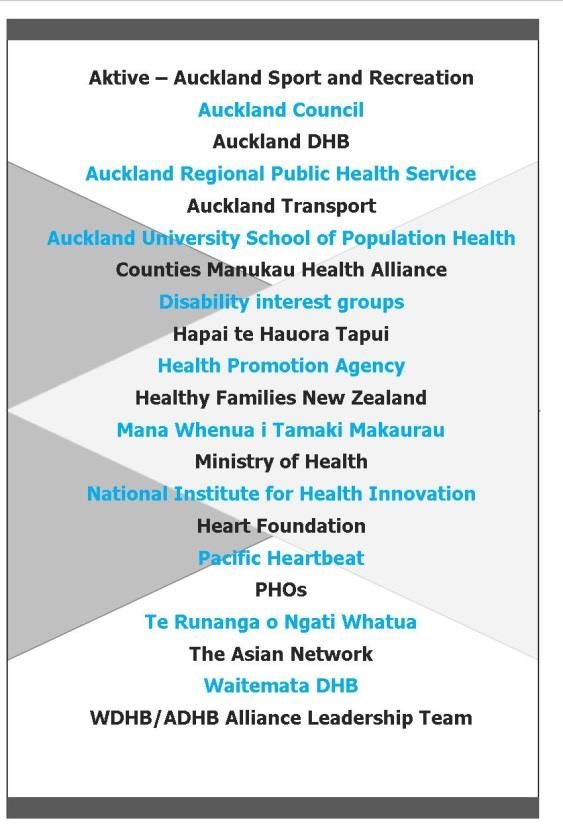
The Healthy Auckland Together Plan
2015-2020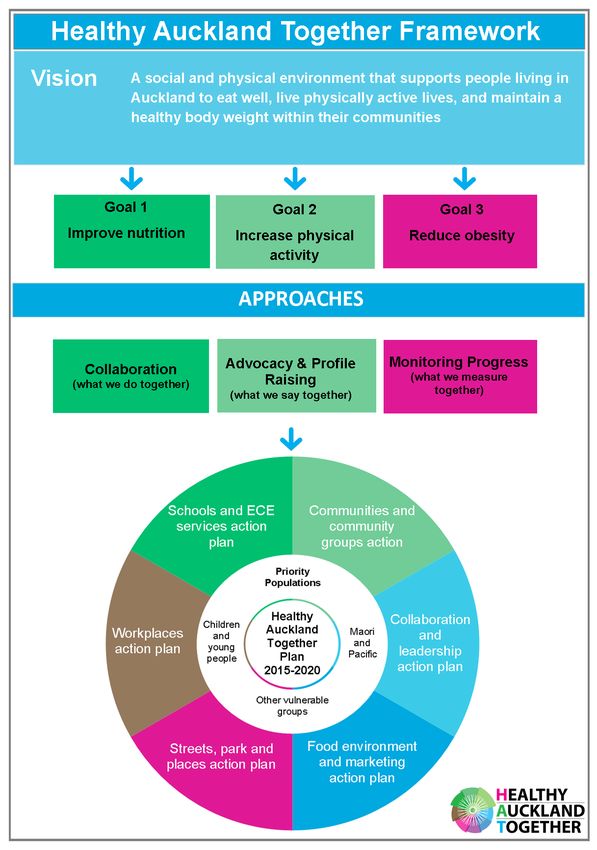
Healthy Auckland Together Plan v.2.3
May 2017

Introduction
Healthy Auckland Together is a coalition committed to making Auckland the world’s most liveable
city -where all its people can live a full and healthy life.
By working collaboratively, we want to make it easier for everyone to be active, eat better and stay a
healthy weight. Obesity is often referred to as a normal response to an abnormal environment. We
need to tackle all the environments, including food, neighbourhood planning, school, work and
transport - so they contribute to Aucklanders’ health, not impede it.
Our partners include health, local government, iwi, non-government organisations and other
agencies. Each has an important role to play in reversing the current trends in obesity, nutrition and
physical activity in the region.
This Healthy Auckland Together plan lays out what can be done within our collective influence and
how we will make progress on these pressing issues. We will combine our collective resources,
knowledge, skills and networks to improve where people live, learn, work and play.

 Key Healthy Auckland Together strategies

 WHAT WE DO                    Many organisations in the region are working towards similar goals. We will
 Collaborative                 collaborate with organisations in high priority settings to share information and
 approaches between            resources, and develop common strategies. Working collaboratively will amplify
 partners for more             the effect of the work we do.
 effective and equitable
 outcomes                      Over time the scope of this process will grow and gather new partners.

 WHAT WE SAY                   We will use our collective voice to influence policy and decisions on food and
 Influence policy and          physical activity related environments at national, regional and local levels.
 environmental decisions
 and raise the profile of      We will also seek to raise the profile of key issues with decision makers and the
 key issues                    community through relationships and the media.

 WHAT WE MEASURE               We will collect and present evidence to inform our approach, measure progress
 Monitor, collect and          towards equitable outcomes for the Auckland region and monitor results for
 present evidence to           continual improvement toward our vision.
 inform our approach
 and encourage progress
 towards the vision

The Healthy Auckland Together Plan is a roadmap towards achieving its goals and has two parts:

Part 1: Strategic Framework
This section outlines Healthy Auckland Together’s vision, the context the group operates within and
demonstrates the shared commitment of coalition partners to reducing obesity, improving nutrition
and increasing physical activity.
Part 2: Action Plans
This section sets out six action plans that describe what Healthy Auckland Together will do over the
next five years.

Healthy Auckland Together Plan v.2.3
May 2017

Contents
Introduction.............................................................................................................................................2
Part 1 – Strategic Framework ..................................................................................................................5
   Our Vision ............................................................................................................................................5
   Who we are .........................................................................................................................................5
   The Context .........................................................................................................................................5
   The Challenge ......................................................................................................................................6
   Principles and approaches ..................................................................................................................7
   A whole of environment approach is required ...................................................................................7
   Focus on equity ...................................................................................................................................7
   Focus on children ................................................................................................................................8
   Multi-organisational approaches are more successful .......................................................................8
   What has Healthy Auckland Together achieved so far? .....................................................................9
   How will we know if we are being successful?..................................................................................10
Part 2: Healthy Auckland Together Action Plans...................................................................................11
The purpose of the action plans ............................................................................................................11
   Six action plans – achieving our goals over the next five years ........................................................11
   Priority populations ...........................................................................................................................11
   Scope of Healthy Auckland Together action plans............................................................................12
Action plan 1: Streets, parks and places ...............................................................................................14
   Vision: Physical activity is integrated into our daily lives ..................................................................14
   What is the issue? .............................................................................................................................14
   What can be done .............................................................................................................................15
   What Healthy Auckland Together will do .........................................................................................16
   Measuring success.............................................................................................................................18
Action Plan 2: Food environments and marketing ...............................................................................19
   Vision: Healthy food choices are easy and desirable ........................................................................19
   What’s the issue ................................................................................................................................19
   What can be done .............................................................................................................................20
   What Healthy Auckland Together will do .........................................................................................20
   Measuring success.............................................................................................................................21
Action plan 3: Schools and early childhood education services............................................................23
Healthy Auckland Together Plan v.2.3
May 2017

   Vision: Healthy food and physical activity integrated into school and ECE environments ...............23
   What is the issue? .............................................................................................................................23
   What can be done? ...........................................................................................................................24
   What Healthy Auckland Together will do .........................................................................................25
   Measuring success.............................................................................................................................27
Action plan 4: Workplaces.....................................................................................................................28
   Vision: Workplaces support healthy lives .........................................................................................28
   What’s the issue ................................................................................................................................28
   What can be done .............................................................................................................................28
   What Healthy Auckland Together will do .........................................................................................29
   Measuring success.............................................................................................................................30
Action Plan 5: Communities and community groups ............................................................................31
   Vision: Strong communities and community groups working together to advance healthy
   environments ....................................................................................................................................31
   What’s the issue ................................................................................................................................31
   What can be done .............................................................................................................................31
   What Healthy Auckland Together will do .........................................................................................31
   Measuring success.............................................................................................................................33
Action plan 6: Collaboration and leadership .........................................................................................34
   Vision: Greater impact through collaboration and leadership .........................................................34
   What can be done .............................................................................................................................34
   What Healthy Auckland Together will do .........................................................................................34
   Measuring success.............................................................................................................................35
Appendix 1: Principles for Healthy Auckland Together .........................................................................37
Appendix 2: Complete set of indicators ................................................................................................38
Appendix 3: Rationale for population indicator targets........................................................................40
Glossary .................................................................................................................................................41
Healthy Auckland Together Plan v.2.3
May 2017

Part 1: Strategic Framework
Our Vision
Our vision is a social and physical environment that
supports people living in Auckland to eat well, live
physically active lives and maintain a healthy body
weight within their communities.
We will do this by focusing on three goals:
    1. improving nutrition
    2. increasing physical activity
    3. reducing obesity
These goals have a priority focus on equitable outcomes
for Māori, Pacific and lower socio-economic
communities.

Who we are
Healthy Auckland Together partners include agencies
that work in health, local government, iwi, non-
government organisations and other agencies. Together
we are responsible for some of the key environmental
settings that influence our health.

The Context
Unhealthy lifestyles are shortening lives and impacting
quality of life. The effect of obesity on families is often lifelong. There is increased risk of chronic
diseases such as diabetes and people who are obese are likely to experience discrimination, earn less
and have shorter working lives.1 Their children are more likely to be obese and are vulnerable to
stigma and bullying.2
There are significant costs to the Auckland economy. While the bulk of economic costs are borne by
the individual or the family, obesity and unhealthy weight also have socio-economic costs and are a
significant burden on the health system. The most commonly measured costs of obesity (outside of
medical costs) are those arising from loss of productivity due to obesity-related time off work or
reduced effectiveness in the workforce. The total productivity loss cost of obesity in 2006 was
estimated to be between $98m to $225m and the health costs were estimated to be $623.9m.3
Māori, Pacific and lower socio-economic communities face significant challenges. Almost half of
Māori, and two thirds of Pacific adults are obese. For children, one in four Pacific and one in five
Māori children are obese.4 A rise in obesity is accompanied by a rise in the prevalence of associated
non-communicable disease, such as coronary heart disease and osteoarthritis.
The problem is complex and indicators suggest it is getting worse. In the Auckland region, our
natural amenities and access to healthy food should make us among the healthiest people on earth.

1
  Ibid at 4
2
  Ibid at 4
3
  Lal, A., Moodie M., Ashton T., Siahpuch M. and Swinburn B. (2012) Health care and lost productivity costs of overweight and obesity in
New Zealand Australian and New Zealand Journal of Public Health; 36: 550-556.
4
  Social Policy Evaluation and Research Unit (2015), The wider economic and social costs of obesity: A discussion of the non-health impacts
of obesity in New Zealand, Available at: http://www.superu.govt.nz/sites/default/files/downloads/Obesity%20report%20FINAL_0.pdf

                                                                                                                            5|Page
Healthy Auckland Together Plan v.2.3
May 2017
Yet two-thirds of adults and one third of children are either overweight or obese.5 Since 1977, the
proportion of the population nationally who are obese has almost tripled, from 11 to 31 percent in
2013.6 Many Aucklanders are not physically active enough and poor nutrition contributes to poor
health. Our lifestyles are influenced by the environments around us and the drivers are varied and
interlinked.
The Challenge
Changing the current trends in obesity, nutrition, and physical activity will be challenging. While
individuals bear some responsibility for their health; obesity, poor nutrition and inactivity are also
driven by changes in society and in the environment around us.
Our lives have changed. We now eat more fast food, eat outside the home more frequently7, drink
more sugar sweetened beverages and are less likely to eat at home with our families. In 2012,
Auckland spent $2.6 billion on food outside of the home. This was an increase of 30% from 2008.8
Healthier foods are often more expensive or take longer to prepare. In contrast, less nutritious
heavily processed foods are carefully formulated to appeal to our tastes and are cheap and
convenient.
Families that experience food poverty are more likely to be obese. People with limited resources
often select food high in energy but low in nutrients to satisfy their hunger.9 Cheap processed foods
that are energy dense and high in fat and sugar contribute to the trend. In the period from 1997 to
2008, the number of households experiencing food poverty increased from one-in-five to two-in-five
households.10
Our local food environments have changed. Unhealthy food is now prolific. New Zealand research
has found that the density and proximity of stores selling unhealthy food is highest around secondary
schools, low decile schools and those in densely populated and commercial areas.11 Supermarkets
are a key component in the food environment as most families make the majority of their food
choices in supermarkets. The way supermarkets promote, price, place and stock energy-dense
nutrient-poor foods increases their consumption.12
We live increasingly sedentary lives. We are working more sedentary jobs and many of us struggle
to make room for exercise in our busy lives. Almost half of Aucklanders are not getting the
recommended amount of weekly physical activity.13 Perceptions of neighbourhood safety contribute
to children not playing outside the home gates. There are concerns that for many children
screentime comes at the expense of physical activity, both organised and informal.
Food marketing influences food choices. Media influences the choices we make and most
advertising tends to promote unhealthy food.14 This is a particular concern for children who are
5
Ministry of Health (2014) New Zealand Health Survey, 2014. Available at: http://www.health.govt.nz/nz-health-statistics/national-
collections-and-surveys/surveys/current-recent-surveys/new-zealand-health-survey
6
Ibid at 1
7
Rose, D. (2007) Food stamps, the thrifty food plan, and meal preparation: The importance of the time dimension for US nutrition policy.
Journal of Nutrition Education Behaviour 39(4): 226–232.
8
Neill, L., Williamson, D., Kruesi, M., & Waldren, N. (2013). Hospitality Report: Reporting on New Zealand's Hospitality Industry 2013.
Available at: http://www.aut.ac.nz/profiles/lindsay-neill#sthash.ehl30VKE.dpuf.
9
Robert Wood Johnson Foundation (2012) Making the Connection: Linking Policies that Prevent Hunger and Childhood Obesity. Available
at: http://www.ana.org.nz/sites/default/files/RWJF-Making-the-Connection.pdf
10
University of Otago and Ministry of Health (2011) A focus on nutrition: Key findings of the 2008/09 New Zealand Adult Nutrition Survey.
Available at: http://www.health.govt.nz/publication/focus-nutrition-key-findings-2008-09-nz-adult-nutrition-survey
11
Day, L. P. and Pearce, J. (2011) Obesity-Promoting Food Environments and the Spatial Clustering of Food Outlets Around Schools.
American Journal of Preventive Medicine, 40 (2) pp 113–121.
12
Foster, G., Karpyn, A., Wojtanowski, A., Davis, E., Weiss, S. Brensinter, S., Tierney, A., Guo, W., Brown, J., Spross, C., Leuchten, D., Burns, P
and Glanz, K. (2014) Placement and Promotion Strategies to Increase Sales of Healthier Products in Supermarkets in Low-income, Ethnically
Diverse Neighbourhoods: a randomised controlled trial. American Journal of Clinical Nutrition, 2:99 (6).
13
Ibid at 1.
14
Ministry of Health, Food and Nutrition Guidelines for Healthy Children and Young People (Aged 2-18 years): A Background Paper, 2012.
6|PageHealthy Auckland Together Plan v.2.3
May 2017
exposed to multiple types of media - such as computers, televisions, and game consoles. Research
has found strong associations between increases in advertising of non-nutritious foods and rates of
childhood obesity.15
Urban design influences the amount of physical activity we undertake. Activities such as taking
public transport or cycling to work or school incorporate physical activity into our daily lives.
Employing urban design strategies to create neighbourhoods, streets, and outdoor spaces that are
accessible for all and encourage walking, bicycling, and active transportation and recreation can
greatly increase physical activity. Our communities need open green spaces, and well connected and
safe walking and cycling networks to encourage all of us to get outside. The more time children
spend outdoors, the more active they are.
Principles and approaches
A whole of environment approach is required
Tackling complex issues like obesity, poor nutrition and inadequate physical activity cannot be done
through a single intervention. An approach that considers the environment (or system) as a
connected whole is required. Our environment is where we live, learn, work, shop and play as well
as the social, financial and time pressures we experience. All these factors shape our behaviour.
Taking a whole of environment approach to combating obesity will require targeting interventions
that reflect how these factors interact and influence our behaviour. The approach will be informed
by systems thinking and approaches. The programme of actions in this plan is a starting point, and it
is hoped that over time it can evolve into building a complete prevention system.
Focus on equity
Health equity means working to ensure that we all have a fair opportunity to be healthy, regardless
of ethnicity, gender, income, or the neighbourhood in which we live. Sometimes differences in our
health are related to factors outside our control such as our genetic makeup or simply chance. A
focus on health equity means focusing on those factors which are not only unnecessary and
avoidable but are also unfair and unjust.
The burden of obesity is not equally shared in the Auckland region. Māori and Pacific people are
more likely to be obese and overweight.16 Those living in poorer neighbourhoods are:
1.5 times more likely to be obese or have unhealthy weight17
more likely to live near outlets selling unhealthy food18
more likely to feel unsafe when walking alone in their neighbourhood day or night, which may
impact on likelihood of taking exercise in local neighbourhood.19
15
American Psychological Association, http://www.apa.org/topics/kids-media/food.aspx
16
Ibid at 1.
17
Ibid at 1.
18
Pearce J, Blakely T., Witten K. and Bartie P. (2007) Neighbourhood deprivation and access to fast-food retailing: a national study,
American Journal of Preventative Medicine, 32(5):375-82.
19
New Zealand Police (2014) Actual and Perceived Safety from Crime in Auckland: A Review, Available at:
https://www.police.govt.nz/district/aucklandcity/perceptions-of-public-safety-in-auckland.pdf
7|PageHealthy Auckland Together Plan v.2.3
May 2017
20
Figure 1: Percentage of Auckland adults who are obese or overweight by ethnicity
70
60 Overweight
Obesity
50
40
30
20
10
0
Maori Pacific Auckland
Focus on children
Problems related to unhealthy weight, obesity, physical inactivity and poor nutrition often start in
childhood. Eating and physical activity habits are formed at an early age - supporting children and
young people to make healthy living choices can establish long term habits. As with the general
population, the rates are most alarming for those children living in poorer communities, who are:
four times more likely to be obese21
three times more likely to have food outlets located close to their schools22
1.3 times more likely to watch more than two hours of television per day23
more likely to drink fizzy drinks and not eat breakfast at home.24
Multi-organisational approaches are more successful
Partnering with organisations in a range of community settings (for example, schools, central and
local governments and community groups) has the best chance of making an impact.25
Central government can help shape healthy living environments through policies, regulation and
legislation. Central governments can regulate labelling of food and advertising, and set guidelines for
sectors such as industry, schools and early childhood education services. Central government can
also set targets for the state sector to meet.
At a regional level, local governments have an impact on healthy environments through their
planning activities. Transport plans, urban planning and zoning rules all influence how physical
activity is included in everyday life. Local governments are also providers of sports and recreation
services.
We also spend a large proportion of our lives in community settings such as schools, universities,
workplaces, marae and sports clubs. These organisations can play an important role in enabling
access to healthy food and opportunities for active lives.
20
Ministry of Health, New Zealand Health Survey, 2011-2014. Note that the Auckland figures are based on the Auckland Regional Public
Health boundaries.
21
Ibid at 1
22
Day, L. and Pearce, J. (2011) Obesity-Promoting Food Environments and the Spatial Clustering of Food Outlets Around Schools, American
Journal of Preventive Medicine, (40) 2, pp 113–121.
23
Ibid at 1
24
Ibid at 1
25
World Health Organisation (2015) Interim Report of the Commission on ending Childhood Obesity. Available at:
http://www.who.int/end-childhood-obesity/commission-ending-childhood-obesity-interim-report.pdf
8|PageHealthy Auckland Together Plan v.2.3
May 2017
KEY STRATEGIC LINKAGES
Healthy Families is a central government initiative, led by the Ministry of Health.
Healthy Families has been implemented in Waitakere Ward, Manukau Ward, and
Healthy Families New
Manurewa-Papakura Ward. In each community, a local lead provider is
Zealand
establishing a health promotion workforce who will take a systems approach to
improving people’s health where they live, learn, work and play.
Auckland Council prepares a number of plans and strategies that influence the
health of Aucklanders. The Auckland Plan, for example, has the vision of Auckland
Auckland Council being the world’s most liveable city. The Sports and Recreation Action Plan
strategic plans (SARSAP) sets out what Auckland Council want to achieve for recreation and
sport, the actions to get there, to achieve the shared vision of “Aucklanders: more
active, more often”.
Active transport measures are a key component of Auckland Transport’s Regional
Auckland Transport Land Transport Plan. The plan sets out strategic direction and how key
plans components will be implemented over a ten year time frame.
Aktive’s strategic plan has a vision for Auckland being the world’s most active city.
Aktive’s strategic plan It has key alignments with SARSAP, Auckland Council strategies, Auckland
Council’s Māori Plan, and regional stakeholders.
What has Healthy Auckland Together achieved so far?
Healthy Auckland Together has been meeting since October 2014. In this time collaborative
relationships between key partners have been established and our vision and goals for a healthy
Auckland have been developed.
A series of background papers have been developed to provide a common foundation to define the
health challenges facing the Auckland region and agree evidence for potential projects and successful
interventions. A stocktake that sets out the activities of member organisations within settings was
also complete. The stocktake provided a snapshot of services within an area, identifying gaps and
overlaps in services.
Potential projects were identified and then assessed against a framework to measure our capacity to
act. The framework ensured that a key focus was given to regional activities within the direct
control of partner agencies, while using its collective voice to influence policy. Projects and settings
were considered according to their ability to improve equity.
As a result six action areas have been agreed:
Action plan 1: Streets, parks and places
Action plan 2: Food environments and marketing
Action plan 3: Schools and early childhood education services
Action plan 4: Workplaces
Action plan 5: Communities and community groups
Action plan 6: Collaboration and leadership.
Part 2 of this document outlines these action plans in further detail.
9|PageHealthy Auckland Together Plan v.2.3
May 2017
How will we know if we are being successful?
To ensure our projects are targeted effectively and measure whether we have been successful,
Healthy Auckland Together will monitor progress towards achieving the vision statement. This will
provide valuable information about where best to target future strategies and policies.
In developing a monitoring framework, two levels of data collection have been identified:
population indicators
outcome indicators
Population indicators will measure changes in: improved nutrition, increased physical activity and
reduced obesity for the Auckland population. Healthy Auckland Together will contribute to these
high level population outcomes alongside other influencers. These indicators are relevant across all
of the action plans and are detailed in Table 1 below.
Outcome indicators measure environmental outcomes and indicators and are contained within each
of the six action plans. The measures look at areas where our projects are expected to contribute
towards the overall goals, as well as how much we did and what impact it had. These indicators are
specific to each action plan and detailed in Part 2 of this document. They provide for a results based
accountability framework for measuring our success.
Indicators have been selected considering the following criteria:
Existing data collection
Regional data available
Where possible, ability to identify differences for Māori, Pacific or by level of deprivation
Where these data aren’t currently available, or regularly collected, key indicators have been
documented in case the data do become available. Rationale for all indicators below is provided in
Appendix 3.
Table 1: Population indicators to measure progress towards the overall goals of improving nutrition, increasing physical
activity and reducing obesity as well as reducing inequities
IMPROVING NUTRITION INCREASING PHYSICAL ACTIVITY REDUCING OBESITY
Annual (10%) reduction in the Annual progress towards a 10% Reduce rates of obesity for 4-
mean number of teeth with increase in the number of 5 year olds by 2020 in B4 School
evidence of caries (total of Aucklanders reporting they are Checks
decayed, missing and filled teeth, meeting physical activity
both primary and adult) of guidelines by 2025 from NZ
children (aged 5 years) who have Health Survey data
undergone dental examination
and are entered into the Auckland
Regional Dental Service database
Annual progress towards a 10% Annual progress towards a 10%
increase in adults meeting decrease in the number of
recommended fruit and vegetable Aucklanders reporting they are
intake by 2025 in regional Health not physically active by 2025
Survey data from NZ Health Survey data
Rate of progress on the above indicators for Māori, Pacific and higher deprivation groups relative to other
groups
10 | P a g eHealthy Auckland Together Plan v.2.3
May 2017
Part 2: Healthy Auckland Together Action Plans
The purpose of the action plans
The purpose of the Healthy Auckland Together Action Plans is to set out how Healthy Auckland
Together will collaborate, advocate, profile raise and monitor progress to contribute towards the
vision over the next two to five years.
The action plans:
Within each action plan there is:
provide a framework that will guide agencies and identify
leadership and support for agreed projects A vision
build awareness of how environments impact on healthy living A snapshot of the issue
choices
A summary of evidence of
plant the seed and build momentum for organisations to work what can be done
together towards systems change over the longer term.
A list of actions we aim to
Six action plans – achieving our goals over the next five achieve over the next five
years
years
Indicators that will be used
The Plan identifies six action plans covering the domains that have the
to monitor change
most influence on creating healthy living environments.
Action plan 1: Streets, parks and places
Action plan 2: Food environments and marketing
Action plan 3: Schools and early childhood education services
Action plan 4: Workplaces
Action plan 5: Communities and community groups
Action plan 6: Collaboration and leadership.
Priority populations
Each of the six action plans focus on our priority populations.
Māori, Pacific and those from poorer neighbourhoods are over-represented in health indicators
linked to obesity, poor nutrition and physical activity. They are identified as priority populations that
will be the focus of particular projects. This will ensure that efforts are targeted to those that need it
most, and that equitable outcomes can be achieved.
Children and young people are also a priority population. Intervention in early life can lead to more
positive long-term outcomes. Nutrition and physical activity habits are formed early in life, and can
imprint on adult behaviours.
Other high risk or vulnerable people are also a priority population, for example, people with
disabilities26 and South Asian populations.27
26
People with disabilities are less physically active, and there are links between some demographics among people with disabilities and
obesity. VicHealth, Disability and Health Inequalities in Australia, Research Summary
http://disabilityemployment.org.au/file/3c98910c97782a8d4f6bf3ef6c3d207901fb6fd4/vh_disability_summary_web1.pdf
27
South Asian populations include the Indian sub-continent. South Asian population with high levels of body fat are more prone to
developing abdominal obesity, which may account for their very high risk of type 2 diabetes and cardiovascular disease.
11 | P a g eHealthy Auckland Together Plan v.2.3
May 2017
Scope of Healthy Auckland Together action plans
Note that the six action plans present the first stage of the Healthy Auckland Together work, but the
scope of the coalition will not be limited to these. The area of maternal and child health, for
instance, has not been addressed and the work of primary care services has not been included,
although these are recognised as important settings to influence child health.
The projects recommended in the following tables are meant to be flexible and scalable over time. As
the working groups responsible for each action undertake their work, further activities may be
identified. In addition, new organisations may join the coalition to participate and work towards the
vision. The action plans are a guide with sufficient scope to enable working groups to explore and
incorporate new work as evidence and opportunities emerge.
Some projects identified in the plan are new ways of working, some are new programmes and some
require changes in the way organisations operate. Other projects identify opportunities to amplify
the work of member organisations through collaboration and joint activity. The plan will be
reviewed on an annual basis to ensure it is still relevant.
A framework for the action plans is shown on the following page.
12 | P a g eHealthy Auckland Together Plan v.2.3
May 2017
13 | P a g eHealthy Auckland Together Plan v.2.3
May 2017
Action plan 1: Streets, parks and places
Vision: Physical activity is integrated into our daily lives
Physical activity supports a full and healthy life, both physically and mentally. Where it was once
integral to how we went about our daily lives, it has now largely been structured out of what we do.
This action plans sets out ways to shape the places where we live, learn, work and play so that
physical activity is re-integrated into our daily lives and becomes the norm.
What is the issue?
Physical inactivity is estimated to cost the Auckland region $402 million each year.28 Just under half
of Auckland adults meet the recommended physical activity guidelines.29 While most children get off
to a good start, there is a drop-off in physical activity during young adulthood, when less than half
meet Ministry of Health guidelines of 60 minutes of exercise per day. Māori, Pacific and children in
low socio-economic communities are slightly more likely to meet physical activity guidelines.30
Physical activity can be incorporated into daily life through leisure and recreational activities or
everyday activities such as active transport. Well planned urban environments increase opportunities
to be physically active by creating neighbourhoods that are easy and safe to move around, encourage
people to use both active and public transport, and create spaces for people to be active.31 The
World Health Organization has estimated that changes to the urban environment could reduce
physical inactivity by one third.32 Streets, parks and places have the biggest potential for gains in
physical activity for people with disabilities, by ensuring that the built environment is usable and
accessible (physically and practically) for them.
Public transport is associated with higher levels of physical activity, as people often use active travel
at each end of their trip. Internationally, one-third of public transport users reach the recommended
30 minutes of physical activity per day through public transport use alone.33 Auckland has
traditionally been characterised by low density development and dependence on private transport,
with 85% of trips made by car.34 An international comparison of 14 cities in 2011 placed Auckland
last on public transport trips per capita. However, recent investment has seen a greater increase in
public transport patronage, and the Auckland Plan has the transformational goal of 45% of trips in
the morning peak being made by walking, cycling or public transport, compared to 23% at present.35
The planned level of increase will need to include substantial increases in active transport. This is
likely to provide a range of social and environmental benefits in addition to health, such as more
social cohesion, reduced traffic congestion, improved air quality, economic benefits and greater
equity. However, actual and perceived safety impacts on the willingness of people to use active
transport. Research by Auckland Transport shows that real and perceived road safety is the single
biggest barrier to cycling in Auckland. Sixty percent of Aucklanders report they would cycle if
28
Auckland Council, Waikato Regional Council and Wellington Regional Strategy Committee (2013) The Costs of Physical Inactivity –
Towards a regional full-cost accounting perspective, Available at: http://www.waikatoregion.govt.nz/Costs-of-Physical-Inactivity
29
Ibid at 1.
30
University of Auckland (2014) The New Zealand Physical Activity Report Card for Children and Youth, Available at:
http://nihi.auckland.ac.nz/sites/nihi.auckland.ac.nz/files/NZ%20PA%20report%20card_Long%20version%20PDF.pdf
31
Heath G.W., Brownson R.C. and Kruger J. (2006) The effectiveness of urban design and land use and transport policies and practices to
increase physical activity: a systematic review. Journal of Physical Activity and Health, 3 (Suppl 1):S55-76.
32
Pruss-Ustun A. and Corvalan C. (2006) Preventing disease through healthy environments: towards an estimate of the environment
burden of disease. Geneva, World Health Organization.
33
Pikora T.J., Giles-Corti B., Knuiman M.W., Bull F.C., Jamrozik K. and Donovan R.J. (2006) Neighbourhood environmental factors correlated
with walking near home: using SPACES. Medicine and Science in Sports and Exercise, 38, pp 708-714.
34
Auckland Council (2014) The Auckland Plan Available at: www.theaucklandplan.govt.nz.
35
Ibid at 8.
14 | P a g eHealthy Auckland Together Plan v.2.3
May 2017
separated cycle facilities were provided.36 Other barriers include availability of showers at
destinations and the perception that car drivers are not courteous.37 Safety can also be a concern in
determining children’s travel modes to school (e.g. crossing major roads), as can travel distance.38
What can be done?
Auckland Council and Auckland Transport have a key role to play in shaping places that support
people’s ability to have a healthy lifestyle. Well-planned urban environments can increase physical
activity at the population level. Sustained improvements in design and layout of urban areas may
include designing for well-connected streets, good quality footpaths, good street lighting, availability
of and proximity to parks, playgrounds and other recreational facilities. Physical activity has been
shown to increase by 161 percent in neighbourhoods where people live close to shops and schools,
streets are well connected, there is high population density and people have access to green
spaces.39
Active transport can be encouraged by providing safety
features such as local traffic management, reduced speed Self-Explaining Roads – Point England
limits, facilities and/or pedestrian crossings in suburban
An example of re-designing roads to calm
streets and around schools. To address cycle safety and raise traffic and promote safety
the visibility of cycling as a transport choice, infrastructure
such as cycle lanes and separated cycle ways need to be A demonstration project in Pt England
aimed to challenge the assumption that
provided. Off-road cycleways and walkways promote
residential streets are just for cars, and
recreational use, and would ideally be increased by connecting to give greater priority to pedestrians,
region-wide green ways. Development of a regional greenway cyclists and residents.
network is a goal in Auckland Council’s Sport and Recreation
Evaluation found a reduction in crashes
Strategic Action Plan.
by a third, severity of crashes reduced
by three-quarters, a mean 17km/hr
Auckland Transport is improving safety (perceived and actual) reduction in speed and reduction in
for children by working with schools to encourage active traffic volumes by half making the
travel, walking school buses and to address parents’ safety environment safer for residents,
concerns. They also work with partners to provide bikes for pedestrians and cyclists.
low-income families via sponsorships. The Travelwise
programme is currently in 400 primary and secondary schools in Auckland. Auckland Transport
prioritises high-risk schools from a safety perspective.
Changes to create health-promoting urban environments can promote equitable outcomes for
Māori, Pacific and households with higher socio-economic need by:
providing transport choice and alternatives that reduce car reliance and its associated costs
ensuring initiatives such as neighbourhood re-design, traffic calming, or upgrading of recreation
facilities give higher priority to areas of greater socio-economic need
ensuring priority communities are well served by good quality, safe and accessible recreational
spaces and places.
36
Auckland Council (2015) Auckland Cycling Programme. Available at: https://at.govt.nz/media/1070164/Item-111-Auckland-Cycling-
Programme-incl-attachmentsfinal.pdf
37
Kingham, S., Koorey, G., and Taylor, K. (2011) Assessment of the type of cycle infrastructure required to attract new cyclists. NZTA Report
449.
38
Conlon, F. (2013) Getting to school: Factors affecting choice of active travel modes in the trip to school, Master of Public Health
dissertation, University of Otago, Wellington.
39
Heath, G.W., Brownson, R.C. Kruger, J., Miles, R. Powell, K.E., Ramsey, L.T. and The Task Force on Community Services (2006) The
Effectiveness of Urban Design and Land Use and Transport Policies to Increase Physical Activity: A Systematic Review in Journal of Physical
Activity and Health 3 (suppl 1).
Self explaining roads: http://www.livingstreets.org.nz/sites/livingstreets.org.nz/files/BEHAVIOUR%20-%201300%20Hamish%20Mackie%20-
%20A%20successful%20self-explaining%20roads%20project.pdf
15 | P a g eHealthy Auckland Together Plan v.2.3
May 2017
What Healthy Auckland Together will do
Over the next five years Healthy Auckland Together will support and undertake the following projects
so that physical activity becomes easier to integrate into our daily lives. Being active will become the
norm, and the environment makes it accessible and safe.
The Auckland Plan, Auckland Council’s Sport and Recreation Strategic Action Plan (SARSAP), Parks
and Open Spaces Strategic Plan and Auckland Transport’s Regional Transport Plan are key plans to
influence the development of activity-friendly environments and support active and public transport.
Aktive’s strategic plan is currently under development, but there are likely to be significant areas of
overlap with Healthy Auckland Together. Healthy Auckland Together projects align with these
organisational strategies, where possible.
The following table outlines projects for implementation. When undertaking each of the projects,
areas with priority populations (based on New Zealand Deprivation Index) will be the key focus.
Project Lead Support Timeframe
1.1 Meet with transport decision makers who deliver ARPHS Discontinued
infrastructure and services that support active and
public transport to encourage application of an active
transport and public transport lens to all strategies and
work programmes
1.2 Advocate for transport spending allocations to focus on ARPHS HAT partners Discontinued
fast-tracking delivery of an integrated and effective
walking, cycling and public transport system through
submissions, relationships and joint projects
1.3 Engage in the Unitary Plan hearings process to maximise ARPHS Complete
Healthy Auckland Together objectives
1.4 Provide formal input into the 2015-2016 revision of ARPHS HAT partners 1 year
Auckland Council’s Auckland Plan
1.5 Provide formal and informal input on environments that ARPHS HAT partners, Discontinued
support physically active lives and which consider equity CMDHB
of outcomes for priority populations (eg. Auckland
Council’s Long Term Plan, Regional Transport Plans)
1.6 Promote and showcase examples that demonstrate how ARPHS HAT partners Discontinued
we can make it easier for people to be physically active,
as exemplars of best practice
1.7 Align with actions in Aktive’s Strategic Plan (under Aktive Auckland Council 5 years
development) that support more Aucklanders to be ARPHS
more active and focus on the spaces and places where
Aucklanders can be active
1.8 Partner with Healthy Families New Zealand to support Healthy Families HAT partners, Discontinued
its initiatives and encourage spill over of successful NZ – Sport CMDHB
initiatives into the wider Auckland region Waitakere
1.9 Develop an ‘Active Design’ Programme based on the Auckland Council ARPHS 2 years
Active Design Hub of the Auckland Design Manual, to
advocate for active design within our neighbourhoods,
buildings, streets, parks and open space
1.10 Provide design guidelines, in the Auckland Design Auckland Council ARPHS 2 years
Manual, for active recreation opportunities, play spaces,
activity-friendly spaces, and active streets within new
residential developments (SARSAP 6.3)
16 | P a g eHealthy Auckland Together Plan v.2.3
May 2017
Project Lead Support Timeframe
1.11 Develop provision guidelines for recreation and sport Auckland Council ARPHS 2 years
facilities, playgrounds and active open spaces in areas of
intensification and greenfield development (SARSAP 7.7)
1.12 Implement initiatives that improve walkability, Auckland Auckland Council 5 years
neighbourhood destinations and cycle safety, especially Transport ARPHS
in priority areas eg. Future Streets
1.13 Support and encourage neighbourhood re-design and Auckland Council Auckland 5 years
shared space projects that promote activity friendly Transport,
environments and social cohesion, especially in areas of University of
greatest need Auckland, ARPHS
1.14 Develop the network of walkways, trails, bridleways and Auckland Council Auckland Ongoing
cycleways across Auckland and around the coast Transport
(SARSAP 6.1)
1.15 Improve perceptions of safety in green spaces, Auckland Council 5 years
neighbourhoods and community venues, such as
reducing graffiti, improving lighting, and employing
crime prevention through environmental design in areas
of greatest need
1.16 Develop innovative ways to address inequities identified Auckland Council 3 years
through assessing the equity of access to facilities,
funding and differing participation costs for different
activities, codes and population groups (SARSAP 6.4)
1.17 Support recreation and sport programmes that increase Auckland Council Aktive Ongoing
physical activity in target populations with identified
health and wellbeing needs such as Māori, Pacific and
low socio-economic populations (SARSAP 3.6)
1.18 Create and foster regional conversation of the benefits Auckland Council ARPHS 2 years
of healthy city design eg. through an Auckland
Conversation
1.19 Co-develop neighbourhood accessibility tools and Auckland University of 3 years
measures Transport, ARPHS Auckland
1.20 Maximise the use of data and link data that are University of Auckland Council, Ongoing
currently collected by member organisations to inform Auckland Auckland
transport and urban design priorities and actions Transport, ARPHS
1.21 Use evaluation and data analysis to determine if University of Auckland 5 years
transport and urban design changes are achieving Auckland Transport,
desired results and to provide rapid feedback on what is Auckland Council
working to assist with prioritisation and targeting
1.22 Assess economic costing models to determine if they University of Auckland 1 year
accurately reflect potential for health gain and reducing Auckland Transport
inequities
Projects within other plans
3.10 Support active transport initiatives to encourage Auckland Auckland Council, Ongoing
participation in active commuting, walking school buses Transport Heart Foundation
and skill development for biking (in high-risk
communities) (SARSAP 3.5)
4.3 Partner organisations assess how their own Auckland Healthy Families 1-2 years
organisations are making physical activity and active Transport NZ, CMDHB
17 | P a g eHealthy Auckland Together Plan v.2.3
May 2017
Project Lead Support Timeframe
transport the easy choice as part of a travel plan
6.3 Scope the potential of implementing a Health in All ARPHS Auckland Council 1-2 years
Policies framework for a public policy project
Measuring success
We will measure progress of the Streets, Parks and Places Action Plan by using the following
outcome measures and indicators.
Currently collected indicator Target
Proportion of people walking, biking or jogging to work Increase from 6.5% in Census 2013 to 9.5% in Census 2018
in Auckland based on regional data, with at least a 3% increase in
priority areas
Increased public transport mode share and patronage Increase in proportion of people using the bus or train to
get to work from 8.4% in Census 2013 to 10% in Census
2018 based on regional data, with similar or greater
increases in areas of greater deprivation
Annual progress towards doubling public transport
passenger trips to 140 million by 2022 based on Auckland
Transport patronage data
Perception of walking and cycling as suitable for ‘most' Improvement in percentage of survey respondents’ perceptions
or ‘all' trips to work or study of suitability of cycling and walking from 2012 to 2016 in
Auckland Council's Transport Perceptions Survey to:
13% think cycling is a suitable option for all or most of their
trips to work or study (from 11%)
20% think walking is a suitable option for all or most of
their trips to work or study (from 16%)
40% feel people could get around the region well by cycling
(from 35%)
60% think people could get around the region well by
walking (from 55%)
Neighbourhood walkability, by deprivation index (this Improvements in walkability in areas of higher deprivation, from
includes neighbourhood destinations, access to green ARPHS modelling with a repeat measure in five years
space, connectivity)
18 | P a g eHealthy Auckland Together Plan v.2.3
May 2017
Action Plan 2: Food environments and marketing
Vision: Healthy food choices are easy and desirable
People respond to the environments in which they live. The food environment does not always
make it easy for people to choose the food they need for a healthy life. The availability, pricing, and
promotion of less healthy foods encourage their consumption over healthier foods. This action plan
seeks to make it easier for Aucklanders to access and afford healthy food and make it the preferred
choice.
What’s the issue?
The main drivers of food choice are taste, price and convenience.40 These factors often work in
favour of consumption of unhealthy food due to the saturation of cheap and convenient but
nutrient-poor food. For example, there is a greater density of fast food and convenience stores in
low socio-economic areas,41 42 making them the most convenient and affordable choice. More fast
food and convenience stores are also located near schools, particularly secondary and low decile
schools.43
The cost of healthy food is often seen as a barrier to healthy eating. In 2007, the price of a healthy
food basket was estimated as costing seven percent more per week than an unhealthy food basket,
excluding the cost of fruit and vegetables.44 Australian research shows that the cost of healthy food
has increased more over the years than less healthy food, and there are indications that the same
has happened in New Zealand.45
As well as price differentials between healthy and unhealthy food, two out of five households in New
Zealand experience some form of food poverty.46 Regional Public Health in Wellington has calculated
that low-income families on the minimum wage or a benefit would need to spend 23-53% of their
net income, or 42-75% once rent is deducted, to purchase food for a basic healthy diet.47 In the
Auckland region, the average weekly spending on food per household is about 12% higher than the
rest of New Zealand.48
Food preferences and consumption can also be shaped by marketing and promotion.49 Children are
particularly vulnerable as they have not developed the cognitive capacity to distinguish the
commercial nature of advertising. A nationwide survey of New Zealand parents and grandparents,
40
Glanz K, Basil M, Maibach E, et al. Why Americans Eat What They Do: Taste, Nutrition, Cost, Convenience, and Weight Control Concerns
as Influences on Food Consumption, Journal of the American Dietetic Association, Volume 98, Issue 10, October 1998, Pages 1118-112
41
Smoyer-Tomic, K. E., Spence, J. C., Raine K. D., Amrhein C., Cameron, N., Yasenovskiy, V., Cutumisu, N., Hemphill, E. and Healy, J. (2008)
The association between neighborhood socioeconomic status and exposure to supermarkets and fast food outlets in Health Place, 14(4),
pp 740-54
42
Pearce, J., Blakely, T., Witten, K. and Bartie, P. (2009) Neighborhood Deprivation and Access to Fast-Food Retailing: A National Study in
American Journal of Preventative Medicine, 36(1):74-81.
43
New Zealand research found that fast food and convenience outlets are five times more likely to be near schools than other areas. In
addition, the most socially deprived quintile of schools had three times the number and proportion of food outlets compared to the least-
deprived quintile. Day, Peter and Jamie Pearce, Obesity-Promoting Food Environments and the Spatial Clustering of Food Outlets Around
Schools, American Journal of Preventive Medicine, V40, Issue 2, 113–121, February 2011
44
Ni Mhurchu, C. and Ogra, S. (2007) The price of healthy eating: cost and nutrient value of selected regular and healthier supermarket
foods in New Zealand Medical Journal, 120 (1248).
45
Statistics New Zealand Food Price Index available from: www.stats.govt.nz
46
University of Otago and Ministry of Health (2011) A focus on nutrition: key findings of the 2008/09 New Zealand Adult Nutrition Survey,
Ministry of Health, Wellington
47
Wellington Regional Public Health (2010) Food costs for Families - Analysis of the proportion of the minimum wage and income support
benefit entitlements that families need to purchase a healthy diet. Available at: http://www.rph.org.nz/content/4f1b20ee-0cc8-44ef-aaaa-
5c8bc6fe6a7e.cmr
48
Statistics New Zealand (2014) Food Price Indicator 2014. Available from:
http://www.stats.govt.nz/browse_for_stats/economic_indicators/prices_indexes/fpi-review-2014.aspx
49
World Health Organization. Interim report of the Commission on Ending Childhood Obesity. WHO, Geneva, 2015.
19 | P a g eHealthy Auckland Together Plan v.2.3
May 2017
found over half felt their children’s requests were influenced by advertising, and most thought it
influenced liking for particular products. Eighty percent wanted a stop to advertising of unhealthy
food to children.50
What can be done?
International research has identified best practice to improve food environments and where New
Zealand is falling behind. The research recommends, among other activities, the following actions:51
implement a comprehensive national action plan to address unhealthy food environments and
to reduce obesity and non-communicable diseases
reduce the promotion of unhealthy foods to children and adolescents
ensure that foods provided or sold in schools and early childhood education services (ECE) meet
dietary guidelines (see schools and ECE action plan)
use fiscal policies to support healthy food choices.
They also noted that local communities had no mechanisms to limit the density of unhealthy food
outlets, for example, around schools and ECE services.
To complement these, specific actions are needed to improve the affordability and accessibility of
healthy food for low-income families in the Auckland region. This requires working at a policy level
both nationally and regionally, working with food suppliers, and extending the reach of community-
based interventions included in this and other action plans.
Furthermore, to ensure equitable outcomes for Māori, Pacific and communities with higher socio-
economic need, projects need to focus on environmental factors which have the most influence on
these communities through:
Policy support for healthy food environments helps create a baseline for change and a level
playing field. It is also the area of action that has greatest potential to reduce inequities in
childhood obesity.52
Community-based food solutions and interventions in schools, communities, sports clubs, and
recreational facilities that improve the affordability and accessibility of healthy food for low-
income families, and support traditional growing and harvesting practices.
Working with the people who make the food we eat, whether it is food manufacturers, food
suppliers, food preparers, or caterers to influence the supply of healthier foods.
What Healthy Auckland Together will do
Over the next five years Healthy Auckland Together will undertake the following projects to start a
shift towards healthy food being more desirable, accessible and comparatively affordable. The
projects work across multiple levels in the food system to help create an environment that supports
healthier eating. These are first projects, and the coalition recognises that further action will be
needed to truly make a difference to what people eat.
The following table outlines projects for implementation. When undertaking each of the projects,
areas with priority populations will be the key focus based on New Zealand Deprivation Index and
other Ministry of Health data.
50
Phoenix Research (2007) Survey of Public Opinions about Advertising Food to Children: Understanding Attitudes in New Zealand. Peak
Group, Auckland.
51
Swinburn, B., Dominick, C.H., and Vandevijvere, S. (2014) Benchmarking Food Environments: Experts’ Assessments of Policy Gaps
Priorities for the New Zealand Government, University of Auckland.
52
Vandevijvere, S. and Swinburn, B. (2014) Reducing childhood overweight and obesity in New Zealand through setting a clear and
achievable target in New Zealand Medical Journal, 127, 1406.
20 | P a g eYou can also read