Association between food insecurity and key metabolic risk factors for diet sensitive non communicable diseases in sub Saharan Africa: a ...
←
→
Page content transcription
If your browser does not render page correctly, please read the page content below
www.nature.com/scientificreports
OPEN Association between food
insecurity and key metabolic
risk factors for diet‑sensitive
non‑communicable diseases
in sub‑Saharan Africa: a systematic
review and meta‑analysis
Sphamandla Josias Nkambule1*, Indres Moodley1, Desmond Kuupiel1 &
Tivani P. Mashamba‑Thompson1,2
In previous studies, food insecurity has been hypothesised to promote the prevalence of metabolic risk
factors on the causal pathway to diet-sensitive non-communicable diseases (NCDs). This systematic
review and meta-analysis aimed to determine the associations between food insecurity and key
metabolic risk factors on the causal pathway to diet-sensitive NCDs and estimate the prevalence of
key metabolic risk factors among the food-insecure patients in sub-Saharan Africa. This study was
guided by the Centre for Reviews and Dissemination (CRD) guidelines for undertaking systematic
reviews in healthcare. The following databases were searched for relevant literature: PubMed,
EBSCOhost (CINAHL with full text, Health Source - Nursing, MedLine). Epidemiological studies
published between January 2015 and June 2019, assessing the associations between food insecurity
and metabolic risk outcomes in sub-Saharan African populations, were selected for inclusion. Meta-
analysis was performed with DerSimonian-Laird’s random-effect model at 95% confidence intervals
(CIs). The I2 statistics reported the degree of heterogeneity between studies. Publication bias was
assessed by visual inspection of the funnel plots for asymmetry, and sensitivity analyses were
performed to assess the meta-analysis results’ stability. The Mixed Methods Appraisal Tool (MMAT)
– Version 2018 was used to appraise included studies critically. The initial searches yielded 11,803
articles, 22 cross-sectional studies were eligible for inclusion, presenting data from 26,609 (46.8%
males) food-insecure participants, with 11,545 (42.1% males) reported prevalence of metabolic risk
factors. Of the 22 included studies, we identified strong evidence of an adverse association between
food insecurity and key metabolic risk factors for diet-sensitive NCDs, based on 20 studies. The
meta-analysis showed a significantly high pooled prevalence estimate of key metabolic risk factors
among food-insecure participants at 41.8% (95% CI: 33.2% to 50.8%, I2 = 99.5% p-value < 0.00) derived
from 14 studies. The most prevalent type of metabolic risk factors was dyslipidaemia 27.6% (95%
CI: 6.5% to 54.9%), hypertension 24.7% (95% CI: 15.6% to 35.1%), and overweight 15.8% (95% CI:
10.6% to 21.7%). Notably, the prevalence estimates of these metabolic risk factors were considerably
more frequent in females than males. In this systematic review and meta-analysis, exposure to
food insecurity was adversely associated with a wide spectrum of key metabolic risk factors, such as
obesity, dyslipidaemia, hypertension, underweight, and overweight. These findings highlight the
need to address food insecurity as an integral part of diet-sensitive NCDs prevention programmes.
Further, these findings should guide recommendations on the initiation of food insecurity status
1
Department of Public Health Medicine, School of Nursing and Public Health, University of KwaZulu-Natal,
Durban, South Africa. 2Faculty of Health Sciences, University of Pretoria, Pretoria, Gauteng Province, South
Africa. *email: nkambulesj@gmail.com
Scientific Reports | (2021) 11:5178 | https://doi.org/10.1038/s41598-021-84344-0 1
Vol.:(0123456789)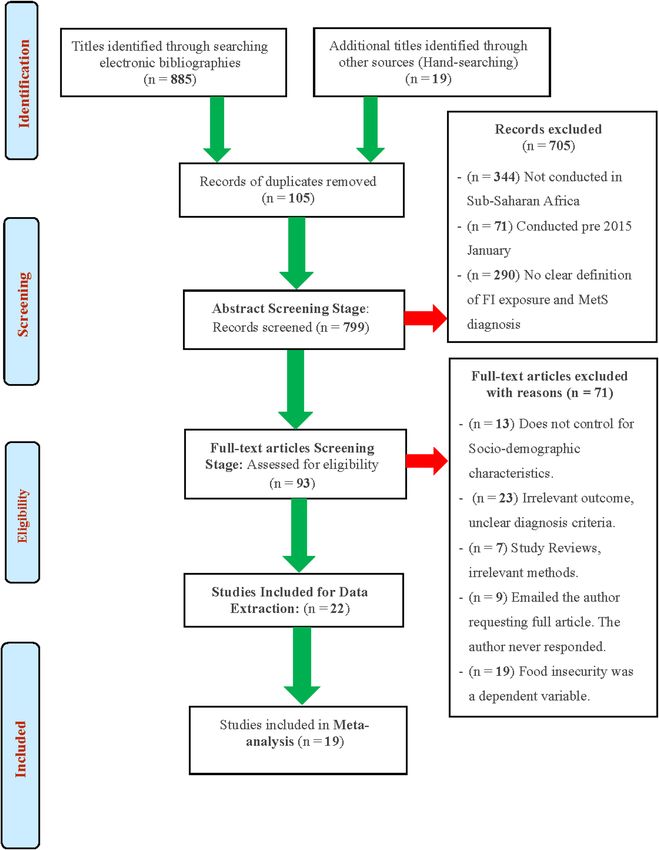
www.nature.com/scientificreports/
screening and treatment in clinical settings as a basic, cost-effective tool in the practice of preventive
medicine in sub-Saharan Africa.
PROSPERO registration number: PROSPERO 2019 CRD42019136638.
Abbreviations
LMICs Low- and middle-income countries
MMAT Mixed methods appraisal tool
PEO Population, exposure, and outcomes
DSCDs Diet-sensitive chronic diseases
PRISMA Preferred reporting items for systematic review and meta-analysis
WHO World Health Organization
FAO Food and agriculture organization
NCDs Non-communicable diseases
Metabolic risk factors for diet-sensitive non-communicable diseases (NCDs) are accelerating rapidly and advanc-
ing across countries. Globally, this results in a substantial morbidity and mortality burden linked to diet-sensitive
NCDs, such as diabetes and cardiovascular diseases1,2. In 2017, metabolic risk factors claimed an estimated 10.4
million deaths and approximately 218 million disability-adjusted life-years (DALYs)3. Thus, due to their substan-
tial contribution to the global disease burden—as well as rapidly increasing trends, and variable patterns across
countries—has prompted researchers to investigate factors driving the prevalence of metabolic risk factors. One
such factor is food insecurity, defined as the lack of access to nutritionally adequate foods caused by poverty and
other socio-economic s tressors4–7.
According to the World Health Organization (WHO) and the United Nations General Assembly, among other
professional organisations, food insecurity has emerged as a global health crisis and an important proximate
driver of the prevalence of metabolic risk factors on the causal pathway to diet-sensitive NCDs8–10. This premise
stems from the realisation that exposure to food insecurity results in compensatory behaviours, which often
include less intake of fruit and vegetables11, skipping meals, or reducing portion sizes12, and overconsumption
of low-cost foods that are high in calories yet deficient in nutritional value13. Over time, these compensatory
behaviours, perceived as buffers against food insecurity, may lead to malnutrition, which, in turn, initiates a
cascade of adverse metabolic profile that ultimately precipitate diet-sensitive NCDs8,14,15.
However, accumulating evidence on the association between food insecurity and metabolic risk outcomes
have yielded conflicting evidence of associations, especially for children and adult m ales16. In contrast, more per-
suasive evidence of an antagonistic relationship was found in women from high-income countries13,17. Evidence
of these associations in resources-limited settings with high levels of food insecurity such as the sub-Saharan
African countries has not been systematically reviewed or meta-analysed. For these reasons, it does not provide
sufficient integrated, evidence-based, and comprehensive information about the distribution of specific key
metabolic risk factors among the populace confronted with food insecurity in the region.
Understanding trends and patterns of specific key metabolic risk factors among those confronted with food
insecurity is vital for both public health and clinical management of diet-sensitive NCDs. Therefore, we con-
ducted a systematic review and meta-analysis to determine the associations between food insecurity and key
metabolic risk factors for diet-sensitive NCDs and to estimate the prevalence of these metabolic risk factors
among the food-insecure patients in sub-Saharan Africa. It is anticipated that the study findings may serve as
baseline data for setting priorities, designing interventions to reduce associated morbidity and mortality, and
strengthening the basis for policy action and recommendations for future research.
Methodology
Study design. The study protocol was developed and registered before the study’s start with the Interna-
tional Prospective Register of Systematic Reviews (PROSPERO; CRD42019136638), and the published meth-
odology made available for public comments via the link below: https://www.crd.york.ac.uk/prospero/displ
ay_record.php?ID=CRD42019136638
The present systematic review and meta-analysis were conducted following the principles recommended in the
Centre for Reviews and Dissemination (CRD) guidance for undertaking systematic reviews in healthcare18, and the
Meta-analysis Of Observational Studies in Epidemiology (MOOSE) guidelines for design and i mplementation19.
The reporting was aligned to the Preferred Reporting Items for Systematic Reviews and Meta-Analyses (PRISMA)
guidelines20 to ensure all necessary seven steps have been followed. The completed PRISMA checklist is provided
as supplementary material (Supplementary Appendix No. 2).
In this review, we first sought to identify the specific spectrum of key metabolic risk factors associated with
food insecurity, by systematically reviewing current peer-reviewed epidemiological studies conducted in sub-
Saharan Africa, assessing the associations between food insecurity and key metabolic risk factors on the causal
pathway to diet-sensitive non-communicable diseases (NCDs). Secondly, after identifying the spectrum of key
metabolic risk factors associated with food insecurity, we sought to assess the prevalence of these metabolic risk
factors among the food-insecure patients in sub-Saharan Africa.
Lastly, to assess study methodological quality (or risk of bias) of all included studies, we used the adopted
Mixed Methods Appraisal Tool (MMAT)—Version 2 01821, as it permits for appraising the quality of quantitative
non-randomized studies22,23.
Scientific Reports | (2021) 11:5178 | https://doi.org/10.1038/s41598-021-84344-0 2
Vol:.(1234567890)www.nature.com/scientificreports/
Criteria Determinant
Population Human participants of all-age groups residing in sub-Saharan Africa, both genders, and regardless of their ethnic background
Exposure Food Insecurity (FI)* (Independent Variable) experienced at either household or individual level
Diagnosed with any of the following key metabolic risk factors for diet-sensitive NCDs per the international diagnostic
criteria for metabolic syndromes (MetS) such as NCEP-ATPIII (2001), International Diabetes Foundation (IDF 2005), AHA/
NHLBI criteria (2004), and any other measures in line with the World Health Organization criteria (1998). Outcomes of
interest are:
1. Obesity
Outcomes
2. Dyslipidaemia
3. Hypertension
4. Underweight
5. Overweight
6. Others (as reported per study)
Table 1. PEO framework for determining the eligibility of the research question. *Detailed list of essential
tools used to define/ or ascertain food insecurity as an independent variable, accompanying theoretical
minimum risk exposure level see Supplementary Appendix No. 1 Table 1. Definition of review outcomes
reported assessment beyond general health self-report and the diagnostic criteria for identifying metabolic risk
factors for this study see Supplementary Appendix No. 1 Table 2.
Criteria Inclusions Exclusions
Only original and quantitative study design that are peer-reviewed cross-
Qualitative study design, and systematic reviews, literature reviews, mini-reviews
Study design sectional studies conducted in sub-Saharan Africa by trained personnel, in any
and cross-sectional studies conducted outside of Africa
publication language
Studies conducted among sub-Saharan African populations
Research studies conducted among people outside of sub-Saharan Africa
Population Participants of any age group and sex that did not mix the age groups for analysis
Participants with coexisting medical conditions
Any ethnicity, culture, or race
Studies reporting a measure of food insecurity or food insufficiency as an inde-
pendent variable
Research studies reporting on voluntary food restriction, as in cases of anorexia/
Exposure A measure of food insecurity beyond receiving government-sponsored nutri-
Nervosa
tional benefits/ or living in an area designated as a food desert
Food insecurity evaluated at the household level or individual level
Studies reporting at least one of the key metabolic risk factors as a dependent
variable
Research studies reporting on the outcome as the result of infectious agents
Outcomes Diagnosed with key metabolic risk factors per any of the international diagnostic
None validated outcome measures
criteria for MetS: NCEP-ATP III, IDF, or AHA/NHLBI criteria or any other
measures in line with the World Health Organization criteria (1998)
Complete peer-reviewed original research studies, published between January
Time Studies published before January 2015
2015 and June 2019
Table 2. Eligibility criteria according to the PEO-T nomenclature criteria.
Step 1: Identifying the research question. To determine our research question’s eligibility for a systematic review
project, we applied the PEO (Population, Exposure, and Outcomes) nomenclature for systematic reviews24, as
illustrated in Table 1.
The main research question: What are the associations between food insecurity and key metabolic risk factors
for diet-sensitive NCDs in the sub-Saharan African population?
Step 2: Eligibility criteria. The eligibility criteria were developed according to the relevant elements of the
PEO-T (Time) framework guidance for undertaking a systematic review, to ensure that the research question’s
boundaries are clearly defined. Eligible articles were included after two reviewers had independently, reproduc-
ibly, and systematically evaluated them and met the inclusion criteria, as illustrated in Table 2.
Step 3: Identifying relevant studies. (a) Literature search and search strategy. Identification of eligible STUD-
IES for inclusion in this review was through a comprehensive and reproducible search of reputable bibliographic
databases, indexing services (and platforms), and other supplementary sources, including Google Scholar and
hand-searching25. The primary searches, both electronic and hand-searching, was performed simultaneously by
the first author with the assistance of a professional university librarian from 15 May to 28 June 2019.
Before conducting the primary searches, a comprehensive search strategy was co-developed by the first author,
subject specialist and professional university librarian, and reviewed by all authors to ensure the correct use of
indexing terminology, and Medical Subject Headings (MeSH) descriptors. The search strategy was pilot tested
on a subset of records from the PubMed database. It was then tailored to the syntax and subject headings of all
other consulted databases. Details of the search strategies descriptors and truncation used, and the number of
returned records are presented as supplementary material (Supplementary Appendix No.1 – Table 1).
Electronic searches—To identify relevant studies assessing the associations between food insecurity and meta-
bolic risk factors, advanced search strategies were applied in the following electronic bibliographic databases (and
Scientific Reports | (2021) 11:5178 | https://doi.org/10.1038/s41598-021-84344-0 3
Vol.:(0123456789)www.nature.com/scientificreports/
platforms): PubMed, EBSCOhost (CINAHL with full text, Health Source - Nursing, MedLine), Ovid (Journals@
Ovid Full Text), Web of Science (SCiELO Citation Index) and supplementary sources in Google Scholar platform.
Furthermore, the first author browsed through the link entitled ‘Related Articles’ option, which searches for
similar citations using an intricate algorithm that scans titles, abstracts and MeSH terms to detect more studies.
No language restrictions were imposed to minimise the risk that eligible studies could be inadvertently excluded.
However, the year of publication was limited to between January 2015 and October 2019 to ensure that the
evidence of associations is demonstrably rooted in the most recent and up-to-date scientific literature. This deci-
sion was chiefly because practitioners and decision-makers are somewhat interested and encouraged to make
use of the most current evidence to inform policy d ebates26.
Hand-search—The electronic searches were further supplemented by hand-searching the bibliographies (refer-
ence lists) of all eligible studies for inclusion and the previously published systematic reviews of a relevant topic.
This was done in order to identify very recent studies that have not yet been included and indexed by electronic
databases or including studies from journals that are not indexed by electronic databases, and thus not captured
by our comprehensive search strategies. In addition, several subject specialists, medical professionals, and uni-
versity librarian experts in the field were approached to identify additional relevant studies.
(b) Search management. The records of retrieved articles through electronic databases and hand-searches that
met the inclusion criteria were exported to EndNote X9 (version 19.1.0.12691), a reference manager software
virtual library (Thomson Reuters, Stamford, CT, USA). The virtual library was created specifically for this study;
for removing duplicates of the same records, screening, and study selection.
Step 4: Study selection. Study selection was a multi-step process that involved two reviewers. The procedure for
screening of articles for eligibility was carried out in compliance with the Preferred Reporting Items for System-
atic Reviews and Meta-Analysis (PRISMA) guidelines and summarised as a flow diagram Fig. 120. The selection
procedure involved three screening stages:
Title screening—Firstly, the first author with the assistance of a professional university librarian, searched for
eligible titles by analysing the titles of articles found through the use of the search strategies, in the above men-
tioned electronic bibliographic databases (and platforms) guided by the study eligibility criteria (see Table 2).
Articles with relevant titles were exported into a reference manager software – EndNote X9 (version 19.1.0.12691)
virtual library. Duplicates were removed before the start of the abstract screening stage.
Abstract screening—And, subsequently, after the selection of relevant articles through the titles screening. Two
skilled reviewers independently screened all the abstracts of the retrieved articles against the eligibility criteria
(Table 2), utilising a standardised and pilot tested abstract screening checklist tool (see Supplementary Appendix
No. 2 – Abstract Screening Google Form) for reliability and applicability. Differences between reviewers at this
stage were settled through reaching a consensus among reviewers.
Full-article screening—Full-text articles were retrieved where studies met the inclusion criteria or where
there was ambiguity to be screened in greater depth, by reference to the full-text assessment of eligibility. Thus,
further establishing the retrieved studies’ eligibility, this stage was conducted like the abstract screening stage.
Two independent reviewers utilised a standardised and pilot tested full-text screening checklist tool (see Sup-
plementary Appendix No. 2 – Full-text Screening Google Form) for reliability and applicability.
At this stage, the disagreement was assessed using Cohen’s Kappa coefficient (κ) statistic on Stata 13.0SE
(StataCorp College Station, TX, USA), a robust statistic used for inter-rater reliability testing (Supplementary
Appendix No. 1 – Table 5)27. Detected differences between reviewers were resolved through discussion and a
third arbitrator.
The excluded articles at each screening stage were stored in a different EndNote X9 virtual library. Reasons
for exclusion of studies were documented per each stage (see Fig. 1).
Step 5: Data extraction. The data extraction procedure required two professional reviewers who extracted
data separately and in duplicate to detect inter-rater errors and reduce data errors and bias. A standardised data
extraction tool prepared in a Google Form format, based on a checklist provided in the Cochrane Handbook for
Systemic Reviews for Intervention, was u sed28. Feedback was solicited from all authors regarding the draft list of
data variables for extraction. The final data extraction tool was calibrated and piloted for reliability and appli-
cability on the first three eligible studies to maintain accuracy and ensure all necessary information is captured.
For every study that met our eligibility criteria for inclusion, two reviewers working independently and in
duplicate extracted essential data related to study characteristics, assessment of food insecurity, metabolic risk
diagnoses, crude prevalence estimates (number of cases divided by the sample size) and outcome of interest meas-
ures (effect size data including the prevalence of key metabolic risk factors, measures of prospective associations
with 95% confidence intervals, and covariates evaluated). A full list of data items extracted from each included
studies is presented as supplementary material (Supplementary Appendix No. 2 – Data Extraction Google Form).
The coordinator resolved disagreements between the two reviewers, and the decision was either taken to have a
third reviewer to re-examine the study or extract all the necessary data from the studies concerned, guided by
the same extraction process as outlined above.
In this meta-analysis, we extracted and used measures of associations that were the most adjusted for one or
more sets of potential confounders such as socio-demographic and lifestyle factors only to reduce confounding
and measurement errors, ensure consistency across studies and reduce bias. For more detail, missing details or
inconsistencies, the authors of the included studies were contacted by e-mail, if any, with up to three attempts.
The studies concerned were excluded after three unsuccessful attempts to contact the author.
Scientific Reports | (2021) 11:5178 | https://doi.org/10.1038/s41598-021-84344-0 4
Vol:.(1234567890)www.nature.com/scientificreports/
Figure 1. Preferred Reporting Items for Systematic Reviews and Meta-Analysis (PRISMA) flow diagram of
literature search and study selection process. Source: Adopted from Ref.20
Step 6: Assessment of study quality and risk of bias. The methodological quality (or risk of bias) of each included
study was assessed by two reviewers independently, using the Mixed Methods Appraisal Tool (MMAT) – Ver-
sion 201821. The appraisal tool consists of two core assessment domains addressing the external validity (risk of
selection, data collection and non-response bias) and five further assessment domains addressing the internal
validity (systematic error—the risk of measurement bias and bias related to data analysis) deemed relevant to
appraise the methodological quality of cross-sectional s tudies22. The summary of the domains critically assessed
is provided as supplementary material (Supplementary Appendix No. 2 file).
In order to generate an overall risk of bias assessment, an overall percentage quality score was calculated for
each included study (study quality of reporting) based on the assessment of each domain and the overall risk
Scientific Reports | (2021) 11:5178 | https://doi.org/10.1038/s41598-021-84344-0 5
Vol.:(0123456789)www.nature.com/scientificreports/
of bias across domains. The scores were interpreted as of low quality if ≤ 50%—average quality if 51–75%—and
high quality if 76–100%. Differences in rating quality scores were resolved by discussion among the authors until
consensus was reached. However, studies were not excluded based on quality, but quality scores were reported
descriptively by indicating the methodological issues in each study and how these may influence the interpreta-
tion of the overall quality of evidence for each outcome.
The overall quality of evidence (or certainty in the findings) for each outcome collected was assessed based on
study methodological quality, results from sensitivity analysis, and by downgrading and upgrading the baseline
quality score for cross-sectional studies, according to the domains specified in the grades of recommendation,
assessment, development, and evaluation (GRADE) g uidelines29. The completed GRADE checklist and reasons
to up-or down-grade quality of evidence in GRADE is provided as supplementary material (Supplementary
Appendix No. 1 – Table 4).
Step 7: Data synthesis and analysis of results. (a) The primary outcome of interest—evidence of the associations
between food insecurity and key metabolic risk factors. The primary outcome of interest in the current system-
atic review was evidence of associations between food insecurity and key metabolic risk factors for diet-sensitive
NCDs, as reported in studies conducted in sub-Saharan African populations. However, upon re-evaluating the
included studies and the relevant data extracted from these studies, we recognised the need to stratify the evi-
dence of associations as reported by the studies into three strata of associations: Adverse Association, Non-
significant Association, and Inconclusive Association.
1. [−] Adverse Association—Food insecurity was reported to be significantly associated with ≥ one key meta-
bolic risk factor (observed with relevant statistical tool);
2. [+] Non-significant Association—There was no significant association found between food insecurity and
reported key metabolic risk factors (observed with relevant statistical tool); and
3. [~] Inconclusive Association—The association between food insecurity and reported metabolic risk outcomes
were inconclusive because, although exposure to food insecurity showed a protective effect toward reported
metabolic risk factors, it was not statistically significant (observed with relevant statistical tool).
Furthermore, the reporting of the association effects relative to food insecurity was inconsistent across included
studies (illustrated in Table 3); thus a narrative synthesis was performed to identify the specific key metabolic risk
factors associated with food insecurity in sub-Saharan Africa. The included studies were manually coded into
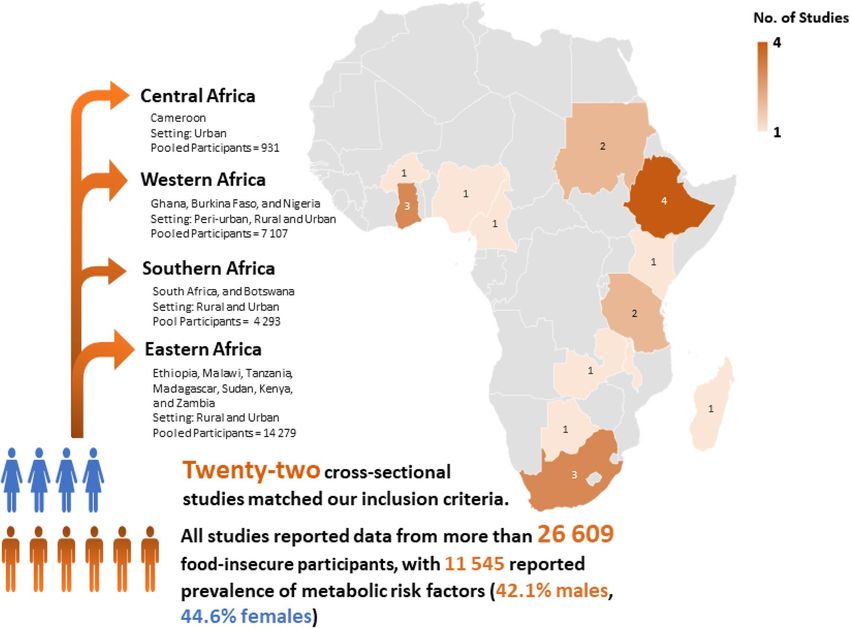
strata’ as explained above, and presented in the compiled summary of the extracted data table (see Table 3). The
authors then used Canva version 2.93.0, an interactive web-based graphic design tool, to model an African map
showing the four regions where the included studies and the number of study participants were located (Fig. 2)30.
(b) The secondary outcome of interest—prevalence estimates of metabolic risk factors associated with food inse-
curity among the food‑insecure patients. After analysing the primary outcome, and identifying the spectrum
of key metabolic risk factors associated with food insecurity, the secondary outcome was the prevalence of these
metabolic risk factors among the food-insecure population in sub-Saharan Africa; and to visualise the variation
patterns in the occurrence of these metabolic risk factors by gender and geographic area. A similar type of meta-
bolic risk factors were pooled from each study for overall estimates.
(c) Statistical analysis. The prevalence estimates of key metabolic risk factors associated with food insecurity
among the food-insecure patients were calculated by meta-analysis. The meta-analysis was performed using the
statistical software MetaXL version 5.3 (EpiGear International, Sunrise Beach, Queenland, Australia) to combine
all studies’ p revalence31. The pooled prevalence of metabolic risk factors and it’s 95% confidence interval (CI)
were analysed using the random-effects model, utilising the inverse variance method of the DerSimonian-Laird
approach to estimate the heterogeneity between-study p opulation31. Forest plots were drawn showing the vari-
ation of the prevalence among all included studies together with the pooled prevalence estimates. Studies with
a low risk of bias and outcomes deemed to be sufficiently homogenous; were selected for inclusion in the meta-
analysis to compute the pooled prevalence estimates.
Heterogeneity in meta-analysis is inevitable due to differences in study quality, sample size, method, and
outcome measurements across studies. Therefore, all meta-analyses were statistically, appraised for significant
inter-study heterogeneity by using the I2 statistics for statistical significance of heterogeneity (i.e., the percentage
of variance not due to studies-wide sampling error), where the significance was considered as per the guidelines
of the Cochrane Handbook for Systematic Reviews of Interventions28. Consequently, an I2 value of ≥ 75% suggests
a substantial heterogeneity.
Furthermore, by sequential omission of one study at a time, sensitivity analyses were performed to assess the
meta-analysis results’ stability and evaluate the potential influence of single studies on the pooled prevalence
estimates. Subgroup analyses were performed to evaluate the influence of the difference in age, gender, pub-
lication year, and geographic area among the included studies. Moreover, publication bias (Meta-biases) was
assessed by visual inspection of the funnel plots (a plot of effect estimates against sample sizes) for asymmetry,
complemented with the Egger regression test23. The graph’s symmetrical shape was interpreted as the absence
of publication bias, while an asymmetrical shape of the graph was interpreted as the possibility of publication
bias28,32. However, these quantitative tests were not run for meta-analyses with a small number of studies (n < 10).
Scientific Reports | (2021) 11:5178 | https://doi.org/10.1038/s41598-021-84344-0 6
Vol:.(1234567890)www.nature.com/scientificreports/
Method of ascertainment Significant findings
Country, Reported
Author, geographical Population Criterion for association effects
publication year setting details, age (y) Sample size, gender Food insecurity diagnosis The outcome, n diagnosed* relative to FI
[−] Household
Self-reported— food insecurity
All permanent ‘Yes’ when asked was significantly
Ethiopia, rural and M—35.3% Food insecurity M—137
Abebe, 201749 residents of the 1160 whether they ‘ever Hypertension associated with
urban F—4.7% access scale F—261
HDSS site, ≥ 1 year had clinician diag- hypertension
nosed HTN?’ (AOR = 1.71; 95%
CI 1.37 to 2.12)
[−] Inadequate
intake of fruit
The WHO STEP- and vegetables,
All employees wise approach to was significantly
M—59.0% Minimum M—254
Agaba, 201733 Nigeria, Urban of the univer- 883 chronic disease Dyslipidaemia associated with
F—41.0% Adequate Diet F—199
sity, ≥ 18 years risk factor surveil- the reported Diet-
lance Sensitive NCDs
Risk Factor (94.6%;
95% CI: 92.8–95.9)
The WHO STEP- [−] Inadequate diet
wise approach to significantly asso-
School adolescents, M—41.1% Minimum M—22
Anteneh, 201534 Ethiopia, urban 431 chronic disease Obesity ciated with Obe-
10—24 years F—58.9% adequate diet F—50
risk factor surveil- sity: 19.83, 95% CI:
lance 3.96–99.23)
[−] Below
Minimum Dietary
The physical Diversity was
Residents of
examination to found to be a
asesewa in the
M—44.0% Minimum dietary confirm hyperten- M—28 contributory
Colecraft, 201848 Ghana, Semi-Rural upper manya 1165 Hypertension
F—56.0% diversity sion diagnosis F—35 factor to having
krobo dis-
completed by a either an isolated
trict, ≥ 25 years
nurse elevated SBP or
both elevated SBP
and DBP
[-] Acute-on-
chronic malnutri-
tion (OR 1.98,
Integrated 95% CI 1.12–3.50,
Weight-for height
Children in management of P = .02) and acute
M—62.2% is used as an indi- Acute respiratory M—45
Cox, 2016 43 Malawi, Rural rural Monkey 828 childhood Illness malnutrition
F—37.8% cator of nutritional infections (ARI) F—24
Bay, ≤ 5 years (IMCI) guidelines (OR 2.62, 95% CI
status
by doctors 1.17–5.89, P = .02)
was significantly
associated with
having ARI
[−] A signifi-
cant association
between Low
Primary school The WHO Obesity Obesity,
M—41.7% Minimum M—61 fruit/vegetable
Desalew, 201736 Ethiopia, Urban children, 448 and Overweight Overweight and
F—58.3% Adequate Diet F—85 intake per day and
11—15 years fact sheet Underweight
reported metabolic
risk-AOR 1.3 (0.3,
5.1); 1.2 (0.3,5.4)
[−] LVMI values
increased in
Enrolled children Malnutrition An echocardio-
proportion to
Madagascar, who came for M—47% status according graphic evaluation left ventricular M—63
Di Gioia, 2016 35 313 BMI percentiles
Urban routine visits, F—53% to BMI/ Quetelet performed by a mass F—61
29.8 ± 10.8 g/m 2.7
4–6 years index doctor
in the malnutrition
group
[ +] No significant
Self-care practice
Hypertensive Low level of association Non-
adopted from
Gebremichael, Ethiopia, rural and patients in a M—48.8% adherence to M—92 Adherence to
320 hypertension self- Hypertension
201950 urban specialized hospi- F—51.2% DASH—A score of F—76 dietary manage-
care activity level
tal, ≥ 18 years 6 or better ment 0.949
effects (H-scale)
(0.508–1.772)
[-] A significant
The WHO STEP-
association
Nationally Repre- wise approach to Hypertension,
Burkina Faso, rural M—48.2% Minimum M—1114 between intake of
Soubeiga, 201751 sentative Sample, 4,629 chronic disease Obesity, and
and urban F—51.8% Adequate Diet F—1181 butter versus none
25 to 64 years risk factor surveil- Underweight
or vegetable oil
lance
(1.98, 1.22 to 3.22)
[−] Healthy dietary
Patient charts indi-
Retrospective chart pattern was signifi-
cating a diagnosis Hypertension,
Katalambula, audit study in two M—47.2% Minimum Dietary M—239 cantly negatively
Tanzania, Urban 1450 of CRC per the Obesity, and
201837 national hospitals, F—52.8% Diversity F—276 correlated with
ICD-10—WHO overweight
26–65 years HTN (ARR = 0.82,
Version for 2016
CI: 0.68–0.99)
Continued
Scientific Reports | (2021) 11:5178 | https://doi.org/10.1038/s41598-021-84344-0 7
Vol.:(0123456789)www.nature.com/scientificreports/
Method of ascertainment Significant findings
Country, Reported
Author, geographical Population Criterion for association effects
publication year setting details, age (y) Sample size, gender Food insecurity diagnosis The outcome, n diagnosed* relative to FI
[−] None exclu-
Anthropometric
sively breastfed
Self-reported ‘yes’ data were collected
Residents of children were
M—32.2% to the practice of through the meas- Underweight, and M—211
Kejo, 201844 Tanzania, Rural Arusha Dis- 436 associated with
F—23.2% exclusive breast- urement of length/ Stunting F—130
trict, ≤ 5 years underweight
feeding height and weight
(AOR: 2.5, 95% CI:
of all children
1.0–6.3)
[−] Urban slum
The WHO STEP- women who had
Female Residents
wise approach to middle dietary
of 3 slums in M—0% Minimum Dietary Hypertension and M—0
Lapauw, 201638 Ghana, Urban 250 chronic disease diversity had
Accra, 15 – F—100% Diversity Obesity F—162
risk factor surveil- greater odds (OR,
49 years
lance 1.13; CI, 0.66, 1.92)
of developing MetS
[−] People who
The WHO STEP- had low fruit and
Permanent
wise approach to Hypertension, vegetable intake
South Africa, residents of the M—37.4% Minimum M—337
Maimela, 201645 1403 chronic disease Obesity, and were found to be
Rural Dikgale HDSS site, F—62.6% Adequate Diet F—835
risk factor surveil- overweight 1.8 times more
≥ 15 years
lance likely to have MetS
(p < 0.05)
[−] Inadequate
The WHO Study intake of fruit
Mbaissouroum, South Africa, South African Citi- M—41% Minimum on Global Aging M—225 and vegetables,
2145 Hypertension
201752 Rural and Urban zens, ≥ 60 years F—59% Adequate Diet and Adult Health F—569 was significantly
(SAGE) associated with the
reported HTN
[−] Increased die-
Permanent resi- Self-reported, Hyperten- tary diversity score
Mohammed, dents in two peri- M—50% Minimum Dietary medical records sion, Obesity, M—52 was associated
Ghana, Peri-urban 180
201647 urban communi- F—50% Diversity and physical Overweight and F—72 with decreased
ties, 18–45 years examination Underweight MetS prevalence
(pwww.nature.com/scientificreports/
Method of ascertainment Significant findings
Country, Reported
Author, geographical Population Criterion for association effects
publication year setting details, age (y) Sample size, gender Food insecurity diagnosis The outcome, n diagnosed* relative to FI
[−] Inadequate
intake of fruit
The WHO STEP-
Minimum and vegetables
Residents of the wise approach to Dyslipidaemia
M—48.6% Adequate Diet, M—169 (AOR, 1.97; 95%
Tateyama, 2018 46 Zambia, Rural Mumbwa district 690 chronic disease Hypertension, and
F—51.4% Food Insecurity F—183 CI, 1.05–3.68)
aged 25–64 years risk factor surveil- Obesity
access scale were significantly
lance
associated with
BMI 25 kg/m2
Table 3. Characteristics of 22 included studies marching eligibility criteria, reporting the association between
food insecurity and key metabolic risk factors in sub-Saharan Africa. [−] Adverse—Food insecurity was
reported to be significantly associated with ≥ one critical metabolic risk factors. [+] Non-significant—There was
no significant association between food insecurity and reported key metabolic risk factors. [~] Inconclusive—
The association between food insecurity and reported metabolic risk factors was inconclusive because,
although exposure to food insecurity showed a protective effect toward MetS, it was not statistically significant.
*n diagnosed—the number of participants diagnosed with the reported metabolic risk factor, for male (M) and
females (F).
(d) Principal summary measures. The included studies were cross-sectional study designs, the data for the
relationship between food insecurity and key metabolic risk factors were measured and analysed cross-sec-
tionally rather than longitudinally; therefore, the chief summary measures included prevalence along with
percentages (%), 95% confidence intervals (95% CI) were reported. The results of this systematic review and
meta-analysis were reported based on the Preferred Reporting Items for Systematic Review and Meta-Analysis
Figure 2. Map of Africa indicating the regions where the included studies were situated and the number of
pooled study participants [Figure generated by the first author using Canva version 2.93.030, Available from:
http://about.canva.com/].
Scientific Reports | (2021) 11:5178 | https://doi.org/10.1038/s41598-021-84344-0 9
Vol.:(0123456789)www.nature.com/scientificreports/
Participants diagnosed with
metabolic risk factors
Studies reference Reported type of metabolic risk factors Male (5239) Female (6306)
(n = 5 studies of high quality, n = 7 of average quality)
34,36,40–42,45–47,51,54 Obesity 326 (6.2%) 896 (14.2%)
33,46,54
(n = 2 studies of high quality, n = 1 of average quality Dyslipidemia 395 (7.5%) 235 (3.7%)
(n = 6 studies of high quality, n = 6 of average qual-
Hypertension 1509 (28.8%) 2681 (42.5%)
ity)37,38,42,45–53
(n = 2 studies of high quality, n = 4 of average qual-
Underweight 592 (11.3%) 220 (3.5%)
ity)36,39,42,44,47,51
(n = 2 studies of high quality, n = 5 of average qual-
Overweight 370 (7.1%) 561 (8.9%)
ity)36,37,39,40,42,45,47
41,44
(n = 2 of average quality) Stunting 1991 (38.0%) 1576 (25.0%)
(n = 1 of high quality)43 Acute Respiratory Infections (ARI) 45 (0.9%) 24 (0.4%)
(n = 1 of average quality)35 left ventricular mass (LVM) 51 (1.1%) 73 (1.2%)
Table 4. A qualitative description of key metabolic risk factors prevalence derived from 22 individual studies.
statement (PRISMA) guidelines. The entire study screening, selection, and inclusion process are shown with a
flow diagram’s support. Moreover, tables and narrative summaries are used to report the evidence of the associa-
tions between food insecurity and key metabolic risk factors and the risk of bias for every eligible study.
Ethical approval and consent to participate. This paper is a Systematic Review and Meta-analysis
study that relied strictly on the review of existing literature, and no human participants were involved. Therefore,
ethical approval and consent to participate by human participants were not applicable.
Results
Screening results. The initial electronic bibliographic database searches yielded 11 803 potentially eligible
articles (Supplementary Appendix No. 1 – Table 1). Following title screening, 10 918 articles were excluded, and
885 met the eligibility criteria and were exported to the EndNote X9. Hand-searching yielded 19 articles that
could not be captured by the primary search strategies, which were also exported to EndNote X9 virtual library.
A total of 105 duplicates was removed from the library, leaving 799 articles eligible for abstract screening. Fol-
lowing abstract screening, 93 articles were considered suitable for thorough assessment in the full-article screen-
ing stage, during which 71 of them were excluded. Full-article screening yielded 22, which were selected for
inclusion in data extraction and were included in the narrative synthesis after passing the methodological quality
assessment. Nineteen articles were deemed to be sufficiently homogenous for inclusion in the meta-analysis. See
Fig. 1 for the PRISMA flow chart detailing the study selection and exclusion process.
The inter-rater reliability score for the full-article screening stage showed that there was a 92.5% agreement
versus 62.2% expected by chance, which constitutes a considerably high agreement between screeners (Kappa
statistic = − 0.80 and p-value < 0.05) (see Supplementary Appendix No. 1 – Table 5). McNemar’s chi-square
statistic suggests no statistically significant difference in the proportions of yes/no answers by reviewers with
p-value > 0.05.
Methodological quality (or risk of bias) assessment. The quality of the studies has been examined;
Table 2 in the supplementary material (Supplementary Appendix No. 1 – Table 2 and 3) provides details of
study quality based on the Mixed Methods Appraisal Tool (MMAT) – Version 2 01821. In more recent studies,
the methodological quality was generally higher, with one study rated the lowest (57.1%). The overall risk of
bias across domains was judged to be low or unclear. We identified a potential source of bias in the confounding
assessment; eight studies were found to have a high risk of bias. Overall, the GRADE quality of evidence for each
outcome was assessed as very low quality of evidence to support these associations.
Characteristics of included studies. Table 3 presents the baseline characteristics, and significant findings
of all the included 22 studies with a total sample of 26,609 (46.8% males) food-insecure participants, with 11,545
(42.1% males) reported prevalence of metabolic risk factors (Table 4). The studies were conducted between 2015
and 2019, contributing very recent evidence of the associations between food insecurity and specific key meta-
bolic risk factors observed among children (00–14 years), youths (15–24 years), and adults (25–64 years), and
senior (≥ 65 years) participants (see Table 3).
All twenty-two included studies employed cross-sectional study design in stock and covered different geo-
graphic settings, distributed across four sub-Saharan Africa regions. A large proportion of the studies (n = 10
studies) was conducted in urban settings33–42, and four conducted in rural settings43–46. One study was conducted
in a peri-urban47, and one study in a semi-rural s etting48. The remaining six studies recruited participants from
both rural and urban s ettings49–54. Figure 2 shows the distribution of the rest of the studies by country and regions
of sub-Saharan Africa, with only 1 study from Central Africa42 and 12 from Eastern Africa.
Scientific Reports | (2021) 11:5178 | https://doi.org/10.1038/s41598-021-84344-0 10
Vol:.(1234567890)www.nature.com/scientificreports/
(a) Food insecurity ascertainment. The adjustment for confounding factors was made in all twenty-two
included studies; the most commonly adjusted factors were related to socio-demographic and lifestyle factors.
The methods of assessing food insecurity exposure and ascertaining metabolic risk outcomes varied across the
twenty-two included studies. Food insecurity exposure was generally measured either at a household level or at
an individual level and indicated categorically.
In this group of studies, a subset (3 studies) involved designs where researchers measured food insecurity at
the household level using the Household Food Insecurity Access Scale (a six-item short questionnaire), a valid
scale for assessing food insecurity41,46,49. If the subjects were responded to two or more of the six items, they
were classified as food insecure. Another subset (9 studies) measured food insecurity at an individual level using
the Minimum Adequate Diet c riterion33,34,36,40,42,45,46,51,52, and the Minimum Dietary Diversity criterion (5 stud-
ies)37,38,47,48,54, in which the individuals confronted with food insecurity had reported lower rates of consumption
of fruits, vegetables, and lower proportion of eating from less than four food groups, due to inconsistent access
to food.
The last subset (4 studies) used more than one tool to gauge food i nsecurity39,46,53,54. While studies on children
≤ 5 years used the Minimum Meal Frequency c riterion39, the Weight-for-height c riterion43, and the Quetelet
index35. However, of the studies that examined the age ranges linked to childhood and adolescence, none con-
sidered the findings separately by groups of children and teenagers since they vary in terms of growth, progress,
and maturation. These variations can impact the existence of metabolic risk factors. See Supplementary Appendix
No. 1 – Table 6 for a detailed list of reported tools/ methods definitions and theoretical minimum risk exposure
level/ scales used to ascertain food insecurity for each study.
(b) Metabolic risk factors ascertainment. Collectively, the included studies assessed the association between
food insecurity and a variety of specific key metabolic risk factors, using a total of ten international diagnostic
criteria to diagnose metabolic risk outcomes (see Supplementary Appendix No. 1 – Table 7). The WHO STEP-
wise approach to chronic disease risk factor surveillance diagnostic criteria was found to be the most used diag-
nostic tool (6 studies)33,34,36–38,45,46,51; while a combination of a self-reported pretested questionnaire administered
by a nurse or doctor followed by either an anthropometric measurement, screening of medical records, physical
examination, and biochemical analyses to confirm condition—was the second most used diagnostic tool (5 stud-
ies)39,42,47,49,50. One study on seniors ≥ 60 years used the WHO Global Aging and Adult Health (SAGE) criteria
to diagnose metabolic risk o utcomes52. The rest of the included studies use either hypertension self-care activity
level effects (H-scale), Integrated Management of Childhood Illness (IMCI) guidelines, the WHO Obesity and
Overweight fact sheet guidelines, echocardiographic evaluation, patient charts indicating a diagnosis per the
ICD-10—WHO Version for 2016, the International Obesity Task Force guidelines, height-for-age Z-scores for
the HFA using the ‘WHO Child Growth Charts, and lastly The National Cholesterol Education Program-Adult
Treatment Panel.
Results of individual studies. The systematic review revealed evidence on the associations between food
insecurity and specific key metabolic risk factors on the causal pathway to diet-sensitive non-communicable
diseases (NCDs). These metabolic risk factors are dyslipidaemia, underweight, left ventricular mass, obesity,
hypertension, acute respiratory infections (ARI), and overweight observed in children (00–14 years), youths
(15–24 years), adults (25–64 years), and senior (≥ 65 years) participants, pooled across sub-Saharan African
countries.
(a) The primary outcome—evidence of the associations between food insecurity and key metabolic risk factors. The
associations between food insecurity and metabolic risk outcomes were identified by coding the accumulated
evidence on the associations into three strata, namely: [−] Adverse associations, [+] Non-significant associa-
tions, and [~] Inconclusive associations. In summary, Table 3 details the significant findings of all the twenty-two
included studies.
In strata 1, 20 of the 22 studies reported that exposure to food insecurity might be adversely associated with
the presence of at least one analyzed metabolic risk factor. Of the 20 studies demonstrating a significant associa-
tion, 14 were of high quality and 6 of average quality. The association existed even for marginal food security (a
less severe level of household food insecurity) (Table 3)33,34,37–40,42,45–49,51–53.
Seven studies with children as participants (00–14 years) within this stratum reported an increased risk
of stunting and underweight in children from moderately and severely food-insecure households by 19 and
22%36,41,44. The association between left ventricular mass (LVM) and malnutrition was found in Di Gioia et al.35,
in which the population with food insecurity reported statistically lower LVM index values (29.3 ± 10.1 g/m2,7
vs. 33.6 ± 12.5 g/m2,7, p = 0.001), relative to normal nutritional status (29.8 ± 10.8 g/m2,7 vs. 32.9 ± 12.1 g/m2,7,
p = 0.02). Cox et al.43 observed that acute-on-chronic malnutrition and acute malnutrition was significantly
associated with having acute respiratory infections (ARI) which was demonstrated with AOR of 1.98 (95% CI:
1.12–3.50, p = 0.02) and 2.62 (95% CI: 1.17–5.89, p = 0.02) respectively.
However, in strata 2, Gebremichael et al.50 in adults and senior based study in Tigray, Ethiopia (n = 1 of high
quality, 100%), showed a statistically non-significant AOR of 0.949 (95% CI: 0.508–1.772, p = 0.869) demonstrat-
ing a slight positive association between hypertension and exposure to below minimum adequate diet, in which
the population with food insecurity reported fewer than five servings of fruits and vegetables per day.
Finally, in strata 3, Omech et al.54 assessed the associations between dyslipidaemia, obesity and exposure
to food insecurity in an adults-only study participant (n = 1 of average quality, 71%). He found that although a
low rate of daily consumption of vegetables, fruit, and berries showed a protective effect on dyslipidaemia and
obesity, it was not statistically significant and was not included in the multivariate analysis. Thus, the association
Scientific Reports | (2021) 11:5178 | https://doi.org/10.1038/s41598-021-84344-0 11
Vol.:(0123456789)www.nature.com/scientificreports/
45.0% 42.5%
40.0% 38.0%
35.0%
28.8%
30.0%
25.0%
25.0%
20.0%
14.2%
15.0%
11.3%
8.9%
10.0% 7.5% 7.1%
6.2%
3.7% 3.5%
5.0%
0.9% 0.4% 1.0% 1.2%
0.0%
Obesity Dyslipidemia Hypertension Underweight Overweight Stunng Acute Le
Respiratory Ventricular
Infecons Mass
Male Female
(ARI)
Figure 3. The metabolic risk factors prevalence derived from 22 studies by gender strata.
between dyslipidemia, obesity, and exposure to food insecurity was inconclusive. More studies are warranted
on stratum two and three reported associations; as one study is insufficient and possible reasons for this are
discussed under the limitation’s section.
(b) The secondary outcome—prevalence estimates of metabolic risk factors associated with food insecurity among
the food‑insecure patients. After identifying the spectrum of key metabolic risk factors associated with food
insecurity, we conducted a meta-analysis to determine the pooled prevalence estimates of this spectrum of meta-
bolic risk factors among the food-insecure patients in sub-Saharan Africa. The prevalence estimates of these
metabolic risk factors pooled from the 22 included studies, differed significantly across gender, as Fig. 3 and
Table 4 illustrates. This analysis was done to identify the population groups most likely at higher risk by visualis-
ing the prevalence profile of metabolic risk factors; predisposing them to develop diet-sensitive NCDs such as
diabetes or cardiovascular diseases.
The twenty-two included studies collectively presented prevalence data on 26,609 (46.8% males) residents
of sub-Saharan Africa. The frequency Table 4 shows the pooled number of participants diagnosed with the
spectrum of metabolic risk factors relative to the total number diagnosed for males and females. The percentage
with respects to these totals is shown in parenthesis. Notably, there appears to be a slight difference between
female participants (44.6%) diagnosed with the different key metabolic risk factors and their male counterparts
(42.1%) who were also diagnosed. Regarding geographic distribution, the reported prevalence of metabolic
risk factors among the food-insecure patients in sub-Saharan Africa ranged from the lowest in Western Africa,
Ghana (63/1165; 5.4%)48 to the highest in Southern Africa, South Africa (1172/1403; 83.5%)45 (Table 3: pooled
estimate was found to be 41.8%, 95% CI: 33.2% to 50.8%, I 2 = 99.5% p-value < 0.00).
Results of meta‑analysis. 19 out of the 22 included studies were of sufficient quality for inclusion for
meta-analysis (Fig. 1). A substantial degree of heterogeneity was detected across studies from the 19 studies
assessing the associations between food insecurity and metabolic risk factors. Possible reasons for this are dis-
cussed under the limitation’s section.
Concerning pooled prevalence estimates of specific key metabolic risk factors among the food-insecure
patients, we tried to combine similar metabolic risk factors pooled from various studies with the number of
participants diagnosed with that outcome factor. The results are summarised and presented in the forest plots
(Figs. 4, 5). However, due to the low number of studies that reported stunting, acute respiratory infection (ARI),
and left ventricular mass (LVM) types of metabolic risk factors (less than 3), a meta-analysis could not be
undertaken for those studies.
(a) Pooled prevalence estimates for being the underweight and overweight among food‑insecure participants. The
pooled prevalence estimates for being underweight among the food insecure participants, derived from six
studies, was found to be 12.2% (95% CI: 7.0% to 18.5%), irrespective of diagnostic criteria (Fig. 4A). Substan-
tial heterogeneity was detected by I2 statistic between each of the six studies (I2 = 97.14% p-value < 0.00). The
pooled prevalence estimates for being overweight among the food insecure participants, derived from seven
studies, was found to be 15.8% (95% CI: 10.6% to 21.7%) and the observed heterogeneity detected at I 2 = 96.89%
p-value < 0.00 (Fig. 4B).
(b) Pooled prevalence estimates for hypertension, obesity, and dyslipidaemia among the food insecure partici-
pants. The pooled prevalence estimates for hypertension and obesity among the food insecure participants,
Scientific Reports | (2021) 11:5178 | https://doi.org/10.1038/s41598-021-84344-0 12
Vol:.(1234567890)www.nature.com/scientificreports/
Figure 4. Forest plot showing study-specific and pooled estimates for being underweight and overweight
prevalence in Sub-Saharan Africa, from studies published during the period 2015–2019, (A: The pooled
prevalence estimates for being underweight; B: The pooled prevalence estimates for being overweight).
derived from 12 studies was found to be 24.7% (95% CI: 15.6 to 35.1%, I 2 = 99.4% p-value < 0.00) (Fig. 5A), and
12.8% (95% CI: 7.4 to 19.5%, I2 = 98.85% p-value < 0.00) respectively (Fig. 5B). The pooled prevalence estimates
for dyslipidaemia among the food insecure participants, derived from 3 studies was found to be 27.6% (95% CI:
6.5% to 54.9%), heterogeneity was detected by I2 statistic at I2 = 99.18% p-value < 0.00 (Fig. 5C).
(c) Exploration of heterogeneity. Across the included studies in the meta-analyses, substantial heterogeneity
was detected in all the pooled estimations. Due to the small number of studies (n < 10), thus providing limited
ability to detect the cause of heterogeneity; the exploration of potential sources of significant heterogeneity was
not formally conducted. Secondly, we could not explore publication bias with examining the funnel plots for
asymmetry, for the reason that in the presence of high heterogeneity, there is no reason to expect a plot of esti-
mates against their SEs to have a funnel shape. However, pooling of estimates according to the year of publication
suggests an increase in metabolic risk factors prevalence over time: 31.6% (95% CI: 2.2% to 67.3%) across studies
published in 2015; increasing to 44.7% (95% CI: 17.4% to 73.1%) from studies published after 2015. The varia-
tions between males and females are shown in Fig. 6.
(d) Sensitivity analyses. We explored the influence of each study on the overall meta-analyses’ summary esti-
mates. Accordingly, there was no significant improvement on the degree of heterogeneity, compared to the com-
bined estimate obtained by omitting any one single study included in these meta-analyses or any of the expected
outliers.
Discussion
Metabolic risk factors warrant particular public health effort, due to their substantial contribution to global
disease burden, rapidly increasing trends, and variable patterns in incidence by age, gender, or region across
countries4,8,10.
While there are progressively better estimates of the prevalence of metabolic risk factors and proximate drivers
of this prevalence in high-income countries; reliable data on the trend and patterns of key metabolic risk factors
among the food insecure population in resource-limited settings, such as sub-Saharan African countries still lag
far behind55. The primary objective of this systematic review and meta-analysis was to use accumulated evidence
published between January 2015 and June 2019, to determine the associations between food insecurity and key
metabolic risk factors for diet-sensitive NCDs. After analysing the accumulated evidence of associations, and
identifying the spectrum of metabolic risk factors associated with food insecurity, the secondary outcome was the
prevalence estimates of these metabolic risk factors among the food insecure participants in sub-Saharan Africa.
Our systematic review findings revealed that exposure to food insecurity might be adversely associated with
the presence of specific key metabolic risk factors on the causal pathway to diet-sensitive NCDs in children
(00–14 years), youths (15–24 years), adults (25–64 years), and senior (≥ 65 years) participants. In the context
of sub-Saharan Africa, food insecurity affects approximately more than 257 million (1 in 3) p eople4; our meta-
analysis pooled prevalence estimate for metabolic risk factors, was found to be 41.8% (95% CI: 33.2 to 50.8%)
Scientific Reports | (2021) 11:5178 | https://doi.org/10.1038/s41598-021-84344-0 13
Vol.:(0123456789)You can also read