BIS Working Papers Debt De-risking No 868 - Bank for International Settlements
←
→
Page content transcription
If your browser does not render page correctly, please read the page content below
BIS Working Papers
No 868
Debt De-risking
by Jannic Cutura, Gianpaolo Parise and
Andreas Schrimpf

Monetary and Economic Department

June 2020

JEL classification: G11, G23, G32, E43.

Keywords: corporate bond funds, bond market liquidity,
asset managers, risk-taking, competitive pressures.

BIS Working Papers are written by members of the Monetary and Economic
Department of the Bank for International Settlements, and from time to time by other
economists, and are published by the Bank. The papers are on subjects of topical
interest and are technical in character. The views expressed in them are those of their
authors and not necessarily the views of the BIS.

This publication is available on the BIS website (www.bis.org).

©   Bank for International Settlements 2020. All rights reserved. Brief excerpts may be
    reproduced or translated provided the source is stated.

ISSN 1020-0959 (print)
ISSN 1682-7678 (online)
Debt De-risking                     ⇤

           Jannic Cutura                      Gianpaolo Parise               Andreas Schrimpf
       Goethe University Frankfurt               EDHEC & CEPR                      BIS & CEPR

  cutura@finance.uni-frankfurt.de         gianpaolo.parise@edhec.edu andreas.schrimpf@bis.org

                                      This version: June 3, 2020

                                               Abstract

       We examine the incentive of corporate bond fund managers to manipulate port-
       folio risk in response to competitive pressure. We find that bond funds en-
       gage in a reverse fund tournament in which laggard funds actively de-risk their
       portfolios, trading-o↵ higher yields for more liquid and safer assets. De-risking
       is stronger for laggard funds that have a more concave sensitivity of flows-to-
       performance, in periods of market stress, and when bond yields are high. We
       provide evidence that debt de-risking also reduces ex post liquidation costs by
       mitigating the investors’ incentive to run ex ante. We argue that, in the presence
       of de-risking behaviors, flexible NAVs (swing pricing) may be counter-productive
       and induce moral hazard. (JEL Codes: G11, G23, G32, E43)

   ⇤
     We thank Giulio Cornelli for excellent research support. We thank Viral Acharya, Sirio Aramonte,
Fernando Avalos, Matt Baron, Alexander Eisele, Kim Peijnenburg, Hyun Song Shin, and Kostas Tsatsaronis
for comments. The views in this article are those of the authors and do not necessarily represent those of
the Bank for International Settlements (BIS).
I. Introduction
A large branch of economics investigates how agents adapt their behavior to incentives. In
a seminal paper, Brown, Harlow, and Starks (1996) document that equity mutual funds
engage in tournament behaviors by which under-performing managers increase their risk
levels, gambling to improve their ranking against other managers. This attempt to manip-
ulate performance is consistent with the economic incentives that are provided by investor
behavior. In fact, Chevalier and Ellison (1997) and Sirri and Tufano (1998) find that in-
vestor flows are less sensitive to under-performance than to out-performance.1 This implies
that, by taking extra risk, under-performing fund managers face an asymmetric pay-o↵:
the potential upside in terms of climbing in the rankings and attracting new flows is large,
whereas the downside risk is more contained.
While there is consensus on how competition influences the risk-taking of equity mutual
funds, little is known on the implications for corporate bond mutual funds. The strategic
actions of bond funds in response to looming competitive threats are important for three
reasons. First, the bond fund industry has experienced unprecedented growth in recent
years, with many new funds launched and incumbent funds growing in size (see Figure 1).
This expanding supply of available investment vehicles has put fund managers in a tough
spot to deliver out-performance. Second, there is an inherent liquidity mismatch which
may pose a threat to financial stability: corporate bonds are an illiquid class, while the
funds themselves promise to their shareholders liquidity at all times. Fragilities may then
quickly unravel in fire-sale episodes.2 Finally, bond funds can be used as a laboratory to
improve our understanding of competitive incentives for other market participants (such as
banks and hedge funds) that share a similar liquidity mismatch but are more complex and
1
This finding has however been challenged by more recent research (see Spiegel and Zhang (2013)).
2
See, for example, the temporary dissonance between the value of corporate bond ETFs and the value
of the underlying assets in the midst of the Covid-19 crisis (“The liquidity doom loop in bond funds is a
threat to the system,” Financial Times, March 25, 2020), or the remarks given in June 2019 at the Bank
of England by the former governor Mark Carney, according to whom investment funds that hold illiquid
assets but o↵er daily redemptions to investors are “built on a lie.”
1somewhat less transparent.
To understand why risk-taking dynamics might di↵er for corporate bond funds, it is help-
ful to outline the intrinsic source of fragility to which open-end mutual funds are exposed.
Standard pricing rules require mutual funds to redeem investors’ shares at the daily-close
net asset value (NAV). However, the portfolio readjustments necessary to accommodate for
the decrease in assets under management (AUM) may take several days. While the first-to-
exit investors are liquidated at full price, the costs of these portfolio readjustments are borne
by the remaining investors, who face a dilution in the value of their shares. This feature
of open-end funds creates strategic complementarities among investors, as it generates a
first-mover advantage in the redemption decision (see Chen, Goldstein, and Jiang (2010)).
Importantly, mutual fund fragility is exacerbated by the illiquidity of corporate bonds.
Corporate bonds are notoriously difficult to trade, requiring a significant amount of inter-
mediation by dealers. To find a matching opposing interest at a fair price may sometimes
take several days, if not weeks. O✏oading large portfolio positions to dealers can therefore
be difficult. This means that sudden investor withdrawals may therefore force the fund
manager to execute fire sales that impose severe negative externalities on slow-moving in-
vestors. This, in turn, magnifies outflows in response to bad performance giving rise to a
flow-to-performance sensitivity (FPS) that has concave shape: investor outflows are sensi-
tive to bad performance more than inflows are sensitive to good performance (Goldstein,
Jiang, and Ng (2017)). Notably, fund fragility is somewhat mitigated for equity money
managers, as stock holdings tend to be more liquid. By contrast, in the context of cor-
porate bond funds, both relative fund performance and possible share value dilution are
important determinants of investor flows. As a result, while the pay-o↵ structure of equity
funds resembles being long a call option (Brown, Harlow, and Starks (1996)), that of bond
funds is more similar to being short a put option: Out-performance only rewards the fund
with mild inflows, whereas under-performance leads to large-scale redemptions.3 The main
3
Notably, most mutual funds charge fees on the assets under management rather than on performance.
Therefore, the best strategy from a profit-maximizing perspective is that of attracting as much dollar flows
as possible (irrespective of actual performance).
2goal of our paper is to explore how these considerations impact risk-taking decisions by
bond fund managers.
We begin our analysis by exploring how bond fund managers adjust their asset allocation
on the basis of relative performance. Our core finding is that laggard funds, i.e., funds that
under-perform their peers, actively de-risk their debt portfolio. This is achieved by tilting
portfolio allocation towards securities that pay lower yields but are more liquid and have
better ratings. We confirm our findings providing transaction-level evidence that laggard
funds purchase (sell) bonds that are of higher (lower) liquidity than the average bond in
their portfolio. The flip side of the coin is that this demand for liquidity forces laggard
funds to hold lower-yielding bonds. This gives rise to a reverse tournament: As realized
under-performance leads to investor redemptions, fund managers attempt to alleviate ex
ante liquidation costs accepting to hold less profitable securities. Notably, these dynamics
are the exact opposite of those documented in equity mutual fund tournaments, whereby
loser funds increase risk-taking and winner funds de-risk. In the bond fund context, the
threat of investor runs appears to dominate over the desire to increase performance, in
line with the incentive structure created by the concave shape of the sensitivity of flows to
performance.
Next, we explore how fund characteristics and market conditions influence the incen-
tives of laggard funds to de-risk. First, we document that de-risking is inversely U-shaped.
Both the top- and the worst-performing funds decrease risk levels. However, they do that
asymmetrically: under-performers decrease risk-taking significantly more than top perform-
ers. Second, we show that young funds and retail funds—which tend to have more concave
FPS—de-risk more in response to bad performance. Third, funds that have lower pre-
cautionary cash bu↵ers de-risk more, as the incentive to flee for havens is mitigated. We
also show that the strength of these e↵ects depends on market conditions: our results are
significantly stronger in periods of market stress and when the level of bond yields is higher.
We provide evidence that the decision by corporate bond fund managers to de-risk ex-
ante is generally quite e↵ective in averting investor runs. In particular, we document that
3laggard funds that decrease risk-taking more decisively, experience milder subsequent out-
flows. This finding suggests that investors take into account fund portfolio’s riskiness when
deciding whether to pull their money out. Back-of-the-envelope calculations indicate that
a one-standard-deviation decrease in risk-taking corresponds to a decrease of net outflows
from laggard funds by 50%. This finding has implications for the financial stability risks
posed by bond funds. As it is in the fund manager’s best interest to de-risk, the industry
exhibits a natural tendency to reduce risk exposures by itself without the need for regula-
tory intervention. The funds that are more vulnerable to runs, and would trigger the largest
negative externalities through fire sales, voluntarily reduce risk-taking thereby making runs
less likely. Notably, even in the case in which runs on funds do occur, fund managers end up
holding more liquid assets. This helps to avert the risk of an adverse feedback loop scenario
in which funding liquidity shocks and evaporating asset liquidity reinforce each other in a
downward spiral (see, e.g., Brunnermeier and Pedersen (2009)). Such inherent de-risking
incentives in turn raise the hurdle for regulatory intervention. These findings are consistent
with the anecdotal observation that, outside of periods of market turmoil, actual runs on
bond mutual funds have been infrequent events with limited repercussions on other market
participants.4
Our findings have policy implications. In October 2016, the U.S. Securities and Exchange
Commission (SEC) adopted new rules permitting U.S. open-end mutual funds to adopt
flexible NAVs, commonly known as swing pricing. Swing pricing allows funds to adjust
the NAV of redeeming investors depending on the total flows experienced by the fund,
thereby minimizing the dilution of non-redeeming investors. We find that swing pricing may
reinstate the moral hazard problem documented for equity funds, i.e., under-performers end
up having an incentive to take more risk. In line with this argument, we show that managers
of poorly-performing bond funds maintain high risk levels (or further increase them), as the
4
The most notable exception is that of the Third Avenue Focused Credit Fund (FCF). FCF was forced
to halt redemptions and close down in December 2015. Yet, the FCF case might not be representative, as
the fund was running unusually large and concentrated bets. For instance, Marty Whitman – the founder
of Third Avenue – is reported to have argued that “diversification is a damn poor surrogate for knowledge,
control and price consciousness” (“How the Third Avenue Fund Melted Down” The Wall Street Journal,
December 23, 2015).
4sensitivity of flows to under-performance is mitigated. Overall, in equilibrium, adverse
industry shocks may have more serious consequences in a scenario with swing pricing, as
the most vulnerable funds end up holding riskier and more illiquid assets.
This paper contributes to three strands of literature. First, our paper fits into the large
literature on the financial stability and systemic risk of financial institutions. While this
literature has been traditionally concerned with depositor runs on banks (e.g., Diamond
and Dybvig (1983)), recent work provides evidence of destabilizing e↵ects of runs on non-
bank institutions, such as, for instance, money market funds (e.g., Kacperczyk and Schnabl
(2013) and Lawrence, Timmermann, and Wermers (2016)). More broadly, a large literature
documents the implications of mutual fund fragility for asset prices (see, e.g., Coval and
Sta↵ord (2007), Greenwood and Thesmar (2011), Christo↵ersen, Keim, and Musto (2018)).
Closely related to our paper, Morris, Shim, and Shin (2017) show that funds hoard cash
in response to redemptions, which amplifies fire sales, whereas Chernenko and Sunderam
(2020) find that fund cash bu↵ers are not enough to fully internalize the cost of outflows.
In this regard, we provide evidence for a mechanism that reduces fragility, which emerges
from managers acting in their self interest given the incentive structure set by the investors.
Second, our research adds to a large literature on mutual fund tournaments. In par-
ticular, Ippolito (1992), Chevalier and Ellison (1997), and Sirri and Tufano (1998), among
others, provide evidence of convexity in the sensitivity of flows-to-performance for equity
funds. Convex flows-to-performance creates an incentive for laggard funds to engage in
tournaments, as it provides an option-like pay-o↵ from gambling. Brown, Harlow, and
Starks (1996), Chevalier and Ellison (1997), and Kempf and Ruenzi (2008) provide em-
pirical evidence for tournament behaviors in the equity fund industry by showing that
under-performing funds take more risk than out-performing funds. Schwarz (2011) argues
that the results supporting the tournament hypothesis may arise mechanically, as an e↵ect
of considering changes in the standard deviation of fund returns instead of changes in hold-
ings. However, the author confirms the presence of tournament behaviors after correcting
for this sorting bias. We contribute to this literature by exploring tournament dynamics
5for bond mutual funds. Specifically, we focus on portfolio-level measures of risk-taking that
are immune to the concerns raised by Schwarz (2011). We find that bond mutual funds
risk-taking behavior is the exact opposite of that of equity mutual funds, as laggard funds
de-risk their portfolio rather than increase risk-taking.
Finally, our results contribute to the growing literature on bond mutual funds. Bond
mutual funds are relevant from a financial stability perspective. For example, Manconi,
Massa, and Yasuda (2012) show that fixed income investors contributed to propagate the
e↵ects of the 2008 Financial Crisis. Ellul, Jotikasthira, and Lundblad (2011) find that
regulation-induced bond sales create asset price dislocations, and Shek, Shim, and Shin
(2015) show that discretionary selling by emerging market bond mutual funds reinforces the
e↵ect of fire sales. Furthermore, Becker and Ivashina (2015), Barbu, Fricke, and Moench
(2016), Hau and Lai (2016), Di Maggio and Kacperczyk (2017), and Choi and Kronlund
(2018) show in di↵erent settings that the low-rate environment leads asset managers to reach
for yields. Closely related to our paper, Jiang, Li, and Wang (2017) document the existence
of a pecking order for liquidating assets in response to investor redemptions. While the
authors investigate asset manager decisions after the fund is hit by investor redemptions,
our focus is on what happens before. We make sure in several ways that our results are
not driven by outflows-induced sales. Although not the main focus of their paper, Choi
and Kronlund (2018) explore the e↵ect of fund performance on reaching for yields at the
end-of-the-year mark. They find weak evidence of increased reaching for yields. Our focus
is di↵erent, as we examine the strategic response to relative under-performance to mitigate
the risk of runs. To the best of our knowledge, we are the first to document a strong demand
for liquid assets by under-performing bond funds.
II. Hypotheses development
The presence of complementarities among investors gives rise to a multiplier e↵ect that
amplifies the impact of under-performance on flows and generates the risk of sell-fulfilling
6runs. Chen, Goldstein, and Jiang (2010) and Goldstein, Jiang, and Ng (2017) investigate
these mechanisms in a static setting, in which investors decide to run on the basis of fund
performance and perceived liquidation costs.
We conjecture that when fund managers decide on their asset allocation they incorporate
expectations regarding the future behavior of their investor base. This leads to a situation
akin to a dynamic game in which both investors and money managers attempt to predict
each others actions. Notably, runs on the fund are costly for fund managers because large
outflows negatively impact reputation, career opportunities and, in the worst-case scenario,
may lead to contract termination and job loss. If under-performing fund managers are ratio-
nal, they should act promptly to di↵use the risk of large-scale redemptions. We hypothesize
three scenarios:
• H0: No risk manipulation for competitive reasons. There is mounting evidence that
asset managers reach for yields in a low interest rate environment (Becker and Ivashina
(2015), Barbu, Fricke, and Moench (2016), Hau and Lai (2016), Di Maggio and
Kacperczyk (2017), and Choi and Kronlund (2018)). Under this view, managers
compensate for the subdued yield environment by moving further out in the credit
and maturity spectrum. H0 states that the incentive to hunt for yields created by the
low rate environment overshadows any e↵ects stemming from competitive considera-
tions. This implies that, once we control for common determinants of risk-taking at
the macro level, the relative position of a fund manager against its peers plays no role
in determining the risk she takes on.
• H1: Shrouding risk. As under-performance triggers large-scale redemptions, laggard
funds may choose to artificially inflate their returns by increasing risk-taking. If
investors cannot fully distinguish alpha from beta, fund managers can “fool” investors
and move up in the rankings by tilting their portfolios toward riskier assets. For
instance, fund managers could replace safer assets with assets that fall within the same
rating bucket but o↵er higher yields — a behavior documented for insurance companies
7(Becker and Ivashina (2015)). Shrouding risk may prove successful in the case under
analysis for two reasons. First, corporate bonds are notoriously hard to price. The
relative opaqueness of the asset class, in turn, makes it harder for investors to monitor
manager’s behavior. Second, there is no consensus on how bond fund investors should
measure risk. In particular, existing evidence suggests that investors are unlikely to
employ sophisticated models (Dang, Hollstein, and Prokopczuk (2019)). All in all,
managers of funds that are ex ante more exposed to fragility concerns may engage in
deceptive behaviors that increase the risk of the debt portfolio but might attenuate
investor concerns about performance and, in turn, dissuade them from leaving the
fund.
• H2: Debt de-risking. Alternatively, laggard funds could de-risk their portfolio when
they foresee a run, shifting asset allocation towards liquid securities that would su↵er
lower liquidation costs in the case of forced sales. Divesting illiquid securities and
replacing them with liquid securities before the run occurs has two advantages. First,
if the run does happen, the fund manager is able to redeem exiting investors by sell-
ing liquid assets for which there is no fire-sale discount. By doing that, the manager
minimizes both the negative externalities to the remaining investors and the resulting
under-performance of the fund. Second, portfolio de-risking has the added benefit of
mitigating the first-mover advantage among exiting investors, in turn alleviating the
incentive of investors to run in the first place. In fact, by selling illiquid assets before
the run occurs, the fund manager dilutes all investors equally, thereby avoiding strate-
gic complementarities of the type described by Chen, Goldstein, and Jiang (2010) and
Zeng (2017). From a financial stability perspective, this scenario might be preferred
(as long as the de-risking trades are not crowded). In fact, the most fragile funds
would mitigate the risk of resorting to fire sales without the need for regulatory inter-
vention. This, in turn, reduces the chances that a fund-specific shock propagates to
funds holding similar assets through the fire-sale channel (see, e.g., Coval and Sta↵ord
(2007) and Anton and Polk (2014)).
8III. Data and research design
A Data sources
To conduct our analysis, we need data on mutual fund performance, fund portfolio allo-
cations, and asset risk. We obtain data for our analysis from a variety of sources. For
corporate bond fund portfolio allocations, we rely on Thomson Reuters Lipper eMAXX.
The eMAXX database provides granular information on bond holdings for U.S.-domiciled
mutual funds. It also contains detailed information on the characteristics of individual
bonds, such as credit ratings and maturity dates. eMAXX retrieves this information from
compulsory disclosure to the regulator. Our sample spans from January 2004 to December
2017. To assess the quality of the data, we compare eMAXX with the Federal Reserve
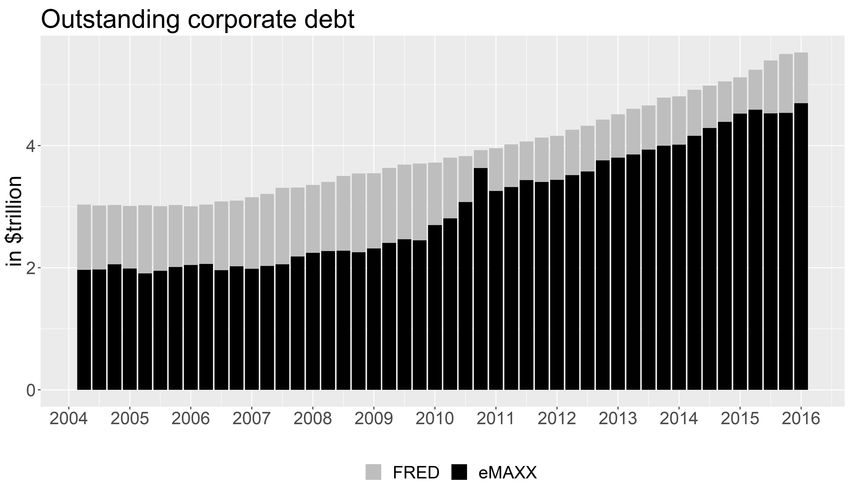
Economic Data (FRED). The aggregated volume of corporate bonds covered by eMAXX is
fairly close to the total amount of outstanding U.S. corporate debt as reported by the FED
(see Figure 2). The di↵erence between the eMAXX and the FED data stems from the fact
that eMAXX does not include the holdings of most banks, hedge funds, proprietary trad-
ing firms, and retail investors. This percentage of bonds not covered by eMAXX has been
decreasing over time, as banks have been shrinking their corporate bond inventory as they
reduced market making activities. We compare a number of randomly selected snapshots of
portfolio holdings with regulatory filings to confirm the quality of the data.5 The eMAXX
database is free from survivorship bias (as all funds are included, defunct and alive) and
reporting bias (as all mutual funds’ bond holdings are included).6
We match fund portfolios in Reuters eMAXX with fund information from CRSP mutual
funds by fund name. The sample is restricted to funds that hold only or mostly corporate
bonds.7 We impose a number of additional filters. First, for a fund to be included, we require
5
Notably, we use information on portfolio holdings from eMAXX rather than from CRSP, as reported
portfolio holdings in the latter appear unreliable (see Figure A.1 in the Online Appendix).
6
A number of papers in the literature are based on the same database (e.g., Manconi, Massa, and Yasuda
(2012); Massa, Yasuda, and Zhang (2013); and Becker and Ivashina (2015)).
7
To be considered a corporate bond fund, the CRSP “lipper obj cd” variable must be in the set “A”,
9at least two years of history, a minimum of 50% of assets invested in corporate bonds, and
a number of bonds that exceeds the 5th percentile of the sample distribution(42 bonds) to
avoid noisy measurement of portfolio risk. Second, we exclude all exchange traded funds
(ETFs), exchanged traded notes (ETNs), and index funds. Notably, funds o↵er several share
classes to investors. As all share classes o↵ered by the same fund are based on the same
underlying portfolio, we aggregate information and performance from di↵erent share classes
at the fund level.8 We use CRSP to obtain information on the assets under management,
inception date, fund fees, fund clientele, performance, and rear loads (as, di↵erent from
the information on portfolio holdings, these variables appear consistent across databases).
Overall, we have data on 702 unique U.S.-domiciled corporate bond funds in the 2004–2017
period for a total of 2,106 di↵erent share classes.
We exploit regulatory filings collected by eMAXX and transaction-level data from TRACE
to construct our measures of riskiness and liquidity of fund portfolio holdings. More specif-
ically, we use the eMAXX data to obtain ratings, issue, and maturity date. We use market-
level information from TRACE to gather information on yields, market prices, and volumes.
The exact procedure to build each liquidity measure is described in detail in the Online Ap-
pendix.9
“BBB”, “HY”,“SII”, “SID”, “IID” or the si obj cd variable must be in the set “CGN”, “CHQ”, “CHY”, “CIM”
, “CMQ”, “CPR”, “CSM,” or the wbger obj cd must be in the set “CBD”, “CHY”.
8
Specifically, we compute value-weighted averages for all variables of interest, where the weights are
given by the total net assets of each share class at the beginning of the period (to avoid contemporaneous
e↵ects).
9
Notably, as TRACE and Mergent FISD cover corporate bonds only, our measures of risk that focus on
yields and bond liquidity are based on corporate bond holdings only. This is a limitation of our approach
that is common to other papers as well (see, e.g., Jiang, Li, and Wang (2017)). Conversely, measures of risk
based on ratings and maturity consider all bonds (government securities included), as we rely on eMAXX.
10B Fund flows and performance
Following the related literature (see, e.g., Coval and Sta↵ord (2007)), we compute net fund
flow (i.e., inflows minus outflows) from CRSP as:
T N Ai,t (1 + Rt,i ) · T N Ai,t 1
F lowi,t = , (1)
T N Ai,t 1
where F lowi,t is the net flow to fund share class i during month t. We aggregate monthly
flow data from fund share classes to quarterly data at the fund level, as portfolio holdings
from eMAXX are reported at a quarterly frequency. As it is standard in the literature, we
winsorized this variable at the 1% and 99% level. We confirm in subsection C of the Online
Appendix that the flow-performance sensitivity is concave for the bond funds in our sample
in line with Goldstein, Jiang, and Ng (2017).
To measure mutual fund performance, we compute the average risk-adjusted monthly
fund return (alphas) in a 24-month window. We define a fund as Laggard F und when
its two-year monthly average risk-adjusted return at the beginning of a quarter-period is
below the quarter median.10 Following Goldstein, Jiang, and Ng (2017), we estimate fund
alphas by regressing monthly fund share class excess returns on the excess returns on the
Vanguard Total Bond Index Fund and the value-weighted equity market portfolio. We then
aggregate share classes’ alphas at the fund level by computing the value-weighted average
risk-adjusted return, weighted by the assets under management at the beginning of the
month for each share class. The reasons why we use these benchmarks are mainly two:
first, we want to be consistent with the empirical approach adopted in Goldstein, Jiang,
and Ng (2017); second, recent research shows that common risk factors drive both stock and
bond returns (e.g., Koijen, Lustig, and Van Nieuwerburgh (2017)). Naturally, any method
to account for risk is exposed to critiques, as we do not know the “true” model used by
investors. In support of our approach, related research shows that investor flows are mostly
10
In the Online Appendix, we consider alternative cut-o↵s.
11driven by past fund performance adjusted by the market benchmark, and investors rarely
use more sophisticated models to account for risk (see Barber, Huang, and Odean (2016)
and Berk and Van Binsbergen (2016) for equity funds, and Dang, Hollstein, and Prokopczuk
(2019) for bond funds). Furthermore, in contrast to equity funds, the choice of the model
to account for risk has relatively minor e↵ects on the relative performance ranking of bond
mutual funds (Blake, Elton, and Gruber (1993)). Our results are robust to a number of
alternative specifications, length of the performance windows considered, and benchmarks
(see the Online Appendix).
C Measuring corporate bond fund risk-taking
Most of the literature on fund tournaments explores how relative performance, achieved
in the first half of the year, relates to risk-taking, measured as the standard deviation of
fund returns in the second half of the year (see, e.g., Brown, Harlow, and Starks (1996) and
Chevalier and Ellison (1997)). This approach, however, leads to a sorting bias: As returns
and risk are related, sorting funds on returns in the first half of the year has mechanical
implications for the volatility of returns in the second half of the year (Schwarz (2011)).11
Following Schwarz (2011), we build our main measures of risk-taking based on the actual
change of portfolio holdings by mutual funds rather than on the volatility of realized returns.
To gauge how managers manipulate portfolio riskiness, we compute the di↵erence be-
tween: a) the average riskiness of the portfolio at time t 1 and b) the average riskiness
of the portfolio at time t, had the riskiness of the underlying bonds not changed from the
previous quarter. Note that as risk for both quantities is measured at time t 1, variations
in the final measure arise entirely from variations in the weight given to di↵erent bonds. In
this way, we make sure that our measure does not vary due to changes in the riskiness of
the assets that are outside of the fund manager’s control (e.g., if a bond is downgraded by
11
This problem is arguably going to be magnified in our setting, as under-performing bond funds face
large future redemptions. Redemptions, in turn, may force the fund manager to sell illiquid assets at a
discount, thereby increasing realized return volatility regardless of her portfolio allocation.
12some notches). Formally,
Ni,t Ni,t
X X1
Riski,t = wi,j,t ⇥ Riskinessj,t 1 wi,j,t 1 ⇥ Riskinessj,t 1 , (2)
j=1 j=1
| {z } | {z }
Current allocation of past risk P ast portf olio risk
where Riski,t measures the active rebalancing of the portfolio of fund i during quarter t to
increase or decrease risk. Riskinessj,t 1 is a proxy of the riskiness of bond j in quarter t 1
computed using i) bond ratings, ii) bond yields, iii) bond maturity, or iv) bond liquidity.
P Q
wi,j,t = P j,t0 i,j,t is the relative weight of bond j in fund i’s portfolio at the end of quarter
j P j,t Q
0 i,j,t
t, out of the Ni,t bonds held by the fund. Pj,t0 Qi,j,t represents the par amount in units of
$1,000. Notably, an advantage of our data is that eMAXX reports the notional amounts
rather than the market value of assets held by the funds. Therefore, we do not need to
adjust for changes in relative weights resulting from price fluctuations rather than from
manager’s decisions.
Importantly, this measure is flow-neutral: it is not a↵ected by inflows or outflows as long
as the fund manager makes investment decisions that maintain the proportion allocated to
each risky security unaltered. To give an illustrative example, if the assets under manage-
ment by the fund increase by 10% because of a positive inflow shock, and the fund manager
expands every existing position by 10% (or, analogously, buys new securities with the same
risk profile) Riski,t would not change.
To define Riskinessj,t 1 , we resort to several measures. Rating is the highest credit
rating among those assigned by Standard and Poor’s, Moody’s, and Fitch (similar to Hand,
Holthausen, and Leftwich (1992)); Yield is the average bond yield; and Maturity is the
average remaining bond maturity in months. Furthermore, we consider four measures of
portfolio liquidity: the inter-quartile range (IQR), the Amihud (2002)’s and Roll (1984)’s
liquidity measures, and the Bid–Ask spread. Additionally, we present results using the first
principal component of these four liquidity measures (see the Online Appendix).
Summing up, our measure of risk-taking presents four key advantages with respect to
13alternative measures used in the literature. First, it is not a↵ected by sorting bias of the type
described in Schwarz (2011). Second, it is not a↵ected by changes in the market value of the
bonds or by the marking-to-market of securities by the fund. Third, it is immune to shifts
in riskiness that are outside of the fund manager’s control. Fourth, it is not mechanically
a↵ected by flows into and out of the fund. Overall, our measure is similar in spirit to
previous measures of active rebalancing for portfolios of stocks (see, e.g., Huang, Sialm, and
Zhang (2011), Curcuru, Thomas, Warnock, and Wongswan (2011), and Greenwood and
Thesmar (2011)).
D Summary statistics
Table I, Panel A reports descriptive statistics for our bond fund data set. Over the period
under analysis, the average active corporate bond fund manages $1.72 billion in assets,
has a track record of 16 years, and o↵ers more than 3 share classes. Funds in our sample
invest mostly in corporate debt and government securities, with the average fund investing
66% and 24% of the AUM in corporate and government bonds, respectively. Bond funds
have received an average 1% net inflow per quarter over our sample period. Fund alphas are
slightly positive, the median fund earns an average 0.04% a month in the previous 24-month
window, which is in line with recent results reported in Clare, O’Sullivan, Sherman, and
Zhu (2019).12 Notably, the average change in risk-taking of bond funds from one quarter
to the next is small. For example, on average, funds actively decrease their portfolio yields
by 0.02% percentage points. The average change in risk-taking measured by bond ratings
is -0.02, i.e., for a hypothetical portfolio of 1,000 bonds with the same nominal value all
rated BB, 20 bonds are replaced with bonds rated BBB.13 To ease the interpretation of our
findings, we standardize all risk-taking measures based on liquidity to an average of 0 and
a standard deviation of 1.
12
Studies on earlier periods find instead a negative average alpha for the bond fund industry, e.g., Blake,
Elton, and Gruber (1993)
13
Recall that Rating = 1 would suggest that the entire portfolio is replaced with bonds which are one
notch lower rated (e.g. from BBB to BB).
14We report the summary statistics for corporate bonds in Panel B. The average bond
held by the mutual funds in our sample has a residual maturity of 8 years, and a rating
of 10 (i.e., BBB). Furthermore, corporate bonds have on average a yield of 5.72%, pay a
coupon rate of 6.29%, and have a nominal outstanding amount of almost $1 billion. Overall,
our sample statistics are in line with the related literature (see, e.g., Jiang, Li, and Wang
(2017)).
IV. Empirical results
A Reverse tournaments: risk shrouding vs. debt de-risking
Main results. Even in the presence of fixed compensation of fund managers, the concavity of
the flow-performance relation gives rise to an asymmetric incentive structure. Bond funds’
pay-o↵ resembles that of selling a put option where the underlying asset is fund performance
and the reward is additional net flows: A higher performance in the gain domain leads to
mild increases in inflows. By contrast, a lower performance in the loss domain gives rise
to large-scale redemptions. To meet such outflows, managers may need to liquidate bonds
at fire sale prices, thereby bringing down further fund performance and leading to more
outflows. This, in turn, may set in motion an adverse feedback loop whereby outflows
and under-performance reinforce one another. The incentive of fund mangers to avoid this
downside risk is even magnified when their compensation is tied to performance (which is
the most common case in practice, see Ma, Tang, and Gómez (2019)).
In this section, we explore whether this put-like feature of bond fund pay-o↵ gives rise
to strategic allocation decisions depending on how the fund ranks against competitors.
Specifically, we contrast three hypotheses as laid out in Section II. First, the ranking of the
fund is irrelevant for risk-taking (H0: No risk manipulation). Second, laggard funds have
an incentive to tilt portfolio allocation towards high-yield securities while hiding risk (H1:
Shrouding risk ). Third, laggard funds flee to havens, actively de-risking their debt portfolios
15(H2: Debt de-risking). To disentangle between these hypotheses, we run the specification
below:
0
Riski,t = 0 + 1 · Laggard F undi,t 1 + Xi,t 1 + t + i + ✏i,t , (3)
where Riski,t is the active change in risk-taking of fund i in quarter t with respect to
quarter t 1 as defined in Section III. We measure risk based on the actual portfolio com-
position in terms of, respectively, i) bond yields, ii) ratings, iii) liquidity, and iv) maturity.
Laggard F undi,t 1 is a dummy variable that takes a value of 1 if the fund’s 24 months
average risk-adjusted performance is below the median of the distribution in quarter t 1.14
We include in our specifications a number of co-determinants of risk-taking and per-
formance, Xi,t 1 . We consider the same variables as in Goldstein, Jiang, and Ng (2017)
with the exception of time invariant controls, which are redundant in our specifications as
we include fund fixed e↵ects i. Fixed e↵ects are important in our setting. Year-quarter
fixed e↵ects, t, account for common factors to which all funds are exposed in a given pe-
riod (e.g., state of the economy, interest rates level, yield curves). Fund fixed e↵ects absorb
fund invariant unobservables that may influence risk-taking (e.g., investment mandate, fund
manager compensation contract features, the presence of rear loads). We present results
obtained excluding fund fixed e↵ects in the Online Appendix.
We are especially interested in assessing how fund managers manipulate risk-taking when
their fund starts to under-perform. The coefficient 1 captures how risk-taking responds to a
change in its relative performance over and above its average risk-taking. A coefficient 1 =
0 would indicate that bond funds do not respond to competitive incentives on average, in
line with H0. A positive coefficient 1 > 0 would signal that laggard funds increase portfolio
14
Notably, we do not focus on the end-of-calendar-year or second semester adjustments such as in Brown,
Harlow, and Starks (1996). Back in 1996, most of the performance assessment was done on an annual basis.
Yet, today, funds provide frequent updates on the performance achieved, the main portfolio holdings, and
the AUM. If fund investors make their allocation decisions at any time based on past performance, there is
no reason why fund managers should adapt their portfolio risk on a calendar year basis. Consistent with
this argument, in unreported results we find that there is no strong adjustment in risk-taking in the last
semester of the year.
16risk, consistent with H1. Notably, a 1 > 0 for all measures of risk would indicate that bond
funds act analogously to equity funds: under-performing funds take relatively more risk.
By contrast, a coefficient 1 > 0 for risk-taking measures based on yields and a 1 = 0 for
measures based on ratings would indicate that laggard funds are shrouding risk, holding
“perceived” risk constant while increasing underlying expected portfolio returns. Finally, a
negative coefficient 1 < 0 would indicate that laggard funds de-risk their portfolio, in line
with H2.
Table II reports our main finding: competitive forces lead laggard funds to actively de-
risk their portfolios. Column 1 shows that portfolio managers tilt their portfolios towards
lower-yielding assets, consistent with H2. This is achieved by increasing the average quality
of the assets held as measured by their ratings (see Column 2), and by tilting portfolio
holdings to more liquid securities (see Columns 3 to 6). By contrast, the average e↵ect on
maturity is not significantly di↵erent from zero (Column 7). This set of results suggest that
the documented flight-to-quality is driven by the attempt to reduce liquidation concerns—as
both liquid and high-rated securities are less a↵ected by liquidity shocks (Chen, Lesmond,
and Wei (2007)). By contrast, an attempt to reduce interest rate risk would arguably also
trigger a shift towards lower maturities as well. The magnitude of the de-risking is large,
laggard funds decrease the average portfolio yield by 5.7 basis points, which corresponds
to 9.5% of one standard deviation in our sample (statistically significant at the 1% level)
or to slightly more than twice the average change in risk levels. This finding shows that
the incentive structure is di↵erent from the equity money management industry, where the
worst-performing managers gamble to improve their rankings. Overall, the incentive to
mitigate ex ante the cost of potential investor runs dominates over the incentive to improve
fund performance. This sets the stage for a “reverse tournament” in which losing funds are
willing to trade higher yields for reduced liquidation costs, thereby mitigating the first-mover
advantage.
De-risking or liquidation pecking order? Notably, in our setting under-performance by
the fund at time t 1 may give rise to forced asset liquidations to meet investor redemptions
17at time t. These liquidations, in turn, could influence the risk composition of the underlying
fund portfolio. In other words, the active change in asset allocation due to competitive
pressure is confounded with the asset liquidation decisions. For example, a safer portfolio
at time t may result by either a flight-to-quality to avoid large liquidation costs or by the fact
that the fund manager sells the riskiest assets first to meet investor redemptions. Notably,
as explained in Section III, our risk-taking measures are by construction neutral with respect
to flows. If a fund manager liquidates assets proportionally to her holdings, this will not
a↵ect our measures. By contrast, if fund managers follow a pecking order in which they sell
their liquid assets first, that would work against our finding, thereby suggesting that we are
under-estimating the extent of de-risking. The problematic scenario for our setting is the
one in which fund managers sell illiquid assets first. Jiang, Li, and Wang (2017) investigate
empirically the selling behavior of corporate bond funds hit by redemptions. They find that
fund managers liquidate asset proportionally in bad times and sell liquid assets first in good
times. This suggests that the scenario that would be problematic for our results is unlikely.
Nonetheless, we reinforce our analysis in two ways. First, we control parametrically for fund
flows in all our regressions by including separately inflow and outflow controls. Second, we
address this issue non-parametrically by retaining in our sample only funds that experience
positive net flows and, therefore, by construction are not forced to sell assets for liquidity
reasons (see Table A.3 in the Online Appendix). All the main results remain qualitatively
similar. Overall, we conclude that, in the bond space, under-performing funds actively
de-risk their portfolios.
Shape of the risk-taking—performance sensitivity. In Figure 3, we illustrate the relation
between risk-taking and fund alpha. We do so by fitting a quadratic function. This figure
reveals the relation between risk and performance to be inversely U-shaped: risk levels are
una↵ected by past returns as long as they meet or just exceed market benchmarks. However,
large deviations from benchmarks (both positive and negative) lead to meaningful reductions
in risk-taking, which are significantly larger in the loss domain. Interestingly, the relation
between performance and risk-taking for out-performers is similar to that documented for
18equity funds: star funds have a limited benefit from further increasing returns and, therefore,
decrease risk-taking to consolidate their position.
Absolute vs. relative performance. In practice, due to the inclusion of time fixed ef-
fects, our analysis compares how funds manipulate performance in response to their rel-
ative performance against that of other funds. In Table A.6 of the Online Appendix, we
examine whether the documented de-risking is mostly driven by relative or absolute under-
performance. This analysis is useful to understand whether competitive considerations are
important or fund managers decide risk levels “in isolation,” based only on their returns and
regardless of how peer funds perform. To do that, we exclude time fixed e↵ects and compare
the e↵ects of fund alpha and relative fund alpha (i.e., fund alpha minus the average fund
alpha in the quarter). Both variables are standardized to make coefficients comparable. We
find that both variables are economically and statistically significant, thereby suggesting
that both competitive considerations and absolute under-performance lead laggard funds
to de-risk. In the Online Appendix, we present a large number of robustness tests.15
Transaction-level evidence. We further zoom in on our previous results and conduct
an analysis of fund de-risking at the transaction level. Specifically, we investigate the
asset selling and buying behavior of laggard funds conditional on asset liquidity and yields.
This analysis is useful to gather further insight into how laggard funds achieve a lower
exposure to risk. In principle, a shift towards a more liquid portfolio may be achieved in
a number of ways. Fund managers could i) purchase liquid assets, ii) sell illiquid assets,
or iii) do both. Alternatively, fund managers could simply expand cash reserves or stop
reinvestments in illiquid bonds that are close to maturity.16 Our main focus is on liquidity,
15
In Table A.2, we include additional control variables to our baseline specification. In Table A.4 we
exclude fund fixed e↵ects (maintaining time fixed e↵ects) and in Table A.5 we include fund-style ⇥ time
fixed e↵ects. In Table A.3, we limit the sample to funds which currently experience inflows, to rule out
possible concerns that our results are driven by sales in response to outflows. In Table A.8, we report our
results obtained changing benchmarks to compute risk-adjusted returns, considering a di↵erent length of
the performance window, using raw unadjusted fund returns, and cumulating risk-adjusted returns (rather
than using averages). In all cases, results remain qualitatively similar.
16
Evidence from non-financial firms indicates that corporations respond to concerns about mounting
competition by expanding their cash holdings (Hoberg, Phillips, and Prabhala (2014)) or lengthening debt
maturity (Parise (2018)).
19as the most direct strategy to mitigate the cost of redemptions-induced fire-sales is to tilt
fund portfolio towards liquid assets (regardless of their maturity and rating). However, we
also provide results for the e↵ect on yields to capture the trade-o↵ between liquidity and
returns. To assess fund manager’s allocation decisions, we run the following specification
at the transaction level:
Changei,j,t = 0 + 1 Laggard F undi,t 1 · Liquid Bondj,t 1
0
+ Xi,t + ⇤0 ⇧j,t + i + t + j + "i,j,t , (4)
where we define the dependent variable Changei,j,t in three alternative ways. First, as a
dummy variable that takes a value of 1 if asset j is bought by fund i in quarter t and value
of 0 if the asset is either sold or the position is kept unchanged (Boughti,j,t ). Second, as a
dummy variable that takes a value of 1 if asset j is sold by fund i in quarter t and value of 0
if the asset is either sold or the position is kept unchanged (Soldi,j,t ). In the third column,
we consider the relative change in holdings, measured as the net change in one position
divided by the overall trading activity by the fund. Xi,t and ⇧j,t are, respectively fund and
bond time-varying controls, and i, t, and j are fund, time, and bond fixed e↵ects.
Table III reports our results. Panel A confirms that laggard funds actively shift portfolio
allocation towards liquid securities. Notably, this is achieved especially by purchasing liquid
assets. Column 1 shows that the probability that laggard funds are 1.3 percentage points
more likely to buy liquid securities (as 0.013 = 0.008 + 0.005). Column 2 indicates that
laggard funds are likely to sell securities (regardless of their liquidity). As a result, Column
3 indicates that the relative weight of liquid securities in their portfolio increases. Panel
B shows the flip side in terms of yields. Laggard funds are more likely to sell higher-
yielding securities and to buy lower-yielding ones, thereby reducing the average portfolio
yield. This evidence is consistent with our main results on debt de-risking presented in the
previous section. This result is particularly interesting as we do not find an economically
meaningful e↵ect of fund under-performance on cash holdings. All in all, laggard funds
20decrease portfolio risk by both purchasing liquid assets and divesting risky assets.
B Heterogeneous risk-taking: the role of fund characteristics and
macroeconomic conditions
Guided by previous research, we conjecture that fund characteristics and market states
a↵ect the behavior of under-performing fund managers. Goldstein, Jiang, and Ng (2017)
document that fund characteristics and market liquidity influence the shape of the flow-to-
performance relation. Furthermore, Choi and Kronlund (2018) find that the low-interest
rate environment induces bond fund managers to reach for yields. A natural implication
of our previous results is that a more concave sensitivity of flows to performance should
generate a stronger incentive for laggard funds to flee to havens. Likewise, market states
that give rise to reach-for-yield behavior should attenuate the incentive to de-risk. We test
these conjectures below.
Table IV, Panel A reports the e↵ect of fund characteristics on risk-taking. We find
that debt de-risking is stronger when most of a fund’s share classes are o↵ered to retail
investors (Columns 1 and 2), for younger funds (Columns 3 and 4), and for funds that lack
a precautionary liquid bu↵er (Columns 5 and 6). The former finding is consistent with the
argument that strategic complementarities matter more for funds oriented towards retail
investors, because small investors face greater coordination problems and are less likely to
internalize the negative externalities of runs (Goldstein, Jiang, and Ng (2017)). Likewise,
both a younger fund age and the lack of a precautionary liquid bu↵er translate into a more
concave flows-to-performance relation (Goldstein, Jiang, and Ng (2017)). This, in turn,
creates a stronger incentive to de-risk fund portfolios in response to poor performance.
Table IV, Panel B investigates the impact of macroeconomic conditions. Columns 1 and
2 indicate that market states that foster a search for yields mitigate the extent of de-risking.
Columns 3 and 4 show that funds are more likely to de-risk in response to under-performance
in turbulent times when liquidity dries up (as measured by the TED spread). This is in line
21with previous evidence that indicates that flow-to-performance relations are more concave
when the overall market is illiquid (Goldstein, Jiang, and Ng (2017)).
C Averting investor runs
Does the decision of the fund manager to de-risk feed back into investor outflows? From
a theoretical perspective, after observing the realized under-performance, fund investors
should run if the cost of the negative externalities generated by the outflow-induced sales
exceeds the costs of exiting the fund. Exit costs include back-end and rear loads, as well as
search costs to find a new investment opportunity.
A critical question to understand whether corporate bond funds pose a threat to finan-
cial stability is indeed whether they can to some extent prevent fund runs by de-risking their
portfolio. If fund managers are able to decrease the expected cost of outflow-induced sales,
investors may be better o↵ choosing not to run. Importantly, the strategic complementar-
ities among investors that trigger runs on the fund are exacerbated by bond illiquidity. If
the fund manager could cover investor redemptions by selling liquid assets that experience
no fire-sale discount, incumbent investors’ shares in the fund would not be diluted. This, in
turn, would eliminate the incentive to run on the fund in the first place. Notably, investors
can infer whether portfolio holdings are safer by either observing a less volatile realized
returns or thanks to public portfolio disclosure.17 While it seems implausible that investors
are able to assess the liquidity of the assets held by the fund manager, a significant shift
towards high-rated securities may credibly signal that the fund portfolio is more liquid.
In Table V, we explore whether laggard managers may mitigate redemptions pressure
by tilting portfolio holdings towards more liquid assets. We find that a shift towards more
liquid securities reduces the magnitude of future outflows. Specifically, laggard funds face
future outflows of 0.4 percentage points on average. However, when fund managers decrease
risk-taking by one standard deviation, net outflows are halved (0.004-0.003+0.001=0.002
17
Mutual funds are obligated to disclose their holdings at a quarterly frequency. However, in practice,
most mutual funds disclose online their top positions and their weights every month.
22vs 0.004), see Columns (1)-(3). When we measure liquidity using the inter-quartile range
(see Column 4), we find an even larger e↵ect: a decrease of risk-taking by one standard
deviation reduces outflows by 75%.
Overall, this finding suggests that the corporate bond money management industry has
a natural tendency to reduce risk exposures: the riskier funds, on average, shift portfolio
allocation towards liquid securities, thereby minimizing the threat of runs. This behavior
likely reduces ex ante the risk of fire sales and liquidation spirals that can cause market
dislocations. Yet, more research is needed to comprehensively evaluate the asset pricing
implications.
V. Policy implications
Concerns about the risks to financial stability posed by corporate bond mutual funds have
recently been voiced prominently. Regulators and academics alike have expressed fears
that the liquidity mismatch of bond funds may induce bank-run-like scenarios with severe
repercussions on the bond market.18 The main regulatory measure to ease these concerns
has been the introduction, in October 2016, of flexible end-of-day net asset value (NAV),
commonly referred to as swing pricing. The empirical evidence on the e↵ectiveness of
swing pricing to mitigate the first-mover advantage has been mixed thus far. Lewrick and
Schanz (2017) compare U.S. funds pre-October 2016 (not allowed to adjust prices) with
Luxembourg funds (allowed to adjust prices) and find that swing pricing dampens outflows
in reaction to weak fund performance, but has a limited e↵ect during stress episodes. By
contrast, Jin, Kacperczyk, Kahraman, and Suntheim (2019) show that swing prices allow
U.K. corporate bond funds to successfully reduce redemptions during stress periods. From
a theoretical standpoint, swing pricing is an imperfect solution to the first-mover advantage.
Zeng (2017) shows that, even with flexible NAVs, outflows induce predictable voluntary sales
18
In a similar spirit, in October 2016, the U.S. money market fund reform became e↵ective, which had a
primary goal of reducing the risk of runs on prime money market funds.
23of illiquid assets post redemptions to rebuild cash bu↵ers. This behavior, which is optimal
for the fund, generates a predictable decline in fund NAV and reinstates the first-mover
advantage.
In this section, we explore how swing pricing a↵ects debt de-risking. In the previous
section, we have shown that, even in the absence of regulation, it is in the best interest
of laggard fund managers to de-risk when redemption risk looms. This strategic behavior
reduces the need for investors to run and may contribute to explain why, anecdotally, runs
outside periods of intense market stress have been infrequent. Notably, this is a market-
led corrective mechanism that disciplines the manager. Under-performing managers who
increase risk in an attempt of gambling for resurrection face a magnified redemption risk.
This, in turn, eliminates the moral hazard problem. In the following, we provide evidence
for the e↵ect of the introduction of swing prices on the incentive of laggard fund to de-risk.
As a flexible NAV reduces withdrawals in case of under-performance, its introduction may
re-introduce moral hazard dynamics and weaken the incentive to de-risk.
In Table VI, we consider a di↵erence-in-di↵erence setting in which we compare the e↵ect
of under-performance on risk-taking before and after the introduction of the swing pricing
regime. We consider laggard funds as treated by the introduction of swing pricing, whereas
we use out-performing funds as control group (as these funds are unlikely to su↵er large
redemptions that require to “swing” prices). We estimate the following specification:
Riski,t = 0 + 1 Laggard F undi,t 1 ⇥ Swing P ricing Regimet
0
+ 2 Laggard F undi,t 1 + Xi,t 1 + t + i + ✏i,t , (5)
where Swing P ricing Regimet is a dummy variable that takes a value of 1 from the last
quarter of 2016 onwards (swing pricing was introduced in the U.S. in October 2016). The
coefficient 1 measures how the incentive to de-risk for laggard funds changes with the
introduction of the swing pricing regime. We run this analysis both on the full sample
(Panel A) and on a symmetric sub-sample that includes the same number of time periods
24You can also read