A regional-scale ecological risk framework for environmental flow evaluations - HESS
←
→
Page content transcription
If your browser does not render page correctly, please read the page content below
Hydrol. Earth Syst. Sci., 22, 957–975, 2018
https://doi.org/10.5194/hess-22-957-2018
© Author(s) 2018. This work is distributed under
the Creative Commons Attribution 3.0 License.

A regional-scale ecological risk framework for environmental
flow evaluations
Gordon C. O’Brien1 , Chris Dickens2 , Eleanor Hines3 , Victor Wepener4 , Retha Stassen1 , Leo Quayle5 , Kelly Fouchy6 ,
James MacKenzie1 , P. Mark Graham7 , and Wayne G. Landis3
1 University  of KwaZulu-Natal, College of Agriculture, Engineering and Science, School of Life Sciences,
Private Bag X01, Scottsville, South Africa
2 International Water Management Institute, Private Bag X813, Silverton, 0127, South Africa
3 Western Washington University, Institute of Environmental Toxicology, Bellingham, Washington, USA
4 Water Research Group (Ecology), Unit for Environmental Sciences and Management, North-West University,

Private Bag x6001, Potchefstroom, 2520, South Africa
5 Institute of Natural Resources NPC, P.O. Box 100 396, Scottsville, 3209, South Africa
6 IHE Delft Institute for Water Education, P.O. Box 3015, 2601 DA Delft, the Netherlands
7 University of KwaZulu-Natal, College of Agriculture, Engineering and Science, School of Hydrology,

Centre for Water Resources Research, Private Bag X01, Scottsville, South Africa

Correspondence: Gordon C. O’Brien (obrieng@ukzn.ac.za)

Received: 23 January 2017 – Discussion started: 13 February 2017
Revised: 20 November 2017 – Accepted: 7 December 2017 – Published: 2 February 2018

Abstract. Environmental flow (E-flow) frameworks advo-            decision making, with trade-off considerations in the context
cate holistic, regional-scale, probabilistic E-flow assessments   of social and ecological aspirations. This paper presents the
that consider flow and non-flow drivers of change in a socio-     PROBFLO approach as applied to the Senqu River catch-
ecological context as best practice. Regional-scale ecological    ment in Lesotho and further developments and application
risk assessments of multiple stressors to social and ecological   in the Mara River catchment in Kenya and Tanzania. The
endpoints, which address ecosystem dynamism, have been            10 BN-RRM procedural steps incorporated in PROBFLO
undertaken internationally at different spatial scales using      are demonstrated with examples from both case studies.
the relative-risk model since the mid-1990s. With the recent      PROBFLO can contribute to the adaptive management of wa-
incorporation of Bayesian belief networks into the relative-      ter resources and contribute to the allocation of resources for
risk model, a robust regional-scale ecological risk assess-       sustainable use of resources and address protection require-
ment approach is available that can contribute to achieving       ments.
the best practice recommendations of E-flow frameworks.
PROBFLO is a holistic E-flow assessment method that incor-
porates the relative-risk model and Bayesian belief networks
(BN-RRM) into a transparent probabilistic modelling tool          1   Introduction
that addresses uncertainty explicitly. PROBFLO has been de-
veloped to evaluate the socio-ecological consequences of his-     The global use of water resources has altered the wellbeing of
torical, current and future water resource use scenarios and      aquatic ecosystems and the benefits that people derive from
generate E-flow requirements on regional spatial scales. The      them (Acreman and Dunbar, 2004; Dudgeon et al., 2006;
approach has been implemented in two regional-scale case          Growns, 2008; Vörösmarty, 2010; Isaak et al., 2012; Murray
studies in Africa where its flexibility and functionality has     et al., 2012; Grafton et al., 2013; Dudgeon, 2014). Environ-
been demonstrated. In both case studies the evidence-based        mental flows (E-flows), according to the Brisbane Declara-
outcomes facilitated informed environmental management            tion (2007), are defined as the “quantity, timing and quality
                                                                  of water flows required to sustain freshwater and estuarine

Published by Copernicus Publications on behalf of the European Geosciences Union.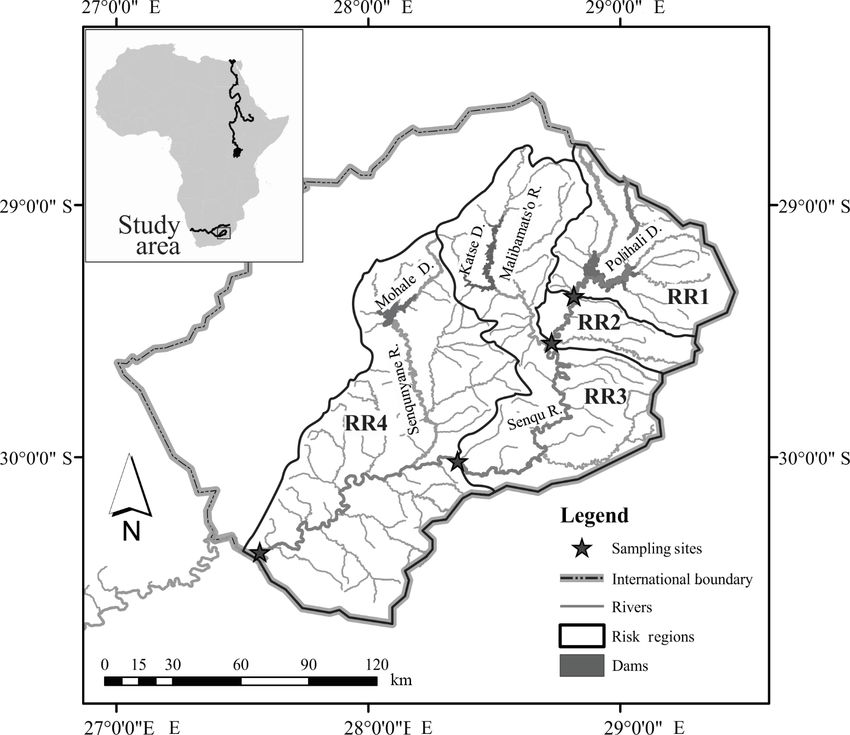
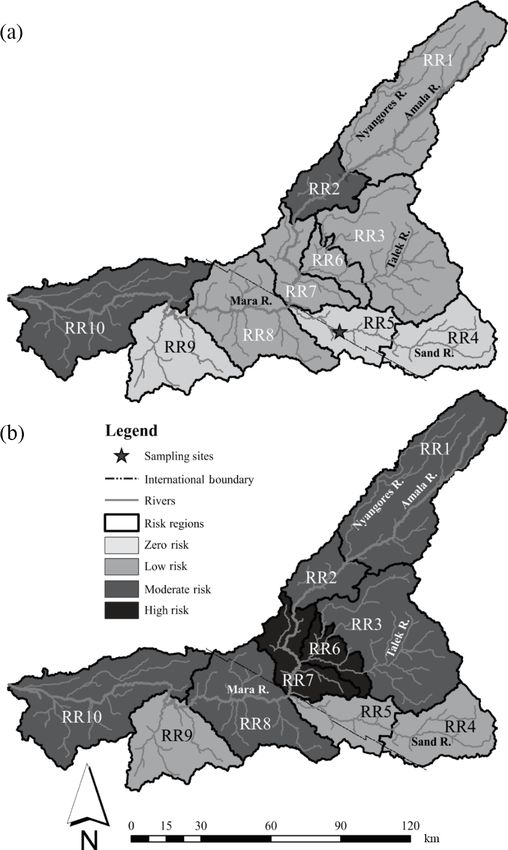
958                                                                     G. C. O’Brien et al.: Environmental flow evaluations

ecosystems and the human livelihoods and wellbeing that             corporate expert solicitations and explicitly address uncer-
depend on these ecosystems”. In an effort to determine E-           tainty. PROBFLO is a scenario-based E-flow assessment tool
flows, the international community has developed a plethora         that allows for the evaluation of the socio-ecological conse-
of E-flow assessment methods, which have been applied on            quences of altered flows with consideration of the synergistic
numerous spatial scales in a wide range of ecosystem types          effects of non-flow drivers of ecosystem impairment. It ad-
across the globe (Tharme, 2003; Acreman and Dunbar, 2004;           heres to the regional-scale ecological risk assessment expo-
Pahl-Wostl et al., 2013; Poff and Matthews, 2013). These            sure and effects, or sources of multiple stressors, habitats and
methods have evolved during three distinct periods accord-          ranked ecological impacts relationship (Wiegers et al., 1998).
ing to Poff and Matthews (2013) including an emergence and          This paper presents the PROBFLO BN-RRM approach that
synthesis period, consolidation and expansion period and the        was used to establish E-flows for the Senqu River in Lesotho,
current globalization period. During this globalization period      and it evaluates the socio-ecological effects of altered flow
a range of best practice E-flow management and assessment           and non-flow stressors and developments made in the Mara
principles, and associated frameworks to undertake E-flow           River in the Kenya and Tanzania case study.
on multiple spatial scales in multiple political and/or legisla-
tive contexts, have been developed (Poff et al., 2010; Pahl-
Wostl et al., 2013). These principles promote the use of holis-     2   Study area
tic assessment tools that consider both social and ecological
features of ecosystems on regional spatial scales, are adap-        The Lesotho Highlands Water Project (LHWP) is a USD
tive and incorporate risk evaluation and address uncertainty        multi-billion water transfer and hydropower project imple-
(Poff et al., 2010; Acreman et al., 2014).                          mented by the governments of Lesotho and South Africa
   Ecological risk assessments have been undertaken inter-          (LHWP, 1986, 2011). Phase I of the LHWP involved the
nationally at different spatial scales using the relative-risk      application of the Downstream Response to Imposed Flow
model (RRM) established since the mid-1990s (Hunsaker et            Transformations (DRIFT) approach to establish the E-flows
al., 1990; Landis and Weigers, 1997, 2007; Wiegers et al.,          associated with the construction of the Katse and Mohale
1998; Landis, 2004, 2016). The RRM has been applied to              dams on the Malibamats’o and Senqunyane rivers in Lesotho
evaluate a range of natural and anthropogenic stressors in-         respectively (Arthington et al., 2003; King et al., 2003).
cluding water pollution, diseases, alien species and a range        Phase II involves the augmentation of the LHWP by con-
of altered environmental states (Walker et al., 2001; Moraes        struction of the Polihali Dam to divert water directly from
et al., 2002; Hayes and Landis, 2004; Colnar and Landis,            the upper Senqu River to the existing Phase I infrastruc-
2007; Anderson and Landis, 2012; Ayre and Landis, 2012;             ture of the LHWP (Fig. 1). For Phase II, the custodians
Bartolo et al., 2012; O’Brien et al., 2012; Hines and Landis,       of the project, the Lesotho Highlands Development Author-
2014; Ayre et al., 2014). This tool can be used to carry out        ity (LHDA), required the service provider awarded with the
holistic, probabilistic assessments of the risk to the availabil-   E-flow determination project to review and implement cur-
ity and conditions of ecosystem service and ecological end-         rent best E-flow practice. This included the requirements
points, and facilitate socio-ecological trade-offs. For more        to implement a probabilistic, regional-scale modelling ap-
information on the application of the RRM consider Colnar           proach that is transparent and holistic, addressing socio-
and Landis (2007), Anderson and Landis (2012) or O’Brien            ecological components and endpoints, and one that consid-
and Wepener (2012). Recent developments to the RRM in-              ers uncertainty explicitly. The PROBFLO approach has, as a
corporate the use of Bayesian networks (BNs) that have been         result, been selected for Senqu River in Lesotho as a part of
established as a powerful tool for ecological risk assessment,      Phase II of LHWP between the proposed Polihali Dam site
ecosystem management and E-flow assessment (Pollino et              (29.289593◦ S; 28.863890◦ E) and the border of South Africa
al., 2007; Hart and Pollino, 2008; Shenton et al., 2011; Chan       (30.413231◦ S; 27.564090◦ E) (LHWP, 2016).
et al., 2012; Pang and Sun, 2014; Liu et al., 2016; McDon-             The entire Mara River in Kenya and Tanzania upstream of
ald et al., 2016). In 2012, Ayre and Landis combined both           the mouth into Lake Victoria (1.518178◦ S; 33.943497◦ E)
approaches and incorporated BNs into RRMs, which was                was considered in this regional-scale PROBFLO case study
then formalized into a BN-RRM approach (Hines and Lan-              (NBI, 2016) (Fig. 2). The Mara River and its tributaries are
dis, 2014; Herring et al., 2015; Landis et al., 2016).              an essential source of water for domestic needs, agriculture,
   Between 2013 and 2016 a BN-RRM-based holistic E-flow             pastoralism and wildlife, including tourism, in Kenya and
assessment approach was developed that adheres to the prin-         Tanzania (Mati et al., 2008; Defersha and Melesse, 2012).
ciples of best E-flow management practice and can easily            Although extensive research has been undertaken into the
be incorporated into regional E-flow frameworks such as             management of the terrestrial ecosystems of the Serengeti
the Ecological Limits of Hydrologic Alteration framework            National Park and Maasai Mara National Reserve, there are
(Poff et al., 2010). This BN-RRM approach, which we have            limited studies on the effects of land use threats to the wellbe-
called PROBFLO, is a transparent and adaptable, evidence-           ing of the Mara River, with only site-specific evaluations of
based probabilistic modelling approach that can also in-            the environmental flows of the river (Broten and Said, 1995;

Hydrol. Earth Syst. Sci., 22, 957–975, 2018                                        www.hydrol-earth-syst-sci.net/22/957/2018/
G. C. O’Brien et al.: Environmental flow evaluations                                                                                 959

Figure 1. The upper Senqu River study area with risk regions (RRs) established for the study including dams associated with Phase I of the
Lesotho Highlands Water Project and the location of the new Polihali Dam planned to be built in Phase II.

Figure 2. The Mara River basin considered in the study with risk regions (RRs) and sampling sites.

www.hydrol-earth-syst-sci.net/22/957/2018/                                              Hydrol. Earth Syst. Sci., 22, 957–975, 2018
960                                                               G. C. O’Brien et al.: Environmental flow evaluations

                                                            management (Fig. 3). The PROBFLO approach has been im-
                                                            plemented in the Senqu and Mara River case studies to eval-
                                                            uate the socio-ecological consequences of altered flows and
                                                            determine E-flows, which is demonstrated through applica-
                                                            tion of the following 10 procedural steps.

                                                            3.1   Step 1: Vision exercise

                                                            The importance of having clear water resource management
                                                            objectives cannot be overemphasized. Numerous Integrated
                                                            Water Resource Management strategies, regional manage-
                                                            ment plans and frameworks, national legislation and estab-
                                                            lished E-flow assessment tools advocate the establishment of
                                                            clear goals or visions to direct the use and protection of wa-
                                                            ter resources (Biswas, 2004; Mitchell, 2005; Dudgeon et al.,
                                                            2006; Richter et al., 2006; Poff et al., 2010; King and Pienaar,
                                                            2011; NBI, 2016). Although many vision development ap-
                                                            proaches are available, the initial application of PROBFLO
                                                            involved the application of the Resource Quality Objectives
                                                            (RQOs) determination procedure (DWA, 2011) to describe
                                                            and document the water quality, water quantity, habitat and
                                                            biota objectives for the water resource being evaluated (NBI,
                                                            2016; DWA, 2011). The RQO process results in narrative
                                                            and numerical descriptions of various ecosystem features re-
                                                            quired to achieve a balance between the use and protection
                                                            of water resources and hence to achieve a documented vision.
                                                            As part of the initial development of the RRM approach, mul-
                                                            tiple social and ecological endpoints were evaluated in a rela-
                                                            tive manner. Social endpoints were limited to the availability
                                                            and quality of ecosystem services and ecological endpoints,
                                                            including the requirements to maintain selected ecological
                                                            indicators in an acceptable integrity state or wellbeing. In ad-
                                                            dition, for these environmental flow assessment (EFA) case
                                                            studies, endpoints associated with socio-ecological impacts
                                                            of the rivers resulting directly or indirectly with altered flows
                                                            were considered. Findings resulted in relative risks to end-
                                                            points that could be compared and used to consider cost-
                                                            benefit trade-offs between social and ecological endpoints by
Figure 3. The 10 procedural steps of PROBFLO.               adjusting water resource use and protection scenarios.
                                                               The treaties for Phase I and Phase II of the LHWP entered
                                                            into by the Kingdom of Lesotho and the Republic of South
Gereta et al., 2002; Onjala, 2002; Karanja, 2003; Lamprey   Africa provided the requirements for the establishment of a
and Reid, 2004; Hoffman, 2007; Mati et al., 2008; Atisa,    vision for water resource use and protection for the Senqu
2009; GLOWS-FIU, 2012; Majule, 2010; Hoffman et al.,        River case study (LHWP, 1986, 2011). The Treaty gives em-
2011; Ogutu et al., 2011; Defersha and Melesse, 2012; Ki-   phasis to protection of the existing quality of the environ-
ambi et al., 2012; Dessu et al., 2014).                     ment and, in particular, requires maintenance of the well-
                                                            being of persons and communities immediately affected by
                                                            the project, including those downstream of the dam. Accord-
3   PROBFLO framework for E-flows                           ingly, the vision states that there should be no change to the
                                                            existing quality of the downstream environment and that the
The PROBFLO framework is based on 10 procedural RRM         net effect of the dam should not be negative to the people
steps (Landis, 2004), and it incorporates BN development    living downstream of the dam. For the PROBFLO assess-
and evaluation procedures (Marcot et al., 2006; Ayre and    ment, RQOs describing the desired quality and quantity of
Landis, 2012) into a robust E-flow assessment method that   water, habitat and biota for the study area were established.
gives emphasis to adaptive management for holistic E-flow   The endpoints selected to represent the social and ecological

Hydrol. Earth Syst. Sci., 22, 957–975, 2018                                www.hydrol-earth-syst-sci.net/22/957/2018/
G. C. O’Brien et al.: Environmental flow evaluations 961
management objectives for the PROBFLO assessment were and spatially referenced. In addition, source-stressor expo-
based on the vision represented by the RQOs in this case sure and habitat/receptor to endpoint pathways/relationships
study, including the maintenance of the following ecosys- should be spatially referenced where possible (O’Brien and
tem services and ecological objectives affected by the river: Wepener, 2012; Landis et al., 2016). Available data describ-
(1) the supply of building sand from the Senqu River, (2) wa- ing the ecosystem need to be reviewed and spatially refer-
ter for domestic use, (3) recreation/spiritual use of the river, enced and the uncertainties associated with the availability
(4) fish stocks as food for people, (5) edible plants from the and quality of data used in the assessment must be docu-
riparian zone as food for people, (6) medicinal plants for peo- mented for evaluation in Step 7. O’Brien and Wepener (2012)
ple, (7) floodplain non-woody plants (for grazing), (8) woody provide an approach to delineate ecosystem types, the topo-
plants for fuel and construction, (9) reeds for construction logical features of importance, the catchment and ecoregion
and (10) fish stocks, (11) aquatic macro-invertebrate and boundaries, the land or water resource use scenarios and the
(12) riparian ecosystem integrity or wellbeing. pathways of stressors’ exposure. This approach is used to di-
The vision for the Mara River case study was based on ex- rect the selection of risk regions for assessment (Smit et al.,
isting regional Mara River management objectives (WRMA, 2016). Best practice E-flow frameworks accentuate the im-
2014). In 2014, a Catchment Management Strategy (CMS) portance of ecosystem type classification as part of E-flow as-
for the Mara Basin in Kenya was developed to facilitate the sessments to improve our understanding of flow–ecosystem
management of the water resources, environment and human relationships (Poff et al., 2010; Arthington, 2012).
behaviour in ways that achieve equitable, efficient and sus-
tainable use of water for the benefit of all users (WRMA, 3.3 Step 3: Risk region selection
2014). The aims of the Mara River basin as part of the Strate-
gic Environmental Assessment (EAC, 2003) to maintain “the In this step, combinations of the management objectives,
people living in harmony with nature while achieving human source information and habitat data are used to establish geo-
wellbeing and sustainable economic development in perpe- graphical risk regions that can be assessed in a relative man-
tuity” were also considered. Also considered were the objec- ner (Landis, 2004; O’Brien and Wepener, 2012). In the end,
tives for the Mara River basin as described by the Biodiver- the outcomes of the assessment will be available at the spa-
sity, and Strategy Action Plan, which describes “a region rich tial scale established during this step for multiple temporal
in biodiversity which benefits the present and future genera- scenarios associated with alternative management options.
tions and ecosystem functions” (GLOWS-FIU, 2012). The In this regard it is important to consider the spatial connec-
Kenyan Water Resources Management Authority (WRMA) tivity of multiple variables including flows and other vari-
established a high ecological importance, high livelihoods ables within the study area so that risk regions incorporate
value and low commercial value vision for the upper Mara appropriate sources, stressors, habitats and endpoints (Lan-
River basin (Nyangores and Amala rivers) and a high eco- dis, 2004; O’Brien and Wepener, 2012). The approach can
logical importance, moderate livelihoods value and moder- address spatial and temporal relationships of variables be-
ate commercial value vision for the mainstream Mara River. tween risk regions, such as the downstream effect of a source
In this context the endpoints selected for the study included on multiple risk regions, in the context of the assimilative ca-
(1) the provision of water for basic human needs according to pacity of the ecosystem or the upstream connectivity require-
the national legislation of Kenya and Tanzania, (2) the main- ments of a migratory fish between risk regions. To demon-
tenance of the ecological integrity of the riverine ecosystem strate that PROBFLO can conform to the regional E-flow as-
(instream and riparian ecosystems), (3) the provision of flows sessment frameworks such as ELOHA (Poff et al., 2010), the
for the commercial production of crops, (4) the maintenance selection of RRs should include explicit hydrological and ge-
of existing livestock industry, (5) the maintenance and viabil- omorphological classification. The relative risk outcomes of
ity of the ecotourism industry and (6) the maintenance of the the assessment can later be directly related to the system clas-
ecological integrity of the Mara Wetland in the lower reaches sification as proposed by ELOHA. With additional E-flow
of the basin. information for a range of hydrological and geomorpholog-
ical ecosystem types, the outcomes can be used to establish
3.2 Step 2: Mapping and data analyses regional E-flows.
The selection of risk regions for the Senqu River E-flow
The BN-RRM approach that forms the basis of PROBFLO assessment was based on the proposed location of the Poli-
includes the relative evaluation of multiple sources of stres- hali Dam and catchment boundaries of the Senqu River and
sors to endpoints on a regional scale, which should be large tributaries (Malibamatso and Senqunyane rivers) for
spatially and temporally referenced for regional compar- this E-flow assessment. Physical access to sampling sites
isons/evaluations in a PROBFLO assessment (Landis, 2004; within Lesotho to conduct biophysical field surveys was ex-
Landis and Wiegers, 2007). For this the spatial extent of the tremely difficult and this also contributed to risk region se-
study area must be defined and described, and the locations lection. Four broad risk regions were selected for the Senqu
of potential sources, habitats and impacts must be identified River PROBFLO study (Fig. 1).
www.hydrol-earth-syst-sci.net/22/957/2018/ Hydrol. Earth Syst. Sci., 22, 957–975, 2018962 G. C. O’Brien et al.: Environmental flow evaluations
Figure 4. Example of a holistic conceptual model established in a PROBFLO case study that describes causal risk relationships (arrows)
between sources, stressors, habitats, effects and impacts to endpoints considered in an assessment.
In the Mara River case study, a review of land use and framework to include an initial situation assessment, data re-
land cover (Mati et al., 2008; Atisa et al., 2014), hydrology view and alignment phase and a governance and Resource
(Mango et al., 2011; McClain et al., 2014), the vision for Quality Objectives setting phase. The PROBFLO conceptual
the case study, current and future land and water resource model thus conforms to the regional-scale E-flow framework
use options and socio-ecological importance (Karanja, 2002; procedures in (1) the selection of socio-ecological endpoints,
LVBC and WWF-ESARPO, 2010; Mango et al., 2011; De- to direct the hydrologic foundations for the study includ-
fersha and Melesse, 2012; GLOWS-FIU, 2012; Dessu et al., ing the selection of hydrological statistics required; (2) the
2014; Dutton et al., 2013) was used to select risk regions. classification of ecosystem types based on geomorphic, wa-
Ten risk regions were selected for the Mara River case study ter quality, quantity and ecoregion considerations; and with
which conformed to catchment boundaries, ecoregions, land these data, (3) the incorporation of evidence-based flow–
use practices and the international boundary (Fig. 2). ecosystem relationships and flow–ecosystem service rela-
tionships, with relevant non-flow variable relationships upon
3.4 Step 4: Conceptual model which the assessment is based. Initial conceptual model de-
velopment considers all relevant sources, stressors, habitat,
In this step conceptual models that describe hypothesized re- effects and impact relationships with spatial and temporal
lationships between multiple sources, stressors, habitats and considerations.
impacts to endpoints selected for the study are generated
(Wiegers et al., 1998) (Fig. 4). This includes the holistic 3.5 Step 5: Ranking scheme
(consider flow- and non-flow-related variables in a spatial–
temporal context), best practice characterization of flow– Ranking schemes are used to represent the state of vari-
ecosystem and flow–ecosystem service relationships in the ables, with unique measures and units to be comparable as
context of a regional-scale E-flows framework (Poff et al., non-dimensional ranks and combined in BN-RRMs (Landis,
2010), with relevant non-flow (water quality and habitat) re- 2004; Landis et al., 2016). Four states, designated as zero,
lationships in the models. Conceptual models should be con- low, moderate and high as traditionally used in RRMs (Col-
structed by expert stakeholders usually including hydrolo- nar and Landis, 2007; O’Brien and Wepener, 2012; Hines
gists, geomorphologists, ecologists and ecosystem services, and Landis, 2014; Landis et al., 2016), have been incorpo-
including social and resource economics scientists. These ex- rated into the PROBFLO process. The states represent the
perts should be familiar with socio-ecological system pro- range of wellbeing conditions, levels of impacts and man-
cesses and be able to describe probable cause and effect vari- agement ideals as follows.
ables and relationships of sources to stressors to multiple re- – Zero. This describes a pristine state, with no impact/risk,
ceptors in relation to their impacts on the endpoints, selected comparable to the pre-anthropogenic source establish-
for the study. The conceptual models for the case studies pre- ment, baseline or reference state.
sented addressed requirements of the ELOHA and the Nile
Basin regional-scale E-flow frameworks to conform to these – Low. This is a largely natural state with low impact/risk,
frameworks (Poff et al., 2010; NBI, 2016). The Nile Basin and it describes an ideal range for sustainable ecosystem
regional-scale E-flow framework expands on the ELOHA use.
Hydrol. Earth Syst. Sci., 22, 957–975, 2018 www.hydrol-earth-syst-sci.net/22/957/2018/G. C. O’Brien et al.: Environmental flow evaluations 963
Figure 5. Bayesian network models used in the Senqu River case study to evaluate the risk of flow alterations associated with Phase II of
the Lesotho Highlands Water Project to riparian ecosystem integrity and ecosystem service endpoints (a) and instream ecological endpoints
and fisheries supply endpoints (b). White nodes represent input exposure variables, light grey nodes complete the expose leg of the risk
assessment, grey nodes represent effect leg of models and dark grey nodes represent endpoints. Working Netica™ models are provided in the
Supplement.
– Moderate. This state refers to moderate use or a mod- moderate risk states represent partially suitable ecosystem
ified state, with moderate impact/risk, representing the conditions that usually warrant management/mitigation mea-
threshold of potential concern or alert range. sures to avoid high risk conditions. The incorporation of BN
modelling into PROBFLO allows the approach to incorpo-
– High. This describes a significantly altered or impaired rate the variability between ranks for each model variable,
state, with unacceptably high impact/risk. represented as a percentage for each rank. Indicator flow
This ranking scheme selected for PROBFLO represents and non-flow variables representing the socio-ecological sys-
the full range of potential risk to the ecosystem and ecosys- tem being evaluated in a PROBFLO assessment are selected
tem services with management options. Low risk states usu- (linked to endpoints – step 1), and unique measures and units
ally represent management targets with little impact, and of measurement are converted into, and represented by, ranks
www.hydrol-earth-syst-sci.net/22/957/2018/ Hydrol. Earth Syst. Sci., 22, 957–975, 2018964 G. C. O’Brien et al.: Environmental flow evaluations
Figure 6. Bayesian network models used in the Mara River case study to evaluate the risk of water resource use to a range of socio-
ecological endpoints. White nodes represent input exposure variables, light grey nodes complete the expose leg of the risk assessment, grey
nodes represent effect leg of models and dark grey nodes represent endpoints. Working Netica™ models are provided in the Supplement.
for integration in BN assessments. For the BN assessment, networks also make use of available data and expert solici-
ranks are assigned scores along a percentage continuum rep- tations as evidence to represents risks to current or present
resenting the state of the variables using natural breaks of scenarios. Present projections of risk to the endpoints can
0.25 (zero), 0.5 (low), 0.75 (moderate) and 1 (high) in the generally be easily validated using available data, knowledge
calculation. of existing relationships between variables and by carrying
out directed field survey campaigns to describe/test risk re-
3.6 Step 6: Calculate risks lationships. Present risk projections are then calibrated by
evaluating benchmark or historical scenario risk projections
From the general inclusive conceptual models (step 4), with using the established models, which can often be validated
the principle of requisite simplicity (Stirzaker et al., 2010), with historical data (see data in the Supplement). An exam-
smaller social and ecological endpoint specific models that ple of how a BN can represent a component of the socio-
represent the system being assessed are unpacked and con- ecological ecosystem being evaluated is presented in Figs. 5
verted into Bayesian network models (Figs. 5 and 6) for and 6. Within Fig. 5 we for example hypothesize that the
analyses. These models can be analysed individually or inte- ecological integrity of fish in the Senqu can be selected as
grated using a range of BN modelling tools, using nodes rep- an indicator of the Senqu River ecosystem as a suitable eco-
resenting variables that share the same indicators and mea- logical endpoint. In this example the ecological integrity of
sures. Bayesian networks are probabilistic modelling net- fish is hypothesized to be a function of the conditions of the
works that graphically represent joint probability distribu- Senqu River environment for fish, representing the exposure
tions over a set of statistical values (Pollino et al., 2007; leg of the risk assessment and the potential for fish to occur
Korb and Nicholson, 2010). They include parent or input within the reach of the river being considered as an effects
nodes and child or conditional nodes with links that repre- component of the study (refer to Table S1 in the Supple-
sent causal relationships between nodes combined by Condi- ment). The conditions of the Senqu River environment itself
tional Probability Tables (CPTs) (McCann et al., 2006; Lan- are hypothesized in this study to be a function of the poten-
dis et al., 2016). Conditional Probability Tables describe con- tial of communities to be a “disturbance to wildlife”. This
ditional probabilities between the occurrence of states in the describes the instream habitat conditions and migration ac-
parent nodes and the resulting probabilities of states in the cess for fish as source-stressor relationships with local com-
child nodes (Landis et al., 2016). The two PROBFLO case munities, multiple barriers and other source/stressors that af-
studies presented here made use of the Netica™ BN software fect instream habitat wellbeing, selected indicators represent-
by Norsys Software (http://www.norsys.com/). ing ecosystem components with associated measures in the
The BNs are initially used to evaluate the risk of anthro- study. Water resource use scenarios were used to describe
pogenic/natural hazards to endpoints per risk region, in rel- the state of source/stressor and effect nodes as inputs into the
ative manner for comparisons, for multiple temporal periods model. These variables were integrated using CPTs to rep-
(high or low flow months and wet or drought phases etc.) resent other system variables, which ultimately result in risk
which can also be compared relative to each other. Bayesian
Hydrol. Earth Syst. Sci., 22, 957–975, 2018 www.hydrol-earth-syst-sci.net/22/957/2018/G. C. O’Brien et al.: Environmental flow evaluations 965
described to endpoints (refer to Table S2). These models are the Supplement). These BNs were used to evaluate the risk of
then used to determine E-flow requirements according to ac- multiple sources and stressors with flow-related stressors for
ceptable trade-off of risk to endpoints selected for the study, base winter (low), summer (high) and drought flows. Where
and the consequences of alternative water resource use, man- appropriate, CPTs of the BNs for endpoints were adjusted
agement and/or climatic condition scenarios. between RRs to represent the subtle changes in ecosystem
To determine E-flow requirements in PROBFLO, trade- process dynamics down the length of the Senqu River (refer
offs of acceptable risk to social and ecological endpoints to Tables S1 and S2).
are initially established for each risk region by stakeholders. Evidence used includes the historical understanding of
This usually takes place within a legislative context where re- flow–ecosystem and flow–ecosystem service relationships
gional legislation/policies/agreements are addressed, such as established during Phase I of the LHWP and data derived
requirements to maintain ecosystem sustainability, which af- from a series of biophysical surveys of the study area (re-
fects trade-off developments. These trade-offs of acceptable fer to Tables S1 and S2). The surveys included hydrology,
risk are represented in the BNs as forced endpoint risk distri- hydraulic, water quality and geomorphology components
butions or profiles. These profiles usually range between low grouped as ecosystem driver components, and fish, macro-
and moderate risk, with usually no high risk probabilities. In invertebrates and riparian vegetation grouped as ecosystem
relation to the definitions of the ranks used in PROBFLO, responder components. Hydrological data used in the case
trade-offs of acceptable risk for E-flow determination should study included recently updated basin-wide Integrated Wa-
only dominate the “moderate” risk range when there is cer- ter Resources Management Plan outcomes (ORASECOM,
tainty that the E-flow requirements can be provided, such as 2014). This database was updated in the study with latest
in the case of E-flow releases from a dam. In case studies available rainfall records, obtained from the Lesotho Mete-
where there is high uncertainty associated with the ability orological Services, and regional evaporation information.
to provide E-flow requirements, such as the management of Observed monthly flow data with actual discharge mea-
multiple water resource users to cumulatively maintain E- surements determined in the study were used to calibrate
flows, then a buffer should be provided according to the def- the monthly WRSM2000 model against rainfall to obtain
inition of ranks and the “low” risk range should be selected. catchment-specific rainfall-runoff parameters (Pitman et al.,
After the selection of trade-offs of acceptable risk are estab- 2006). A range of hydrological statistics were used in the
lished, the calibrated BNs are forced to generate the state RRM-BN model. Findings were used to identify a range
(rank distributions) of input flow variables used in the assess- of indicators to represent hypothesized causal relationships
ments. These flow-related variable state requirements that are of the socio-ecological system being evaluated and to iden-
spatially and temporally referenced are provided to a hydrol- tify measures for indicators, with units of measurement and
ogist or geomorphologist, for example, to describe the E- node rank thresholds and relationships between variables in
flow requirements which can be presented in various formats, the form of CPTs (refer to Table S2). Netica™ was used to
such as daily or monthly water (usually m3 s−1 ) and sed- carry out the assessment (Ayre et al., 2014, for example). The
iment (usually kg m−3 s−1 ) discharge duration percentiles. tool is versatile and incorporates a range of features used to
During E-flow determination procedures, the state of non- optimize the assessment. This includes equation features to
flow variable nodes, which contribute to the risk to endpoints, weight the relative importance of parent variables and gen-
associated with flow variables can either be maintained in erate initial CPTs that were easily refined and applied to the
their current state, and described as such or amended with daughter nodes for the assessment. The tool includes case
available water resource use information. This can include file generation options, which allow the BNs to be linked to
the increased requirement of water for basic human needs, Microsoft® Excel, where data can be rapidly analysed and
for increases in growths of human populations depending on used to populate BNs for the analyses. Risk outcome distri-
the resource, for example. Following the establishment of E- butions were also linked to Excel, where scenarios and social
flows, the socio-ecological consequences of altered flows, as- and ecological endpoints could be integrated using Monte
sociated with alternative water resource management options Carlo randomization approaches that are part of the Oracle
or climate change variability, for example, can be evaluated Crystal Ball software (Landis, 2004). After establishing BN
in a relative manner by generating and evaluating a range of models for each RR, input parameters were changed using
future scenarios in PROBFLO. RR-specific data for a range of scenarios including the fol-
lowing.
3.6.1 Senqu River risk calculation
– Scenario 1 represents the present-day scenario based on
In the Lesotho case study the nine social endpoints and present state hydrology and associated source to end-
three ecological endpoints were used to represent the socio- point variable state relationships that represent observ-
ecological endpoints of interest in the study. The 12 BN mod- able conditions. This scenario is based on existing data
els established for the study included cause and effect link- and additional data collected during the field surveys.
ages used to estimate risk (refer to BN models provided in
www.hydrol-earth-syst-sci.net/22/957/2018/ Hydrol. Earth Syst. Sci., 22, 957–975, 2018966 G. C. O’Brien et al.: Environmental flow evaluations
– Scenario 2 represents a pre-anthropogenic water re- risk projections to the endpoints used in the assessment. Ini-
source development scenario, considered to represent tial risk to ecological endpoints compared between the natu-
“natural” hydrology, which was modelled using his- ral (SC2) and present (SC1) scenarios demonstrates that the
torical and modelled hydrology and rainfall data, and number of sources and stressors with associated risk to end-
hypothesized state distributions for non-flow variables. points has increased in the study area, particularly in RR2
This scenario was selected to calibrate the PROBFLO to RR4. These changes can largely be attributed to the con-
model for the study. sequences of Phase I of the LHWP (Fig. 7). These findings
include the synergistic effect of non-flow stressors (such as
– Scenario 3 includes the presence of the new proposed water quality and habitat condition) to the wellbeing of the
Polihali Dam with full modelled interbasin transfer Senqu River ecosystem in the study area. Effects of the al-
(IBT) supply. Only large floods overtopping the dam tered hydrology between natural and present-day scenarios
have been considered to be available downstream of the to the social endpoints were less obvious (Fig. 8). Spatial
dam, with the existing E-Flows from the downstream trends in the risk results associated with SC3 to SC8 gener-
lateral tributaries bringing water from Katse and Mohale ally include elevated risk to RR1, directly downstream of the
dams available in RR3 and 4. Non-flow source/stressor proposed dam in particular. These results demonstrate that
catchment conditions were based on the present-day the impact on socio-ecological endpoints considered will be
scenario. highest directly below the dam. Thereafter scenarios that ex-
clude floods and freshets (SC3 and SC5) resulted in exces-
– Scenario 4 is based on scenario 3 but includes E-Flow
sive risk, demonstrating the importance of flood and freshet
releases established as 36 % of the natural mean an-
flows to the socio-ecological endpoints. Outcomes for sce-
nual runoff (MAR) from the Polihali Dam, with suit-
narios 6 to 7 for riparian vegetation and invertebrates include
able freshet and flood flows. The range of percentages
consistent increases in risk spatially from the proposed new
of the MAR considered in these scenarios were selected
dam towards the lower reaches of the study area, which is
by stakeholders to evaluate different levels of water re-
ascribed to accumulative effects of the existing Phase I dams
source use for the development.
on the lateral tributaries. The relative risk to the fish commu-
– Scenario 5 is based on scenario 3, but with only 25 % nity endpoint includes an opposite trend where a reduction in
of the natural MAR available to contribute towards E- risk from RR1 to RR4 was observed for all scenarios. These
flows, with all floods retained in the Polihali Dam for results are indicative of the increased relative resilience of
transfer into the IBT. the resident and seasonal migratory fish communities to flow
alterations in the Senqu River associated with dam develop-
– Scenario 6 is based on scenario 5 with one additional ments, due to the increasing size of the river and associated
40 m3 s−1 freshet (small spring flood) released from the increases in habitat diversity towards the lower reaches of the
dam in addition to the 25 % of the natural MAR to con- study area. In addition, reductions in river connectivity (bar-
tribute towards E-flows. rier formation) associated with existing impacts from Phase
I and the synergistic new stressors associated with Phase II
– Scenario 7 is based on scenario 3 with only 18 % of the of the LHWP were also shown to contribute to the increase
natural MAR available to contribute towards E-flows in risk from the lower reaches of the study area in RR4 for
with one single 40 m3 s−1 freshet (small spring flood). fish migrating upstream to RR1. Interestingly the outcomes
– Scenario 8 is based on scenario 6 but with additional included improvements to the condition of, or reductions in
stress imposed by further reduction of available flows risk to the wellbeing of social endpoints for scenarios 6 to
to 12 % of the natural MAR, released for maintenance 8. This included potential improvements in the availability
but including the single 40 m3 s−1 freshet (small spring of and/or condition of wood for fuel in RR2 and grazing
flood). for livestock for RR1 and RR4 in particular. These projec-
tions allow for trade-off considerations where the wellbeing
In this assessment, risk was calculated for 12 endpoints, of some social endpoints will decrease in some parts of the
for three temporal periods and for eight scenarios, thus rep- study area and increase in others. From our current under-
resenting 312 BN models that were relatively comparable. standing of the socio-ecological system represented in this
The results include the mean relative risk rank scores with study, the results evidence some additional sustainable devel-
associated standard deviation for each endpoint including opment opportunities that may be available for stakeholders
the maintenance of riparian vegetation, macro-invertebrates to consider (Fig. 8). These opportunities may improve the
and fish wellbeing as ecological endpoints and the mainte- viability of the Phase 2 development and contribute to the
nance of wood for fuel, marginal vegetation for livestock establishment of a suitable balance between the use and pro-
grazing and fish for food as social endpoints (Figs. 7 and 8). tection of the ecosystem being evaluated. These relative risk
These initial relative mean risk scores allow for the com- projections to the multiple socio-ecological endpoints con-
parison of alternative spatial and temporal socio-ecological sidered are based on flow alterations associated with devel-
Hydrol. Earth Syst. Sci., 22, 957–975, 2018 www.hydrol-earth-syst-sci.net/22/957/2018/G. C. O’Brien et al.: Environmental flow evaluations 967
(a)
100 RR1 RR2 RR3 RR4
80
Relative risk score
60
40
20
0
SC1 SC2 SC3 SC4 SC5 SC6 SC7 SC8
(b) Scenarios
100 RR1 RR2 RR3 RR4
80
Relative risk score
60
40
20
0
SC1 SC2 SC3 SC4 SC5 SC6 SC7 SC8
(c) Scenarios
100 RR1 RR2 RR3 RR4
80
Relative risk score
60
40
20
0
SC1 SC2 SC3 SC4 SC5 SC6 SC7 SC8
Scenarios
Figure 7. Senqu River case study mean relative risk scores (with SD) considered in the assessment including relative risk to: riparian
vegetation (a), macro-invertebrates (b) and fish (c) wellbeing endpoints for the four risk regions per scenario (SC).
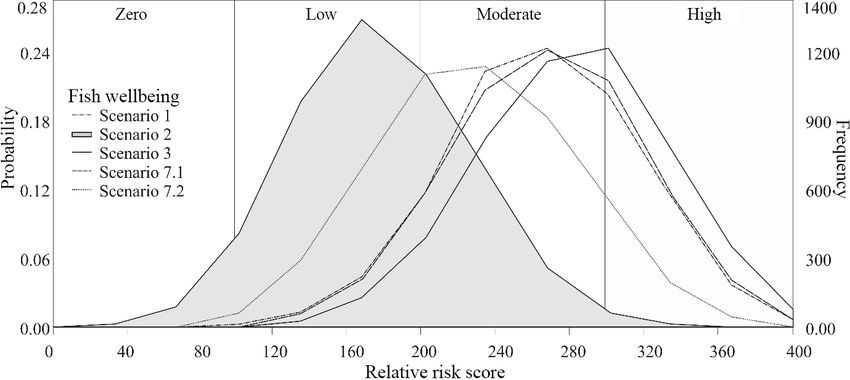
opment scenarios, in the context of the exacerbating of non- probability that risk to the fish endpoint occurred in a zero to
flow variable determinants on regional scales. low risk range, for the present scenario (Scenario 1), Phase II
The cumulative risk of all ecological and social endpoints with the dam and no E-flows scenario (Scenario 3) and Sce-
for each RR, for each temporal period, per scenario, were nario 7 (Phase II with the dam, 18 % release of natural MAR
evaluated using Monte Carlo simulations (5000 trials, Oracle and 40 m3 s−1 freshets) all range between the moderate and
Crystal Ball software, Oregon) (Ayre et al., 2014). The out- high risk range (Fig. 9). The risk outcomes of all future man-
comes included relative risk projections, displayed as relative agement options suggest that objectives of the stakeholders
profiles to single endpoints from multiple RRs, and multi- to maintain the existing wellbeing of the ecosystem could
ple social and ecological endpoints or all endpoints per RR not be achieved because flow scenarios considered would
in the study for comparisons and evaluation. These profiles not satisfactorily mitigate the effects of fish migration bar-
were generated for multiple scenarios to evaluate the poten- riers, which themselves reduce ecosystem wellbeing. To ad-
tial social and ecological consequences of alternative wa- dress this, an additional, amended scenario (Scenario 7) was
ter resource development scenarios. This is demonstrated by then modelled, which included successful mitigation mea-
considering the cumulative risk projections to the fish well- sures for the existing man-made barriers in the Senqu River
being endpoint, which demonstrates that relative to the “natu- as amendments. The outcomes included a reduction in risk
ral” hydrology scenario (Scenario 2), in which there is a 83 % in the low to moderate risk ranges, demonstrating that sce-
www.hydrol-earth-syst-sci.net/22/957/2018/ Hydrol. Earth Syst. Sci., 22, 957–975, 2018968 G. C. O’Brien et al.: Environmental flow evaluations
(a)
100 RR1 RR2 RR3 RR4
80
Relative risk score
60
40
20
0
SC1 SC2 SC3 SC4 SC5 SC6 SC7 SC8
(b) Scenarios
100 RR1 RR2 RR3 RR4
80
Relative risk score
60
40
20
0
SC1 SC2 SC3 SC4 SC5 SC6 SC7 SC8
(c) Scenarios
100 RR1 RR2 RR3 RR4
80
Relative risk score
60
40
20
0
SC1 SC2 SC3 SC4 SC5 SC6 SC7 SC8
Scenarios
Figure 8. Senqu River mean relative risk scores (with SD) for wood for fuel (a), marginal vegetation for livestock grazing (b) and fish for
food (c) social endpoints for the four risk regions per scenario (SC) considered in the study.
1
Figure 9. Probability profiles generated during a PROBFLO assessment, overlaid onto risk rank range (Zero, Low, Moderate and High) to
describe the relative risk of the multiple sources and stressors, including altered flows, associated with alternative management scenarios
considered in the Lesotho case study to the fish wellbeing endpoint.
Hydrol. Earth Syst. Sci., 22, 957–975, 2018 www.hydrol-earth-syst-sci.net/22/957/2018/G. C. O’Brien et al.: Environmental flow evaluations 969
Figure 10. Probability profiles generated during a PROBFLO assessment, overlaid onto risk rank range (Zero, Low, Moderate and High)
to describe the relative risk of the multiple sources and stressors, including altered flows, associated with alternative management scenarios
considered in the Lesotho case study to all of the endpoints integrated in the assessment.
narios that promote moderate to high use of the water re- 3.6.2 Mara River risk calculation
sources, with barrier mitigation measures (such as construc-
tion of fishways) could result in the achievement of the fish
wellbeing endpoints in the study. This approach established In the Mara River case study, the relative risk of stressors
for this case study allows for the relative comparison of the and the E-flows were established according to the four social
integrated social and/or ecological consequences of altered and two ecological endpoints considered in the assessment.
flows in the context of non-flow variables for each scenario The Mara River case study (refer to Table S1) was based on
for each endpoint used to represent the use and protection existing data from historical surveys (Mati et al., 2008; Mc-
management objectives of the study as shown in Fig. 10. Cartney, 2010; Majule, 2010; LVBC and WWF-ESARPO,
In Fig. 10 the integrated risk probability profiles to all end- 2010; Mango et al., 2011; Kanga et al., 2011; Defersha and
points for each RR are shown, which compares Scenario 2 Melesse, 2012; Defersha et al., 2012; GLOWS-FIU, 2012;
(reference scenario) to the high use Scenario 3. These re- Dutton et al., 2013; Atisa et al., 2014; Gichana et al., 2014;
sults include elevated risk probabilities for RR1 (84 % mod- Kilonzo et al., 2014; McClain et al., 2014) and a single site
erate and 15 % high rank range) and RR2 (81 % moderate), visit to refine the CPTs (NBI, 2016). During this survey seven
while existing E-flows from Phase I dams reduce the risk sites were selected to represent the variability of all of the
posed for this scenario in RR3 and RR4. The relative risk RRs in the study area. After establishing BN models for each
results to endpoints and integrated risk profiles were pre- RR (refer to BN models provided in the Supplement), input
sented to stakeholders who used these outcomes to select E- parameters were changed using RR-specific data for two sce-
flows and associated water resource use mitigation measures narios, including the present condition and alternately the E-
(such as barrier mitigation measures) to be implemented for flow requirement to achieve the basic human needs and eco-
Phase II of the LHWP. In this case study E-flows were es- logical wellbeing of the Mara River known as the Ecological
tablished by initially evaluating the individual flow tolerance Reserve (United Republic of Tanzania, 2009; Government of
exceedance thresholds for numerous social and ecological in- Kenya, 2002).
dicators used in the BNs. This information resulted in the de- In this case study relative risk results were used to gen-
velopment of a hydrological scenario matching the shape of erate E-flow requirements that would not pose excessive risk
the natural hydrology that was evaluated in the BNs. There- to the wellbeing of ecological endpoints and social endpoints
after the BNs themselves were used to generate the hydrolog- as described by the RQOs. The assessment hypothesizes that
ical statistic variable conditions required to achieve a suitable sufficient flows currently exist to maintain the endpoints in
risk profile for each social and ecological endpoint that repre- an acceptable condition. In addition, in the context of the pre-
sents the E-flows for the study in the context of the vision for cautionary principle, additional flows can be allocated before
RRs in the study. With this information, a range of alterative risk to the endpoints exceeds acceptable, sustainable thresh-
water resource use scenarios were generated and considered olds. Results further demonstrate that sustainable water al-
to explore risk trade-offs between social and ecological end- locations would reduce risk to selected social endpoints se-
points. lected in the study and meet the desired balance between the
use and protection of the resource (Fig. 11). The approach
highlighted the probable effect of non-flow-related stressors
that are affecting the ecological wellbeing of Mara River, in-
www.hydrol-earth-syst-sci.net/22/957/2018/ Hydrol. Earth Syst. Sci., 22, 957–975, 2018970 G. C. O’Brien et al.: Environmental flow evaluations
3.7 Step 7: Uncertainty evaluation
Best ecological risk assessment practice requires the ex-
plicit evaluation of uncertainty, or confidence assessment,
(O’Brien and Wepener, 2012; Landis, 2004), which has been
incorporated into the PROBFLO approach. Any and all as-
pects of uncertainty associated with the entire BN-RRM pro-
cess, including objectives and endpoint selection for the as-
sessment, availability and use of evidence, expert solicita-
tions and model uncertainty, for example, must be addressed.
In an effort to reduce uncertainty, the BN-RRM approach
adopted by PROBFLO inherently considers uncertainty as-
sociated with cause and effect relationships and the use of
real data with expert solicitations (Uusitalo, 2006; Landis
et al., 2016). The additional incorporation of entropy re-
duction analysis in relative risk calculations using Monte
Carlo simulations also contributes to uncertainty reduction in
PROBFLO. Additional analyses of the sensitivity of the BN-
RRM should be addressed within the uncertainty evaluation
section (Pollino et al., 2007; Hines and Landis, 2014), where
the relative influence of input nodes on the endpoints can be
evaluated as part of the PROBFLO assessment. The results
of the uncertainty assessment are used to provide context to
the stakeholders of a PROBFLO assessment and contribute
to the decision making process in E-flow assessment studies.
For all of the BNs created in the PROBFLO assessments
of the Senqu and Mara River case studies, the sensitivity of
the input variables was evaluated in Netica™ using the “Sen-
sitivity to Findings” tool (Marcot, 2012). This approach al-
lows for the relative contribution of each variable to be evalu-
ated. These assessments are used to evaluate model structure
and interpret risk result outcomes with the stakeholders of
the assessment (Marcot, 2012; Landis et al., 2016). This test
demonstrates to both PROBFLO operators and stakeholders
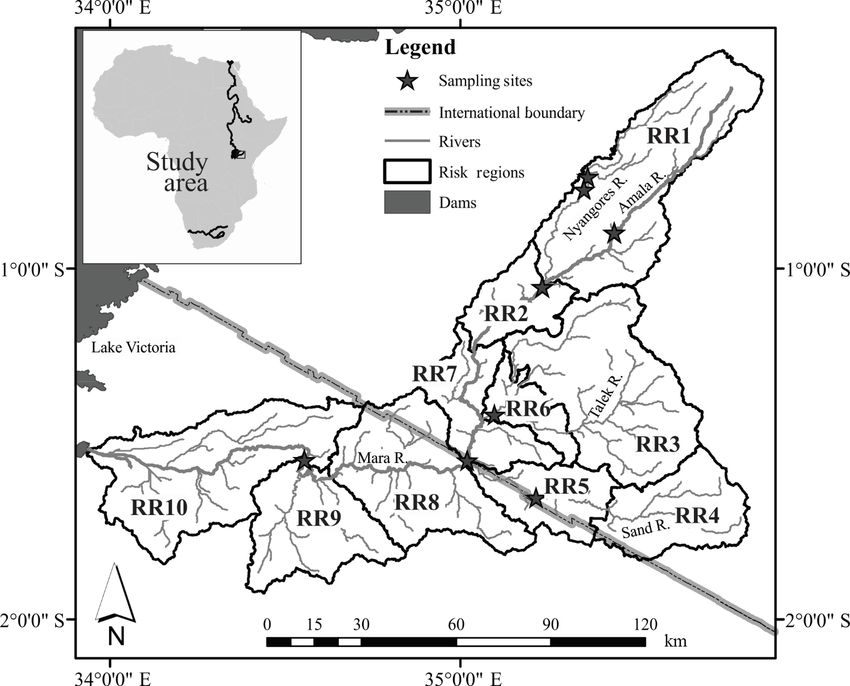
Figure 11. Relative spatial risk of the multiple sources and stressors where models and associated assessments are sensitive to in-
associated with current (a) and planned (b) water resource use to put data. Evidence to justify these sensitive determinants are
risk regions (RRs) selected for the Mara River basin case study. imperative to a robust assessment. Additional sources of un-
certainty include the comparative availability of evidence and
expert knowledge pertaining to the socio-ecological systems
cluding water physiochemical impacts and habitat alteration considered in the assessments. The Senqu River case study
stressors associated with urban and rural communities, live- addressed the second phase of a water resource use develop-
stock grazing and watering and the effect of the recent ex- ment that already has two substantial flow-altering develop-
ponential increase in local Hippopotamus amphibius popu- ments with more than 15 years of pre- and post-development
lations in the tributaries of the Mara River in particular that E-flow assessment (using holistic EFA methods; Arthington
are affecting water quality in the system (Kanga et al., 2011; et al., 2003) monitoring and evaluations. Additional field sur-
Subalusky et al., 2015). These results were used to demon- veys of the study area were carried out to generate additional
strate the relative risk of sources or water resource activi- information and to test existing hypotheses for the assess-
ties that affect flows relative to other sources at the risk of ment. The Mara River case study was based largely on avail-
ecosystem wellbeing (Fig. 11). The approach successfully able historical information and existing EFA results for parts
demonstrated how the BN-RRM approach in PROBFLO can of the study area (McClain and Kashaigili, 2013; Dessu et
be used to generate acceptable risk profiles for endpoints to al., 2014).
evaluate the socio-ecological consequences of altered flows,
and it is also demonstrated how these models can be used to
determine E-flows and associated information for water re-
source use.
Hydrol. Earth Syst. Sci., 22, 957–975, 2018 www.hydrol-earth-syst-sci.net/22/957/2018/G. C. O’Brien et al.: Environmental flow evaluations 971
3.8 Step 8: Hypotheses establishment 3.9 Step 9: Test hypotheses
In the hypotheses establishment step of PROBFLO, suitable The two PROBFLO case studies included the design of
hypotheses for field and laboratory experiments are estab- long-term monitoring programmes to test the accuracy of
lished to test flow–ecosystem and flow–ecosystem service risk projections and improve the understanding of the flow–
relationships (Landis, 2004; O’Brien and Wepener, 2012). In ecosystem and flow–ecosystem service relationships. In the
PROBFLO the fundamental adaptive management approach Senqu River case study a data management system (DMS)
to improving our understanding of socio-ecological risk re- with automated data evaluation components was established.
lationships, while revisiting outcomes and re-evaluating ap- In the Mara River case study a range of hypotheses were
proaches, is formalized in the hypotheses establishment and established and used to design a monitoring plan and asso-
testing phase. This process is based on a similar process in ciated research programme to confirm the flow–ecosystem
the RRM approach, established to reduce uncertainties and and flow–ecosystem service relationships considered in the
to confirm the risk rankings in risk assessments (Landis, study.
2004). In PROBFLO these adaptive management principles
acknowledge that socio-ecological systems are dynamic and 3.10 Step 10: Communicate outcomes
that our limited understanding of these processes necessitates
the incorporation of many assumptions. In many case studies, Regional-scale ecological risk assessments of water re-
uncertainties associated with the outcomes need to be miti- sources are carried out on behalf of stakeholders of the
gated before they can be used to inform decision making. To use and/or protection of those resources. Stakeholders need
reduce uncertainty, assumptions can be tested rigorously and information generated with robust, best scientific practice
early. The adaptive management processes should (1) be in- methodologies in a transparent, clear and concise format,
formed by iterative learning about the flow–ecosystem and to evaluate the socio-ecological consequences of water re-
flow–ecosystem service relationships, (2) consider and re- source use options. The PROBFLO approach highlights the
spond to earlier management successes and failures and importance of communicating the outcomes of assessments
(3) increase present-day socio-ecological system resilience in the context of the uncertainty identified in an assessment
that can improve the ability of E-flows management to re- (Hayes and Landis, 2004). A variety of techniques and tools
spond to the threats of increasing resource use (Lee, 2004). are available to assist in the communication of the E-flow
In the Senqu River case study, many hypotheses associ- outcomes and associated socio-ecological consequences of
ated with the flow–ecosystem and flow–ecosystem service altered flows and careful attention must be paid to ensure
relationships, largely established on data associated with that the relevant stakeholders of any case study are presented
Phase I of the LHWP, were established and tested during with information that can easily be understood (O’Brien and
the field surveys. These hypotheses included the following. Wepener, 2012). In the Senqu River case study, the LHDA
(1) Woody vegetation communities, sustainably harvested with South African and Lesotho governmental delegates par-
by local communities for fuel, respond to reduced average ticipated in a project outcomes workshop in 2014. During
flows by increasing in abundance due to reduced flow vari- this workshop the PROBFLO approach adopted for the study,
ability, reduced stream power and through the colonization results and outcomes were discussed. Risk results of sources
of new lower marginal zones. (2) Migratory cyprinid fish re- and stressors to social and ecological endpoints were com-
spond to ecological cue flows, which include increased dis- pared in a relative manner, facilitating water resource use
charges associated with reduced salinity, and which initiate and protection trade-off considerations for the LHWP Phase
fish migration. (3) Grazing for livestock of local commu- II. In the Mara River case study the PROBFLO assessment
nities depends on freshet flows lifting water onto the river successfully formed a part of the Nile E-flows framework de-
banks and floodplains to stimulate vegetation growth. Data velopment (NBI, 2016) and the ongoing Mau Mara Serengeti
were collected from the study area to address these hypothe- (MaMaSe) Sustainable Water Initiative (http://mamase.org).
ses and improve the understanding of the flow–ecosystem The application of the PROBFLO and associated uncertainty
and flow–ecosystem service relationships considered in the assessment was used to establish a monitoring plan that
study. In the Mara River case study available flow–ecosystem should be implemented with water resource use scenarios se-
and flow–ecosystem service information was used in the lected from the case studies. These plans were designed to
PROBFLO assessment. A range of hypotheses associated validate the model by testing the response of the receiving
with our understanding of the relationships were generated environment to observed ecosystem driver conditions, asso-
to refine and improve E-flow assessments of the study area. ciated with implemented scenarios, and to improve the un-
derstanding of the causal relationships hypothesized in the
original assessment with real data.
www.hydrol-earth-syst-sci.net/22/957/2018/ Hydrol. Earth Syst. Sci., 22, 957–975, 2018You can also read