Flood Risk Management Planning Resources for Washington, DC - January 2018
←
→
Page content transcription
If your browser does not render page correctly, please read the page content below

Flood Risk Management Planning
Resources for Washington, DC

                                 January 20181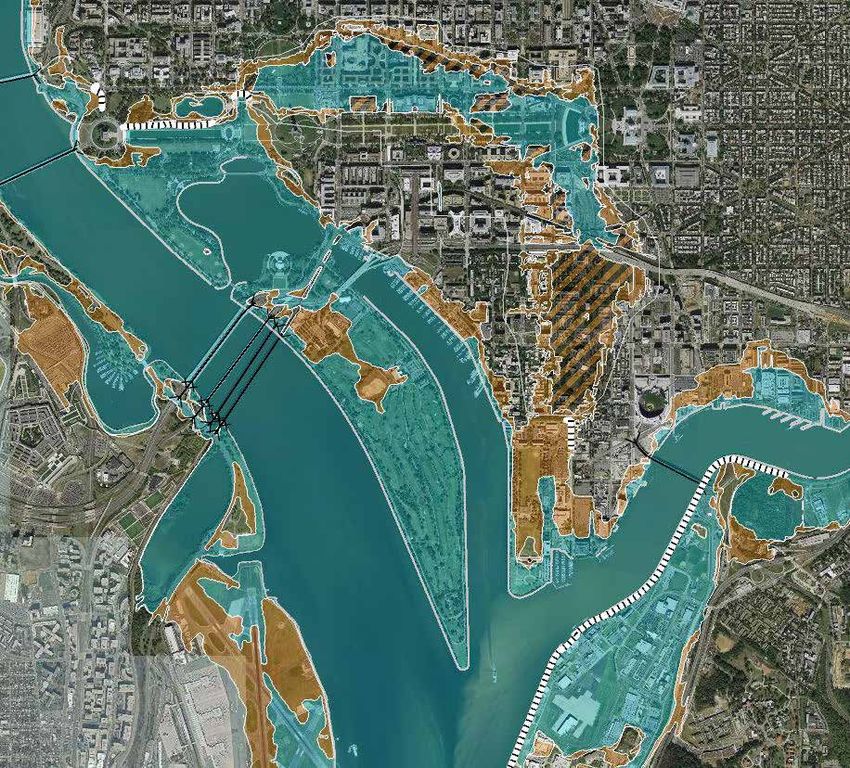
PRINTABLE VERSION AVAILABLE
                                                                                                  This version of the document is best viewed on a screen. Please use the link below for a printable version:
                                                                                                        www.ncpc.gov/docs/Flood_Risk_Management_Planning_Resources_Print_January_2018.pdf

    Flood Risk Management Planning
    Resources for Washington, DC
    January 2018

                                                                                                  Table of Contents
                                                                                                       1. Introduction                                                                     4

                                                                                                       2. Flood Risk Management Resources                                                 10

                                                                                                       3. Mapping Current Flood Risk                                                      28

                                                                                                       4. Riverine Flooding                                                               36

                                                                                                       5. Interior Flooding                                                               40
    NOTICE:
                                                                                                       6. Coastal Flooding                                                                44
    Usage: This is not a regulatory document.
    Updating: This document is current as of January 2018. It may be updated from time to time,        7. Summary                                                                         56
    at which point the dates will be changed.
    Disclaimer: Mention of a commercial company or product does not constitute an endorsement
    by the DC Silver Jackets or the National Capital Planning Commission.                              8. Appendices                                                                      58

                                                                    Cover Photo: The wake from
                                                                    a passing boat crashes over
                                                                    a flooded walkway on East
                                                                    Potomac Park during high
                                                                    tide on September 28, 2013.
                                                                    Credit: John Cochran
2                                                                                                                                                                                                               3
Document Purpose
                  Washington, DC and the surrounding National Capital Region (NCR) have experienced
                  significant river, coastal, and interior floods that have negatively impacted federal and local
                  operations, land and facility assets, and supporting infrastructure. As a result, flooding is
                  one of the hazards that property and asset managers must consider to ensure a more secure
                  and resilient capital.
                  This guide provides a short summary of key flood risks in the NCR, an overview of
                  recent studies and tools that address current and future flood risks in the region, and brief
                  descriptions of how these studies can be used in flood risk management. While much of
                  the information addresses the entire NCR, the guide focuses on Washington, DC and
                  its monumental core. The document will assist planners and facility managers and help
                  inform their decisions on projects with flood risks.
                                                                                                                    Left: Riverine flooding
                  Intended Audience                                                                                 on the Potomac River
                                                                                                                    caused by heavy rains
                  The guide’s primary audience is facility managers, asset planners, and building design            along the Blue Ridge
                  professionals who are involved in the planning and design of facilities or land uses in or
                                                                                                                    Mountains in March
                  near floodplains in Washington, DC and its surrounding region. This document is not
                                                                                                                    of 1936. Flood waters
                  intended to be used by emergency management professionals, and is not a resource for
                                                                                                                    submerge parts of
                  what to do when a flood comes. The guide provides a high-level understanding of various
                                                                                                                    East Potomac Park
                  studies and tools, and a common vocabulary to compare them. It is written with enough
                                                                                                                    and what is now Joint
                  detail so that the reader can engage in discussions of work scope and findings with other
                                                                                                                    Base Anacostia-Bolling.
                  professionals. Further analysis, beyond what is contained in the referenced studies and

1. Introduction
                                                                                                                    Credit: National
                  tools, will likely be required for detailed planning and development.
                                                                                                                    Archives
4                                                                                                                                         5
Riverine Flooding
                                                                                                                                Riverine, or freshwater flooding, refers to
                                                                                                                                overbank flooding on the Potomac River
                                                                                                                                caused by its inability to contain the water
                                                                                                                                collected in the Potomac River Basin.
                                                                                                                                Heavy rainfall or snowmelt upstream can
                                                                                                                                cause increased water levels downstream
                                                                                                                                on the Potomac River hours or days later
                                                                                                                                that also can cause backwater flooding
                                                                                                                                on the Anacostia River.

                                                                                                                                Examples: Floods in 1936 (page 4 photo),
                                                                                                                                1942, 1985 (page 36 photo), and 2010

    Flooding in the National Capital Region
                                                                                                            Interior Flooding
    The National Capital Region is vulnerable to three types of flooding: riverine, coastal,
    and interior (described at right). Floods of each type have occurred in the recent past,                                    Interior floods, also known as flash floods,
    including interior flooding in 2006; riverine floods in 1889, 1936, 1942, and 1996; and                                     are caused by heavy rainfall that cannot
    coastal floods in 2003 and 2010. These floods can have a significant impact on buildings                                    be absorbed by the ground and then
    and infrastructure. The 2006 Federal Triangle flood, for example, destroyed critical parts                                  overwhelm the drainage system. Interior
    of the Internal Revenue Service headquarters’ electrical and mechanical equipment and                                       flooding can occur when river elevations
    submerged the basement level under five feet of water. This resulted in millions of dollars                                 are normal because interior floods are
    of damage and required the building’s 2,000 plus employees to be relocated for almost six                                   attributed to topography, development,
    months.1 The 2006 flood exposed the priceless collections of Smithsonian museums, the                                       localized weather, and the capacity of
    National Gallery of Art, and National Archives as vulnerable to water damage and power                                      stormwater systems.
    outages. The same flood also had significant impacts to the regional transportation system,
    as the Washington Metropolitan Area Transit Authority shut down its Federal Triangle
    Metrorail Station for four days and spent millions of dollars to clean and replace critical                                 Examples: 2006 Federal Triangle Flood
    train control and communication equipment.                                                                                  (page 43 map), 2012 Bloomingdale
                                                                                                                                Floods, and minor flooding in 2010 as
    Some, but not all, of the District of Columbia’s flood risk is mitigated by two primary levee                               shown on page 40
    systems: the Potomac Park Levee System and the Anacostia River Levee System. These levee
    systems (shown in white hatched lines on page 8) reduce risk to the District of Columbia
    from riverine and coastal flooding. They do not reduce the risk of interior flooding. Both
    levee systems were constructed by the U.S. Army Corps of Engineers (USACE). The
    Anacostia River Levee System is operated and maintained by the Department of the Navy                   Coastal Flooding
    and the National Park Service (NPS). The Potomac Park Levee System is operated and
                                                                                                                                Coastal floods refer to inundation caused
    maintained by NPS.
                                                                                                                                by the Potomac and Anacostia Rivers’
    The Anacostia River Levee System received an unacceptable rating by USACE due to                                            connection to the Chesapeake Bay and
    several major deficiencies. The system is also not accredited by the Federal Emergency                                      ultimately to the Atlantic Ocean. Coastal
    Management Agency (FEMA). After the USACE provided a positive levee system                                                  flooding includes inundation resulting
    evaluation report for the Potomac Park Levee System in spring 2016, FEMA accredited                                         from high tides (often called tidal,
    the levee system and issued a revised Flood Insurance Rate Map (FIRM) for the District                                      nuisance, or sunny day flooding), but
    of Columbia. The revised FIRM shows that the Potomac Park Levee System will reduce                                          also from coastal storms like hurricanes
    riverine and coastal flood risk to communities behind the levee by containing flood waters                                  that drive storm surge and waves up the
    that equate to the predicted 1 percent annual chance flood. When significant flooding is                                    Potomac River and into Washington, DC.
    expected, NPS erects the 17th Street post and panel closure (see photo on page 10), which
    is a part of the Potomac Park Levee System and prevents flood waters from entering the city                                 Examples: Nuisance floods (cover and
    through 17th Street, a low point in the National Mall.                                                                      page 44 photos), and Hurricane Isabel
                                                                                                                                (2003)

    1 Government Accountability Office (GAO), IRS Emergency Planning (2007), 4-5. http://www.gao.gov/new.
      items/d07579.pdf
6                                                                                                                                                                         7
FEMA's Flood Insurance Rate Maps for Washington, DC
Though only intended to be insurance rating products, FIRMs are often used by government agencies as the primary sources to
assess flood risk. FIRMs are available as PDFs in panels (an example is shown on page 28) at FEMA's Flood Map Service Center or
as an interactive online map called the National Flood Hazard Layer, a screenshot of which is shown below.

                                                                                                                                  Even with certified levee systems in place, the city still has significant flood risk. A high
                                                                                                                                  enough flood may overtop the levees, while other areas of the city, like East Potomac
                                                                                                                                  Park, are not protected by the levee systems at all. The primary way agencies evaluate their
                                                                                                                                  flood risk in 2017 is by using FIRMs produced by FEMA (see pages 8 and 28 for two
                                                                                                                                  examples of the maps). These maps show areas that are in the 1 percent annual chance,
                                                                                                                                  and 0.2 percent annual chance floodplains, commonly referred to as 100-year and 500-
                                                                                                                                  year floodplains, respectively.2 The maps are meant to be used for flood insurance rating
                                                                                                                                  purposes, and are not intended to be used for evaluating future flood risk, which may be
                                                                                                                                  impacted by changes in land use within the watershed and changes in precipitation and
                                                                                                                                  sea level. Planners and facility managers must use other tools and resources (which may
                                                                                                                                  vary depending on the type of flood risk) in order to understand and effectively respond to
                                                                                                                                  expected increases in future flood risk.

                                                                                                                                  Future Flood Risk
                                                                                                                                  The current understanding of flood risk is primarily based on the FIRMs for Washington,
                                                                                                                                  DC. As described in more detail on pages 28-35, FIRMs are created using analyses of
                                                                                                                                  historic and existing data. While accurately reflecting this information, they do not
                                                                                                                                  consider how conditions that influence flooding may change in the future. This is
                                                                                                                                  intentional, as Section 44 of the Code of Federal Regulations states that FIRM “revisions
                                                                                                                                  cannot be made based on the effects of proposed projects or future conditions.”3 Planners
                                                                                                                                  and facility managers often use FIRMs to evaluate flood risks for long-term investments,
                                                                                                                                  which can be problematic because this assumes that historic and existing data (used in
                                                                                                                                  the creation of FIRMs) is a good predictor of the future, a concept often referred to as
                                                                                                                                  stationarity. Stationarity has proven to be a faulty assumption in hydrology due to climate
                                                                                                                                  change (i.e. sea level rise and extreme precipitation), as well as land use changes like urban
                                                                                                                                  development. As an example, the number of times that daily flow exceeded 1,000 cubic
                                                                                                                                  feet per second (cfs) on the Northeast Branch of the Anacostia River in Maryland increased
                                                                                                                                  from once or twice per year in the 1940s and 1950s, to as much as six times per year in
                                                                                                                                  the 1990s. This was due primarily to urban development that increased impervious surface
                                                                                                                                  and decreased the amount of rainfall that could be absorbed by soil,4 but could also be
                                                                                                                                  attributed to lack of stormwater carrying capacity. To appropriately plan for and protect
                                                                                                                                  property, assets, operations, and other investments, which often have lifespans of 100 plus
                                                                                                                                  years, it is important to consider how future flood risks may be different from today.

                                                                                                                                  2 More on defining the term “100-year flood:” http://water.usgs.gov/edu/100yearflood.html
                                                                                                                                  3 Identification and Mapping of Special Hazard Areas, 44 C.F.R. § 65.6 (a) (3). https://www.gpo.gov/fdsys/
                                                                                                                                    granule/CFR-2011-title44-vol1/CFR-2011-title44-vol1-sec65-6
                                                                                                                                  4 Konrad, C.P. (USGS), Effects of Urban Development on Floods (2003). http://pubs.usgs.gov/fs/fs07603/
8                                                                                                                                                                                                                                              9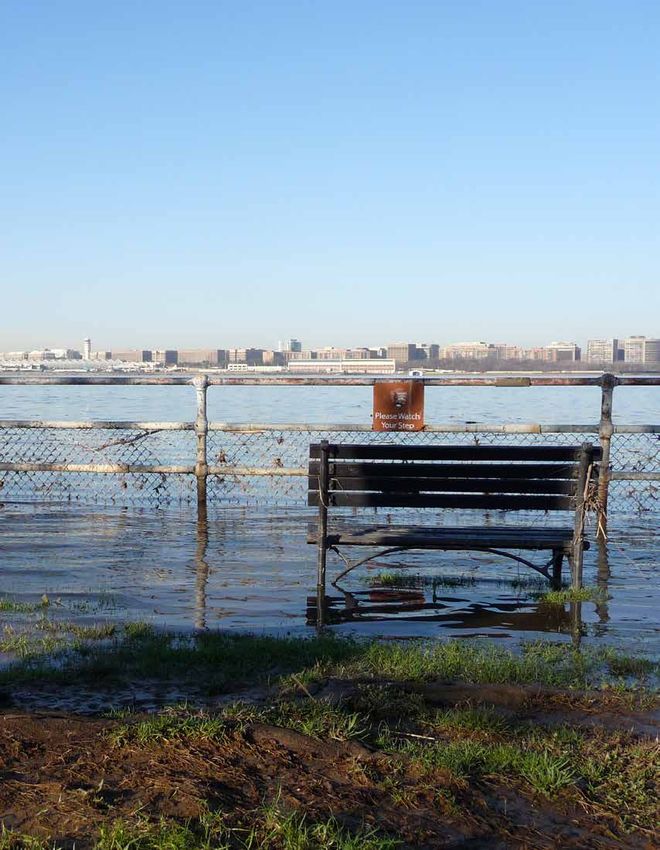
Document Structure
                                     This chapter describes the studies and tools currently available to planners and facility
                                     managers in the NCR to consider both current and future flood risks. A useful comparison
                                     to many of these tools are the FIRMs, which are the primary maps used to evaluate flood
                                     risk today. Because of this, Chapter 3 is devoted to an in-depth explanation of the mapping
                                     and modeling processes used in their creation. In addition, many of these tools are not
                                     explicitly designed to account for future flood risks, a key consideration for investments
                                     with long lifespans. Chapters 4-6 describe both how future flood risks may change in the
                                     region and the methods and tools that can be used to evaluate these future risks; including
                                     how the tools described in Chapter 2 should or should not be used. Because future flood
                                     risks and the methods used to model its impacts depend on the type of flooding, one
                                     chapter will be devoted to answering these questions for each of the region’s three types of
                                     flooding: riverine flooding (Chapter 4), interior flooding (Chapter 5), and coastal flooding
                                     (Chapter 6).

                                     One-Page Information Sheets
                                     One-page information sheets that describe the resources (tools, data, and studies) that
                                     are currently available for the NCR begin on page 16. These resources represent the most
                                     widely accepted and used planning resources as determined by the co-leaders of the DC          Left: Employees of the
                                     Silver Jackets. They do not include emergency management procedures or project proposals       National Park Service
                                     to reduce flood risk. The information sheets are meant to provide a quick overview of the      insert one panel of
                                     resource and help users decide how it can be used to evaluate both current and future          the 17th Street Levee
                                     flood risks. The following pages provide two overview graphics to help organize the list of    Closure during a test
                                     resources. Pages 12-13 include a list of all the information sheets organized by the type      installation on October
                                     of flooding (riverine, interior, or coastal) for which they are best suited and by tool type   14, 2016. The closure
                                     (projection, map, or report). Some tools will be useful for more than one type of flooding     protects the city from
                                     or can be classified as multiple tool types. Because many of the resources described in the    riverine and coastal
                                     information sheets reference the same source data, an additional diagram on pages 14-15        flooding Credit: U.S.
                                     has been included to show the relationship between source data and some of the resources.
2. Flood Risk Management Resources
                                                                                                                                    Army photo by Alfredo
                                     The eleven one-page information sheets begin on page 16.                                       Barraza
10                                                                                                                                                       11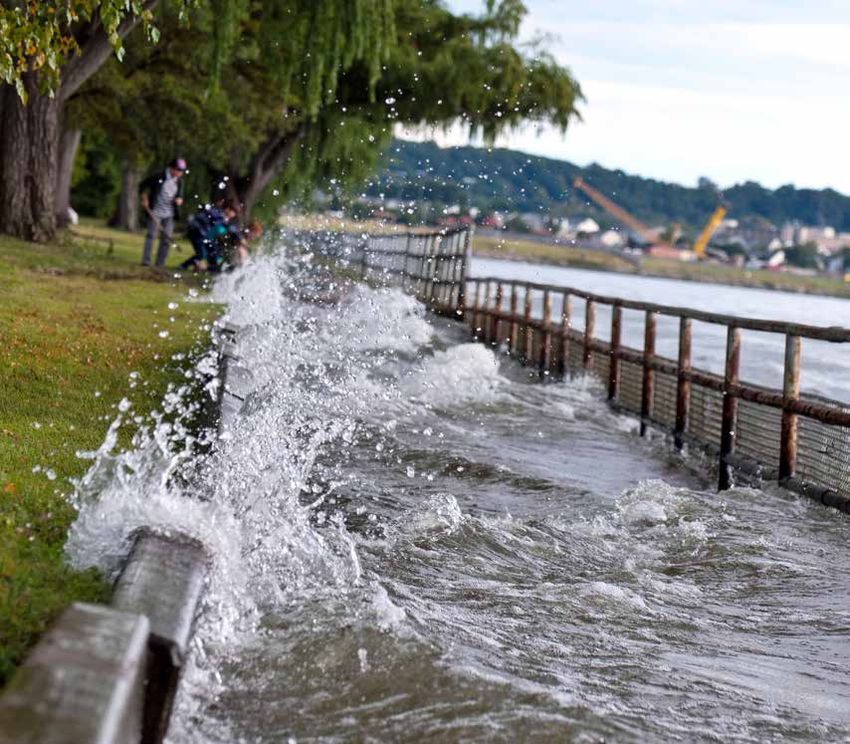
Flood Risk Management Resources for Washington, DC
The 11 resources described in this guide are listed below. Attributes of each study, Flood Type and Tool Type, are shown on page
13. Markers under Flood Type indicate that resource is useful for the specified types of flooding; riverine, interior, or coastal.
Markers under Tool Type indicate what kind of resource to expect: "Projection" indicates that the resource has predictions
about future climate conditions like sea level rise or precipitation, "Map" indicates that the resource includes a map or a model
that can be used to visualize flood impacts, and "Report" indicates that the resource includes a written report with useful
information on flood risk management.

Page #                                             Resource Name                                                    Last Update                                      Flood Type                                                                  Tool Type
                                                                                                                                                   Riverine                Interior                Coastal                  Projection                  Map                   Report
                                                                                                                                      1                                           2
     16             Flood Insurance Rate Maps (FEMA)                                                                         2010

     17             Flood Inundation Mapping Tool (USACE)                                                                    2016

     18             North Atlantic Coast Comprehensive Study (USACE)                                                         2015

     19             Storm Surge Inundation Maps (USACE)                                                                      2016

     20             Sea Level Rise Viewer (NOAA)                                                                             2017

     21             Surging Seas Risk Finder (Climate Central)                                                               2017

     22             Sea Level Change Curve Calculator (USACE)                                                                2017

     23             Precipitation Modeling (DOEE)                                                                            2015

     24             Federal Triangle Flood Study 2008                                                                        2008

     25             Federal Triangle Flood Study 2011                                                                        2011

     26             CMIP Climate Data Processing Tool (DOT)                                                                  2010
     1                                                                                                                                    2
          There have been six Letters of Map Revision (LOMRs) since 2010, which updated small areas within the map. The most recent           The Potomac Park Levee and 17th Street Closure LOMR changed the Flood Insurance Rate Map in that area to show interior flooding as well
          revision was in February 2017. The analysis used to create the original Flood Insurance Rate Maps was from 2010.                    as the flooding that would occur if the closure structure was not in place. This is the only location in Washington, DC where interior flooding
                                                                                                                                              is mapped. The original 2010 Flood Insurance Rate Maps and associated Flood Insurance Study did not analyze interior flooding.
12                                                                                                                                                                                                                                                                                          13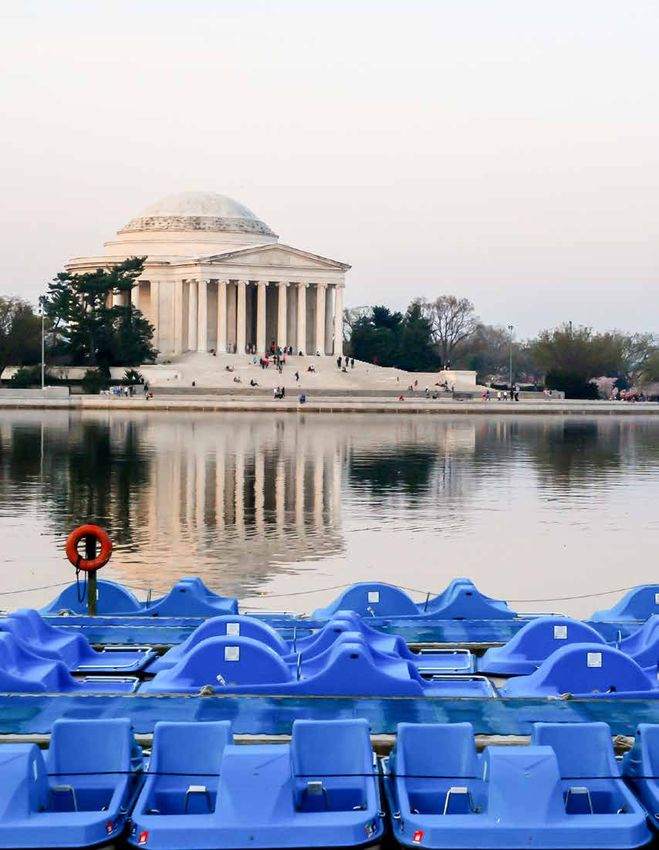
Data Sources
)
CE
SA
Many of the tools described in the information sheets reference the same source data. This diagram attempts to show the cases
y (U
E)
where the same underlying data or models are used by multiple tools. The diagram only shows underlying data and models
al )
AC
tud
)
)
OT
CE
ntr
that are used by more than one tool. For example, the Federal Triangle Interior Drainage Analysis described on page 26 used
)
( US
E
eS
l (D
SA
C
Ce
USACE's HEC-HMS software to model the flow of surface water in Federal Triangle. Since the HEC-HMS software was only used
SA
siv
tor
A)
l (U
08
11
oo
ate
s (U
EM
by the 2008 Federal Triangle Flood Study, it is not included in this diagram.
en
ul a
20
20
gT
oo
E)
im
reh
s (F
)
p
OE
al c
sin
dy
dy
AA
gT
Ma
(Cl
mp
Stu
Stu
ap
D
eC
ces
(NO
pin
er
g(
on
M
Co
ur v
Pro
nd
ap
od
d
lin
ati
r
ate
o
e
ast
i
nM
Flo
Flo
eC
iew
kF
e
nd
ta
od
R
Co
Da
Ris
ng
Inu
gle
gle
ce
o
V
nM
ati
tic
ise
ran
ha
te
as
ian
ian
rge
nd
an
tio
ma
el C
el R
Se
nsu
l Tr
l Tr
nu
Atl
Su
ita
Cli
ng
ev
ev
era
era
dI
dI
cip
rm
rth
rgi
aL
aL
IP
o
o
Fed
Fed
Sto
CM
Pre
Flo
Flo
No
Su
Se
Se
17
19
21
23
16
18
20
22
25
24
26
Stream and Tide Gage Data
The United States Geological Survey and National Oceanic and Atmospheric Administration maintain national networks
of gages that provide real-time and historic water level data that is used to predict future water surface elevations.
LIDAR Data
LIDAR (Light Detection and Ranging) is a method to collect data on surface elevation. The data is used to create digital
elevation models (DEM) upon which the flow of water over the surface can be modeled. LIDAR data varies in resolution.
CMIP Data
The Coupled Model Intercomparison Project (CMIP) compiles data from 56 global climate models (GCMs). Given various
carbon emissions scenarios, each GCM projects different changes in temperature and precipitation for a user-selected area.
Weather Station Data
Historic temperature, precipitation, and humidity data from weather stations within the region
are used as input data in climate models to predict future weather trends.
Sea Level Projections
Sea level projections from sources such as NOAA and USACE are used as input data for modeling
tools that show the vertical and horizontal extent of coastal inundation.
SLOSH Model
SLOSH, or Sea, Lake, and Overland Surges from Hurricanes, is a National Weather Service model used
to estimate storm surge heights resulting from historical, hypothetical, or predicted hurricanes.
HEC-RAS Model
HEC-RAS (Hydrologic Engineering Centers River Analysis System) is a USACE software program used for hydraulic modeling of
water flow. Given estimates of river flow or water surface elevation, it predicts the horizontal and vertical extent of flooding.
14 15
Flood Insurance Rate Maps Flood Inundation Mapping Tool
Federal Emergency Management Agency (FEMA) U.S. Army Corps of Engineers (USACE) and National Weather Service (NWS)
Purpose: Provide maps that show the 1% annual chance (100-year) and 0.2% annual chance (500-year) floods. The Purpose: Provide digital maps that allow government leaders, emergency managers, and the public to view potential
maps are used by the local jurisdictions to regulate development in floodplains and are used by the National Flood flood impacts during high-water events along the Potomac and Anacostia Rivers. The viewer provides access to
Insurance Program to determine flood insurance requirements. multiple map layers that correlate to real-time forecasts from the National Weather Service.
Flood Type Underlying Data and Modeling Flood Type Underlying Data and Modeling
Riverine
Modeling: The maps are created through a complex process that is detailed in Riverine
Modeling: The viewer uses the NAVD88 datum as its base elevation, with available
chapter "3. Mapping Current Flood Risk" on page 28. The process combines conversions to Mean Lower Low Water (MLLW) and Washington Mean Low Water
Interior historical data analysis contained in the 2010 Flood Insurance Study with the USACE Interior (WMLW) stages. The water flow over the Digital Elevation Model (DEM) is modeled
HEC-RAS software to model the water flow. with USACE HEC-RAS software.
Coastal Coastal
Accuracy: Washington, DC's floodmaps are derived from LIDAR data obtained in Accuracy: The underlying DEM data are from LIDAR data obtained in 2008, with
1999, used to create a Digital Elevation Model (DEM) with 1 meter contours. a horizontal resolution of 1 meter. The grids used to show depth of water were
Tool Type Tool Type downsized to 5 meter horizontal resolution for computational purposes.
NCR Specific: Washington, DC's maps were recently updated to show the 17th
Projection
Street Levee Closure as protecting against the 1% annual chance (but not the Projection
NCR Specific: The Potomac Park levee system and the 17th Street levee closure
0.2% annual chance) riverine or coastal flood. Much of the Federal Triangle area are included. Privately-owned structures, DC Water flood control structures and
Map is still in the 1% annual chance floodplain because interior flooding risk remains. Map the Anacostia levee system were not shown as providing protection.
Federal Triangle is the only location in Washington, DC where interior flooding is
mapped. The original 2010 Flood Insurance Rate Maps (FIRMs) and associated Flood Discussion
Report Report
insurance Study did not analyze interior flooding. Best Uses: This tool is best used for real-time emergency preparedness planning.
Based on the forecast from the NWS, users can view a map that most closely
Key Facts Key Facts resembles the predicted extent of the flood. For each of the three gages, there are
Discussion
2004 2008
approximately 20 layers depicting floods in about one foot increments, starting
Best Uses: This tool is best used for screening of assets at a master planning level. near the level of first inundation. These maps are also useful for planning “what-if”
Topographic Data
It is unique because it shows inundation from an extreme water level perspective,
Topographic Data scenarios as you can select a potential flood, regardless of NWS predictions, and see
with layers for the 1% annual chance (100-year) flood and the 0.2% annual chance the inundation extent. The NWS website that hosts the maps also has links to a real
2010 Available nationwide,
though this page refers
(500-year) flood. 2016 Available in many
locations; This page
time hydrograph and text descriptions of the effects of various flood levels.
Maps Published only to the DC maps Maps Published refers only to the Limitations: The underlying DEM data and resulting limited horizontal resolution
Limitations: The underlying DEM data and resulting limited horizontal resolution Washington, DC study.
means that this tool should only be used for high-level screening. This tool does not means that this tool should only be used for high-level screening. This tool does
Links not account for sea level rise or wave run-up (see diagram on page 49) on top of
incorporate future flood risks and projections of the 100 and 500-year floods are
Online Map Viewer and DC Resources based on existing conditions as of the effective date of the FIRM. Links predicted storm surge. Freshwater flooding of tributaries, including the Anacostia
https://msc.fema.gov/portal/ River, Rock Creek, and Cameron Run, is not considered in these maps. While these
Online Map Viewer
search?AddressQuery=washington%20dc Comparisons: Compare to "Surging Seas Risk Finder" on page 21, which can http://www.weather.gov/lwx/ tributaries show inundation, it is only a result of “back water” from the Potomac
provide annualized risk from a different perspective. The user determines the PotomacInundationMaps River.
2010 Flood Insurance Study height of flooding from 1 to 10 feet, and the viewer will provide the probablity that
https://www.ncpc.gov/docs/DC_Flood_ the selected flood will occur. Main Website for Study Comparisons: Compare to "Flood Insurance Rate Maps" on page 16 which use
Insurance_Study_Pre-17th_Street_Levee.pdf http://doee.dc.gov/service/fim the same underlying model techniques. The FIRMs only shows two flood layers
(100 and 500-year floods). Also compare to "Surging Seas Risk Finder" on page 21.
16 This information sheet is part of a series documenting the flood risk resources specific to the National Capital Region. This information sheet is part of a series documenting the flood risk resources specific to the National Capital Region. 17
This information sheet was last updated 1/24/2018. This information sheet was last updated 1/24/2018.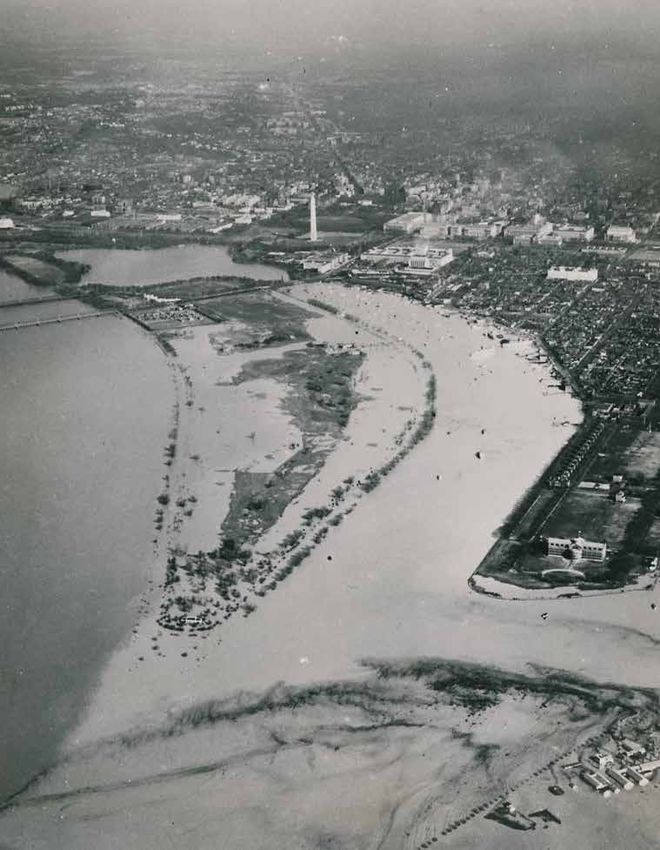
North Atlantic Coast Comprehensive Study Storm Surge Inundation Maps
Hurricane Intensity
Category 1 - 4
Category 2 - 4
Category 3 - 4
Category 4
U.S. Army Corps of Engineers (USACE) U.S. Army Corps of Engineers (USACE)
Purpose: Assess risk from storms and sea level rise post-Hurricane Sandy and support resilient coastal communities Purpose: Determine the reasonable worst-case (peak) storm surge from the various intensities of hurricanes that
in the North Atlantic coast. Additional appendicies for states and the District of Columbia provide regional-scale risk could strike the region. The end product includes worst-case scenario storm surge mapping for each category
maps and analyses along with coastal storm risk management strategies. hurricane (i.e., categories 1, 2, 3, and 4) that are used in Hurricane Evacuation Studies.
Flood Type Underlying Data and Modeling Flood Type Underlying Data and Modeling
Riverine
Modeling: The District of Columbia appendix uses a variety of flood mapping Riverine
Modeling: Water surface elevations for worst case storm surges are generated by a
techniques including the 1% and 10% annual chance floodplains, the 1% annual 2014 SLOSH model for the Chesapeake Basin (CP5), developed by NOAA's National
Interior chance floodplain plus 3 feet, and a simulation of a Category 4 Hurricane as Interior Hurricane Center. The surges are added to the mean higher high water (MHHW)
described in "Storm Surge Inundation Maps" on page 19. elevations. USACE overlaid these surge plus MHHW elevations from the SLOSH grid
Coastal Coastal on a Digital Elevation Model (DEM) to create the extent and depth of flooding.
Accuracy: Maps are based on an approximately 70m resolution grid. National
datasets were used for resource mapping such as wetlands and infrastructure. Low Accuracy: The underlying DEM is from 1 meter LIDAR data obtained in 2008 that
Tool Type resolution data was necessary because of the size of the NACCS study area. Tool Type was resampled to 10 feet. SLOSH grid cells range in size and are approximately 500
meters in the Washington, DC area.
Projection NCR Specific: The 17th Street Levee Closure and the Anacostia Levee System are Projection
not shown as providing protection. NCR Specific: The 17th Street Levee Closure and the Anacostia Levee System are
Map Map not shown as providing protection.
Discussion
Discussion
Report Best Uses: The District of Columbia appendix has two major resources. First are Report
a series of maps showing various coastal floods (described in "Modeling"), social Best Uses: The primary purpose of this data is to support hurricane emergency
vulnerability, population density, infrastructure, environmental and cultural management planning activities, including identification of evacuation zones. The
Key Facts resources. The report is unique because it also combines these maps to describe Key Facts map is meant to show the areas that are at risk for each hurricane category. For
risk (Probability of Occurence + Exposure to Hazards) for Washington, DC. Because example, if the NWS predicts that a Category 4 (CAT4) hurricane is approaching
2014
Data and Maps Created
these maps are low-resolution they cannot be used in master planning and are best
suited to identifying neighborhood sized areas at risk. The second resource is a Risk
2014
SLOSH modeling
Washington, DC, facility managers can refer to these maps to understand what
areas might be flooded. In the event that the area experiences a CAT4 hurricane,
Analysis that identified 6 key risk areas (i.e. "East of Georgetown," and "National Mall it is likely that some areas identified in the maps as being inundated may actually
2015 Available for U.S.
North Atlantic
/ Federal Triangle and Vicinity"). The District of Columbia appendix also evaluates
the type of shorelines and potential coastal management solutions for each risk 2016 Available in many
locations; This page
experience less flooding since the maps represent the worst-case. The maps are
useful in showing the areas that do not have storm surge flood risk (outside CAT4).
Report Published Coast Map Published refers only to the
area. The overall NACCS report also provides detailed explanation of a number of Washington, DC study. Limitations: This tool is only available as GIS shapefiles and there are no risk
coastal flood risk mitigation strategies.
Links Links percentages (such as 1% annual chance) associated with the layers in this map. The
Limitations: The scale of analysis and level of detail limit the map's usefulness. map does not account for increased sea levels or for riverine flooding.
Main Website for Study Online Map Viewer (DOEE)
http://www.nad.usace.army.mil/
Comparisons: The "Surging Seas Risk Finder" on page 21 also allows the http://doee.dc.gov/floodplainmap Comparisons: Compare to "Flood Insurance Rate Maps" on page 16 and "Flood
CompStudy/ (In Layers, check box for "Storm Surge")
combination of flood maps with other data like infrastructure, though its flood Inundation Mapping Tool" on page 17. Instead of layers created by annual risk
maps are created differently and have higher resolution. When evaluating sea level (FIRMs) or by elevation (FIMs) this tool has layers corresponding to Hurricane
Washington, DC Appendix Explanation of SLOSH
http://www.nad.usace.army.mil/ change, NACCS consulted projections from NOAA 2012, NASA 2012, and USACE http://www.nhc.noaa.gov/surge/slosh.php
strength. This tool is an update to a previous study in 2009: https://www.ncpc.gov/
Portals/40/docs/NACCS/NACCS_ 2013. The Coastal Hazards System web tool (described in Appendix C) provides (Refer to "Composite Approach") docs/2009_USACE_Hurricane_SSIM.pdf. The following document futher describes
Appendix_D.pdf access to the over 1,000 storm tracks (along with their predicted surge and wave how these maps compare with FIRMs: http://nhma.info/uploads/resources/flood/
heights) that were modeled for the NACCS: https://chswebtool.erdc.dren.mil/ CoastalFloodMapsFactsheet_Final.pdf
18 This information sheet is part of a series documenting the flood risk resources specific to the National Capital Region. This information sheet is part of a series documenting the flood risk resources specific to the National Capital Region. 19
This information sheet was last updated 1/24/2018. This information sheet was last updated 1/24/2018.Sea Level Rise Viewer Surging Seas Risk Finder
National Oceanic and Atmospheric Administration (NOAA) Climate Central
Purpose: Provide a preliminary look at sea level rise and coastal flooding impacts along the entire United States Purpose: Help users understand and respond to the risks of sea level rise and coastal flooding. The tool includes a
coast. The viewer is a screening-level tool that shows the horizontal inundation of sea level rise using mapping layers screening-level viewer that maps sea level rise and floods and provides high level analysis of impacts to population,
of one foot increments from zero to six feet. buildings, and infrastructure. The tool also includes localized sea level rise projections.
Flood Type Underlying Data and Modeling Flood Type Underlying Data and Modeling
Modeling: The viewer uses mean higher high water (MHHW) as its base elevation Modeling: Mean higher high water (MHHW) is the base elevation and floods
Riverine Riverine
and uses “bathtub modeling” that accounts for hydraulic connectivity. are depicted using “bathtub modeling” that accounts for hydraulic connectivity.
Interior Interior Multiple SLR projections, which Climate Central modifies to include local data, are
Accuracy: The underlying Digital Elevation Model (DEM) used for the National available.
Capital Region varies by jurisdiction. DC’s DEM is from 2014 USGS LIDAR with
Coastal Coastal
3m horizontal resolution. VA’s DEM is from 2011 FEMA LIDAR with 3m horizontal Accuracy: Underlying data is the same as "Sea Level Rise Viewer" on page 20.
resolution and MD’s (Prince George's County) DEM is from the 2008 National
Elevation Dataset with 10m horizontal resolution. NOAA has plans to update the NCR Specific: The 17th street levee closure is shown as protecting against a 10 foot
Tool Type Tool Type
MD DEM to 3m resolution from 2014 USGS LIDAR sometime in 2018. flood. The Anacostia Levee System is shown as offering no protection.
Projection Projection
NCR Specific: The 17th Street Levee Closure and the Anacostia Levee System are
Discussion
Map
not shown as providing protection. Map
Best Uses: This tool is best used for screening of assets at a master planning level.
Report Discussion Report This tool is unique in that it is organized to talk about risks of extreme flooding in
addition to sea level rise. A user can set the height of a flood at 8 feet and charts
Best Uses: This tool is best used for screening of assets at a master planning level
provide additional analysis that state, for example, “There is a 5% single-year risk
Key Facts and is best suited to evaluate potential for nuisance flooding. For example, a planner Key Facts in 2050 of a flood 8 feet or more above the high tide line,” based on a sea level rise
might use this tool to understand what areas would experience high tide flooding
projection chosen by the user. The tool also allows for easy visual comparison of
2008-14
Topographic Data
given 1-6 feet of sea level rise. The planner would determine on his own when that
given sea level rise elevation might occur. A unique and useful feature is the ability 2008
Topographic Data
multiple sea level rise projections, localized for Washington, DC. Also available are
an auto-generated Local Fact Sheet and Local Report with key infromation on sea
to download the underlying data (by state), including the DEM and sea level rise
level rise and estimates of assets (such as number of homes) vulnerable to floods.
layers. This viewer is also unique because it displays inundation layers as either high
2017 Available in
continental U.S. and
or low confidence. 2017 Available in
continental U.S.
Limitations: The underlying Digital Elevation Model (DEM) data and resulting
Nationwide viewer and Nationwide viewer and limited horizontal resolution means that this tool should only be used for high-
projections updated
Hawaii Limitations: The underlying DEM data and resulting limited horizontal resolution projections updated level screening. The flood heights in this tool are for extreme still water levels, and
means that this tool should only be used for high-level screening. This tool does not
do not include additional height from wave run-up. While the underlying model
map coastal storm surge, riverine flooding, erosion, or other coastal processes. While
Links Links incorporates low lying inland areas that are hydraulically connected to the rivers,
the underlying model incorporates low lying inland areas that are hydraulically
the hydraulic modeling only captures the connections that appear in the elevation
Online Map Viewer connected to the rivers, the hydraulic modeling only captures the connections that Online Map Viewer
data and doesn’t include connections like stormwater pipes.
https://coast.noaa.gov/slr/ appear in the elevation data and doesn’t include other hydraulic connections like http://riskfinder.climatecentral.org/place/
stormwater pipes. washington.dc.us
Comparisons: Compare this tool to NOAA’s "Sea Level Rise Viewer" on page 20,
NOAA FAQ Page which uses the same underlying elevation data but lacks the additional analysis
https://coast.noaa.gov/data/digitalcoast/ Comparisons: Compare this tool to Climate Central’s "Surging Seas Risk Finder" on Comparison with NOAA SLR Viewer
tools and displays inundation only up to 6 feet.
pdf/slr-faq.pdf page 21, which uses the same underlying elevation data but incorporates a more http://sealevel.climatecentral.org/matrix/DC-
robust suite of analysis tools and displays inundation up to ten feet. metro.html?v=1
20 This information sheet is part of a series documenting the flood risk resources specific to the National Capital Region. This information sheet is part of a series documenting the flood risk resources specific to the National Capital Region. 21
This information sheet was last updated 1/24/2018. This information sheet was last updated 1/24/2018.Sea-Level Change Curve Calculator DC Precipitation Projections
U.S. Army Corps of Engineers (USACE) District Department of Energy and Environment (DOEE)
Purpose: Help users apply USACE guidance requiring considerations for sea level change (SLC) to be incorporated Purpose: Provide downscaled precipitation projections for Washington, DC that can be used to inform engineering
in civil works programs and projects. The tool acheives this by offering localized SLC projections for a selected NOAA calculations for drainage infrastructure. The precipitation projections, which are most relevant to discussions on
tide gage along with graphs and charts to understand how SLC may impact a proposed project. flooding, are just one part of the report that includes temperature projections as well.
Flood Type Underlying Data and Modeling Flood Type Underlying Data and Modeling
Modeling: The user can view SLC based on projections from NOAA or USACE. See Accuracy: The projections are downscaled using regional weather stations and can
Riverine Riverine
"Relative Sea Level (RSL) Projections for Washington, DC" on page 54 for more be used anywhere in Washington, DC. Site scale projections are not practical.
Interior
details. Projections start in 1992 from 0 feet Local Mean Sea Level (LMSL). Interior
Modeling: The downscaled projections were created by incorporating historical
Accuracy: Since all SLC projections have inherent uncertainty, the viewer provides observations from local weather stations with 9 global climate models (GCMs).
Coastal Coastal
projections as a range of scenarios; low, intermediate, and high. The output was daily precipitation totals for three planning horizons (2020s, 2050s,
2080s). Using the projected precipitation values, statistical modeling was applied to
NCR Specific: The projections are based on the SW Waterfront Gage. The default
Tool Type Tool Type determine design storm values, similar to the process used to determine peak river
setting shows sea level elevation in feet relative to NAVD88. Users can set the
floods for the Flood Insurance Rate Maps.
"Output Datum" to "LMSL" so that SLC in 1992 (the baseline year) is 0 feet which
Projection Projection
would allow users to simply add the SLC projections to their critical elevations.
Map
Keeping the datum in NAVD88, however, allows for direct comparisons to FEMA Map Discussion
maps and local flood emergency manuals.
Best Uses: The projections are best used to see future changes in regional
Report Report
Discussion precipitation trends. By extrapolating the data and adding some uncertainty, they
can also be used for detailed engineering calculations to determine the size of
Key Facts Best Uses: Providing numerical values for sea level change. For example, by Key Facts future stormwater facilities. Precipitation changes are measured by three indicators
selecting the "Washington, DC" gage, and keeping all the default settings, the in the analysis: the number of annual days with more than 1 and 2 inches of rain
2013
USACE projections
user will see three values (low, intermediate, and high) for SLC for every 5 years
from 1995 to 2100. For more detailed analysis, users can also make changes to the 2012
Precipitation data used for
in a 24-hour period; the estimated rainfall depths associated with 24-hour design
storms for 1-, 2-, 15-, 25-, 100-, and 200-year recurrence intervals and 6-hour design
settings, including changing the source of the projections (from USACE to NOAA modeling from 1950 - 2012 storms for 2-, 15-, 100-, and 200-year recurrence intervals; and projections of future
2012, CARSWG 2016, or NOAA 2017), changing the source used to localize the
2017
80th, 90th, and 95th percentile events.
Last update to the
Available for
entire U.S.
projections, changing the time horizons, and adding in critical elevations (such as
the elevation of an emergency generator). The user can also plot various extreme 2015 Available only for
Washington, DC.
Limitations: As with any climate projection, there is inherent uncertainty because
calculator water levels to be added on top of the SLC curves. For example, users can add the Report Published of natural variability of the climate system, uncertainty in scientists’ ability to model
height of a 10-year, 50-year, or 100-year storm to the "high" scenario SLC curve. the response of climate systems, and uncertainty in future emissions of greenhouse
Links Links gases (GHGs). Using multiple GCMs and using two different GHG emission scenarios
Limitations: The above example (100-year plus SLC) is just an estimate and should in the projections helps to mitigate some uncertainty, though there is always
Online Calculator not be used for detailed site planning. Projecting the future 100-year flood elevation Precipitation Projections Report greater uncertainty when predicting extreme events.
http://www.corpsclimate.us/ccaceslcurves.cfm requires more analysis than simply adding SLC to the existing 100-year flood since http://doee.dc.gov/sites/default/files/dc/sites/
SLC isn't the only factor (i.e. storm intensity and higher tidal range) that would ddoe/publication/attachments/150828_AREA_ Comparisons: Compare this tool to "CMIP Climate Data Processing Tool" on page
User Manual (2015) Research_Report_Small.pdf 26 which provided some of the source data but did not provide downscaling.
increase the future 100-year flood.
http://www.corpsclimate.us/docs/Sea_
Level_Change_Curve_Calculator_User_ Comparisons: Compare this tool to Climate Central’s "Surging Seas Risk Finder" on DOEE Climate Projections Website
Manual_2015_46_FINAL.pdf http://doee.dc.gov/node/1110407
page 21, which displays SLC projections from different sources.
22 This information sheet is part of a series documenting the flood risk resources specific to the National Capital Region. This information sheet is part of a series documenting the flood risk resources specific to the National Capital Region. 23
This information sheet was last updated 1/24/2018. This information sheet was last updated 1/24/2018.Federal Triangle Interior Drainage Analysis Federal Triangle Stormwater Drainage Study
Federal Triangle Stormwater Study Working Group
Tetra Tech for DC Office of Planning Greely and Hansen for Federal Triangle Stormwater Study Working Group
Purpose: Assess the interior flooding impacts in the Federal Triangle area protected by the Potomac Park Levee Purpose: Create an accurate model of the Federal Triangle stormwater system and predict Federal Triangle ponding
system. The analysis was submitted as part of the Conditional Letter of Map Revision used to update the 1% annual levels that would occur for various storm frequencies. Propose system-wide flood control alternatives ranging from
chance floodplain boundary in FEMA's Flood Insurance Rate Maps. traditional infrastructure improvements to more innovative mitigation actions to mitigate interior flooding risk.
Flood Type Underlying Data and Modeling Flood Type Underlying Data and Modeling
Modeling: USACE's HEC-HMS software was used to model the flow of surface water Modeling: The study combined a hydrologic runoff model (modeling how water
Riverine Riverine
over streets and through detention basins in the Federal Triangle watershed. The flows into catch basins) with a hydraulic "pipe" model (modeling how and how
software also determined the elevation of water that would pond at the watershed's much water flows through sewer pipes) and a surface flow model (modeling
Interior Interior
low point in the Federal Triangle given certain conditions. ponding elevations of water that exceed sewer capacity). The hydraulic and
Coastal Coastal hydrologic models were recalibrated for this study from their original 2006 form.
Accuracy: 2008 LIDAR data with a horizontal resolution of 100 feet was used to The Digital Elevation Model (DEM) for the surface flow model was also recalibrated
generate a Digital Elevation Model (DEM) with 2-foot contours. The analysis notes as described below. Once calibrated to existing conditions and data from the 2006
Tool Type that there are elevation discrepancies between the 2004 and 2008 LIDAR data, but Tool Type flood, the model was used to predict ponding elevations of the 5, 15, 50, 100, 200,
that difference would have little effect on the elevation or extent of ponding in and 500-year storms.
Projection Federal Triangle. Projection
Accuracy: The underlying DEM for the surface flow and ponding is based on the
Map Map 2008 2-foot contour interval data (from the DC Office of the Chief Technology
Discussion
Officer) that was revised based on spot elevations produced in an April 2010 survey.
Report Best Uses: The maps provided in this report can be used in site planning analyses for Report Only pipes greater than 24 inches were included in the hydraulic model.
buildings within Federal Triangle and along Constitution Avenue. The maps show
the horizontal extent of interior flooding through four plausible scenarios. Scenarios Discussion
Key Facts Key Facts
1 through 3 simulate the ponding extents of a 100-year rainfall in combination with Best Uses: This tool not only provides elevations of flooding for various storm
2008
Topographic Data
the river surface at a 100-year elevation. Each scenario uses different assumptions
for how much water enters into sewer system catch basins and whether water 2011
Topographic Data and
events that can be used to design individual flood-proofing solutions, it also
evaluates the effectiveness and cost of possible alternative flood control measures.
that ponds in Federal Triangle is pumped out. The fourth scenario uses a joint Models recalibrated. Study results may be used to implement flood-proofing measures for individual
probability analysis of river surface elevation and 24-hour rainfall to determine the sites and to adopt best practices.
2008 Available only for
ponding elevation in Federal Triangle that has a 1% annual chance of occuring. The
report contains maps for each scenario, a map of the Federal Triangle watershed
2011 Available only for
Washington, DC. Limitations: While a helpful predictive tool, the study area is limited to the Federal
Washington, DC. Report Published
Analysis Published and its sewersheds, and various other figures. Triangle and Constitution Avenue. Additionally, the Stormwater Study recognizes
Links that factors outside of the study scope that must be considered when analyzing
Limitations: The study area is limited to the Federal Triangle and Constitution the costs and benefits of identified alternatives. Further, the storm models used
Links
Avenue and does not account for future precipitation trends. Summary Report (i.e. 100-year storm) are based on historic data and do not account for the fact that
Interior Drainage Analysis https://www.ncpc.gov/docs/Federal_Triangle_ future rain storms will likely be more intense and more frequent.
https://www.ncpc.gov/docs/TETRATECH_ Comparisons: The ponding area predicted in Scenario 4 is larger than the Stormwater_Drainage_Study_Companion_
Interior_Drainage_Analysis.pdf area predicted by a 1992 USACE study. Compare this study to "Federal Triangle Report.pdf Comparisons: This study built upon the previous studies. The predicted ponding
Stormwater Drainage Study" on page 25 which uses updated modeling in level for a 100-year storm event (approximately 8.2 feet for a 12-hour duration)
addition to suggesting potential mitigation actions. Full Study occupies a smaller area than what was predicted by the 2008 Tetra Tech Study
https://www.ncpc.gov/docs/Federal_Triangle_
(described on page 24). A previous 2007 GSA study (by Setty & Associates) only
Stormwater_Drainage_Study_Full.pdf
examined underlying causes of the 2006 flood and did not conduct modeling.
24 This information sheet is part of a series documenting the flood risk resources specific to the National Capital Region. This information sheet is part of a series documenting the flood risk resources specific to the National Capital Region. 25
This information sheet was last updated 1/24/2018. This information sheet was last updated 1/24/2018.CMIP Climate Data Processing Tool
U.S. Department of Transportation (USDOT)
Purpose: Process climate data from global climate models (GCMs) from the Coupled Model Intercomparison Project
(CMIP) into relevant, local-level temperature and precipitation statistics for transportation planners. CMIP data can
be used to understand the observed and expected changes in frequency and intensity of future precipitation events.
Flood Type Underlying Data and Modeling
Modeling: CMIP compiles data from 56 GCMs. Given certain green house gas
Riverine
emissions scenarios (Representative Concentation Pathways), each GCM projects
Interior different changes in termperature and precipitation across the globe. The USDOT
processing tool (an interactive excel spreadsheet that processes CMIP data) allows
Coastal users to view the observed record and projections for a selected geographic area.
Accuracy: GCMs available for selection in the Processing tool have varying This page is intentionally left blank.
Tool Type resolutions from 0.18° to 5° latitude-longitude resolutions. GCM outputs are
downscaled to 1/8° or 1/16° latitude-longitude (~14km or ~7km) resolutions in
Projection the USDOT processing tool. Since all GCMs are models, there is an inherent level
of scientific uncertainty in the output, which is mitigated somewhat by averaging
Map their outputs as USDOT does in this tool.
Report Discussion
Best Uses: This tool provides regional-level data on future precipitation and
Key Facts temperature changes. However, USDOT does not recommend using the outputs
directly in designing for built infrastructure without further downscaling.
2013 Precipitation changes are measured by the following variables: average total annual
Date of Publication for precipitation, 95th and 99th percentile precipitation amounts (and how often they
GCMs used in CMIP5
occur on average in a given year), average total monthly precipitation, average total
2016 Available in
continental U.S.
seasonal precipitation, and the largest 3-day precipitation event per season.
Date of last update to
USDOT Excel tool Limitations: Subject expertise is necessary to receive utility from this tool,
particularly to translate outputs into climate protection levels for the intended asset
Links and for the risk tolerance of the stakeholder. To select relevant data and to obtain
output from the data archive, users must follow a lengthy site tutorial to request
USDOT User Guide (PDF) data, indicate how the data will be used and agree to terms of use.
https://www.fhwa.dot.gov/environment/
sustainability/resilience/adaptation_ Comparisons: Many of the other tools source and/or synthesize data from CMIP.
framework/modules/user_guide/cmip_
user_guide.pdf
For example, in DC's precipitation projections (on page 23), DC downscaled CMIP
data by using long-term historical observations at the Dalecarlia Reservoir, National
Download CMIP Data Arboretum, and Reagan National Airport weather stations. GCMs from CMIP are
http://gdo-dcp.ucllnl.org/downscaled_ also used in many of the reports described on page 53 to create global mean sea
cmip_projections/#Welcome level projections.
26 This information sheet is part of a series documenting the flood risk resources specific to the National Capital Region.
This information sheet was last updated 1/24/2018.
27Flood Insurance Rate Maps
Though only intended to be insurance rating products, Flood Insurance Rate Maps
(FIRMs) are often the primary tool used by planners and facility managers to understand
flood risk in the region. Newer tools, such as the 2016 Flood Inundation Maps (described
on page 35), use updated modeling and topographic data, but are less well known. FIRMs
are often used because they show the horizontal extent (see figure on page 33) of the 1
percent annual chance, and 0.2 percent annual chance floods. The underlying data used to
create FIRMs comes from flood insurance studies (FIS). Both FIRMs and FIS are updated
infrequently and are a joint effort of the State Floodplain Manager, USACE, and FEMA.
FIRMs for Washington, DC, for example, were updated in 1985 and in 2010. Smaller
map revisions occur more frequently and do not require a reissuance of the Washington, Left: One panel of the
DC FIRMs.5 FIRMs for Washington,
DC showing the
In the NCR, there is an FIS for each jurisdiction, including Montgomery County, Prince confluence of
George’s County, Arlington County, and the District of Columbia. Each jurisdiction’s the Potomac and
FIS (see figure on page 30) analyzes major rivers and streams within their borders. The Anacostia Rivers.
District of Columbia’s FIS, for example, includes individual analyses for the Potomac and FIRMs are available
Anacostia Rivers, as well as smaller tributaries such as Broad Branch, Rock Creek, Oxon as PDFs in panels
Run, and Watts Branch. Creating flood analyses for rivers and streams is a complex and (shown here) or as an
unique process. Following is an overview of the creation of the FIS analysis only for the interactive online map
Potomac River within Washington, DC. The detailed explanation that follows is intended that can be seen on
to provide an understanding of how the FIRMs can and cannot be used to predict future page 10. Both types
flood risk. of maps are available
3. Mapping Current Flood Risk
at FEMA's Flood Map
5 FEMA’s term for this is Letter of Map Revision (LOMR). https://www.fema.gov/letter-map-revision Service Center.
28 29Multiple Flood Studies in the National Capital Region
Currently there are multiple studies that analyze flooding potential on the Potomac River. Flood Insurance Studies (FIS) are
created for each jurisdiction and are the underlying data for the Flood Insurance Rate Maps. The 2016 Flood Inundation Maps
depict a portion of the Potomac and Anacostia Rivers that cross multiple jurisdiction boundaries.
Flood Insurance Studies by Jurisdiction
District of Columbia 2010 FIS | City of Alexandria 2011 FIS | Fairfax County 2010 FIS | Prince George's County 2016 FIS
Arlington County: Used data from the District of Columbia 2010 FIS.
Montgomery County: No analysis was conducted for the Potomac River in the Montgomery County 2006 FIS.
2016 Flood Inundation Maps Extent (shown by river color)
Not included in 2016 Flood Inundation Maps Included in 2016 Flood Inundation Maps
Montgomery County
District of Columbia FIRMs
FIRMs for the Potomac River within the District of Columbia (see figure on page 30)
Little Falls are created by combining two different analyses from the 2010 Flood Insurance Study for
Potomac the District of Columbia (2010 FIS),6 which uses water gage7 data to predict floodplains
Gage
and create FIRMs. The first analysis is based on data from the Little Falls Gage and can
Ri
ve
be considered a riverine-only analysis, since the gage’s location is not tidally influenced8
r
and the data only measures water flowing downstream. The second analysis, based on data
from the SW Waterfront Gage, does not distinguish between riverine and coastal flooding
as it measures water surface elevation (which is influenced by both river flow and storm
surge). Both analyses and how they work in conjunction to represent existing flood risk in
District of Columbia 2010 FIS Washington, DC are described below.
Little Falls Gage Analysis
The extent of a 1 percent annual chance, and 0.2 percent annual chance riverine flood are
SW Waterfront
based on an analysis of historic data measuring the quantity of water flow from a nearby
ver
Gage
gage. The data for the Potomac River near Washington, DC is collected at the Little Falls
Ri
Ri
er
tia
Gage, which has measured water flow, also called discharge, since 1931 (see figure on page
cos
in
v
e
Approximate location that Ana 33). Using what is called a flood frequency analysis,9 historic “peak flow” flood events
determines if riverine or are used to project the river flow of the 1 percent annual chance and 0.2 percent annual
Coastal
coastal flooding has greater chance river floods. For example, the 2010 FIS estimates that the 0.2 percent annual
influence. chance Potomac River flood has a peak discharge of 698,000 cubic feet per second at the
Little Falls Gage. The fact that a peak flow of this quantity hasn’t occurred since the data
began to be recorded there reinforces that this peak flow value is statistically extrapolated.
When historic data is limited, statistical analysis must be used to estimate these extreme
events, like the 0.2 percent annual chance (1-in-500 chance) flood, that have recurrence
City of Alexandria
2011 FIS 6 Referred to in document as “2010 Flood Insurance Study.” Full Citation: FEMA, Flood Insurance Study
– District of Columbia Washington, D.C. (2010). https://www.ncpc.gov/docs/DC_Flood_Insurance_Study_
Pre-17th_Street_Levee.pdf
Prince George's 7 Water gages are scientific instruments that measure the depth or quantity of water at a certain point.
8 The Little Falls Gage is located just upstream of the Little Falls Dam which was constructed to divert water
Fairfax County County 2016 FIS to the Washington Aqueduct for the city’s water supply. The dam height, at 14 feet, means that tidal flows
or most storm surges will not reach the Little Falls gage. The gage is also located within part of the Potomac
2010 FIS River fall line, the point at which rivers plunge in elevation. Fall lines also represent the inland limit of
navigation for most rivers, past which vessels cannot continue without the help of lock systems. Little Falls is
the first barrier to navigation going upstream on the Potomac River. Great Falls, five miles further upstream,
is often also considered the fall line for the Potomac River.
Map Sources: Esri, HERE, DeLorme, MapmyIndia, © OpenStreetMap 9 More info on statistical analysis can be found on page 37 of this document: Federal Highway
contributors, and the GIS user community 1 mile North Administration, Highways in the River Environment – Floodplains Extreme Events, Risk and Resilience (2016):
https://www.fhwa.dot.gov/engineering/hydraulics/pubs/hif16018.pdf#page=37
Miles
30 Esri, HERE, DeLorme, MapmyIndia, © OpenStreetMap contributors, 31
0 0.5 1 2 3 4 and the GIS user communityYou can also read