D4.2 Report on the application of the tool on the case studies and for different bioenergy value chains selected - BIOPLAT-EU
←
→
Page content transcription
If your browser does not render page correctly, please read the page content below
Promoting sustainable use of underutilized lands for bioenergy
 production through a web-based Platform for Europe

 D4.2
 Report on the application of the tool on the
case studies and for different bioenergy value
 chains selected

 This project has received funding from the European Union's Horizon 2020
 research and innovation programme under grant agreement No 818083.
Project no. 818083
Project acronym: BIOPLAT-EU
Project title: Promoting sustainable use of underutilized lands for bioenergy
 production through a web-based Platform for Europe
Call: H2020-LC-SC3-2018-RES
Start date of project: 01.11.2018
Duration: 36 months
Deliverable title: D4.2 – Report on the application of the tool on the case studies
 and for different bioenergy value chains selected
Due date of deliverable: 30 April 2021
Project Coordinator: WIP Renewable Energies
Organisation name of lead contractor for this deliverable: Food and Agriculture Organization of
the United Nations (FAO), (2)

 Name Organization
 Marco Colangeli
 Lorenzo Traverso
 FAO
 Michela Morese
 Raul Köhler FIB
 Peter Gyuris GEO
 Giuseppe Pulighe CREA
 Cristian Tantareanu ENERO
 Oleksandra Tryboi
 SECB
 Olha Haidai
 Alfonso Calera UCLM

 Dissemination level
 PU Public x
 CO Confidential, restricted under conditions set out in Model Grant
 Agreement
 CI Classified, information as referred to in Commission Decision
 2001/844/EC
 1
History
Version Date Reason Revised by
01 15/06/2021 Completed FAO
02 16/06/2021 Revised WIP
03 16/06/2021 Final version FAO
04 08/07/2021 Resubmitted FAO/WIP

 2
Table of Contents
1 Introduction ................................................................................................ 4
2 Rationale ..................................................................................................... 6
3 Testing Reports............................................................................................ 7
 3.1 Germany .................................................................................................................... 11
 3.2 Hungary...................................................................................................................... 25
 3.3 Italy ............................................................................................................................ 32
 3.4 Romania ..................................................................................................................... 38
 3.5 Ukraine....................................................................................................................... 50
 3.6 Spain .......................................................................................................................... 58
4 Conclusions ............................................................................................... 62

 3
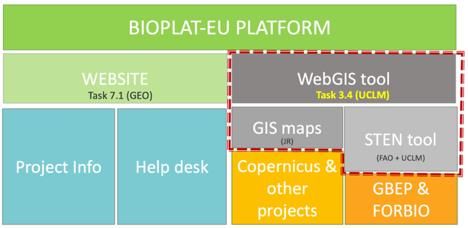
1 Introduction

The main objective of WP4 is to validate the work carried out under WP3 and improve it further
through verification of the whole webGIS tool, for more efficient and reliable results of its final
release. This will be achieved through a series of actions, including the testing of the beta
version of the WebGIS tool. Task 4.2 aims to test impact assessments of different value chains
for bioenergy production through defined case studies in all BIOPLAT-EU case study countries.

Figure 1. Structure of the BIOPLAT-EU Platform
Specifically, the testing of the tool represented the first official experiment of extensive multi-
location access to the BIOPLAT-EU platform and specifically operations within the webGIS tool,
performed by members outside the developers of the tool itself.
The testing is meant to benchmark the functionalities of the model, highlight bugs and errors,
as well as to assess critically the accuracy of the results. The testing of an incomplete and partial
tool would have added limited value to the fine tuning of the WebGIS for the development of
a system that works and performs up to expectations. The internal weblink to the tool was
shared by the technical team within BIOPLAT-EU with the rest of the consortia starting from its
alpha release, though i) several graphical and procedural changes have taken place ever since,
with continuity, and ii) several structural changes were also implemented (including addition
and re-structuring of entire indicators) until beta version was released. Prior to the release of
version beta of the WebGIS, the Consortium held its Progress Meeting. A first presentation of
the tool was given with all its active functionalities displayed. This was the occasion for initial
feedback and suggestions from the case study partners based on the latest version of the tool.
This demonstration was based on a hypothetical test case performed live by FAO. After beta
release, BIOPLAT-EU organized a dedicated internal webinar to display the current status of
development of the tool and provide a walkthrough to all partners. The results of this exercise
have set the foundations for the two-weeks of testing that followed. WP4 leader (FAO)
organized and moderated a webinar to which all partners participated. Already during the
webinar, initial feedback and questions coming from several partners were addressed and
discussed among the technical group of experts working on the development of the webGIS
platform. After the webinar, the WP leader instructed all partners to perform two simulations
 4
using the current, beta, version of the webGIS tool on the selected case studies, as per D4.1.
The WP leader prepared and shared a template document for the reporting format for all
partners to use and instructed through an accompanying email the partners on the best use for
such template. The creation of the template was necessary to guide the feedback and obtain
comparable evaluations and present clean balanced data that can be accessed from a
repository with consistency.

 5
2 Rationale

There were five main areas of interest in the testing phase, each linked to specific software
development objectives, which composed the rationale of this Task as listed below:
 1. Firstly, feedback was sought on the general characteristics of the tool. These include the
user friendliness, simulation limitations and procedure, clarity of the results, graphical aids, and
then tests of platform load in order to assess the stability of the IT-platform.
2. Consequently, WP leader and Technical Team members needed more specific feedback
on how the model works with respect to the quality of the data inserted by the user. Partners
were asked to register on the portal and run the analysis as advanced user. This step will return
information on the soundness of the algebra and reference values employed. Some aspects,
including formulas and calculations, as well as database information, have known glitches
already at the time of issuing of the testing template though there might be other aspects that
are not easily detectable by uniformed eyes. The case study partners with their knowledge of
the specific value chains and territory are best placed to detect, evaluate and correctly report
them in isolation.
3. The testing needs to assess the accuracy of default information (standard users) and
compare them with info from field trials and nationally generated data and experiences in the
same value chains as tested. The accuracy level that default values from databases can achieve
is within the understanding that a pan-European model like the webGIS platform will never
reach accountability of all real-world variables that come to play as a result of field trials. The
aim of this second exercise was therefore to evaluate the magnitude of such differential and
assess its acceptability. In other words, if a local expert expects a certain value of an indicator
to be within a certain range, the question to be answered from the testing exercise was
whether the deviation from such expected range is acceptable or not. This is specific to each
data entry (for some parameters a certain deviation in % may be acceptable whereas for a
different parameter the same deviation might be unacceptable), thus knowledge of bioenergy
sustainability assessment is necessary, and the evaluation of the results was done in synergy
with FAO in this case.
4. A fourth key objective of the testing was to evaluate the learning curve of a first cohort
of users (case study Partners) and track how they obtain familiarity with the tool and its
application in their respective case study contexts (case study 1 and 2) to then carry out
webinars with local stakeholders and present the BIOPLAT-EU platform and its potential for
future use.
5. Last but not least, the testing under Task 4.2 will define the characteristics of the
simulations that will feed into WP6 for the economic and financial assessments and bankability
potential of each case study.

 6
3 Testing Reports

This section of the Deliverable includes the reports performed by each case study Partner using
the webGIS tool beta release. The reports were obtained and are published without
modifications of any kind, to reflect with full transparency the testing iterations and the
impressions of the users.
The results of each testing were discussed with the author and specific points were taken to
final conclusion section of this report.
The template for the reports was composed of the following sections:
1 Introduction -
2 Overview
3 Variances
4 Assessment
5 Results
6 Evaluation
7 Summary of Activities
In more details, each section included guidance for the users to fill out its components.

1 Introduction
1.1 Background
 This document provides the background for the testing activities within iteration
 through the testing of scenario.
 This section should contain a brief background and history to this testing exercise which
 should include: a brief description of the characteristics of the test (make a summary from
 D4.1), any other relevant supporting information specific to the test (e.g. existing field trials
 with specific crops nearby, existence of bioenergy plants nearby case study area, etc).

1.2 References
 A list of documents referenced within this Test Summary Report document. These may be used to
 substitute standard values in the value chain data box. If data provided are evaluated more
 accurate than those included in the VC data box, these might be incorporated and appropriate
 citation for metadata will be necessary.

2 Overview

 7
This section provides a high-level overview of the significant events and activities documented
 during the testing. This part should be compiled at the end of the exercise as a summary
 containing main findings from the exercise.
 This section also specifies the scope of the testing (what was and what was not tested), and
 specifies the test environment details (including the hardware, software and data used in the
 testing e.g. mobile application, laptop, Mac vs PC, wifi connection performances, etc).
 For Example:
 The Iteration scenario for the testing of the WebGIS in the context
 of Task 4.2 of the BIOPLAT-EU project was begun on June 1st 2021 at 3:41 pm and completed
 on June 1st 2021 at 3:55 pm. During this testing only the following sections of the WebGIS
 platform were considered: Layers menu, STEN tool, Info Panels, Value Chain Data Box,
 Advanced Indicators, Results panel, etc.
 The testing was conducted on an HP Notebook Pro with 32Gbytes of memory running Microsoft
 Windows 10 Professional, a Wi-Fi broadband connection with results from speedtest.net of 162
 Mb/s in download and 30 Mb/s in upload. Browser used is Google Chrome.

 In addition, it should present a summary of the outcomes of the testing, the number of iterations
 within the same testing, potential noteworthy aspects (crashes, bugs, or result accuracy,
 etc).
3 Variances
 This section is used to record any variances of the artefacts from those areas agreed on
 previously, especially in areas that may cause concern to FAO, UCLM and JR evaluating the
 test results, including any references to supporting documentation that covers the reasons for
 the deviations (e.g. data, processes, etc.). To this end, remember for instance that GHG
 emissions in processing stages are calculated as blackbox values starting from information from
 BioGrace (www.biograce.net). In case for the specific testing you have literature that differs
 significantly from default values, please include both results (default values + own values) and
 provide a critical description of these variances.

4 Assessment
 This section provides a brief assessment of the comprehensiveness of the testing process for the
 completed testing phase against the test objectives and constraints specified in the Grant
 Agreement. For your convenience, below is an excerpt of the intended purpose “A number of
 scenarios will also be tested in order to test the accuracy of the tool and its versatility. During
 this phase, specific efforts will be dedicated to testing the various characteristics of the tool
 including user friendliness, clarity of the results, as well as overload stress tests in order to
 assess the stability of the IT-platform.”
 Here you should narrate the steps taken, the procedure followed, the responsiveness of the
 system to your inputs, and the success of your activity. Multiple iterations consequence of trial
 and error (or learning of the user) should not reported but only a description of such learning
 process should be provided.

 8
This section also identifies any aspects of the WebGIS platform that were not tested as
 thoroughly as planned (due to insufficient time, resources, capacity, or system errors, etc).
 For Example:
Unfortunately, it was not possible to test the Advanced Indicator INCOME due to lack of primary data
on e.g. Labour Costs and requirements.

5 Results
 This section provides a summary of the results of the testing, identifies all resolved issues and
 summarises the details of their resolution, and lists any outstanding issues.
 For Example:
Test Case Case Study 1, Italy, Giant Reed for Biogas, was carried out with great ease. The web
application responded swiftly to user’s inputs, the visualization at screen of the maps however was
slightly slow and blocky. No differences were detected in the Layer Tab when selecting the Satellite
Imagery vs the Sentinel set of images, making the latter apparently superfluous. The testing revealed
problems with the legibility of the results of Indicator “Land Tenure” showing a NaN.ed error message.
However, with a subsequent test iteration, where changes to the target area were made, this error
disappeared. Etc etc.

6 Evaluation
 This section provides an overall evaluation of the testing process including problems and
 limitations.
 For Example:
 The Case study 1, Giant reed for biogas, underwent comprehensive testing, with only two defects
 being observed on .----- and on …… .
 Additional Test Cases were designed and executed to explore the Value Chain Data Box
 legibility, and data accuracy with respect to literature and own observations in the field,
 following correction and re-testing it is believed that accuracy will be acceptable in use.
 Since a number of problems were observed with navigation, and only once re-loading the page
 re-testing was possible due to slow speed of the server, it is thought that there will be a Medium
 likelihood of navigation failure in use if user load increases.

7 Summary of Activities
 This section provides a summary of the major testing activities and events for the test performed
 for each and . This section also summarises testing resource
 information, such as total staffing levels (how many people performed the same test), total
 testing time, characteristics, etc etc.
 For Example:
 Test Start Date: June 1st 2021, @3:43 pm Test End Date: June 1st 2021, @ 3:55 pm

 9
Item Planned Actual
Staff Levels 3 2
Test Design Effort 1 2
Test Execution Effort 2 each 5 each
Re-Test Effort 1 2
Overall test evaluation Positive Positive
Expected malfunctioning NO YES
Critical malfunctioning NO NO
Overall testing result accuracy Good Fair
Inaccuracy attributable to: Data Data
Layers quality MUC lands: High MUC lands: High
 Suitability: High Suitability: Low
 BPPs: Medium BPPs: High
Etc. feel free to add other summary
categories as you see fit

 10
3.1 Germany

 Test Summary Report

 Test Information
 Project ID: BIOPLAT-EU
 Document Ref: Germany, Case Study 1, District Spree-Neiße
 Iteration ID: A) Sorghum for Biomethane
 Author: Raul Köhler, FIB (with support of Rainer Schlepphorst, Stefan Lukas,
 Anne Rademacher)
 Date: 02.06.2021/03.06.2021, 08.06.2021-10.06.2021

1 Introduction
1.1 Background
 This document provides the background for the testing activities within iteration Germany,
 Case Study 1, District Spree-Neiße through the testing of A) Sorghum for biomethane
 scenario.
 The case study area 1 – the district Spree-Neiße – is situated in the Lusatian Lowland in
 the southeastern part of the Federal State Brandenburg. Currently four opencast lignite
 mines are still in operation within the Eastern German lignite district (Lusatia), two of
 them in the selected case study area. The potential biomass production sites (BPS) are
 located in the reclaimed area of the running opencast mines. The next known biomethane
 facility is situated in Luckaitztal in the neighbouring district Oberspreewald-Lausitz. Some
 trials of sorghum were directly carried out on agricultural land in the post-mining area (see
 Theiß et al. 2014 and Märtin & Barthelmes 2014).

1.2 References
 THEIß, M., JÄKEL, K., PÖTZSCHKE, K., SCHAERFF, A., 2014: TV 4 Substratqualität
 und Biogaspotenzial, Wirtschaftlichkeit des Sorghumanbaus. In: SÄCHSISCHES
 LANDESAMT FÜR UMWELT, LANDWIRTSCHAFT UND GEOLOGIE (ed.):
 Pflanzenbauliche, ökonomische und ökologische Bewertung von Sorghumarten und -
 hybriden als Energiepflanzen, Final report
 Märtin, M., Barthelmes, G., 2014: Herbizidprüfung, Anbau auf Rekultivierungsstandorten
 und Praxisumfrage zum Sorghumanbau. In: JÄKEL, K. (ed): Abschlussbericht zum
 Verbundvorhaben: Pflanzenbauliche, ökonomische und ökologische Bewertung von
 Sorghumarten und -hybriden als Energiepflanzen. Abschlussbericht, 75-100.

 11
Gömann H., Witte T. de, Peter G., Tietz A., 2013: Auswirkungen der Biogaserzeugung auf
 die Landwirtschaft. Braunschweig: Johann Heinrich von Thünen-Institut, 78 p, Thünen Rep
 10, DOI:10.3220/REP_10_2013, https://www.thuenen.de/media/publikationen/thuenen-
 report/Thuenen-Report_10.pdf
 FNR: Basic figures on biogas technology, access 06/2021, https://biogas.fnr.de/daten-und-
 fakten/faustzahlen
 KTBL: Economic efficiency calculator for biogas, access 06/2021,
 https://daten.ktbl.de/biogas/startseite.do?zustandReq=79&selectedAction=showMona#start
 FNR, 2012: Sorghumhirsen – Ein Beitrag zur Diversifizierung des
 Energiepflanzenspektrums. 28 Seiten,
 https://mediathek.fnr.de/media/downloadable/files/samples/b/r/brosch.hirse-web.pdf
 Wagner, M., Knoblauch, S., 2011: Wassernutzungseffizienz und Wasserverbrauch von
 Sorghum bicolor im Vergleich zu Energiemais. 14. Gumpensteiner Lysimetertagung 2011,
 215 – 218, ISBN: 978-3-902559-61-6,
 DENA, 2020: Branchenbarometer Biomethan 2020, 14 Seiten,
 https://www.dena.de/fileadmin/dena/Publikationen/PDFs/2020/Brachenbarometer_Biometh
 an_2020.pdf

 A list of documents referenced within this Test Summary Report document. These may be used to
 substitute standard values in the value chain data box. If data provided are evaluated more
 accurate than those included in the VC data box, these might be incorporated and appropriate
 citation for metadata will be necessary.

2 Overview
 The Iteration Germany, Case Study 1, District Spree-Neiße scenario A) Sorghum for
 biomethane for the testing of the WebGIS in the context of Task 4.2 of the BIOPLAT-EU
 project was started on June 2nd 2021 at 01:00 pm and finally completed on June 10th 2021
 at 10:00 am. Although the tool is also offered in the national language (German), the test
 was conducted exclusively in English. The correct translation is checked separately. During
 the testing phase, the following sections of the WebGIS platform were considered:
 • Layers menu,
 • Background layers,
 • Map tools (zoom in, out),
 • STEN tool,
 • Info Panels,
 • Legends,
 • Value Chain Data Box,
 • Advanced Indicators,
 • Results panel
 The testing was conducted on a PC with 16 Gbytes of memory running Microsoft Windows 7
 Professional, a broadband internet connection with results from speedtest.net of about 92 Mb/s
 12
in download. The upload was blocked by the firewall. The browser used is Firefox 89.0 (64-
Bit).
A second machine with 16 Gbytes of memory running Microsoft Windows 10 Pro, a broadband
internet connection with results from speedtest.net of about 94 Mb/s in download and upload of
90 Mb/s was used for comparing testing. The browser used is Firefox 88.01 (64-Bit).
A tablet with 4 Gbytes of memory running Android 9 with a 10.1” FullHD screen was used as
third device option. It uses a WLAN internet connection with 96 Mb/s.
Additionally, navigating and selection was checked on a smartphone (Redmi Note 7, 6.3”
FullHD screen, 6 Gbyte RAM, Android 9).
The testing (crop management: high, rainfed, pathway biomethane, BBP: nearest location) was
performed 6 times with the following adaptions:
1) default parameters;
2) change only yield to 10 Mg/ha (expected mean);
3) change only yield to 15 Mg/ha (expected maximum);
4) change yield to 15 Mg/ha (expected maximum) and BBPs location to correct position based
on aerial photo;
5) change all parameter in the value chain data box according to description under 3. Variances
and BBPs location;
6) comparison with maize (default yield, high crop management, irrigated).

3 Variances
Value Chain Data Box – values
 ▪ ‘Crop Information’:
 The yield is too low (5.6 t/ha). Experiences from field trials on agricultural
 land in the Lusatian region and on reclaimed lignite mines show an
 comparable yield to maize between 10 and 17 t/ha (Theiss et al. 2014).
 The location of the two checked BBP are not accurate, but it could be
 manually put in the correct place.
 The default water requirement is on the high level, but within limits. On sandy
 reclamation sites the water consumption is be expected between 4,000 and
 5,000 m³/yr/ha (Wagner & Knoblauch, 2011). Used testing value: 4,500
 ▪ ‘Agronomic Information’:
 The amount of fertilizers are relative low. The nutrition demand of sorghum is
 partially much higher (FNR, 2012). The following quantities are usually
 applied as basic fertilization to agricultural lignite reclamation areas, as they
 are young raw soils: N – 120 kg/ha, P 60 kg/ha, K 200 kg/ha.
 ▪ ‘Bioenergy Production’:
 The LHV (lower heating value) of the selected feedstock (16,240 MJ/Mg) is
 high. Using the values from https://biogas.fnr.de/daten-und-fakten/faustzahlen
 the energy content of Sorghum should be near 11,400 MJ/Mg (15 Mg/ha →
 4,750 m³/ha with 36 MJ/m³).

 13
The ‘water consumption for feedstock processing’ is too low. The water
 requirement is 0.2 m³ per m³ of raw gas, which means 58.2 m³/Mg feedstock
 (see Gömann et al. 2013).
 ‘MJ of energy input per unit of feedstock processed’ is too low (1 MJ/t).
 According to KTBL the power demand is 0.25 kWh per processed raw gas.
 Using the conversion 1 MJ = 0.2777 kWh (https://www.iea.org/reports/unit-
 converter-and-glossary) and the initial amount of about 317 m³ methan/Mg
 feedstock leads to 285 MJ/Mg.
 In 2020 the mean market price in Germany was about 6 ct/kWh (DENA,
 2020) which are 0.22 EURO/MJ.
 Energy Access – values
 − It was not possible to check the parameter due to lack of primary data access.
 Income – values
 − The values were adapted according the parameter in the value chain data box (e.g. sum
 of amount of fertilizers: 400 kg/ha, explanation: K and P are applied as needed i.e. after
 testing). Seeds/Prices were also adapted (~300,000 seeds/ha, ~160 EURO).

4 Assessment
 The testing started with the loading of the website and the logging in as advanced user.
 − It would be a benefit if the BIOPLAT-EU logo (direct above the ‘Layers’) is linked to
 our project webpage.
 a) General navigation and selection process
 − First, the different background maps were checked at pan-European screen position.
 The Bing – Arial and the Bing – Road maps were not displayed. (Update on 08.06.2021:
 now all background maps were displayed.)
 − After successfully switching to OSM maps and zooming to the German case study
 area, the appearance of the individual layers was checked. All layers were displayed
 correctly. However, there were some performance issues when activating the crops
 suitability maps and zooming (Firefox/Chrome).
 − In the next step, the button ‘info layer’ of each layer was clicked. The information as
 box are sound but there is an error with the metadata from ‘Administrative limits’
 regarding the loading of xslt-stylesheets (in Firefox). When using the tablet with
 Chrome browser, the metadata file was shown without errors. The ‘Crops suitability’
 information should be completed with the explanation of data sources and methodology
 to avoid confusion and disappointment among users.
 − There are minor issues with the selection process of a BPS: You must zoom in far
 before the selection process becomes visually comprehensible (red border of polygon,
 tool tip with ha). If the ‘i’ button is inactive at the same time, e.g. because you have
 displayed the legend, and you have not read the ‘quick help’ either, you are not able to
 do the selection. It would be more user friendly to change automatically to the ‘i’ button
 when a MUC land was selected (1. check the status of the ‘i’ button and 2. change to
 status activate).
 − The area size shown in the right information box is not the same as the surface of BPS
 in STEN tool.
 14
− The selection process of a MUC area and value chain is more difficult on the tablet,
 because the left tool box frame (STEN) uses about 50% of the screen width (landscape
 mode). You need also the right info box (Summary/Information/ Legend/Quick Help
 etc.) for selecting. At this moment, the visible part of the map is insufficient. At portrait
 mode the tool frames overlap. On the other hand, you can minimize both tool
 frames/windows to see the map. Therefore, it is usable but less comfortable than on a
 PC with larger screens.
 − The user of a smartphone faces the same problems as with the tablet. Nevertheless,
 minimizing the both tool frames is a solution as well.
 − The selection of crop management, water supply, the crop and bioenergy pathway was
 intuitive and without problems. There is one serious exception: the selection of crops
 whose feasibility is less than 30% cannot be selected. This will mean that Case study 2
 cannot be carried out with the planned crops Poplar or Miscanthus.
 − Another issue is related to the selection of maize: the user can only select the
 combination of Rainfed and Low ‘Crop management practice’. This should extended to
 High.
 − If you click on the ‘Accept’ button without waiting for the tool to calculate the route to
 the BBP, it cannot start the simulation process in the value chain data box. One simple
 solution is waiting but a preliminary check by the webGIS tool could avoid user errors.
 − From the advanced user's point of view, it would be a very useful feature to have
 multiple MUC areas selected and calculated them in a queue with the same average
 basic settings (crop management, crop, yield, bioenergy pathway) and get a summarized
 result.
b) Value Chain Data Box – layout, design, etc.
 − The right box shows the summary of the selection process but it is called ‘Defined
 Target Area’. Is this the correct term?
 − Sometimes the map on the right side is not shown (value chain data box, results)
 (Firefox).
 − The unit ‘ton’ should be used in a consistent way. Depending on the country (UK, US,
 CA) it could mean different weights (about 907 kg or 1,016 kg), which should be
 avoided. See https://en.wikipedia.org/wiki/Ton. ‘Metric ton’ or ‘tonne’ means 1000 kg.
 Perhaps we should use the official SI unit ‘megagram’ (symbol: Mg) (see
 https://en.wikipedia.org/wiki/Megagram). This refers to the selection process, the value
 chain data box, and the results.
 − All units in the value chain data box and the results must be checked regarding
 consistence (e.g. unit ‘ha’ instead of ‘Ha’, ‘Tonnes’ vs. ‘T’ vs. ‘ton’, ‘yr’/’year’).
 − Abbreviations that are not commonly used should be written as full name (‘household’
 instead of ‘HH’, in German users will automatically link HH with Hamburg).
c) Value Chain Data Box – values
 The values in ‘Target Area’ refers to three municipalities and are comprehensible.
 ‘Crop Information’:
 − The changes are described in chapter 3. Variances.
 ‘Agronomic Information’:

 15
− ‘Level of mechanization’ is plausible as well as the ‘amount of applied
 pesticides’.
 − Changes are described in chapter 3. Variances.
 − The number of jobs could not be evaluated.
 ‘Bioenergy Production’:
 − The ratio ‘MJ of Bioenergy product(s)/MJ feedstock’ is much too low or the
 unit ‘%’ is inappropriate.
 − There may be a duplication with ‘EU market price of bioenergy product’ and
 ‘Cost of raw material (per MJ of bioenergy product)’.
 ‘Transport of Feedstock/SVO/Bioenergy Products’:
 − The number of job positions are zero. Perhaps it should not refer to tonnes and
 km, but only to Mg feedstock to generate meaningful results on target are level.
d) Energy Access – values
 It was not possible to check the parameter due to lack of primary data access.
e) Income – values
 The changes are described in chapter 3. Variances.
f) Results – layout, design
 − The calculation was very fast and the results were clearly presented in tables.
 However, there are some issues with superscripted and subscripted units.
 − There are some indicators, which work as percentage, like ‘Land Use and Cover
 Change’. For these, the row description (currently only ‘Percentage’) should clearly
 state the reference (perhaps ‘Percentage of Target Area’).
 − In ‘Advanced Indicators’ / ‘Energy Access’ there are several percentage values which
 refers to different levels (target area, national, EU). The level could be highlighted to
 make the values easier to read.
 − It is somewhat unusual that the position of ‘Unit’ (column title) changes between the
 two tables ‘Income’ and ‘Energy Access’, but of course there is a lot of information to
 show.
g) Results – values
 − Some values are very low for the selected case due to the small area of the selected
 BPS. E. g. the indicators for ‘Capacity’ on national and EU level are 0.000.
 − The ‘Advanced Indicator’ / ‘Energy Access’ indicators show only 0.00, possibly they
 are too small for the selected units and the field size.
 − The explanation of each indicator within the tables is of great value. Additionally, a
 link to the definition and background of the indicators should be available, because not
 all indicators are self-explaining. I am not sure, if stakeholders like i.e. farmers are able
 to interpret all results and indicators correctly without further help.
h) Results – export
 − Next to the symbol of the pdf document should be a short description like ‘Export’.
 Using a tablet or smartphone, the icon is easy to miss because it is not at the top of the
 page but below the map and next to ‘Results’.

 16
− The export function works satisfactorily. However, sometimes no map is included in
 the document (Firefox, correspond with the missing map in value chain data box).
 − The field ‘Amount of applied pesticides’ under ‘Value Chain Data Box’ / ‘Agronomic
 Information’ is duplicated.

5 Results
 Test Case Case Study 1, Germany, Sorghum for Biomethane, was carried out with no major
 problems.
 The webGIS tool responded promptly to user’s input. Depending on the active map, the response
 time of the website was slightly delayed.
 In the current state, the tool has some minor presentation issues with i.e. units (superscript,
 subscript) or the selection process. There were no error messages, but some very low values or
 0.000.
 The advanced user can easily adjust all input values. This is a crucial methodological approach,
 because the default values cannot represent all local specific characteristics.
 One important success factor may be the further explanation and support for the interpretation
 of the calculated indicators.
 A most important outstanding issue is the access of the advanced user to all crops, independent
 of the suitability maps.
 The multiple selection of MUC land and the calculation in a batch would be a very useful feature
 upgrade for advanced users.

6 Evaluation
 The Case study 1, Sorghum for biomethane, underwent comprehensive testing with no major
 defects. Additional Test Cases were designed and executed to explore the Value Chain Data
 Box legibility, and data accuracy with respect to literature and own observations in the field,
 following correction and re-testing it is believed that accuracy will be acceptable in use.
 The tool was stable, no re-loading was necessary on all machines.

7 Summary of Activities
 Iteration Germany, Case Study 1, District Spree-Neiße scenario A) Sorghum for biomethane
 with six different input parameter options and four different hardware variants (see chapter 2.).
 Test Start Date: June 2st 2021, @1:00 pm Test End Date: June 10st 2021, @ 10:00 am
 Item Planned Actual
 Staff Levels 2 2 (+2 supporting)
 Test Design Effort 1 2
 Test Execution Effort 2 each 2 each

 17
Re-Test Effort 1 1
Data checking Effort 2 4
Overall test evaluation Positive Positive
Expected malfunctioning NO NO
Critical malfunctioning NO NO
Overall testing result accuracy Good Fair
Inaccuracy attributable to: Data Data
 Suitability maps
Layers quality MUC lands: High MUC lands: High
 Suitability: Medium Suitability: Low
 BPPs: Medium BPPs: Medium
 (position issues)
Usability on Computer Good Good
Usability on mobile devices Good Fair

 18
Test Summary Report

 Test Information

 Project ID: BIOPLAT-EU

 Document Ref: Germany, Case Study 2, District Dahme-Spreewald

 Iteration ID: B) Poplar for CHP (solid biomass)

 Author: Raul Köhler, FIB (with support of Rainer Schlepphorst)

 Date: 16.06.2021/17.06.2021

1 Introduction
1.1 Background
 This document provides the background for the testing activities within iteration Germany, Case
 Study 2, District Dahme-Spreewald through the testing of poplar for CHP (solid biomass)
 scenario.
 The case study area 2, district Dahme-Spreewald, is located in the Lusatian Lowland in the
 southeastern part of the federal state Brandenburg. The potential biomass production sites (BPS)
 are located in the disused sewage irrigation fields. Long irrigation periods with excessive loads
 of nutrients and increasing pollutants impaired the soil fertility. In addition, hazardous
 substances of industrial wastewater (e.g. heavy metals) cumulated in the topsoil affecting both
 plant growth of sensible species and crop utilization.
 Today the former sewage irrigation fields are mainly used as agricultural fallow land and as a
 land backup for compensation measures in nature protection. The next bioenergy production
 plant is situated in Königs Wusterhausen (about 6 km).

1.2 References
 Knur, L., Murach, D., Murn, Y., Bilke, G., Muchin, A., Grundmann, P., Eberts, J., Schneider, U.,
 Grünewald, H., Schultze, B., Quinkenstein, A., Jochheim, H. (2007): Potentials, economy and
 ecology of a sustainable supply with wooden biomass. In: 15th Europ.Biomass Conf. Proceedings,
 Berlin, May 2007.
 Carmen e.V. (2021): Market prices for wood chips, https://www.carmen-
 ev.de/service/marktueberblick/marktpreise-energieholz/marktpreise-hackschnitzel/
 LfULG (2014): Schnellwachsende Baumarten im Kurzumtrieb - Anbauempfehlungen. 76 pages,
 https://www.lignovis.com/fileadmin/user_upload/PDF/Ext/2014_11_Schnellwachsende_Baumar
 ten_Kurzumtrieb_Sachsen_SMUL.pdf

 19
A list of documents referenced within this Test Summary Report document. These may be used to
 substitute standard values in the value chain data box. If data provided are evaluated more
 accurate than those included in the VC data box, these might be incorporated and appropriate
 citation for metadata will be necessary.

2 Overview

 The Iteration Germany, Case Study 2, District Dahme-Spreewald scenario B) Poplar for
 CHP (solid biomass) for the testing of the WebGIS in the context of Task 4.2 of the
 BIOPLAT-EU project was started on June 17th 2021 at 08:00 pm and finally completed on
 June 17th 2021 at 04:30 pm. Although the tool is also offered in the national language
 (German), the test was conducted exclusively in English. The correct translation is checked
 separately. During the testing phase, the following sections of the WebGIS platform were
 considered:
 • STEN tool,
 • Info Panels,
 • Value Chain Data Box,
 • Advanced Indicators,
 • Results panel
 The testing was conducted on a PC with 16 Gbytes of memory running Microsoft Windows 7
 Professional, a broadband internet connection with results from speedtest.net of about 92 Mb/s
 in download. The upload was blocked by the firewall. The browser used is Firefox 89.0.1 (64-
 Bit).
 The testing (crop management: high, rainfed, pathway CHP (solid biomass), BBP: nearest
 location) was performed 2 times with the following adaptions:
 1) changed only yield to 6.5 Mg/ha (expected mean);
 2) changed all parameter in the value chain data box according to description under 3. Variances

 20
3 Variances

 Value Chain Data Box – values
 ▪ ‘Crop Information’:
 The default water requirement reflects current findings (Knur et al. 2007).
 ▪ The market price was changed to 75 €/ton regarding to Carmen e.V. (2021).
 ▪ ‘Agronomic Information’:
 The amount of fertilizers are too high for low yielding SRC in the Northeastern
 German lowlands. The following quantities can be applied as fertilization: N –
 22 kg/ha, P 4 kg/ha, K 16 kg/ha (LfULG, 2014).
 ▪ In the year of the planting, the cuttings must be kept as free as possible from
 weeds, e.g. by using herbicides: 3 kg/ha.
 ▪ ‘Bioenergy Production’:
 The LHV of the selected feedstock (15,000 MJ/Mg) is correct.
 In 2020 the mean market price in Germany was about 6 ct/kWh (DENA, 2020)
 which are 0.22 EURO/MJ.
 Energy Access – values
 ▪ It was not possible to check the parameter due to lack of primary data access.
 Income – values
 ▪ The SRC was planned with a short-term rotation period. Therefore 10,000
 cuttings per ha will be used.
 ▪ The basal fertilizer in year 1: 80 kg/ha; and herbicides: 3 kg/ha.
 ▪ The working time is adapted to typical values.
 ▪ There is no harvesting in year 1.

4 Assessment

 The testing started with the loading of the website and the logging in as advanced user. Detailed
 comments about general navigation and selection process were made in the report to iteration
 ‘Germany, Case Study 1’.
 Update (17.06.2021):
 − Selection:
 The ‘Layers’/‘Info Layer’ are not working anymore.
 − The advanced user can now select crops whose feasibility is less than 30%. The
 advanced editing provides an additional selection window (currently still called ‘Editar
 cultivo’) which can be used intuitively.
 − Value Chain Data Box:
 The manually corrected yield (6.5 Mg/ha) was overwritten by 3.00 T/ha after clicking
 ‘Accept’. The value can be corrected by using the editing tool another time or by editing
 the yield in the ‘Value Chain Data Box’.
 − There is an issue with the amount of fertilizers, etc.: The advanced user can change the
 values for N, P, K, pesticides etc. in the ‘Value Chain Data Box (standard)’ / ‘Agronomic
 Information’. However, it must clearly indicated, which kind of input value (in kg/ha) is
 expected: the nutrient element itself (‘chemical’ ?) or the chemical compound, e.g. nitrate
 (NO3-).
 21
− Furthermore, if you have selected a perennial crop it is not clear if the amount of
 fertilizer refers to only one year (and will repeated yearly) or to the whole simulation
 period (20 years).
 In addition, in the advanced section ‘Income’ there is a subdivision between different
 time slices (Year 1, Year 2-20) for which is not clear how they are related to the standard
 input parameters. The column heading ‘Year 2-20’ should explicitly describe the time
 reference of the expected input variable: Should the user uses summarized amounts for
 19 years or the yearly mean of amount?
 Both issues can be addressed easily by using unique column headings or units, e.g.
 kg/ha/year.
 − Results:
 The comparison chart with ‘Fossil Fuel’ is very nice and clearly shows the potential
 impact of the selected bioenergy pathway. It should be specified which values where used
 for the calculation of the ‘Fossil Fuel’. It would be great if this kind of comparison chart
 could be used to visualize one important aspect of other standard indicator too.
 − ‘Advanced Indicator’ / ‘Income’:
 When using default values (poplar with yield of 6.5 Mg/ha) the annual gross profit and
 annual net profit are positive (72,775 Euro and 28,492 Euro). After the adaption of the
 planting costs to 10,000 plants per 0.16 Euro (1,600 Euro/ha) the advanced indicator
 ‘Income’ was negative (-422,749 / -462,227 Euro). This is a major discrepancy to version
 1 (default values with 6.5 Mg/ha).
 Switching all ‘income’ values to 0.00 in the value chain data box showed that only the
 income of the total feedstock production of one year (the first ?) was calculated (2,231
 Mg * 75 Euro/Mg = 167,000 Euros). The feedstock of the year 2-20 was not calculated
 and so the yearly gross and net margin at the farm gate is not correct, because the costs
 in the first year are much higher than in the following years. The yearly gross and net
 profit of a perennial crop should be a mean value of the complete processing period.
 − ‘Advanced Indicator’ / ‘Income’:
 There is a discrepancy between row € and € ha-1 yr. Since the second row is probably
 calculated from the first, they should have the same sign (negative vs. positive).

5 Results

 Test Case Case Study 2, Germany, Poplar for CHP (solid biomass), was carried out with no
 major problems.
 The webGIS tool responded promptly to user’s input. Depending on the active map, the response
 time of the website was slightly delayed.
 In the current state, the tool has some minor presentation issues with i.e. units (superscript,
 subscript) or the selection process. There were no error messages, but some very low values or
 0.000.
 The advanced user can easily adjust all input values. This is a crucial methodological approach,
 because the default values cannot represent all local specific characteristics. The advanced user
 can now select each crop preselected in the BIOPLAT-EU project, which gives new testing
 abilities to the user.
 One important success factor may be the further explanation and support for the interpretation
 of the calculated indicators. The intuitive comparison chart about the indicator ‘Air Quality’ is
 a good example.
 22
It is necessary to double-check the calculation algorithm of the gross and net margin indicators
 (Advanced Indicators / Income) for perennial crops to include all feedstock produced during the
 production period.
 The multiple selection of MUC land and the calculation in a batch would be a very useful feature
 upgrade for advanced users.

6 Evaluation

 The Case study 2, Poplar for CHP (solid biomass), underwent comprehensive testing with no
 major defects. Additional Test Cases were designed and executed to explore the Value Chain
 Data Box legibility, and data accuracy with respect to literature and own observations in the
 field, following correction and re-testing it is believed that accuracy will be acceptable in use.
 The tool was stable, no re-loading was necessary.

7 Summary of Activities

 Iteration Germany, Case Study 2, Poplar for CHP (solid biomass) with two different input
 parameter options (see chapter 2.).

 Test Start Date: June 17th 2021, @8:00 am Test End Date: June 17th 2021, @ 04:30 pm

 Item Planned Actual

 Staff Levels 1 1 (+1 supporting)

 Test Design Effort 1 1

 Test Execution Effort 2 each 2 each

 Re-Test Effort 1 1

 Data checking Effort 2 2

 Overall test evaluation Positive Positive

 Expected malfunctioning NO NO

 Critical malfunctioning NO NO

 Overall testing result accuracy Good Fair

 Inaccuracy attributable to: Data Data

 23
Layers quality MUC lands: High MUC lands: High

 Suitability: Medium Suitability: Low

 BPPs: Medium BPPs: High

Usability on Computer Good Good

 24
3.2 Hungary

 Test Summary Report

 Test Information
 Project ID: BIOPLA-EU
 Document Ref: Hungarian case study 2, Veszprém county

 Iteration ID: “hypothetical” woody crops for CHP (gasification) on contaminated
 land

 Author: Peter Gyuris, Project Manager
 Date: 2021-06-14

1 Introduction
1.1 Background
 This document provides the background for the testing activities within iteration Hungarian
 case study 2, Veszprém county through the testing of “hypothetical” woody crops for CHP
 (gasification) on contaminated land” scenario.
 We are testing the selected scenario based on the crop suitability summed up in D41.
 The Biomass Processing Plant must be established in the webGIS tool, on the map, because no
 such facility (CHP) known to be existent in the region.

1.2 References
 Bioplat-EU project deliverable D4.1.
 Please note, we do consider that the contaminated land layer and the production logic of
 this layer, produced by Joanneum Researh for this project, inside Hungary’s country
 border are not correct. These lands are not contaminated in reality. In fact, they are
 productive lands (recreation, arable lands, forests, etc.). We only use the layer to test the
 tool, but not for suggesting this is really “available” land. These lands can not be used for
 bioenergy projects in reality.

2 Overview
The Iteration Hungarian case study 2, Veszprém county “hypothetical” woody crops for CHP
(gasification) on contaminated land” scenario for the testing of the WebGIS in the context of Task 4.2

 25
of the BIOPLAT-EU project was begun on June 14th, 2021 at 17:00 pm and completed on June 14th ,
2021 at 17:45 pm. During this testing the following sections of the WebGIS platform were considered:
Layers menu, STEN tool, Info Panels, Value Chain Data Box, Advanced Indicators, Results panel.
The testing was conducted on a Dell notebook (10th gen. i5 proc.) with 16Gbytes of memory running
Microsoft Windows 10 Professional, a mobile 3g connection (Vodafone HU). Browser used is Firefox.

3 Variances
N/A

4 Assessment
Quick zoom function was used to zoom to Veszprém county then “contaminated land” layer was
selected. HU. Field name “HU21325803HU00000270” was chosen for further work (1240 ha).
Contaminated land layer was used.
The assessment was straightforward selecting the agronomic variables (rainfed, high crop management
practices) for poplar.
The CHP processing plant (value chain) was suggested by WP4 leader.
We have set the BPP on the map more or less into the middle of the county, 54kms away, from the
BPS.
Then accepted the value chain and went to the value chain data box.
No changes in the value chain data box have been issued.

5 Results
Test Case Hungarian case study 2, Veszprém county “hypothetical” woody crops for CHP (gasification)
on contaminated land”, was carried out with great ease. The web application responded swiftly to user’s
inputs.
Sometimes odd category names (see below chapter 6.) lead to unclear interpretation of simulation
results.
Final figures and the layout of the simulation results can be read with no problem.
This part of the online report is not displayed in the report PDF.

 26
6 Evaluation
This section provides an overall evaluation of the testing process including problems and limitations.
Bioenergy production “LHV of FSTK” records could not be understood, looked odd without
explanation.
On the Energy access tab “Number of HH benefiting from electricity” could not be understood without
explanation.
If we want to switch between rainfed or irrigated water supply, high or low practices then suitability and
yield information disappears and can’t be read.

7 Summary of Activities
This section provides a summary of the major testing activities and events for the test performed for
Hungarian case study 2, Veszprém county through the testing of “hypothetical” woody crops for CHP
(gasification) on contaminated land”.
 Test Start Date: June 14th 2021, @17:00 pm Test End Date: June 14th 2021, @ 17:45
 pm
 Item Planned Actual
 Staff Levels 1 1
 Test Design Effort 1 2
 Test Execution Effort 1 each 2 each
 Re-Test Effort 1 1
 Overall test evaluation Positive Positive
 Expected malfunctioning NO YES

 27
Critical malfunctioning NO NO
Overall testing result accuracy Good Fair
Inaccuracy attributable to: Data Data
Layers quality MUC lands: high MUC lands: low
 Suitability: High Suitability: medium
 BPPs: High BPPs: High
Etc. feel free to add other summary
categories as you see fit

 28
Test Summary Report

 Test Information
 Project ID: BIOPLA-EU
 Document Ref: Hungarian case study 2, Veszprém county
 Iteration ID: Sunflower for biodiesel on UU land
 Author: Peter Gyuris, Project Manager
 Date: 2021-06-14

1 Introduction
1.1 Background
 This document provides the background for the testing activities within iteration Hungarian
 case study 2, Veszprém county through the testing of “Sunflower for biodiesel on UU land”
 scenario.
 We are testing the selected scenario based on the land availability and crop suitability summed
 up in D4.1. The available BPP (Rossi Biofuel) from near the case study region was suggested
 by the webGIS tool. In D4.1 we did not indicate this conversion technology.

1.2 References
 Bioplat-EU project deliverable D4.1.

2 Overview
The Iteration Hungarian case study 2, Veszprém county “Sunflower for biodiesel on UU land” scenario
for the testing of the WebGIS in the context of Task 4.2 of the BIOPLAT-EU project was begun on June
7th 2021 at 13:43 pm and completed on June 14th , 2021 at 16:00 pm. During this testing the following
sections of the WebGIS platform were considered: Layers menu, STEN tool, Info Panels, Value Chain
Data Box, Advanced Indicators, Results panel.
The testing was conducted on a Dell notebook (10th gen. i5 proc.) with 16Gbytes of memory running
Microsoft Windows 10 Professional, a mobile 3g connection (Vodafone HU). Browser used is Firefox.
3 Variances
N/A

4 Assessment
Quick zoom function was used to zoom to a field near Gyulafirátót, HU. Field ID
 HU21311767HU00002017 was chosen for further work (184.34 ha).

 29
The assessment was straightforward selecting the agronomic variables (rainfed, high crop management
practices) for the crop sunflower. Suitability (77%) and yield (3.1 tons) looked good to follow with
this feedstock.
Then choosing the bioenergy pathway offered by the system looked okay for the biodiesel BPP near
the case study area.
This biodiesel processing plant (value chain) wasn’t considered in D4.1.
Crushing and distributor distances stayed default (100kms).
No changes in the value chain data box has been issued.

5 Results
Test Case Hungarian case study 2, Veszprém county “Sunflower for biodiesel on UU land”, was carried
out with great ease. The web application responded swiftly to user’s inputs.
Sometimes odd category names (see below chapter 6.) lead to unclear interpretation of simulation
results.
Final figures and the layout of the simulation results can be read with no problem.

6 Evaluation
This section provides an overall evaluation of the testing process including problems and limitations.
In the value chain data box the biomass production site (municipalities affected) was not displayed.
Bioenergy production “LHV of FSTK” records could not be understood, looked odd without
explanation.
On the Energy access tab “Number of HH benefiting from electricity” could not be understood without
explanation.
In the test results report the bars (“Comparison with Fossil Fuel (Petrol)”) among standard indicators
are not displayed in the exported PDF.
The Hungarian translation (text) in the tool needs a very strong revision as expressions are cautious and
they are very much meaningless.

7 Summary of Activities
 3.2.1.1.1 This section provides a summary of the major testing activities and events for
 the test performed for Hungarian case study 2, Veszprém county through the testing of
 “Sunflower for biodiesel on UU land”.
 3.2.1.1.2 For Example:
 Test Start Date: June 14th 2021, @13:43 pm Test End Date: June 14th 2021, @ 16:00
 pm
 Item Planned Actual

 30
Staff Levels 1 1
Test Design Effort 1 1
Test Execution Effort 2 each 2 each
Re-Test Effort 1 1
Overall test evaluation Positive Positive
Expected malfunctioning NO NO
Critical malfunctioning NO NO
Overall testing result accuracy Good Fair
Inaccuracy attributable to: Data Data
Layers quality MUC lands: high MUC lands: low
 Suitability: High Suitability: medium
 BPPs: High BPPs: High
Etc. feel free to add other summary
categories as you see fit

 31
3.3 Italy

 Test Summary Report

 Test Information
 Project ID: BIOPLA-EU
 Document Ref: Case Study 1, Sulcis Region, Italy
 Iteration ID: A) Wheat for biogas
 Author: Giuseppe Pulighe – CREA Research Centre for Agricultural Policies
 and Bioeconomy
 Date: 04-06-2021

1 Introduction
1.1 Background
 This document provides the background for the testing activities within iteration in Italy, Case
 Study 1, Sulcis Region through the testing of A) Wheat for biogas scenario. The case study site
 is constituted by 5 municipalities, for a cumulated surface of 35,745 ha. The area is characterized
 by a Mediterranean semi-arid climate, the mean annual rainfall is about 600 mm and the mean
 annual temperature is 16° C. The study area is included in the Sulcis polluted “Site of National
 Interest” (SIN) that includes industrial and mining areas. In the past in this area have been
 performed some field trials with giant reed for evaluating potential yields on different agronomic
 conditions. A biogas CHP plant is present in the study area.

1.2 References
 N/A
2 Overview
 The Iteration in Case Study 1, Sulcis Region, Italy testing of A) Giant reed for biogas scenario
 for the testing of the WebGIS in the context of Task 4.2 of the BIOPLAT-EU project was begun
 on June 4st 2021 at 9:20 am and completed on June 4st 2021 at 11:00 am.
 During this testing all sections of the WebGIS platform were considered in order to evaluate the
 computational capabilities and functionality on different scenarios.
 The testing was conducted on a DELL OptiPlex Intel Core-i7 with 16Gbytes of memory running
 Microsoft Windows 10 Professional, a Wi-Fi broadband connection with results from
 speedtest.net of 12.78 Mbps in download and 0.92 Mbps in upload, Ping 112 ms. Browser used
 is Mozilla Firefox. In the machine was installed a Virtual Private Network.
 Overall, the web-GIS platform worked very well, and no system crashes were experienced. At
 least 4 tests were performed, attempting different iterations on Underutilized Lands and
 32
Contaminated Land (2 for low crop management, 2 for high crop management). For the test
 was selected the CHP biogas Bioenergy pathway as it is the one suggested by the Regional
 Environmental Energy Plan and guidelines for developing new bioenergy projects in Sardinia.
3 Variances
 N/A
4 Assessment
 Tests have been carried out modifying the section “Value Chain data Box”, sub-section Crop
 Information (changing expected Yields, crop evapotranspiration and market price), the section
 Agronomic Information (changing amount of fertilization for nitrogen and phosphorus), as well
 as for the sub-section Transport of Feedstock because the distance calculated from BPS to BPP
 seems incorrect. In all cases the various iterations worked correctly. No changes have been made
 to the sub-section Bioenergy production (e.g. EU market price of bioenergy product) because
 this involves detailed knowledge of current market conditions. During the various iterations, the
 values proposed on the screen for the section “Income” (Operating inputs, Labour) have not
 been modified as they are considered constant or well defined.

5 Results
 Test Case Study 1, Sulcis Region, Italy, A) Wheat for Biogas, was carried out successfully. The
 web application responded quickly to user input, the visualization at screen of the maps was
 clear, and the computation times quite fast. No differences were detected in the Layer Tab when
 selecting the Satellite Imagery vs the Sentinel set of images, making the latter apparently
 superfluous. The selection/deselection and consequent visualization in map of the various layers
 (i.e. contaminated, underutilized) is always very fast. Overall, the table of contents is very
 intuitive even for users not familiar with GIS or web-GIS platforms and data and visualization
 and on-screen display of themes or tables.
6 Evaluation
 This section provides an overall evaluation of the testing process including problems and
 limitations.
 The test Case Study 1, Sulcis Region, Italy, A) Wheat for Biogas, underwent comprehensive
 testing on multiple plots of contaminated and underutilized areas. Regarding the distance from
 BPS to BPP, we noticed that the localization of the CHP biogas plant in the map (near Carbonia
 city) is incorrect as it is located between the mountains, and a photointerpretation of the images
 clearly shows that there is no plant. Consequently, the displayed “Distance from BPS to BPP”
 was adjusted by inserting a shorter path, as a result, the distance to the BPP was changed by
 inserting a shorter path, therefore the STEN was simulated with this value. Overall, the values
 reported by STEN for Standard Indicators and Advanced Indicators seem correct and in line
 with the literature.

7 Summary of Activities
 This section provides a summary of the major testing activities and events for the test performed
 for Case Study 1, Sulcis Region, Italy and A) Wheat for biogas.
 33
You can also read