COVID-19 mortality and long-term care: a UK comparison - LTCcovid.org
←
→
Page content transcription
If your browser does not render page correctly, please read the page content below
COVID-19 mortality and long-term care: a UK
                 comparison
                                      Last updated August 29th 2020

Authors
David Bell (University of Stirling), Adelina Comas-Herrera (Care Policy and Evaluation Centre, London School of
Economics and Political Science), David Henderson (Edinburgh Napier University, Scottish Centre for
Administrative Data Research), Siôn Jones (LE Wales and London Economics) Elizabeth Lemmon (University of
Edinburgh, Edinburgh Health Economics), Mirko Moro (University of Stirling), Siobhán Murphy (Centre for Public
Health, Queens University Belfast), Dermot O’Reilly (Centre for Public Health, Queens University Belfast), Pietro
Patrignani (LE Wales and London Economics)

ltccovid.org
This document is available through the website ltccovid.org, which was set up in March 2020 as a rapidly shared
collection of resources for community and institution-based long-term care responses to Covid-19. The website
is hosted by CPEC at the London School of Economics and Political Science and draws on the resources of the
International Long-Term Care Policy Network.
Corrections and comments are welcome at info@ltccovid.org. This document was last updated on 29 August
2020 and may be subject to revision.
Copyright: © 2020 The Author(s). This is an open-access document distributed under the terms of the Creative
Commons Attribution NonCommercial-NoDerivs 3.0 Unported International License (CC BY-NC-ND 3.0), which
permits unrestricted use, distribution, and reproduction in any medium, provided the original author and source
are credited. See http://creativecommons.org/licenses/by-nc-nd/3.0/.
Code repository:
R code used to create graphs and calculations are available from this link.
Suggested citation
Bell D, Comas-Herrera A, Henderson D, Jones S, Lemmon E, Moro M, Murphy S, O’Reilly D and Patrignani P
(2020) COVID-19 mortality and long-term care: a UK comparison. Article in LTCcovid.org, International Long-
Term Care Policy Network, CPEC-LSE, August 2020

 ltccovid.org | COVID-19 mortality and long-term care: a UK comparison                                              1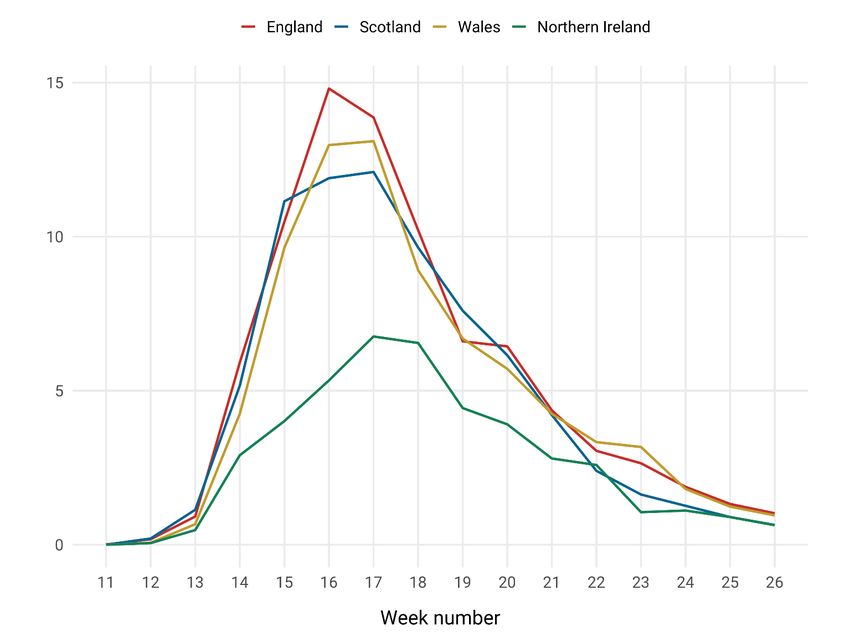
Executive Summary
The impact of the COVID-19 pandemic on the oldest old, especially those within care home
settings, has been devastating in many countries. The UK was no exception. This article reviews
the path of the COVID-19 pandemic across the UK long-term care (LTC) sector, indicating how it
evolved in each of the four home nations. It prefaces this with a description of LTC across the
UK, its history and the difficulties encountered in establishing a satisfactory policy for the care
of frail older people across the home nations.
The paper makes several contributions. First, it provides an up to date estimate of the size of
the adult care home sector across the UK – previous work has been bedevilled by inaccurate
estimates of the number of care home places available. It also assembles the limited
information that is available on delayed transfers of care and testing of care home residents,
both of which played a role in the evolution and consequences of the pandemic. Its most
important contributions are estimates of the number and share (the P-Score) of "excess
deaths" in care homes in each of the home nations. The P-Scores provide measures that allow
comparisons across care home populations of different size. Not only do we discuss the
number of individuals affected, we also compare the proportions of care homes in each of the
home nations that experienced a COVID-19 infection. The paper also discusses deaths of care
home residents outside care homes, largely in hospitals. It reviews the sparse information on
deaths at home of people who were receiving social care.
Throughout our narrative, it will become clear that there have been major deficiencies in both
the amount and the consistency of data available to clinicians, care sector staff and researchers
trying to understand and to alleviate what has happened in care homes. Thus, the final section
makes some recommendations about the scope and timeliness of relevant data. Collection of
such data would seem to be a necessary condition to inform best practice and thus avoid a
repeat of the troubling effects of the pandemic on people who use formal care between March
and June 2020.

Main findings:
Size of the UK care home sector
To correct widespread misreporting of the size of the UK care home sector, we collected
information from each of the four home nation care regulators. This gave us estimates of the
number of care homes and allowed us to estimate the number of care home residents.

        • In total, there are 18,075 care homes for adults across the UK. The most recent
          regulatory reports show 15,481 care homes in England, 481 in Northern Ireland, 1,057 in
          Scotland and 1,056 in Wales. We estimate that at the beginning of the pandemic period,
          there were around 500,598 adult care home residents across the UK. Of these, 425,408
          were in England, 14,935 in Northern Ireland, 35,989 in Scotland and 23,766 in Wales. 1

1   See Table 1 for sources.

     ltccovid.org | COVID-19 mortality and long-term care: a UK comparison                        2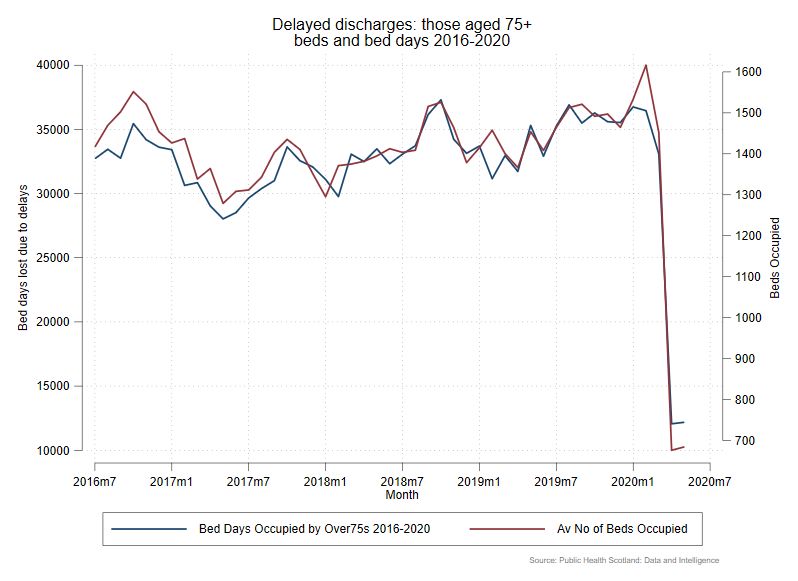
• There are significant differences in the numbers of care home residents per thousand
      adults and per thousand older populations across the home nations. These reflect
      differences in the demography and prevalence of disability at different ages. They also
      reflect policy differences around the "balance of care" - the extent to which policy is
      supportive of care home provision relative to domiciliary care or other accommodation
      solutions.
UK COVID-19 related deaths of care home residents
Across the UK, COVID-19 mortality data are broadly comparable. All four nations use the
emergency ICD-10 codes for recording COVID-19 related deaths and publish these data weekly
on their respective statistical authority websites. Some, but not all, of these reports provide a
breakdown of deaths by location of death (care home, hospital and other), both current and
historic. Nevertheless, we were able to assemble comparable data on deaths in care homes for
each of the home nations and on the number and share of care homes where an infection took
place. We also collected some limited data on deaths of care home residents outside care
homes.
    • We define the pandemic period from the registration of the first COVID-19 related death
        during week 11 (ending 13th March) in England up until week 26 (ending 26th June).
        There are slight differences in the recording of weeks by the nations and it is important
        to note that each country may have entered the pandemic at different times, and this
        may affect estimates of excess deaths and P-Scores.

   •   Throughout this period, 54,510 COVID-19 related deaths were registered in the UK,
       across all age groups and all locations of death. There were significant differences in
       COVID-19 related deaths per 100,000 individuals across the UK. These were highest in
       England, at 84 deaths per 100,000. Northern Ireland’s were lowest at 44 per 100,000. In
       Wales and Scotland, by week 26, deaths per 100,000 individuals stood at 77 and 76
       respectively.

   •   Of all deaths registered as COVID-19 related in the UK, 17,127 (31%) occurred within
       care homes and at least 21,775 (40%) were accounted for by care home residents. There
       were differences across the UK. In Scotland, 47% of deaths attributed to COVID-19
       occurred in care homes. This compares with 42% in Northern Ireland, 30% in England
       and 28% in Wales. In terms of deaths accounted for by care home residents, once again
       there are differences between the home nations. In Northern Ireland, care home
       residents accounted for 51% of all COVID-19 related deaths, compared to 50% in
       Scotland, 50%, 39% in England and 34% in Wales.

   •   Data on the share of care homes reporting at least one case of suspected or confirmed
       COVID-19 in Scotland show that 65% of all care homes reported cases. This is compared
       to 44% of all adult care homes in England, 37% in Northern Ireland and 33% in Wales
       reporting confirmed or suspected COVID-19 cases. It appears that Scotland had the
       largest share of affected care homes, though some care must be taken with this

  ltccovid.org | COVID-19 mortality and long-term care: a UK comparison                         3
conclusion given that it is not clear that all of the home nations use the same definition
of an outbreak.
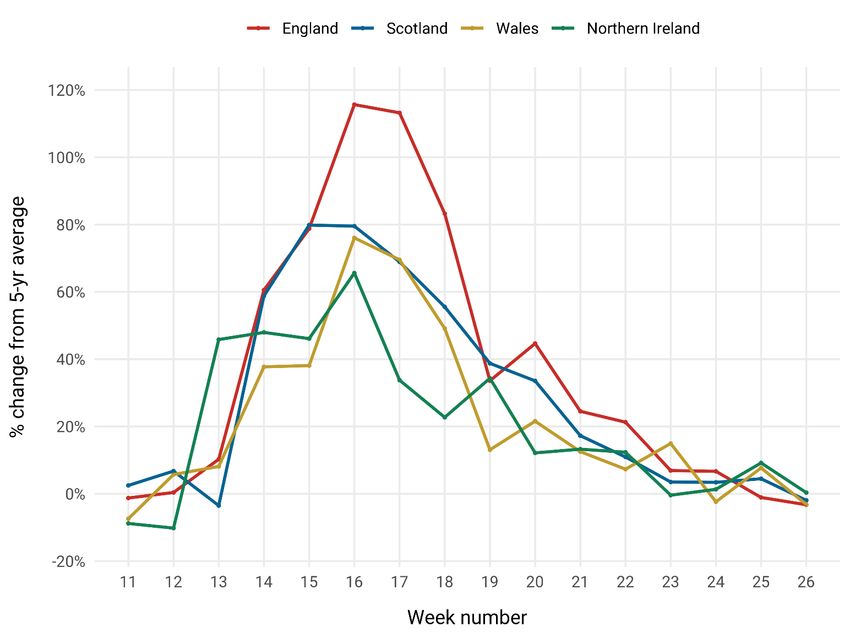
Excess deaths during the pandemic period
Excess deaths are those deaths in excess of some measure of average or normal deaths over
some comparable historic period. For deaths in care homes, we used average weekly deaths
during the previous 5-year period. The absolute numbers of excess deaths were transformed to
P-Scores by expressing excess deaths as the percentage increase over average historic deaths.
This allows meaningful comparison between areas that differ substantially by size of population
and record COVID-19 related deaths in different ways.
• Using this measure, we find that over our defined pandemic period England had a 38%
increase in mortality compared with 29% in Scotland, 22% in Wales, and 20% in
Northern Ireland. Breaking this figure down by location of death reveals a 79% increase
in mortality over the pandemic period in English care homes compared to 62% in
Scotland, 66% in Wales, and 46% in Northern Ireland. Thus, although Scotland had the
highest proportion of care homes infected and the highest proportion of deaths
attributed to COVID-19 in care homes, it had a lower proportion of excess deaths in care
homes than in England or Wales. This may reflect differences in testing practices and
death registrations across the nations. Northern Ireland had both the lowest share of
care homes infected and the lowest level of excess deaths in care homes.
• Given that, due to the variation in testing procedures and recording of deaths, it will
never be possible to unequivocally assign care home deaths during the pandemic to
COVID-19 or other causes, the judgement on relative failure or success in handling the
pandemic in care homes must ultimately rest with comparative performance in relation
to excess deaths. This internationally recognised approach deals both with
misdiagnosed deaths and also deaths that have other immediate causes, but which
would not have occurred in the absence of the pandemic. By this measure, Scotland,
Wales, and particularly England appear to have performed poorly.
Relative impact of the COVID-19 pandemic on the care home population
As the share of adults living in care homes varies between the four nations, comparing the
number of deaths of care home residents registered as involving COVID-19 and of excess deaths
to the numbers of people living in care homes can show the relative impact of the COVID-19
pandemic among the care home population in the four nations.
• We find that, in terms of deaths registered as involving COVID-19, during our defined
pandemic period, deaths of care home residents in the UK represented just over 4% of
all care home beds (ranging from 2.6% in Northern Ireland to 5.4% in Scotland). In terms
of excess deaths in care homes (and, due to lack of historical data, not including deaths
of care home residents in hospital), these represented nearly 5.5% of care home beds in
the UK. The share of residents who died would be higher.
ltccovid.org | COVID-19 mortality and long-term care: a UK comparison 4Testing strategy in UK care homes
The testing strategy has been characterised by dramatic changes and has followed a similar
pattern across all the four nations. Initially, testing was limited to a few residents with
symptoms. The focus moved towards testing people discharged from hospitals to care homes
and symptomatic staff in mid-April. More recently testing guidelines have been recognising the
role played by asymptomatic transmission by both residents and staff. The four nations are all
currently committed to regular testing and retesting collected on site. Doubts remain about the
implementation of this ambitious strategy, given reports of limited testing capacity and data
gaps across the four nations. Alternative approaches based on the rate of infection in the local
area and adoption of innovative strategies such as pool testing and saliva-based testing kits
should be considered.
Mortality among people using care at home
England is the only UK nation that has released COVID-19 mortality data on those receiving care
at home. That data show that throughout the pandemic period there were a large number of
excess deaths in the domiciliary setting. The majority of which were not recorded as being
COVID-19 related. Overall, the English data demonstrate that, compared to care homes, the
overall proportional increase in deaths was greater in the domiciliary setting 2.
Data limitations
Several data gaps limit our ability to offer a full account of the impact of COVID-19 within the
LTC system. Most notable are the gaps surrounding care at home including data on unpaid
carers and individuals’ choices over purchasing care; accurate and timely data on transfers of
patients from hospital and into care homes; reliable data on testing of residents and staff and
infection rates in the care home local area; care home level COVID-19 related mortality data.
Going forward, the urgency of the need to invest more resources into the collection of social
care data and statistics has never been more apparent. Acting on the key messages and
recommendations set out by the Office for Statistical Regulation (OSR) in their reports into
adult social care statistics provides a starting point to prepare and ensure the devastating
impact of COVID-19 in the care sector is not repeated.
About this report:
We attempt to present comparable data and statistics on the effect of COVID-19 within long-
term care (LTC) settings in the UK, with a particular focus on care homes. We begin in Section 1
by providing a background to LTC policy and provision in the UK. In Section 2 we outline the
ways each of the UK nations records COVID-19 mortality and the data sources for each. Further,
we highlight the additional sources of mortality data on care home residents that are
comparable across the four nations. These data sources inform our analysis in the subsequent
sections. In Section 3, we describe the path of the pandemic throughout the UK, presenting
2 Hodgson et al, 2020. Briefing: Adult social care and COVID-19 Assessing the impact on social care users and staff in England so
far. Available here.
ltccovid.org | COVID-19 mortality and long-term care: a UK comparison 5data on COVID-19 mortality and the impact of COVID-19 within care homes. In Section 4, we
present data on excess mortality - as one of the key metrics to assess the mortality impact of
the pandemic and to make robust comparisons between countries - across the UK and by
location of death. Section 5 highlights the testing regimes and their evolution. Section 6
comments on the impact of COVID-19 within the care at home setting. Finally, Section 7
discusses the findings and concludes.
1. Long-term care in the UK: Background
Deaths among people who use formal long-term care services, particularly residential or
nursing home care in the UK substantially increased during the COVID-19 pandemic with the
increase occurring in each of the UK’s four constituent nations. Additional deaths among people
living in care homes have been a common and troubling feature of the pandemic across the
world 3, 4. The main focus of this paper is on COVID-19-related care home deaths, how they
evolved in each of the four home nations during the pandemic, and why they were so difficult
to deal with. It also raises important and disturbing questions about the availability and
comparability of data relating to care homes and their clients across the UK. The paper also
discusses deaths among those receiving social care at home: here the information is even more
scant and therefore our ability to draw conclusions is weaker.
To set the context for the review, we begin with a short history of the care home sector across
the UK. Although there are common roots, devolution has led to some divergence in the
structure and regulation of care homes in different parts of the UK.
1.1. What is long-term care?
Long-term care (LTC) encompasses a wide range of services and activities. The World Health
Organizations defines long-term care as services to ensure that people with or at significant loss
of physical and mental capacity can maintain a level of functional ability consistent with their
basic rights, fundamental freedoms and human dignity 5. Most LTC in the UK is provided by
families and other unpaid carers, and, while some long-term care is provided by the public
health care systems, most formal long-term care is considered “social care” provision. In the
UK, such care is provided across different accommodation settings. For older people, care
3 See: Comas-Herrera A, Zalakaín J, Litwin C, Hsu AT, Lemmon E, Henderson D and Fernández J-L (2020) Mortality associated
with COVID-19 outbreaks in care homes: early international evidence. Article in LTCcovid.org, International Long-Term Care
Policy Network, CPEC-LSE, 26 June 2020.
4 Salcher-Konrad M, Jhass A, Naci H, Tan M, El-Tawil Y, Comas-Herrera A. COVID-19 related mortality and spread of disease in
long-term care: a living systematic review of emerging evidence. medRxiv. 2020. doi:10.1101/2020.06.09.20125237.
5 https://www.who.int/ageing/events/world-report-2015-
launch/en/#:~:text=30%20September%202015%20%2D%20Comprehensive%20public,population%20ageing%20is%20urgently
%20needed.&text=The%20World%20report%20on%20ageing,new%20concept%20of%20functional%20ability.
ltccovid.org | COVID-19 mortality and long-term care: a UK comparison 6homes are the largest of the institutional settings providing LTC, though more individuals
receive LTC in their own home 6.
Care homes in the UK are mostly classed as either residential or nursing homes. Residential care
homes provide accommodation and help with personal care tasks such as washing, dressing
and toileting. Nursing care homes also provide accommodation and personal care with the
addition of 24-hour nursing care on hand. This type of care is provided to people with severe
physical, cognitive or learning disabilities, as well as those with complex medical conditions that
require care from a qualified nurse. The majority of care home residents (but not all) are older
people, a high proportion of whom have dementia 7. Some care homes provide both nursing
and residential care.8
Home care encompasses any care provided within a person’s own home. This can include home
adaptations for example stair lifts and handrails, meals services and telecare services like
personal alarms. Home care also includes domiciliary care or home help, which is help from a
professional carer who comes into the home to help with tasks such as cleaning, doing the
washing up and laundry and gardening etc. Home care also includes personal care at home,
that is, help with personal care tasks such as washing, dressing and toileting. Other care
services provided in the community include day care, and other services that people who opt
for cash payments may contract, for example personal assistants.
1.2. Provision and funding of long-term care in the UK
The institutional structures that support social care across the UK have common historical roots
dating back to the role of local parishes in providing relief to the destitute through the various
Poor Laws across the UK 9. Parish councils took responsibility for supporting those for whom
unpaid or paid care was not available or suitable. Local authorities replaced parishes as the
lowest level of government during the 20th century, inheriting their role in providing social care.
Increased life expectancy in the UK has been accompanied by more chronic disease, long-term
conditions and disabilities that particularly affect older people, many of whom have limited
access to unpaid care 10,11. Thus, LTC for older people has become increasingly important as a
share of social care provision across the four nations of the UK.
The major contrast between health care and social care provision in the UK is that the former is
provided free at the point of delivery, while the latter is means and needs tested. Thus,
throughout the UK, health services are provided free of charge by the NHS. However, aside
from school education, local authorities generally charge for the services they provide. Long-
term care is no exception. Charges are qualified by a means test: they are waived if individuals’
6 Kings Fund, 2018. Approaches to Social Care Funding. Available here.
7 https://ltccovid.org/2020/06/01/updated-report-the-impact-of-the-covid-19-pandemic-on-people-living-with-dementia-in-uk/
8 NHS, Social Care Support Guide, 2020. Available here.
9 Abel-Smith, B. (1964). The hospitals, 1800-1948: a study in social administration in England and Wales. London: Heinemann.
10 Kingston A, Comas-Herrera A and Jagger C, for the MODEM project (2018) Forecasting the care needs of the older population
in England over the next 20 years: estimates from the Population Ageing and Care Simulation (PACSim) modelling study. Lancet
Public Health (3): e447–55.
11 Shaw M, Dorling D. Who cares in England and Wales? The Positive Care Law: cross-sectional study, Br J Gen Practice 2004; 54:
899-903
ltccovid.org | COVID-19 mortality and long-term care: a UK comparison 7assets fall below pre-specified levels. These means tests are particularly relevant for care
homes.
Currently in England, those with assets in excess of £23,250 are expected to pay the full cost of
their care: those with assets below £14,250 will have all of their costs covered by the local
authority, while those with assets between these limits are required to make some contribution
to their care home costs. Broadly similar capital limits apply in Scotland and Northern Ireland.
The Welsh Government has been increasing the capital limit over time and in Wales it now
stands at £50,000 – around double the limit in the rest of the UK. There is no lower capital limit
in Wales – users with assets worth less than £50,000 contribute to costs according to their
income. Those on the lowest income do not have to contribute at all.
Individuals with housing assets will almost certainly exceed the capital limit in all four nations.
Around 65% of all UK adults are owner occupiers and the share is higher among older adults
who have more time to increase their housing equity. Therefore, many individuals will be
required to pay care home charges which has the effect of rapidly depleting their wealth. For
example, weekly care home charges in England are around £655 per week without nursing care,
and £937 per week with nursing care. 12. Where these charges are incurred over a prolonged
period they are referred to as “catastrophic” care costs and are thought to affect approximately
1 in 10 adults over the age of 65 in England 13. There is some evidence that owner occupiers are
more resistant to care home admission, other things being equal, perhaps because of a desire
to retain or pass on their wealth 14.
1.3. Divergence of the devolved governments
Although there are common historical roots and though funding mechanisms are broadly
similar, structures for supporting LTC have diverged since the establishment of devolved
governments in Scotland, Wales and Northern Ireland in 1998. The establishment of these
institutions almost coincided with the 1999 report of the Royal Commission on Long-Term
Care 15. It had been established “to examine the short- and long-term options for a sustainable
system of funding of LTC for elderly people, both in their own homes and in other settings”.
One of its main recommendations was that nursing and personal care - bathing, showering,
dressing toileting etc. - should no longer be charged for.
While the recommendation that nursing care should be free of charge was adopted throughout
the UK, free personal care was only implemented in Scotland, with all-party support even
though it was understood to be expensive. Its supporters argued that if health care costs of
people with cancer are provided free by the NHS, then so too should be the care costs
associated with dementia. In Scottish care homes, the weekly allowance to cover personal care
12 See: https://www.which.co.uk/later-life-care/financing-care/care-home-finance/care-home-fees-akdbv8k3kwln
13 See: https://webarchive.nationalarchives.gov.uk/20130221121534/http:/www.dilnotcommission.dh.gov.uk/our-report/
14 McCann M, Grundy E, O'Reilly D. Why is housing tenure associated with a lower risk of admission to a nursing or residential
home? Wealth, health and the incentive to keep ‘my home’. JECH 10.1136/jech-2011-200315
15 See: https://webarchive.nationalarchives.gov.uk/20131205101144/http://www.archive.official-
documents.co.uk/document/cm41/4192/4192.htm
ltccovid.org | COVID-19 mortality and long-term care: a UK comparison 8costs is £180 per week in 2020/21. The real value of these payments declined by 16 per cent
between 2002 and 2019 16.
There have been several reviews of the system for funding LTC in England - Wanless 17, Dilnot 18
and Barker 19 - each suggested plausible mechanisms for limiting catastrophic care costs. But the
failure to establish a political consensus has prevented progress. A manifesto proposal to
increase the capital limit to £100,000 became a poisoned chalice for Prime Minister Teresa May
in the 2017 election. It was dubbed a “dementia tax” by Labour and the media and arguably
cost the Conservatives their parliamentary majority. She also promised a “green paper” to
outline government proposals for the reform of social care funding in England. At the time of
writing, mid-2020, that Green Paper has yet to be delivered.
Care home residents may receive cash payments to offset their costs through the Department
for Work and Pensions, a UK ministry. Its remit does not carry through to Northern Ireland, but
the system there is essentially the same as in the rest of the UK. For example, Attendance
Allowance is a benefit paid to those aged 65+ to help with their costs if their disability is severe
enough that they need care. It is currently worth £89.15 per week. However, it is not payable to
care home residents in Scotland because the free personal care policy was deemed by DWP to
violate its eligibility rules.
1.4. Austerity measures and care homes
The austerity policy introduced by the UK government in 2010 following the financial crisis had
a severe effect on care home funding. Local authorities in the UK have very limited tax raising
powers and are therefore highly reliant on grants from the UK government in the case of
England, and from the devolved parliaments in Scotland and Wales. The position in Northern
Ireland differs because social care is arranged by five Health and Social Care Trusts which
provide integrated health and social care services.
Between 2009-10 and 2014-15, the real value of government grants to local authorities in
England was cut by one third 20. Adult social care currently accounts for around one sixth of
total local authority spending in England 21. Hence, austerity inevitably caused local authorities
to seek ways of reducing their adult social care budget. Given that a substantial share of care
home residents do not have sufficient assets to contribute to their care home costs, the local
authorities who purchase care on their behalf have considerable care home market power.
During the austerity period, they used this power to drive down care home fees for the
residents that they supported, making the argument that they were prevented from offering
16 Bell, D. and Douglas, E. (2020) Submission to Health and Sport Committee Inquiry into Social Care, accessed at:
https://bit.ly/3184dIO
17 See: https://www.kingsfund.org.uk/publications/securing-good-care-older-people
18 See: https://webarchive.nationalarchives.gov.uk/20130221121534/http:/www.dilnotcommission.dh.gov.uk/our-report/
19 See: https://www.kingsfund.org.uk/publications/new-settlement-health-and-social-care
20 Innes, D., & Tetlow, G. (2015). Delivering fiscal squeeze by cutting local government spending. Fiscal Studies, 36(3), 303-325.
21 See:
https://assets.publishing.service.gov.uk/government/uploads/system/uploads/attachment_data/file/812505/Local_Authority_
Revenue_Expenditure_and_Financing_2019-20_Budget__England.pdf
ltccovid.org | COVID-19 mortality and long-term care: a UK comparison 9better prices by their financial situation. Owners of care homes were forced to cut costs to
survive if they mainly relied on local authority clients for their income. An alternative strategy
would be to recruit more 'self-funders’ - those who pay for their own care. Unlike local
authorities, potential care clients have almost no market power. The Competition and Markets
Authority, which assesses whether markets genuinely support consumer interests, estimated
that care home fees paid by ‘self-funders’ are, on average, 41 per cent higher than those paid
by local authorities for places in the same care homes 22, so effectively self-funders, as well as
paying for their own care, are subsidizing local-authority funded residents.
Austerity also affected public spending in Scotland, Wales and Northern Ireland, since they are
also heavily dependent on funding from the UK Government, through a complex mechanism
known as the Barnett Formula. The devolved parliaments can choose how to spend this
funding. However, the low-risk political strategy is to broadly follow the same spending
patterns as those in England. In consequence, the Scottish and Welsh governments largely
followed the English lead by protecting spending on the NHS, while reducing the funds
allocated to local government. The consequence was downward pressure on social care
spending, not just in England, but throughout the UK. Having said this, Wales may be the
exception where despite downward pressure on spending there have been small real term
increases in social care spending over the last decade 23.
1.5. UK Care Regulators
Each devolved nation has an independent regulatory body that has responsibility for the
inspection of social care services. In England, that is the Care Quality Commission; in Northern
Ireland, the Regulation and Quality Improvement Authority; in Wales the Care Inspectorate
Wales and in Scotland, the Care Inspectorate Scotland.
The Competition and Markets Authority examined the care home market in 2017 suggesting
that consumer interests are not well served by the sector. The system is confusing:
arrangements around choice of home, complaints and contracts are somewhat opaque, often
leading to confusion for clients, potential clients and their relatives. Further, little is known
about levels of satisfaction with care home provision, from either the perspective of the care
clients themselves or their family and friends. Each body collects and openly publishes detailed
information on care homes. This can include information on the location of the home, the types
of services offered, the number of beds available, staffing, care quality and much more.
However, the overlap between these datasets is quite small, meaning that cross-national
comparisons are difficult.
It became clear throughout the pandemic that there was no publicly available up-to-date
estimate of the number of people living in care homes throughout the UK and within the
respective UK jurisdictions. This information would of course be crucial in understanding the
impact of the pandemic within the sector.
22See: https://www.kingsfund.org.uk/audio-video/key-facts-figures-adult-social-care
23See: https://gov.wales/sites/default/files/statistics-and-research/2019-10/local-authority-revenue-and-capital-outturn-
expenditure-april-2018-march-2019-573.pdf
ltccovid.org | COVID-19 mortality and long-term care: a UK comparison 10Table 1 below provides up-to-date, aggregate figures of the number of care homes, number of
available places and estimates of the number of care home residents across the UK, for all adult
care homes and those for older people (i.e. aged 65 and over). For each UK nation, we obtained
these data from their respective independent regulators of social care. We utilise these data to
inform several of our subsequent calculations.
Table 1: Numbers of care homes and residents
England 24 Northern Scotland 26 Wales 27 UK
Ireland 25
Number of adult care homes 15,481 481 1,057 1,056 18,075
Number of care homes for older 10,894 392 805 643 (2018) 12,734
people
Number of beds available (all 457,428 16,059 38,614 25,555 537,656
adult care homes)
Number of beds available (care 411,272 14,464 35,320 22,466 483,522
homes for older people) (2018)
Number of care home residents 425,408 14,935 35,989 29 23,766 500,098
(all adult care homes) 28 (2017)
Number of care home residents 382,482 13,452 32,691 31 20,893 449,518
(care homes for older people) 30 (2017)
Number of residents per 1000 41.1 47.5 34.5 35.9 40.4
population aged 65+
Number of residents per 1000 9.4 10.0 7.9 9.2 9.2
population aged 16+
Median number of beds 24 32 33 21 -
available (all adult care homes)
24 Care Quality Commission, July 2020 available here. Where primary CQC inspection category is residential social care and CQC
provider inspection directorate is adult social care. In the case of homes for older people, the CQC service user band of older
people applies.
25 The Regulation and Quality Improvement Authority, July 2020, available here (Residential care homes). Data filtered to
include all nursing homes and residential homes for adults. For older people, categories of care I (older age) and/or DE
(dementia) apply. See categories of care definitions here.
26 Care Inspectorate Scotland, July 2020, available here. Data filtered to include active Care Home Services, to Subtype not
equal to Children & Young People and Service Status. In the case of older people, Subtype equal to older people applies.
27 The authors obtained from Care Inspectorate Wales up to date information on the number of care homes for adults and the
number of beds available within those homes as of 30th July. The latest published data from the Care Inspectorate Wales refer
to 2018 and is available here. Due to a change in the registration process, information on adult care homes in Wales no longer
distinguish between care homes for older adults and care homes for younger adults.
28 Assuming Scotland’s 93% occupancy rate for England, Northern Ireland and Wales.
29 Scottish Care Home Census available here.
30 Assuming Scotland’s 93% occupancy for England, Northern Ireland and Wales.
31 Scottish Care Home Census available here.
ltccovid.org | COVID-19 mortality and long-term care: a UK comparison 11Sources: various as stated in footnotes. All data up to date as of 2020 unless stated otherwise. Table 1 also shows the number of residents per thousand population aged 65+ (because most adult care homes are care homes for older people). It also shows the number of residents thousand population aged 16+ (covering the entire adult care population). These statistics show interesting variations across the UK which reflects the demography and prevalence of disability in each of the home nations and their policy decisions relating to the balance of care between care homes and domiciliary care or other forms of accommodation. Northern Ireland tends to have more care home residents both in terms of its older population and its adult population. Scotland is that the other end of the spectrum with fewer care home residents as a share of its adult and older population than other parts of the UK. This may partly reflect decisions to shift the balance of care towards domiciliary care, particularly after the introduction of free personal care. Wales also has a low number of residents relative to its older population but has a higher share of adult residents (9.2 per thousand population) compared with Scotland (7.9 per thousand population). This reflects relatively high levels of disability among the working age population in Wales. In consequence, its expenditure on this group is relatively high compared with other parts of Great Britain. Figure 1 below shows the size distribution (based on number of beds available) of care homes for adults for each of the four UK nations. The median number of beds in care homes in Scotland and Northern Ireland is higher than in England or Wales. However, the interquartile range (between the 25th and 75th percentile) in each country overlaps, suggesting the differences in distribution of number of care home beds is not statistically significant. ltccovid.org | COVID-19 mortality and long-term care: a UK comparison 12
Figure 1: Distribution of care home size (care homes for all adults)

Source: Care Quality Commission England, Care Inspectorate Scotland, Regulation and Quality Improvement Authority
Northern Ireland and the Care Inspectorate Wales.

2.        Data and recording mortality across the UK nations
2.1. Recording mortality
As a result of the COVID-19 pandemic, the World Health Organisation (WHO) introduced
emergency International Statistical Classification of Diseases and Related Health Problems 10th
Revision (ICD-10) codes to be used for classifying COVID-19 32. Those are ‘U07.1- COVID-19, virus
identified’ and ‘U07.2-COVID-19, virus not identified’. The former is assigned to a disease
diagnosis of COVID-19 confirmed by laboratory testing. The latter is assigned to a clinical or
epidemiological diagnosis of COVID-19 where laboratory confirmation is inconclusive or not
available. Both codes can be used for mortality coding as a cause of death.
In the UK, all four nations use the emergency ICD-10 codes for recording COVID-19 related
deaths. All nations record the total number of deaths based on a confirmed positive COVID-19
laboratory test and usually publish these on their respective government websites. Moreover,

32   Definition here.

     ltccovid.org | COVID-19 mortality and long-term care: a UK comparison                                          13
the Office for National Statistics (ONS), National Records of Scotland (NRS) and the Northern Ireland Statistics and Research Agency (NISRA) publish data on both confirmed and suspected COVID-19 deaths, for England and Wales, Scotland and Northern Ireland respectively. These data include further breakdowns for location of death, age and gender. See Table A in the Appendix for details. 2.2. Mortality data sources In what follows, we provide sources for the main mortality statistics in each of the UK nations and briefly summarise what they contain. An overview of the data is presented in Table A in the appendix. England and Wales The Office for National Statistics (ONS) publishes data on deaths registered weekly in England and in Wales here. These data are published 11 days after the weekends to allow time for processing and registration of deaths. The data contain five-year averages of all deaths separately for England and for Wales. An up to date breakdown of COVID-19 deaths by gender and age using registration date is only available for England and Wales together. However, the ONS also published a breakdown of COVID-19 deaths by age, gender and cause of death for care home residents and the rest of the population for England and for Wales separately, but this data series (available here) currently only covers up until week 24 33. The breakdown of deaths by place of occurrence is available for England and for Wales separately and weekly for Weeks 11 onwards. Total deaths since the start of the year by place of occurrence is given separately for England and for Wales. Weekly data disaggregated by place of occurrence and cause of death (COVID-19 or all causes) for all English and Welsh local authorities (and Welsh Health Boards) are available here for 2020 (from week 1 to the latest available information). Moreover, weekly data on five-year average deaths by place of occurrence for English and Welsh local authorities are available here Northern Ireland The Northern Ireland Statistics and Research Agency (NISRA) publish weekly data on deaths registered in Northern Ireland here. These data include five-year averages of all deaths, a breakdown of COVID-19 deaths by gender and age. COVID-19 deaths by place of occurrence are given from Week 11 onwards. 33 The ONS published data for deaths of care home residents, both COVID-19 and non COVID-19, by place of occurrence (care home, hospital, elsewhere) for England and Wales separately, for the period 2nd March to 12th June (weeks 11 to 24). This data uses the date of occurrence of death rather than the registration of death. The data also present the age breakdown for England and Wales separately, with an aggregated category for children and younger adults (up to the age of 64), while for older people the information is broken down in 5-year categories. This data has been released on 3rd July 2020 and not been updated since. ltccovid.org | COVID-19 mortality and long-term care: a UK comparison 14
For the purposes of this report, NISRA also provided a bespoke extract of deaths historical
deaths by location for weeks 11-26.
Scotland
The National Records of Scotland (NRS) publish weekly data on deaths registered in Scotland
here. Similarly, these data include five-year averages of all deaths, a breakdown of COVID-19
deaths by gender, age and separately by place of occurrence. Unlike the other jurisdictions in
the UK, data on deaths by place of occurrence are available from Week 1 in Scotland.
Moreover, the five-year average mortality data by place of occurrence are also available from
Week 1.
Further, a set of additional spreadsheets is also provided by NRS here. Among them is one that
allows COVID-19 deaths to be broken down by gender, age and place of occurrence. As far as
we are aware, Scotland is also the only UK nation that is providing this breakdown.

2.3. Mortality data on care home residents
It is important to distinguish between deaths that occur within care homes and deaths of care
home residents overall. Whilst many care home residents may die within the care home, some
will die elsewhere, e.g. in hospital, and it is important to make this distinction if we are to
understand the true impact of COVID-19 on care home residents. Below we outline the sources
and describe the data the respective UK nations hold on care home resident deaths.
England
The ONS publishes weekly data on deaths of care home residents, both COVID-19 and non
COVID-19, by place of occurrence (care home, hospital, elsewhere, not stated) for England. This
is available from 11th April (Week 16) here. These data use notifications of death to the CQC.
Also, ONS data on location on death for care home residents occurring between 2nd March and
12th June (weeks 11 to 24) and registered up to 20th June is available here for England.
Wales
Care Inspectorate Wales produces weekly updates 34 covering also location of death for adult
care home residents in Wales with confirmed or suspected COVID-19. The data cover the
period from 1st March 2020 to the latest available week and it is published by the Welsh
Government here. Also, ONS data on location on death for care home residents occurring
between 2nd March and 12th June (weeks 11 to 24) and registered up to 20th June is available
here for Wales.
Northern Ireland
The NISRA weekly data on deaths registered in Northern Ireland also include a table of COVID-
19 deaths of care home residents by place of occurrence (hospital, care home), from Week 11
here (Table 9).
Scotland
In the set of additional spreadsheets, the NRS publish data on deaths of care home residents
involving COVID-19. These data include total COVID-19 deaths up to Week 20, broken down by

34   The updates have been provided every other week since the beginning of August.

     ltccovid.org | COVID-19 mortality and long-term care: a UK comparison                       15
location of death (care home, hospital, home, other institution) with the total number of COVID-19 deaths of people whose usual place of residence was a care home but they died in hospital. Note that, unlike the rest of the UK, these data are published as a cumulative total only and not broken down by weeks. However, since the 27th of May, the Care Inspectorate Scotland is required by the Scottish Government to compile weekly reports on deaths of care home residents, including those occurring in hospital. These weekly counts do not cover the whole period and start from week 22. The figures are disaggregated between confirmed and suspected COVID-19 deaths and other causes. In principle these figures could be compared to NRS data to derive weekly deaths of care home residents by place of occurrence. The weekly data may still differ because of time lags in reporting between the two sources. These reports are updated weekly and can be found here. 2.4. Data on the share of care homes reporting COVID-19 cases England In England, Public Health England have published weekly updates on the share of care homes reporting confirmed or suspected outbreaks of COVID-19 since the 9th March. These data and corresponding report are available here. Wales In Wales, there are no published figures on care homes reporting confirmed or suspected cases of COVID-19. However, Care Inspectorate Wales was able to supply this data upon request (the information covers cases recorded up until 24th July). Northern Ireland In Northern Ireland, the Department for Health provide weekly updates on the number of outbreaks of suspected or confirmed COVID-19 cases in care homes, alongside the total number of care homes with closed cases. An outbreak is defined as there being two or more confirmed or suspected cases in a facility. This data is available in the online dashboard here. Historical data are also available here. Scotland In Scotland, since 11th April, the Scottish Government have published weekly data on the number of adult care homes that have reported at least one case of suspected or probable COVID-19 to the care inspectorate. These data are available in Table 7a of the Trends in Daily COVID-19 data available here. Note that these data include all adult care homes and do not provide a distinction between care homes for older people and other adult care homes. ltccovid.org | COVID-19 mortality and long-term care: a UK comparison 16
3. The Path of the Pandemic in the UK
The first two confirmed cases of COVID-19 in the UK emerged on the 31st January 2020 35.
Following this, confirmed cases across the UK continued to rise and on 5th March, the UK
reported its first COVID-19 fatality 36. As deaths continued to rise, the UK government and the
devolved nations began to introduce restrictions and measures to contain the spread of the
virus and prepare hospitals for a surge in COVID-19 cases. On 23rd March, the whole of the UK
was put in lockdown and the UK Government’s message was “Stay at home. Protect the NHS.
Save lives”. The immediate policy focus was on ensuring that the NHS had sufficient capacity to
deal with an expected surge in critically ill COVID-19 cases. One aim was to ensure only those in
need of urgent medical care occupied hospital beds therefore moving patients for whom this
was not the case to other settings became a high priority.

3.1. COVID-19 mortality across the UK
Deaths from COVID-19 occurred in hospitals and at home as well as in care homes throughout
the pandemic period. We define this period from the first COVID-19 death in the UK, which was
registered in England during week 11 (ending 13th March), through to week 26 (week ending
26th June). Note that in Wales, the first COVID-19 death was registered the following week and
that dates differ slightly for Scotland and Northern Ireland. Specifically, for Scotland, week 11
ends on 15th March and week 26 ends on the 28th June. In Scotland, the first COVID-19 related
death was registered in week 12 (week ending 22nd March). In Northern Ireland, week 11 ends
on the 20th March and week 26 ends on the 3rd July. Similarly to England, Northern Ireland
registered its first COVID-19 related death during week 11.
Overall, we do not expect the differences in these dates to change the conclusions in this
report, but one should bear in mind that each of the UK nations entered the pandemic at
slightly different starting points and follow different conventions in how they number the
weeks of the year. Using different start points for each nation would change some values we
report, but we believe overall trends and figures would not be significantly altered if this were
the case.
Since the first death attributed to COVID-19 during week 11, the number of deaths registered
as COVID-19 related increased rapidly, peaking during week 16 at 9,495 deaths, and then
declined thereafter. Figure 2 below plots the weekly deaths data between weeks 11 and 26.
Total COVID-19 related registered deaths throughout this period were 54,510.

35   https://www.bbc.co.uk/news/health-51325192
36   https://www.bbc.co.uk/news/uk-51759602

     ltccovid.org | COVID-19 mortality and long-term care: a UK comparison                          17
Figure 2: Weekly deaths attributed to COVID-19 in the UK Source: ONS Deaths registered in England and Wales, UK deaths. Available here. In order to compare COVID-19 mortality rates between the UK nations, it is useful to look at deaths per 100,000 population. Figure 3 plots weekly deaths, again through weeks 11 to 26, per 100,000 population, for each of the four nations. For all nations, the beginning of the rapid increase in deaths began during week 13, with England, Wales and Scotland experiencing a steep incline in mortality for at least two weeks. In contrast, deaths in Northern Ireland increased at a much slower rate and weekly deaths per 100,000 remained noticeably lower right up until the final weeks of the pandemic period. In England, weekly deaths peaked during week 16 at 14.8 deaths per 100,000 and this was the highest recorded weekly death rate in the UK throughout the entire pandemic period. In contrast, weekly deaths peaked in the rest of the UK during week 17: 13.1 deaths per 100,000 in Wales, 12.1 deaths per 100,000 in Scotland and just 6.8 deaths per 100,000 in Northern Ireland. Note that these figures do not take into account the age structure of the respective nations, though these structures are similar across the whole UK. ltccovid.org | COVID-19 mortality and long-term care: a UK comparison 18
Figure 3: Weekly deaths attributed to COVID-19 per-100,000 by UK nation

Source: ONS Deaths registered in England and Wales, UK deaths. Available here.

Table 2 displays total deaths per 100,000 over the pandemic period (weeks 11-26) for the
whole of the UK and for the respective jurisdictions. Northern Ireland has notably lower deaths
compared its UK counterparts.

 Table 2: Deaths per 100,000 throughout weeks 11-26
                        England         Northern                     Scotland             Wales               UK
                                         Ireland
 Deaths per                84               44                           76                 77                82
 100,000
Source: ONS Deaths registered in England and Wales, UK deaths. Available here. ONS Mid-year population estimates.
Available here.

3.2. Delayed Transfers of Care
One issue that has been highlighted as a possible contributory factor to the spread of COVID-19
to care homes was the transfer of individuals from hospitals to care homes in the period

  ltccovid.org | COVID-19 mortality and long-term care: a UK comparison                                             19
leading up to the pandemic. This was intended to “protect the NHS” by freeing beds that were
occupied by individuals who were deemed fit for discharge, but for whom no suitable
accommodation was available. The process whereby a bed is occupied by someone deemed fit
to be transferred from an acute hospital to some other setting because of difficulties in
accessing necessary ongoing care, support or accommodation is known as a “delayed transfer
of care”. Extended stays in hospital are generally harmful to patient and staff wellbeing as well
as having negative impacts on service efficiency 37.
Across the UK it is accepted that such delays are not in the interest of the healthcare system
because they reduce patient throughput. In 2016/17 there were 2.3 million delayed transfer
days in England, costing NHS providers around £173m 38. Further, most of these delays are
associated with older people, both because they tend to have more complex needs and
because they are less likely to have ready access to familial care and support.
In Scotland, the terminology used is “delayed discharges”. These are delays in transfers out of
acute hospital settings. This is a narrower definition than that used in England. Delay reasons
such as awaiting further non-acute NHS care - the second largest reason for delayed transfers in
England – are not counted in Scotland because they do not involve a patient being discharged
from hospital.
The home nations have also followed different paths in recording transfers of care during the
pandemic. In England and Wales, delayed transfers of care were not recorded. Transfers of care
data was halted in February 2020 39. The explanation given by NHS statistics was that “Due to
the coronavirus illness (COVID-19) and the need to release capacity across the NHS to support
the response, we paused the collection and publication of some of our official statistics.”
In Scotland, consistent data, based on a monthly census, have been available since July 2016
and continued to be collected during the pandemic. The most recent data from Public Health
Scotland cover the period up to and including May 2020. These show a remarkable reduction in
delayed discharges between February and March 2020, falling from 1,627 to 1,171 during this
period, an overall reduction of 28% (Figure 4). The principal reason for reductions in delayed
discharge, accounting for 98% of the total, was “health and social care reasons”, suggesting that
Scottish Health and Social Partnerships increased the volume of assessments, placements and
care arrangements so that a substantial number of older people whose discharge had been
delayed, could be moved into the community or care homes. This was likely associated with a
desire to remove patients who were potentially vulnerable to COVID-19 away from hospital
settings. Many of the people who were transferred were not tested, which was worrying given
the increasing emergence of evidence on the asymptomatic nature of the virus 40.
37 Rojas-Garcia, A. et al (2017). Impact and experiences of delayed discharge: A mixed-studies systematic review. Health
Expectations 21(1) pp.41-56. https://doi.org/10.1111/hex.12619
38 House of Commons Library (2017) Delayed Transfers of Care in the NHS, Briefing Paper 7415, Alex Bate
39See: https://www.england.nhs.uk/statistics/wp-content/uploads/sites/2/2020/07/COVID-19-and-the-production-of-statistics-
2020-07-07.pdf
40 N.S.N. Graham, C. Junghans and R. Downes et al., SARS-CoV-2 infection, clinical features and outcome of COVID-19 in United
Kingdom nursing homes, Journal of Infection, Available here.
ltccovid.org | COVID-19 mortality and long-term care: a UK comparison 20Figure 4: Delayed Discharges in Scotland 2016-20
Source: Public Health Scotland
The lack of similar statistics for England and Wales is disappointing. However, there is some
qualitative evidence of what happened 41. In mid-March, trusts were urged by NHS England and
NHS Improvement to “discharge all hospital inpatients who are medically fit to leave”. On April
2, UK government guidance specified that “negative tests are not required prior to
transfers/admissions into the care home". This remained the case until April 15 when new
instructions specified that all patients should be tested prior to discharge. There were capacity
problems in carrying out these tests. Difficulties were compounded by the possibility of
asymptomatic individuals being transferred into care homes.
3.3. The impact of COVID-19 within care homes
The emerging data and news from around the world had made it clear that older people,
particularly frail older people with underlying health conditions, were at an increased risk of
death from the virus. In April, worries were becoming apparent in the UK about the impact of
COVID-19 on care homes and care home residents. Many charities and care bodies raised
concerns about deaths of residents and those getting care at home being “airbrushed” out of
41 See: https://fullfact.org/health/coronavirus-care-homes-discharge/
ltccovid.org | COVID-19 mortality and long-term care: a UK comparison 21official figures because reported deaths focussed on those occurring in hospitals42. Others
highlighted the hidden impact of COVID-19 on care homes by looking at average mortality
within care homes in comparison with previous year’s death rates 43.
Fast forward to the end of June and there had been 54,510 deaths recorded as COVID-19
related across the UK. Of those, 17,127 (31%) had occurred within care homes and
approximately 21,775 (40%) were accounted for by care home residents 44.
Understanding the factors that contributed to the devastating impact on care homes is
paramount to designing system changes and policy measures to ensure the UK is prepared to
cope in the event of a second wave or future pandemic. Achieving this is not without its
difficulties. In particular, the recording of data and differences in care systems and practices
across the UK make cross-nation comparisons difficult. Nevertheless, significant learning may
result, from making such comparisons.
3.4. Share of care homes experiencing COVID-19 outbreaks 45
Comparisons of the share of care homes experiencing an outbreak across UK nations is
complicated by the differing definitions of what comprises an “outbreak”. There is no clear
definition provided by authorities in England or Wales. In Scotland, as of the 20th July, 65% of all
adult care homes had reported at least one case of suspected or confirmed COVID-19. Northern
Ireland defines an outbreak as two or more cases in a facility which meet the case definition of
a possible or confirmed case of COVID-19, within a 14 day period among either residents or
staff in the care home”. Using this definition, 37% of care homes in Northern Ireland were
deemed to have been infected 46. In England, between 9th March and the 19th July, Public
Health England reported that 44% of all adult care homes had reported at least one case of
COVID-19 47 without defining what constitutes an outbreak. Similarly, in Wales, the definition of
an outbreak has not been released by Care Inspectorate Wales. Only 33% of care homes in
Wales have been reported as experiencing an outbreak48
It is also worth pointing out that the shares reported here use ‘all adult care homes’ in the
denominator as opposed to those care homes for older adults only. Given that older adults are
at higher risk of mortality from contracting COVID-19, it is likely that many of the cases
reported occurred in care homes for older adults, in which case the shares may be somewhat
higher. For example, a recent study by Burton et al from 70 Scottish care homes who
42 See: https://www.bbc.co.uk/news/uk-52275823
43 See: https://www.theguardian.com/world/2020/apr/18/uk-care-home-covid-19-deaths-may-be-five-times-government-
estimate
44 See Table 2 for details on sources.
45 In this section, we deviate from our defined pandemic period as not all home nations provide historical weekly figures on the
share of homes affected. For these reasons, we report shares up until the 19th July in England, up until the 20th July in Scotland
and Northern Ireland, and up until 24th July in Wales.
46 Department of Health, COVID-19 in Northern Ireland. 20th July report. Available here.
47 Public Health England, COVID-19: number of outbreaks in care homes - management information .Available here.
48 According to information obtained from Care Inspectorate Wales, 351 adult care homes notified of one or more confirmed
COVID-19 cases up until 12 noon on 24th July
ltccovid.org | COVID-19 mortality and long-term care: a UK comparison 22You can also read