PROGRESS ON DRINKING WATER, SANITATION AND HYGIENE IN SCHOOLS - SPECIAL FOCUS ON COVID-19

Page created by Nathan Stewart
 
CONTINUE READING
PROGRESS ON DRINKING WATER, SANITATION AND HYGIENE IN SCHOOLS - SPECIAL FOCUS ON COVID-19
PROGRESS ON DRINKING WATER,
                      SANITATION AND HYGIENE IN SCHOOLS
                       SPECIAL FOCUS ON COVID-19

WHO/UNICEF JOINT MONITORING PROGRAMME FOR WATER SUPPLY, SANITATION AND HYGIENE

                                                                                 1
PROGRESS ON DRINKING WATER, SANITATION AND HYGIENE IN SCHOOLS - SPECIAL FOCUS ON COVID-19
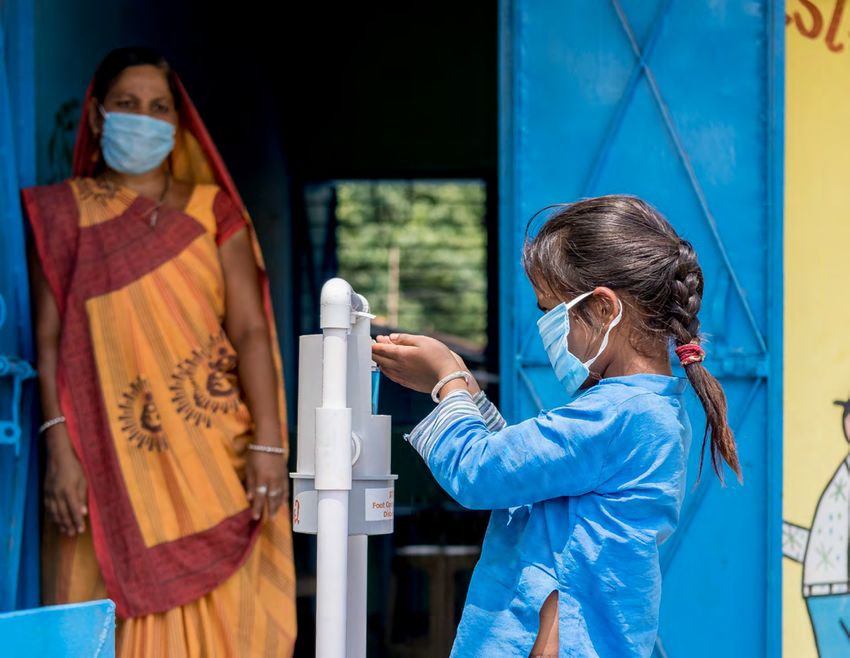
Progress on drinking water, sanitation and hygiene in schools
Special focus on COVID-19

ISBN: 978-92-806-5142-3

© United Nations Children’s Fund (UNICEF) and World Health Organization (WHO), 2020

All rights reserved. Permission is required to reproduce any part of this publication. Requests for permission should be addressed to UNICEF,
Division of Communication, 3 United Nations Plaza, New York 10017, USA (email: nyhqdoc.permit@unicef.org).

Suggested citation. Progress on drinking water, sanitation and hygiene in schools: Special focus on COVID-19. New York: United Nations Children’s Fund
(UNICEF) and World Health Organization (WHO), 2020.

Photographs. Front cover: ©UNICEF/UNI338883/Panjwani; Page 4: ©UNICEF/UN0274934/Panjwani; Page 10: ©UNICEF/UNI338736/Ziavoula;
Page 11: ©UNICEF/UNI330870/Dejongh; Page 12: ©UNICEF/UNI329516; Page 15: ©UNICEF/UNI302788/Ralaivita; Page 16: ©UNICEF/UN0274906/
Panjwani; Page 18: ©UNICEF/UN0248292; Page 21: ©UNICEF/UNI298737/Gumulira; Page 23: © UNICEF/UNI297293/Schermbrucker; Page 25: ©UNICEF/
UN0266999/Raoelison; Page 26: ©UNICEF/UNI138410/Haque; Page 29: ©UNICEF/UNI220750/Kaliyev; Page 30: ©UNICEF/UNI233881/Noorani;
Page 31: ©UNICEF/UN033689/Arcos; Page 32: ©UNICEF/UN0145999/Schermbrucker; Page 34: ©UNICEF/UNI332615/Acosta; Page 35: ©UNICEF/
UNI343180/Choufany; Page 36: ©UNICEF/UN0268450/Brown; Page 37: ©UNICEF/UN0267932/Akhbar Latif; Page 38: ©UNICEF/UNI313272/Matas;
Page 39: © UNICEF/UNI343763/Panjwani; Page 42: ©UNICEF/UN0327738/Ralaivita; Page 43: ©UNICEF/UNI220524/Viet Hung; Page 45: ©UNICEF/
UN059600/Arcos; Page 47: ©UNICEF/UNI147530/Romana; Page 48: ©UNICEF/UNI180045/Colfs; Page 49: ©UNICEF/UNI336264/Ma; Page 50: ©UNICEF/
UN016418/Singh; Page 52: ©UNICEF/UNI139002/Haque; Page 53: ©UNICEF/UNI118251/Noorani; Page 54: ©UNICEF/UNI280341/Dejongh;
Page 55: ©UNICEF/UNI346129/Modola; Page 57: ©UNICEF/UN0208010/Dejongh; Page 60: ©UNICEF/UN0225386/Brown; Page 63: ©UNICEF/UN0267952/
Akhbar Latif; Page 65: ©UNICEF/UNI330871/Dejongh; Page 67: ©UNICEF/UN0311071; Page 86: ©UNICEF/UN0326757

General disclaimers. The designations employed and the presentation of the material in this publication do not imply the expression of any opinion whatsoever
on the part of WHO or UNICEF concerning the legal status of any country, territory, city or area or of its authorities, or concerning the delimitation of its
frontiers or boundaries. Dotted and dashed lines on maps represent approximate border lines for which there may not yet be full agreement.

The mention of specific companies or of certain manufacturers’ products does not imply that they are endorsed or recommended by WHO or UNICEF in
preference to others of a similar nature that are not mentioned. Errors and omissions excepted, the names of proprietary products are distinguished by initial
capital letters.

The figures included in this report have been estimated by the WHO/UNICEF Joint Monitoring Programme for Water Supply, Sanitation and Hygiene
(https://washdata.org) to ensure compatibility; thus, they are not necessarily the official statistics of the concerned country, area or territory, which may use
alternative rigorous methods.

All reasonable precautions have been taken by the World Health Organization and UNICEF to verify the information contained in this publication. However, the
published material is being distributed without warranty of any kind, either expressed or implied. The responsibility for the interpretation and use of the material
lies with the reader. In no event shall the World Health Organization and UNICEF be liable for damages arising from its use.

Edited by Richard Steele. Design, layout and production by Cecilia Silva Venturini. Printed in New York, USA.
PROGRESS ON DRINKING WATER, SANITATION AND HYGIENE IN SCHOOLS - SPECIAL FOCUS ON COVID-19
PROGRESS ON DRINKING WATER,
SANITATION AND HYGIENE IN SCHOOLS
SPECIAL FOCUS ON COVID-19
PROGRESS ON DRINKING WATER, SANITATION AND HYGIENE IN SCHOOLS - SPECIAL FOCUS ON COVID-19
CONTENTS

HIGHLIGHTS ..................................................................................... 6     4. PROGRESS ON HYGIENE IN SCHOOLS .............. 34
Drinking water in schools                                                                      7       Basic hygiene services                                                                    34
Sanitation in schools                                                                          8       Limited hygiene services                                                                  37
Hygiene in schools                                                                             9       No hygiene service                                                                        38

                                                                                                       5. REDUCING INEQUALITIES
1. INTRODUCTION ........................................................................ 10            IN WASH IN SCHOOLS ........................................................ 42
2030 vision for WASH in schools                                                                10
                                                                                                       Inequalities between school levels                                                        46
Accelerating progress in response to COVID-19                                                  11
                                                                                                       Inequalities between urban, rural
Additional indicators for expanded monitoring                                                  14      and sub-national regions                                                                  48
Data sources used for this report                                                              15      Inequalities between school types                                                         51

2. PROGRESS ON DRINKING WATER                                                                          6. PROVIDING SAFE AND INCLUSIVE
IN SCHOOLS ...................................................................................... 16   FACILITIES FOR ALL ............................................................... 54
Basic drinking water services                                                                  16      Providing inclusive WASH services for all students                                        55
Limited drinking water services                                                                20      Safe and effective learning environments
No drinking water service                                                                      22      for all (SDG 4.a)                                                                         61

3. PROGRESS ON SANITATION IN SCHOOLS ............ 26                                                   7. ANNEXES ................................................................................. 66
Basic sanitation services                                                                      26      Annex 1: Methods                                                                          66
Limited sanitation services                                                                    29      Annex 2: Regional groupings                                                               70
No sanitation service                                                                          30      Annex 3: National WASH in schools estimates                                               72
                                                                                                       Annex 4: Regional and global WASH in schools                                              84
                                                                                                       estimates
PROGRESS ON DRINKING WATER, SANITATION AND HYGIENE IN SCHOOLS - SPECIAL FOCUS ON COVID-19
HIGHLIGHTS

    The World Health Organization (WHO) and the                   JMP service ladders for WASH in schools
    United Nations Children’s Fund (UNICEF), through
                                                                    SERVICE LEVEL                     DRINKING WATER                                        SANITATION                                       HYGIENE
    the WHO/UNICEF Joint Monitoring Programme
    (JMP), produce internationally comparable                                                Drinking water from an improved                  Improved sanitation facilities at               Handwashing facilities with water
                                                                                             source and water is available at the             the school that are single-sex and              and soap available at the school
    estimates of progress on drinking water, sanitation              BASIC SERVICE
                                                                                             school at the time of the survey                 usable (available, functional and               at the time of the survey
    and hygiene (WASH) and are responsible for                                                                                                private) at the time of the survey
    monitoring the Sustainable Development Goal
                                                                                             Drinking water from an improved                  Improved sanitation facilities at               Handwashing facilities with water
    (SDG) targets related to WASH. Since the                                                 source but water is unavailable at               the school that are either not                  but no soap available at the
                                                                    LIMITED SERVICE
    establishment of the SDGs, the JMP has published                                         the school at the time of the survey             single-sex or not usable at the                 school at the time of the survey
                                                                                                                                              time of the survey
    global baseline reports on WASH in households
    (2017), WASH in schools (2018) and WASH in                                               Drinking water from an unimproved                Unimproved sanitation facilities                No handwashing facilities or no
    health care facilities (2019), and a progress update              NO SERVICE             source or no water source at the                 or no sanitation facilities at the              water available at the school
                                                                                             school                                           school
    on households (2019). This report presents
    updated national, regional and global estimates               FIGURE 1     JMP service ladders for global monitoring of WASH in schools
    for WASH in schools up to the year 2019, with
    a special focus on the implications for ensuring
    the safety of students and school staff during the                   BOX 1      WASH and COVID-19 infection prevention and control in schools
    coronavirus disease 2019 (COVID-19) pandemic.
                                                                         The COVID-19 pandemic highlights the need to accelerate progress on WASH in schools
    The JMP uses service ladders to benchmark and
                                                                         Global school closures in response to the COVID-19 pandemic present an unprecedented risk to children’s
    compare progress across countries on WASH                            education and wellbeing. Prolonged closures will have negative impacts on learning outcomes and disrupt
    in schools (Figure 1). These service ladders are                     school-based services essential for the nutrition, health, welfare and protection of vulnerable children. WHO and
    designed to track progress towards a basic level                     UNICEF guidelines on COVID-19 infection prevention and control in schools identify a range of measures that
    of service, which is the indicator used for global                   need to be in place for schools to reopen and operate safely (Box 2). They emphasize the importance of hygiene
                                                                         for reducing transmission and recommend all schools enforce regular handwashing, ensure daily disinfection and
    monitoring of SDG targets related to WASH in
                                                                         cleaning of surfaces, provide basic water, sanitation and waste management facilities, and follow appropriate
    schools. This report also highlights additional                      environmental cleaning and decontamination procedures. However, in the 60 countries identified as having the
    indicators that have been used for national                          highest risk1 of health and humanitarian crisis due to COVID-19, one in two schools lacked basic water and
    monitoring of WASH in schools and identifies those                   sanitation services and three in four lacked basic handwashing services at the start of the pandemic. Accelerating
    most relevant for monitoring efforts to prevent and                  progress in countries with the lowest coverage of WASH in schools will therefore be critical to improve school
                                                                         safety during the COVID-19 pandemic and beyond.
    control the spread of COVID-19 (Box 1).
                                                                         1
                                                                           INFORM COVID-19 Risk Index countries classified as at ‘high’ or ‘very high’ risk of health and humanitarian impacts overwhelming national response
                                                                         capacity and requiring humanitarian assistance .

6   PROGRESS ON DRINKING WATER, SANITATION AND HYGIENE IN SCHOOLS: Special focus on COVID-19
PROGRESS ON DRINKING WATER, SANITATION AND HYGIENE IN SCHOOLS - SPECIAL FOCUS ON COVID-19
DRINKING WATER IN SCHOOLS

                                                       Globally, 69% of schools had a basic                              6 out of 8 SDG regions had estimates for basic drinking water services in 2019
 In 2019,                                              drinking water service in 2019
                                                            100                                                                                                                                       0     0
                                                                                                                          100
 • 120 countries and 6 out of 8 SDG regions had                                                  No service                                                                                           1     1                                          6       6
                                                                                                                                                                                               9
                                                                     17         15                                                                                    15 11            12                                             17 16
   estimates for basic drinking water services                                                   Limited
                                                                                                                                                                                               8                                                                                                        28 28
   in schools, representing 60% of the global                                                    Basic                                                                                 14
                                                             80                                                           80                                                                                                                                                      39            37
                                                                                16               Insufficient                            41        43 43                       22                                                                                            42            42
   school-age population.                                            15                                                          46                                   18
                                                                                                 data                                                                                                                                                                                                   0       1
 • 69% of schools had a basic drinking water
   service (improved source with water available             60                                                           60
                                                                                                                                                                                                                                                                                                 9
                                                                                                                                                                                                                                                                                           7
   at the time of the survey); 16% had a                                                                                                 15
                                                                                                                                                   8          8                                                   100100                                                     10 12
                                                                                                                                 10                                                                  99    99
   limited service (improved source with water
                                                             40                                                                                                                              83
   unavailable); and 15% had no drinking water                                  69
                                                                                                                          40
                                                                                                                                                                                        74                                                                                                              72 71
                                                                     67
   service (unimproved source or no source at all).                                                                                                                   67 68
                                                                                                                                                                                                                                                                                           51 53
                                                                                                                                                                                                                                                                             49 49
 • 584 million children lacked a basic drinking              20                                                           20     43 44
                                                                                                                                                   49 48

   water service at their school, including 297
   million whose schools had an improved source
   with no water available, and 287 million whose             0                                                             0
   schools still had no water service.                            2015          2019                                            2015 2019        2015 2019           2015 2019        2015 2019      2015 2019    2015 2019         2015* 2019        2015 2019             2015 2019     2015 2019    2015 2019

                                                                                                                                 Sub-Saharan
                                                                                                                                       Africa

                                                                                                                                                                                                                   Australia and
                                                                                                                                                                                                                   New Zealand
                                                                                                                                                    Oceania

                                                                                                                                                                        Central and
                                                                                                                                                                      Southern Asia

                                                                                                                                                                                         Northern
                                                                                                                                                                                        Africa and
                                                                                                                                                                                      Western Asia

                                                                                                                                                                                                     Europe and
                                                                                                                                                                                                       Northern
                                                                                                                                                                                                        America

                                                                                                                                                                                                                                     Latin America
                                                                                                                                                                                                                                            and the
                                                                                                                                                                                                                                         Caribbean

                                                                                                                                                                                                                                                        Eastern and
                                                                                                                                                                                                                                                               Asia
                                                                                                                                                                                                                                                      South-Eastern

                                                                                                                                                                                                                                                                            Landlocked
                                                                                                                                                                                                                                                                            Developing
                                                                                                                                                                                                                                                                             Countries

                                                                                                                                                                                                                                                                                               Least
                                                                                                                                                                                                                                                                                          Developed
                                                                                                                                                                                                                                                                                           Countries

                                                                                                                                                                                                                                                                                                       Small Island
                                                                                                                                                                                                                                                                                                        Developing
                                                                                                                                                                                                                                                                                                             States
 • Global coverage of basic drinking water
   services in schools had increased by 0.4
                                                       FIGURE 2           Global coverage of
   percentage points per year since 2015.                                 drinking water in
   Achieving universal access by 2030 would                               schools, 2019 (%)                             FIGURE 3                Regional coverage of drinking water in schools, 2019 (%)
   require a seven-fold increase in the current
                                                                                                                        *The values for Latin America and the Caribbean in 2015 were 69% for basic services and 14% for limited services.
   rate of progress.
 • Coverage of basic water services in schools
   ranged from 44% in sub-Saharan Africa to
   100% in Australia and New Zealand.
                                                       76 out of 120 countries2 had >75% coverage of basic drinking water services                                                                                                 2 out of 5 children without a basic
                                                       in schools in 2019                                                                                                                                                          drinking water service at school
 • 3 out of 4 secondary schools (74%) and 2
   out of 3 primary schools (66%) had a basic                                                                                                                                                                                      lived in sub-Saharan Africa in 2019
   water service. There were insufficient data
   to calculate global estimates for pre-primary                                                                                                                                                                                     Insufficient                                           Sub-Saharan
   schools.                                                                                                                                                                                                                               data                                                Africa
                                                                                                                                                                                                                                                           154
 • 61% of rural schools had a basic water service
                                                                                                                                                                                                                                                                     584 million          225
   and 17% had no service. 6% of urban schools                                                                                                                                                                                      Other                             children
                                                                                                                                                                                                                                    regions*                       without a basic
   had no water service but there were insufficient                                                                                                                                                                                                   4
                                                                                                                                                                                                                                                      23            water service
   data to estimate coverage of basic services.
                                                                                                                                                                  0–50
 • Nearly half (48%) of all children with no water                                                                                                                                                                                  Northern
                                                                                                                                                                  51–75                                                             Africa and                        178
   service at their school lived in Least Developed                                                                                                               76–90
                                                                                                                                                                                                                                    Western Asia
   Countries.                                                                                                                                                     >90                                                                                       Central and
                                                                                                                                                                  Insufficient data                                                                        Southern Asia
 • In the 60 countries at highest risk of health and
                                                                                                                                                                  Not applicable                                                   *Oceania, Europe and Northern America, Australia and New Zealand
   humanitarian crisis due to COVID-191, half of                                                                                                                                                                                   FIGURE 5                 Number of school-age children
   children (50%) lacked a basic water service at                                                                                                                                                                                                           without a basic drinking water
                                                       FIGURE 4        Proportion of schools with a basic drinking water service, 2019 (%)
   their school at the start of the pandemic.                                                                                                                                                                                                               service at school, 2019 (millions)
                                                       2
                                                         The JMP tracks progress for 234 countries, areas and territories, including all United Nations Member States. Statistics in                                                                        * Oceania, Europe and Northern America,
                                                       this report refer to countries, areas or territories. For further details see .                                                                                                Australia and New Zealand

                                                                                                                                                                                                                                                                                         HIGHLIGHTS                   7
PROGRESS ON DRINKING WATER, SANITATION AND HYGIENE IN SCHOOLS - SPECIAL FOCUS ON COVID-19
SANITATION IN SCHOOLS

                                                              Globally, 63% of schools had a                       7 out of 8 SDG regions had estimates for basic sanitation services in 2019
      In 2019,                                                basic sanitation service in 2019
                                                                                                                                                                                                            0     0
                                                               100                                                 100                                                                                      1     1
                                                                                               No service
       • 117 countries and 7 out of 8 SDG regions                                                                                                                           10       6      11 10
                                                                                19             Limited                                                              16
         had estimates for basic sanitation services in                23                                                          27
                                                                                                                                                          24                                        3                                                              25
                                                                                                                                                                                                                                                                        22       27 25              26
                                                                                               Basic                       30                                               11 19           10                                           33 32                                                 32
         schools, representing 58% of the global school-        80                                                  80
                                                                                               Insufficient                                 40 40
         age population.                                                                       data                                                                 20
                                                                       17        18                                                                       20                                                                                                                                          7
                                                                                                                                                                                                                                                                                               0
       • 63% of schools had a basic sanitation service                                                                                                                                                                                                                  28
                                                                                                                                                                                                                                                                                 20 22
                                                                                                                                                                                                                                                                   27
         (improved single-sex facilities that were usable       60                                                  60
                                                                                                                           27
                                                                                                                                   27
                                                                                                                                            13 13
         at the time of the survey); 18% had a limited                                                                                                                                                      98 99
                                                                                                                                                                                                                       100 100

         service (improved facilities that were not single-                                                                                                                 78                    87
                                                                                                                    40                                                             75       79
         sex or not usable); and 19% had no sanitation          40
                                                                                 63                                                                                 64                                                                                                                        68 67
         service (unimproved facilities or none at all).               60
                                                                                                                                                          56                                                                                                            51       53 53
                                                                                                                                   47
       • 698 million children lacked a basic sanitation                                                             20
                                                                                                                          43                47 47                                                                                                                  48
                                                                20
         service at their school, including 331 million
         whose schools had improved facilities that were
         not single-sex or not usable, and 367 million           0                                                   0
         whose schools still had no sanitation service.              2015        2019
                                                                                                                         2015 2019        2015    2019   2015 2019        2015 2019        2015 2019      2015 2019    2015 2019        2015 2019                 2015 2019    2015 2019     2015 2019

                                                                                                                           Sub-Saharan
                                                                                                                                 Africa

                                                                                                                                             Oceania

                                                                                                                                                            Central and
                                                                                                                                                          Southern Asia

                                                                                                                                                                              Caribbean

                                                                                                                                                                                                                                                                                Landlocked
                                                                                                                                                                          Latin America
                                                                                                                                                                                 and the

                                                                                                                                                                                              Northern
                                                                                                                                                                                             Africa and
                                                                                                                                                                                           Western Asia

                                                                                                                                                                                                          Europe and
                                                                                                                                                                                                            Northern
                                                                                                                                                                                                             America

                                                                                                                                                                                                                       Australia and
                                                                                                                                                                                                                       New Zealand

                                                                                                                                                                                                                                          Eastern and

                                                                                                                                                                                                                                                                       Least
                                                                                                                                                                                                                                                                  Developed
                                                                                                                                                                                                                                                                   Countries
                                                                                                                                                                                                                                        South-Eastern
                                                                                                                                                                                                                                                 Asia

                                                                                                                                                                                                                                                                                Developing
                                                                                                                                                                                                                                                                                 Countries

                                                                                                                                                                                                                                                                                             Small Island
                                                                                                                                                                                                                                                                                              Developing
                                                                                                                                                                                                                                                                                                   States
       • Global coverage of basic sanitation services in
         schools had increased by 0.7 percentage points       FIGURE 6      Global coverage of
                                                                            sanitation in schools,
         per year since 2015. Achieving universal access
                                                                            2019 (%)
         by 2030 would require a five-fold increase in
         the current rate of progress.                                                                             FIGURE 7               Regional coverage of sanitation in schools, 2019 (%)

       • Coverage of basic sanitation services in schools
         ranged from 47% in sub-Saharan Africa to
         100% in Australia and New Zealand.                   71 out of 117 countries had >75% coverage of basic sanitation services in                                                                                       Over half of children without a
       • 71% of secondary schools and 60% of primary          schools in 2019                                                                                                                                                 basic sanitation service at school
         schools had a basic sanitation service. There                                                                                                                                                                        lived in 2 SDG regions in 2019
         were insufficient data to calculate global
         estimates for pre-primary schools.                                                                                                                                                                                                                                           Sub-Saharan
                                                                                                                                                                                                                                                                                        Africa
       • 44% of rural schools had a basic sanitation                                                                                                                                                                               Insufficient
         service and 22% had no service. 10% of urban                                                                                                                                                                                   data
                                                                                                                                                                                                                                                        226                        213
         schools had no sanitation service but there                                                                                                                                                                                                            698 million
                                                                                                                                                                                                                                                                  children
         were insufficient data to estimate coverage of                                                                                                                                                                                                        without a basic
                                                                                                                                                                                                                                  Other                          sanitation
         basic services.                                                                                                                                                                                                          regions*              4          service
                                                                                                                                                                                                                                                        17
       • Nearly a quarter of children whose school                                                                                                                                                                                                        38
                                                                                                                                                                                                                                                                          200
         still had no sanitation service lived in Least                                                                                                                                                                            Northern
                                                                                                                                                                                                                                   Africa and                                 Central and
         Developed Countries.                                                                                                                                  0–50
                                                                                                                                                                                                                                   Western Asia                             Southern Asia
                                                                                                                                                               51–75                                                                                       Latin America
       • In the 60 countries at highest risk of health and                                                                                                                                                                                                 and the Caribbean
                                                                                                                                                               76–90
         humanitarian crisis due to COVID-191, over                                                                                                            >90
         half of children lacked a basic sanitation service                                                                                                    Insufficient data
                                                                                                                                                                                                                             *Oceania, Europe and Northern America, Australia and New Zealand
                                                                                                                                                                                                                             FIGURE 9                     Number of school-age children
         at their school at the start of the pandemic.                                                                                                         Not applicable                                                                             without a basic sanitation service
                                                                                                                                                                                                                                                          at school, 2019 (millions)
                                                              FIGURE 8      Proportion of schools with a basic sanitation service, 2019 (%)                                                                                                               * Oceania, Europe and Northern America,
                                                                                                                                                                                                                                                          Australia and New Zealand

8   PROGRESS ON DRINKING WATER, SANITATION AND HYGIENE IN SCHOOLS: Special focus on COVID-19
PROGRESS ON DRINKING WATER, SANITATION AND HYGIENE IN SCHOOLS - SPECIAL FOCUS ON COVID-19
HYGIENE IN SCHOOLS

                                                    Globally, 57% of schools had a                       7 out of 8 SDG regions had estimates for basic hygiene services in 2019
 In 2019,                                           basic hygiene service in 2019
                                                                                                                                                                                             0     0
                                                      100                           No service           100                                                                                 2     2
 • 110 countries and 7 out of 8 SDG regions                                                                                                                        12                                                        10 10
                                                                                    Limited                                                                 18                      20
   had estimates for basic hygiene services                             25
                                                                                    Basic
                                                                                                                                                     23                        28
                                                              32                                                                                                                                                                                                                 29 31
   in schools, representing 57% of the global          80                           Insufficient         80                                                                            1
                                                                                                                44 44                       46
   school-age population.                                                           data                                                                           28         1                                                                     52
                                                                                                                                                                                                                                                         49
                                                                                                                                                             25                                                                                                   60 59
 • 57% of schools had a basic hygiene service                                                                               62 61
                                                                        19
                                                                                                                                                     25                                                                                                                          16
   (handwashing facilities and soap and water          60     16                                         60                                                                                                                                                                           17

   available at the time of the survey); 19% had                                                                                            7
                                                                                                                                                                                                         100 100
                                                                                                                                                                                             98 98
   a limited service (handwashing facilities with
                                                                                                                                                                                    80                                                                   21
   water but no soap available); and 25% had           40                                                40
                                                                                                                39 39                                                         70                                                                    21
                                                                                                                                                                                                                                                                  12 12
   no service (no facilities or no water at all).                                                                           13 13                            58
                                                                                                                                                                   60
                                                              52        57                                                                           52                                                                                                                          55
                                                                                                                                                                                                                                                                                      52
 • 818 million children lacked a basic hygiene                                                                                              47
                                                       20                                                20
   service at their school, including 355 million                                                                                  26                                                                                                                    30       28 29
                                                                                                                            25                                                                                                                      26
   whose schools had facilities with water but                                                                  18 17
   no soap, and 462 million whose schools still                                                           0
                                                       0
   had no hygiene service.                                  2015        2019
                                                                                                               2015 2019   2015 2019       2015 2019        2015 2019        2015 2019      2015 2019    2015     2019     2015 2019                2015 2019    2015 2019     2015 2019

                                                                                                                 Oceania

                                                                                                                            Sub-Saharan
                                                                                                                                  Africa

                                                                                                                                              Central and
                                                                                                                                            Southern Asia

                                                                                                                                                                Caribbean
                                                                                                                                                            Latin America
                                                                                                                                                                   and the

                                                                                                                                                                                Northern
                                                                                                                                                                               Africa and
                                                                                                                                                                             Western Asia

                                                                                                                                                                                            Europe and
                                                                                                                                                                                              Northern
                                                                                                                                                                                               America

                                                                                                                                                                                                          Australia and
                                                                                                                                                                                                          New Zealand

                                                                                                                                                                                                                              Eastern and
                                                                                                                                                                                                                            South-Eastern
                                                                                                                                                                                                                                     Asia

                                                                                                                                                                                                                                                         Least
                                                                                                                                                                                                                                                    Developed
                                                                                                                                                                                                                                                     Countries

                                                                                                                                                                                                                                                                 Landlocked
                                                                                                                                                                                                                                                                 Developing
                                                                                                                                                                                                                                                                  Countries

                                                                                                                                                                                                                                                                                Small Island
                                                                                                                                                                                                                                                                                 Developing
                                                                                                                                                                                                                                                                                      States
 • Global coverage of basic hygiene services in
   schools had increased by 1 percentage point
                                                    FIGURE 10      Global coverage of
   per year since 2015. Achieving universal                        hygiene in schools,
   access by 2030 would require a four-fold                        2019 (%)
   increase in the current rate of progress.                                                             FIGURE 11         Regional coverage of hygiene in schools, 2019 (%)

 • Coverage of basic hygiene services in
   schools ranged from 17% in Oceania to
   100% in Australia and New Zealand.               67 out of 110 countries had >75% coverage of basic hygiene services in                                                                                2 out of 3 children without a basic
 • 58% of secondary schools and 56% of              schools in 2019                                                                                                                                       hygiene service at school lived in 2
   primary schools had a basic hygiene service.
                                                                                                                                                                                                          SDG regions in 2019
   There were insufficient data to calculate
   global estimates for pre-primary schools.                                                                                                                                                                              Insufficient
                                                                                                                                                                                                                               data                                           Sub-Saharan
 • 34% of rural schools had a basic hygiene
                                                                                                                                                                                                              Other                           163                               Africa
   service and 41% had no hygiene service.                                                                                                                                                                    regions*
   There were insufficient data to calculate                                                                                                                                                                                           7         818 million           295
                                                                                                                                                                                                                                      28           children
   global estimates for urban schools.                                                                                                                                                                                                          without a basic
                                                                                                                                                                                                              Northern                61           hygiene
 • 40% of children whose schools still had no                                                                                                                                                                 Africa and                            service
                                                                                                                                                                                                              Western
   hygiene service lived in Least Developed                                                                                                                                                                   Asia
   Countries.                                                                                                                                                                                                                                        264
                                                                                                                                            0–50
 • In the 60 countries at highest risk of health                                                                                                                                                              Latin America                       Central and
                                                                                                                                            51–75
   and humanitarian crisis due to COVID-191,                                                                                                                                                                  and the Caribbean                  Southern Asia
                                                                                                                                            76–90
   3 out of 4 children lacked a basic hygiene                                                                                               >90                                                            *Oceania, Europe and Northern America, Australia and New Zealand
   service at their school at the start of the                                                                                              Insufficient data                                             FIGURE 13                         Number of school-age children
   pandemic.                                                                                                                                Not applicable                                                                                  without a basic hygiene service
                                                                                                                                                                                                                                            at school, 2019 (millions)
                                                    FIGURE 12      Proportion of schools with a basic hygiene service, 2019 (%)                                                                                                             * Oceania, Europe and Northern America,
                                                                                                                                                                                                                                            Australia and New Zealand

                                                                                                                                                                                                                                                                   HIGHLIGHTS                  9
PROGRESS ON DRINKING WATER, SANITATION AND HYGIENE IN SCHOOLS - SPECIAL FOCUS ON COVID-19
SECTION 1

     INTRODUCTION

     2030 vision for WASH in schools

     The 2030 Agenda for Sustainable Development3 is                           seek to balance social, economic and environmental
     described as a plan of action for people, planet and                      dimensions of development and include several
     prosperity. This ambitious universal agenda commits                       global targets and indicators related to drinking water,
     all United Nations (UN) Member States to take bold                        sanitation and hygiene (WASH) in schools (Table 1).
     and transformative steps to ‘shift the world onto
     a sustainable and resilient path’ and ‘leave no one                       Goal 6 aims to ‘ensure availability and sustainable
     behind’. The Sustainable Development Goals (SDGs)                         management of water and sanitation for all’ and
                                                                               includes targets for universal access to safe drinking
     3
       Transforming Our World: The 2030 Agenda for Sustainable Development,
     United Nations General Assembly Resolution, A/RES/70/1, 21 October 2015   water (6.1), sanitation and hygiene (6.2) for all.
     .

                         SDG global targets                                         SDG global indicators
                         6.1 By 2030, achieve universal and equitable access to     6.1.1 Proportion of population using safely managed
                         safe and affordable driking water for all                  drinking water services

                         6.2 By 2030, achieve access to adequate and equitable      6.2.1 Proportion of population using a) safely
                         sanitation and hygiene for all and end open defecation,    managed sanitation services and b) a handwashing
                         paying special attention to the needs of women and         facility with soap and water
                         girls and those in vulnerable situations

                         4.a Build and upgrade education facilities that are        4.a.1 Proportion of schools with access to... (e)
                         child, disability and gender sensitive and provide         basic drinking water, (f) single-sex basic sanitation
                         safe, non-violent, inclusive and effective learning        facilities, and (g) basic handwashing facilities
                         environments for all

      TABLE 1     Global goals and targets related to WASH in schools

10   PROGRESS ON DRINKING WATER, SANITATION AND HYGIENE IN SCHOOLS: Special focus on COVID-19
‘Universal access’ implies all settings (including
households, schools, health care facilities,
workplaces and public places), and ‘for all’ implies
services that are suitable for people of all genders
and all ages, including people living with disabilities
and those in vulnerable situations.

Goal 4 aims to ‘ensure inclusive and quality
education for all and promote lifelong learning’ and
includes targets to build and upgrade education
facilities that are child, disability and gender sensitive
and provide safe and effective learning environments
for all (4.a). This includes providing all schools
with access to electricity, computers, the internet,
adapted infrastructure and materials for students
with disabilities, and basic WASH services (4.a.1).

The 2030 Agenda states that the global goals
and targets are aspirational. Governments are
therefore expected to localize them and set their            In the 2020 SDG progress report4, the UN Secretary                                 Health Organization (WHO) and the United Nations
own national targets for WASH in schools. These              General warns that the pandemic ‘imperils progress’                                Children’s Fund (UNICEF) launched a new global
should be guided by the global level of ambition             towards the SDGs and urges that ‘recent gains                                      initiative ‘Hand Hygiene for All’ that aims to scale up
and by existing international commitments                    are protected as much as possible and a truly                                      hand hygiene in response to COVID-19 and seize the
(including the human rights to education and to              transformative recovery from COVID-19 is pursued,                                  opportunity to build back better, establishing and
safe water and sanitation), and take into account            one that reduces the risk of future crises and                                     sustaining a culture of hygiene across all levels of
national circumstances. To ensure ‘no one is                 brings much closer the inclusive and sustainable                                   government and society.
left behind’, governments are also expected                  development required to meet the goals of the 2030
to establish mechanisms to identify the most                 Agenda and the Paris Agreement on Climate Change’.                                 Governments seeking to control the spread of
relevant dimensions of inequality in access to                                                                                                  COVID-19 must balance the risks to public health
WASH in schools and to monitor progress among                The global response to COVID-19 has also underlined                                with the social and economic impacts of lockdown
disadvantaged groups.                                        the importance of WASH, especially hygiene, in                                     measures. Schools around the world have been
                                                             households, schools and health care facilities for                                 closed to reduce transmission, but prolonged
                                                             reducing the transmission of infectious diseases and                               school closures will have negative impacts on
Accelerating progress in response to                         protecting global health5. In June 2020, the World                                 children’s safety, wellbeing and learning. Access to
COVID-19                                                                                                                                        WASH services is essential for effective infection
                                                             4
                                                               Progress towards the Sustainable Development Goals, Report of the Secretary
                                                             General, High Level Political Forum on Sustainable Development, United Nations     prevention and control in schools and a major focus
                                                             Economic and Social Council, July 2020 .
                                                                                                                                                of government strategies for the safe reopening
has triggered an unprecedented global health and             5
                                                               WHO and UNICEF, Water, Sanitation, Hygiene, and Waste Management for             and operation of schools during the ongoing global
                                                             SARS-CoV-2, the Virus that Causes COVID-19, WHO, 2020 .
                                                                                                                                                pandemic (Box 2).

                                                                                                                                                                               SECTION 1   INTRODUCTION   11
BOX 2     WASH and COVID-19 infection prevention and control in schools

           WASH and infection prevention and control in schools during the COVID-19 pandemic

           By June 2020, 191 countries had implemented school
           closures to control the spread of COVID-19, affecting
           90% of students worldwide (1.57 billion)4. The
           United Nations Educational, Scientific and Cultural
           Organization (UNESCO), UNICEF, the World Bank,
           the World Food Programme (WFP) and the United
           Nations High Commissioner for Refugees (UNHCR)
           have jointly published a Framework for Reopening
           Schools to inform government decision making on
           when, where and how to safely reopen schools,
           which covers a range of issues including WASH6.
           This framework includes guidance on developing
           policies and procedures for safe operations prior to
           opening (including protocols on hygiene measures,
           use of personal protective equipment – PPE, and                       sex-separated toilets and provisions for menstrual hygiene                           Several countries have launched rapid assessments of WASH
           cleaning and disinfection), upgrading school facilities               management – MHM), training teachers and staff to                                    in schools in response to COVID-19. For example, Ecuador
           as part of the opening process (including access to                   encourage safe practices (including physical distancing,                             conducted a nationwide assessment of the status of WASH
           safe water, handwashing stations, cleaning supplies,                  hygiene, cleaning and waste management), and actively                                services in schools in June 2020. The survey included
                                                                                 monitoring compliance after opening.                                                 information on access to water, toilets and handwashing
           6
              UNICEF, et al., Framework for Reopening Schools, UNESCO, UNICEF,
           World Bank, WFP, UNHCR, 2020 .              Other relevant resources include a set of Key Messages                               the condition and cleanliness of toilets, and the ratio of
                                                                                 and Actions for COVID-19 Prevention and Control in                                   students to toilets and handwashing facilities. Provincial
                                                                                 Schools, published by UNICEF, WHO and the International                              maps were produced showing the distribution of schools with
                                                                                 Federation of Red Cross and Red Crescent Societies                                   WASH services that do not meet national standards and will
                                                                                 (IFRC)7; the Global Education Cluster Safe Back to School                            require additional support to reopen safely (Figure 14).
                                                                                 guide8, which includes detailed checklists for practitioners;
                                                                                 and the Global Network for Water, Sanitation and Hygiene                             While many countries routinely collect information on
                                                                                 in Schools 10 Immediate WASH in Schools (WinS) Actions                               access to WASH, relatively few have national data on
                                                                                 for reopening schools9.                                                              cleaning and disinfection or waste management in schools.
                                                                                                                                                                      In a recent environmental health assessment in Tunisia, 19%
                                                                                 7
                                                                                   United Nations Children’s Fund, World Health Organization, IRC, Key Messages
                                                                                 and Actions for COVID-19 Prevention and Control in Schools, UNICEF, WHO,
                                                                                                                                                                      of primary schools reported lacking sufficient equipment,
                                                                                 IRC, 2020 .
                                                                                                                                                                      Information System (EMIS) in Ethiopia includes questions
                                                                                 8
                                                                                   Child Protection: Global Protection Cluster, Global Education Cluster, Safe Back
                                                                                 to School: A Practitioner’s Guide, Child Protection: Global Protection Cluster,      on waste management and shows that a third of primary
                                                                                 Global Education Cluster, 2020 .
                                                                                                                                                                      the Afar and Somali regions lack adequate waste disposal
                                                                                 9
                                                                                    GIZ, United Nations Children’s Fund, Save the Children, et al., 10 Immediate
                                                                                 WASH in Schools (WinS) Actions: Preparing for Reopening of Schools – Support
                                                                                                                                                                      (Figure 16). These examples illustrate the scale of the
                                                                                 for School Heads to Manage the Response to COVID-19, WASH in Schools                 challenge associated with safely reopening schools in many
                                                                                 Network, 2020 .

12   PROGRESS ON DRINKING WATER, SANITATION AND HYGIENE IN SCHOOLS: Special focus on COVID-19
In Ecuador, a rapid nationwide assessment in response to COVID-19 identified schools with inadequate WASH facilities

                                                                            CA                                                                                                                                       CA                                                                                                                                                                        CA
                                                                               RC                                                                                                                                       RC                                                                                                                                                                        RC
                                ESMERALDAS                                        H                                                                                      ESMERALDAS                                        H                                                                                                                    ESMERALDAS                                           H
                                                                                   I                                                                                                                                        I                                                                                                                                                                          I

                                                                 IMBABURA                                                                                                                                 IMBABURA                                                                                                                                                                  IMBABURA

                                                              PICHINCHA                               SUCUMBIOS                                                                                        PICHINCHA                               SUCUMBIOS                                                                                                                         PICHINCHA                                  SUCUMBIOS
                       STO DOMINGO DE LOS TSACHILAS                                                                                                             STO DOMINGO DE LOS TSACHILAS                                                                                                                                            STO DOMINGO DE LOS TSACHILAS

                                                                           NAPO                                                                                                                                     NAPO                                                                                                                                                                      NAPO
              MANABI                                                                                   ORELLANA                                        MANABI                                                                                                                                                                 MANABI
                                                                                                                                                                                                                                                ORELLANA                                                                                                                                                                     ORELLANA
                                                    COTOPAXI                                                                                                                                 COTOPAXI                                                                                                                                                                  COTOPAXI

                                                           TUNGURAHUA                                                                                                                               TUNGURAHUA                                                                                                                                                                TUNGURAHUA
                             LOS RIOS

                                                                                                                                                                      LOS RIOS

                                                                                                                                                                                                                                                                                                                                             LOS RIOS
                                          BOLIVAR

                                                                                                                                                                                   BOLIVAR

                                                                                                                                                                                                                                                                                                                                                             BOLIVAR
                                                                                            PASTAZA                                                                                                                                  PASTAZA                                                                                                                                                                      PASTAZA
                                                             O

                                                                                                                                                                                                      O

                                                                                                                                                                                                                                                                                                                                                                                O
                                                           AZ

                                                                                                                                                                                                    AZ

                                                                                                                                                                                                                                                                                                                                                                              AZ
  SANT

                                                                                                                                           SANT

                                                                                                                                                                                                                                                                                                                  SANT
                                                         OR

                                                                                                                                                                                                  OR

                                                                                                                                                                                                                                                                                                                                                                            OR
                                                      IMB

                                                                                                                                                                                               IMB

                                                                                                                                                                                                                                                                                                                                                                         IMB
      A EL

                  GUAYAS

                                                                                                                                               A EL

                                                                                                                                                                                                                                                                                                                      A EL
                                                                                                                                                           GUAYAS                                                                                                                                                                 GUAYAS
                                                     CH

                                                                                                                                                                                              CH

                                                                                                                                                                                                                                                                                                                                                                        CH
      ENA

                                                                                                                                               ENA

                                                                                                                                                                                                                                                                                                                       ENA
                                                                                                                  WATER                                                                                                                                          SANITATION                                                                                                                                                             HYGIENE
                                           CAÑAR                          MORONA SANTIAGO                                                                                           CAÑAR                          MORONA SANTIAGO                                                                                                                            CAÑAR                          MORONA SANTIAGO

             GUAYAS                                                                                                                                   GUAYAS                                                                                                                                                                 GUAYAS
                                        AZUAY                                                                                                                                    AZUAY                                                                                                                                                                    AZUAY

                                                                                                                   No service                                                                                                                                         No service                                                                                                                                                         No service
                  EL ORO                                                                                                                                   EL ORO                                                                                                                                                                 EL ORO

                                                                                                                   Limited service                                                                                                                                    Service limited                                                                                                                                                    Service limited
                                                                                                                                                                                                                                                                      by infrastructure                                                                                                                                                  by infrastructure
                                                                                                                   Basic service
                                                          E

                                                                                                                                                                                                   E

                                                                                                                                                                                                                                                                                                                                                                             E
                                                      CHIP

                                                                                                                                                                                               CHIP

                                                                                                                                                                                                                                                                                                                                                                         CHIP
                      LOJA                                                                                                                                     LOJA                                                                                                                                                                   LOJA

                                                                                                                                                                                                                                                                      Service limited                                                                                                                                                    Service limited
                                                    CHIN

                                                                                                                                                                                             CHIN

                                                                                                                                                                                                                                                                                                                                                                       CHIN
                                                                                                                                                                                                                                                                      by cleaning                                                                                                                                                        by supplies
                                                ORA

                                                                                                                                                                                         ORA

                                                                                                                                                                                                                                                                                                                                                                   ORA
                                            ZAM

                                                                                                                                                                                     ZAM

                                                                                                                                                                                                                                                                                                                                                               ZAM
                                                                                                                                                                                                                                                                      Basic service                                                                                                                                                      Basic service

FIGURE 14                               Map of schools with adequate, limited and no drinking water, sanitation and hygiene service (national standards) in Ecuador (2020)
                                        Source: Diagnóstico de servicos de agua, saneamiento e higiene en las instituciones educativas, Dirección Nacional de Análisis e Información Educativa e Dirección Nacional de Gestión de Riegos, Ecuador (June, 2020)

In Tunisia, 1 in 5 primary schools lacked sufficient equipment or staff                                                                                                                                                               In Ethiopia, 1 in 3 primary schools lacked adequate solid waste disposal in 2017
for cleaning and disinfection in 2015
                                                                                                                                                                                                                                       100

 Lack of necessary equipment                                                                                               8                                                                                                             80
                                                                                                                                                                                                                                                       91
                                                                                                                                                                                                                                                                        79           73
                                                                                                                                                                                                                                         60
                                                                                                                                                                                                                                                                                              69           69
             Lack of cleaning products                                                                                         9                                                                                                                                                                                                62                            60                             60                                                          65
                                                                                                                                                                                                                                                                                                                                                                                                               57
                                                                                                                                                                                                                                         40                                                                                                                                                                                    49
 Lack of disinfection products                                                                                                       11
                                                                                                                                                                                                                                         20
                                                                                                                                                                                                                                                                                                                                                                                                                                          23
                         Lack of specific staff                                                                                       12                                                                                                   0

                                                                                                                                                                                                                                                                                                                                                                                                                                           Somali
                                                                                                                                                                                                                                                                                                                                                                                                               Harari
                                                                                                                                                                                                                                                                                                                               Tigray

                                                                                                                                                                                                                                                                                                                                                                                                                               Afar
                                                                                                                                                                                                                                                                                                        Benishangul-
                                                                                                                                                                                                                                                                                                             Gumuz

                                                                                                                                                                                                                                                                                                                                                        Southern Nations
                                                                                                                                                                                                                                                                                                                                                            Nationalities
                                                                                                                                                                                                                                                                                                                                                             and Peoples
                                                                                                                                                                                                                                                                         Dire Dawa

                                                                                                                                                                                                                                                                                                                                                                                         Addis Ababa
                                                                                                                                                                                                                                                                                     Amhara

                                                                                                                                                                                                                                                                                                                                                                                                                                                         Ethiopia
                                                                                                                                                                                                                                                                                              Oromiya
                                                                                                                                                                                                                                                           Gambella

   Lack of equipment or staff
                                                                                                                                                                  19
 for cleaning and disinfection

                                                                                             0                                       10                                                              20

FIGURE 15                               Proportion of primary schools lacking equipment, products or staff for cleaning and                                                                                                             FIGURE 16                        Proportion of primary schools with solid waste disposal by administrative region of Ethiopia
                                        disinfection in Tunisia (2015)                                                                                                                                                                                                   in 2017 (%)
                                        Source: Evaluation de l’état d’hygiène de l’environnement des écoles primaires en Tunisie, Ministère                                                                                                                             Source: Education statistics annual abstract 2009 E.C., Ministry of Education, Ethiopia (2016-17)
                                        de l’Education, Republique Tunisienne (2015)

                                                                                                                                                                                                                                                                                                                                                                                                                                        SECTION 1        INTRODUCTION   13
Additional indicators for expanded monitoring

     The WHO/UNICEF Joint Monitoring Programme
                                                                                                                                                                Examples of additional indicators
     (JMP) service ladders are designed to track                                         Service              Basic
                                                                                         element            indicators
     progress towards a basic level of WASH services in                                                                          Accessibility          Availability        Acceptability           Quality                Other

     all schools. While the basic service indicators are                                                Availability/          ‣‣ water source on    ‣‣ sufficient        ‣‣ culturally        ‣‣ E. coli,           ‣‣ provision for
     universally relevant, they do not capture all aspects                                              accessibility             school premises       quantity             appropriate          Legionella,           other uses
                                                                                                        ‣‣ water is            ‣‣ to those with      ‣‣ continuity of        design               residual              (such as water
     of WASH services that are important for the health                                                    available on           limited mobility      supply            ‣‣ taste and            chlorine,             for cleaning)
     and well-being of students and staff. The JMP has                                                     premises            ‣‣ to young           ‣‣ water storage        appearance           chemicals          ‣‣ piped or non-
                                                                                                                                  children           ‣‣ alternative       ‣‣ drinking water    ‣‣ on-site water         piped
     published core questions for monitoring the SDG                                     DRINKING       Quality                ‣‣ in different          supply               fountains            treatment          ‣‣ operation and
     indicators for basic WASH services in schools10 and                                  WATER         ‣‣ improved               locations (food    ‣‣ students/         ‣‣ individual                                 maintenance
                                                                                                           source                 hall, classroom,      teachers per         bottles or                              ‣‣ supply of
     is compiling an expanded set of questions addressing                                                                         playground)           water point          separate cups                              chemicals for
     other elements. In 2020, the JMP supported a                                                                              ‣‣ with physical                                                                         treatment
                                                                                                                                  distancing                                                                         ‣‣ financing
     review of emerging tools for monitoring menstrual
     health and hygiene, including in school settings
     (forthcoming).                                                                                     Availability/          ‣‣ to those with      ‣‣ for teachers      ‣‣ gender-           ‣‣ cleanliness and    ‣‣ sewered or non-
                                                                                                        accessibility             limited mobility      and staff            appropriate          smell                 sewered
                                                                                                        ‣‣ for girls and for   ‣‣ to young           ‣‣ students per         design            ‣‣ faecal sludge      ‣‣ operation and
     Table 2 provides examples of additional indicators                                                    boys                   children              toilet            ‣‣ privacy for          management            maintenance
     that may be included in national systems for                                                       ‣‣ usability           ‣‣ with physical      ‣‣ water and soap       those who         ‣‣ solid waste        ‣‣ supply of
                                                                                                                                  distancing            for managing         menstruate           management            equipment
     monitoring WASH in schools. The indicators                                         SANITATION      Quality                                         menstruation                                                    and materials
     most relevant for monitoring efforts to prevent                                                    ‣‣ improved                                                                                                     for waste
                                                                                                           toilets                                                                                                      management
     and control the spread of COVID-19 are in bold.                                                                                                                                                                 ‣‣ financing
     Existing data from national monitoring systems are
     highlighted in subsequent sections and the specific
     challenges associated with providing safe and
                                                                                                        Availability           ‣‣ in different       ‣‣ for teachers      ‣‣ culturally        ‣‣ hygiene            ‣‣ type of
     inclusive WASH services for all, including young                                                   ‣‣ handwashing            locations (such       and staff            appropriate          promotion in          handwashing
     children, students with disabilities and students who                                                 facilities with        as toilets,        ‣‣ students per         design               school                facility
                                                                                                           water                  dining halls,         handwashing       ‣‣ visual cues and   ‣‣ handwashing at     ‣‣ food hygiene
     menstruate, are explored in Section 6.                                                                                       kitchens,             facility/tap         nudges               critical times     ‣‣ hand sanitizer
                                                                                                        Quality                   classrooms,        ‣‣ sufficient        ‣‣ respiratory       ‣‣ daily cleaning     ‣‣ training of
     10
        United Nations Children’s Fund and World Health Organization, Core Questions                    ‣‣ soap                   playgrounds,          for frequent         hygiene              and disinfection      cleaning staff
     and Indicators for Monitoring WASH in Schools in the Sustainable Development                                                 staff rooms,          handwashing                               of surfaces        ‣‣ PPE for
     Goals, UNICEF and WHO, New York, 2018 .
                                                                                                                               ‣‣ to those with         day per person)                           of school          ‣‣ financing
                                                                                                                                  limited mobility   ‣‣ group                                     environment
                                                                                                                               ‣‣ to young              handwashing
                                                                                                                                  children              exercises
                                                                                                                               ‣‣ with physical      ‣‣ supply of
                                                                                                                                  distancing            materials for
                                                                                                                                                        cleaning and
                                                                                                                                                        disinfection

                                                                                       TABLE 2   Basic and additional indicators for monitoring WASH in schools (COVID-19-related in bold)

14   PROGRESS ON DRINKING WATER, SANITATION AND HYGIENE IN SCHOOLS: Special focus on COVID-19
Data sources used for this report

The JMP uses national data sources to produce           Data availability on basic WASH in schools has improved since the global baseline report
internationally comparable estimates of progress
on WASH in schools. The main sources of national                                                             DRINKING WATER                       SANITATION                          HYGIENE
data used in this report are routine administrative      Data coverage by region                             2018             2020             2018            2020             2018             2020
                                                                                                           baseline         progress         baseline        progress         baseline         progress
reporting through EMIS and periodic censuses or                                                             report           report           report          report           report           report
surveys of school facilities. Primary data sources       Australia and New Zealand (2)                      82% (1)          82% (1)          82% (1)         82% (1)          82% (1)          82% (1)
were compiled by UNICEF and WHO country offices
                                                         Central and Southern Asia (14)                     93% (7)         96% (10)          80% (6)         82% (8)          79% (4)          82% (6)
in consultation with national statistical offices and
                                                         Eastern and South-Eastern Asia (18)                26% (9)         28% (11)          25% (9)         28% (12)         25% (9)          28% (13)
ministries of education. The JMP team also compiled
                                                         Europe and Northern America (50)                  65% (24)         69% (27)         64% (23)         68% (26)         68% (25)         72%(29)
data from secondary sources, including information
                                                                                                           25% (14)         21% (22)         92% (21)         45% (20)         34% (11)         35% (18)
reported by the UNESCO Institute of Statistics (UIS).    Latin America and the Caribbean (48)

Preliminary national estimates were then circulated      Northern Africa and Western Asia (25)             33% (14)         37% (16)         53% (15)         57% (17)         42% (12)         54% (16)

to country offices for a two-month period of             Oceania (21)                                       88% (6)          90% (7)          88% (7)         89% (7)          88% (6)          90% (7)

consultation and feedback from national authorities      Sub-Saharan Africa (51)                           26% (17)         65% (26)         29% (19)         58% (26)         35% (13)         57% (20)
prior to publication.
                                                         Least Developed Countries (47)                    41% (17)         64% (27)         48% (21)         61% (28)         54% (15)         62% (22)

                                                         Landlocked Developing Countries (32)              45% (15)         91% (22)         47% (15)         79% (18)         59% (12)         81% (19)

                                                         Small Island Developing States (53)               29% (16)         49% (24)         46% (17)         50% (24)         28% (15)         49% (24)

                                                         World (234)                                       51% (92)        60% (120)        54% (101)        58% (117)         50% (81)        57% (110)

                                                        FIGURE 17       Data coverage for basic WASH services in schools in JMP global reports on WASH in schools , % of school-age population (# countries)
                                                                        with national estimates

                                                        The updated JMP global database on WASH in                                     81 countries respectively (Figure 17). Sub-Saharan
                                                        schools contains a total of 1,029 national datasets                            Africa recorded the biggest improvements in data
                                                        covering the period 2000-19. These were used                                   coverage for basic WASH. Latin America and
                                                        to produce estimates for WASH in schools for                                   the Caribbean was the only region to record a
                                                        a total of 173 countries, areas and territories.                               decrease, due to a lack of recent data on basic
                                                        Among these, 120 countries had sufficient data                                 water and sanitation. The JMP produces regional
                                                        to estimate national coverage of basic drinking                                and global estimates provided data are available for
                                                        water in 2019, 117 countries had sufficient data                               at least 30% of the school-age population in each
                                                        to estimate national coverage of basic sanitation,                             domain. For further information on JMP methods
                                                        and 110 countries had sufficient data to estimate                              see Annex 1. Almost all national datasets used in
                                                        national coverage of basic hygiene. This represents                            this report were collected before the start of the
                                                        a significant improvement in data availability since                           COVID-19 pandemic. The impact of the pandemic
                                                        the JMP baseline report, which included national                               and the COVID-19 response on WASH in schools
                                                        estimates of basic services in 2016 for 92, 101 and                            will be assessed in future JMP reports.

                                                                                                                                                                             SECTION 1      INTRODUCTION       15
SECTION 2

     PROGRESS ON DRINKING
     WATER IN SCHOOLS

     Basic drinking water services

     In 2019, 69% of schools around the world had a                coverage, except for Oceania, while in Northern
     basic drinking water service, but coverage varied             Africa and Western Asia coverage increased from
     widely between SDG regions (Figure 18). In sub-               74% to 83%. In Latin America and the Caribbean
     Saharan Africa and Oceania, fewer than half                   coverage increased from 69% in 2015 to 73% in
     of schools had a basic drinking water service,                2018, but there were insufficient data to produce
     compared with two out of three schools in Central             an estimate for 2019. Data on basic drinking
     and Southern Asia and four out of five schools in             water services were available for less than 30% of
     Northern Africa and Western Asia. Europe and                  the school-age population in Eastern and South-
     Northern America and Australia and New Zealand                Eastern Asia.
     had already achieved universal coverage (>99%)
     but there were insufficient data to estimate basic            Preliminary estimates of global trends suggest
     drinking water coverage in schools in Eastern and             current rates of progress will not be sufficient to
     South-Eastern Asia and in Latin America and the               achieve universal access (>99%) to basic drinking
     Caribbean in 2019.                                            water services in schools by 2030. Global coverage
                                                                   would need to increase by 2.7 percentage points
     Only six out of eight SDG regions had sufficient              each year, whereas the annual rate of increase
     data to estimate trends in basic drinking water               between 2015 and 2019 was just 0.4 percentage
     coverage between 2015 and 2019. Global coverage               points. Northern Africa and Western Asia is the only
     has increased from 67% to 69% over this period.               SDG region that has increased coverage by more
     Most SDG regions recorded modest increases in                 than two percentage points per year since 2015.

16   PROGRESS ON DRINKING WATER, SANITATION AND HYGIENE IN SCHOOLS: Special focus on COVID-19
Coverage of drinking water services in schools                                       6 out of 8 SDG regions had sufficient data to estimate trends between 2015 and 2019
varied widely among the 151 countries with national                                   100                                                                                  0     0
                                                                                                                                                                           1     1                                         6       6                                                                               No service
estimates available in 2019 (Figure 19). One                                                                                         15           11        12      9
                                                                                                                                                                                                          17     16                                                                   17     15
                                                                                                                                                                                                                                                                                                                   Limited
                                                                                                                                                                    8                                                                                                 28 28
hundred and twenty countries had estimates for                                         80               41        43       43                     22
                                                                                                                                                            14
                                                                                                                                                                                                                                            42    39     42
                                                                                                                                                                                                                                                               37                                                  Basic
                                                                                               46                                    18                                                                                                                                                      16
                                                                                                                                                                                                                                                                                      15                           Insufficient
basic drinking water services, ranging from universal                                                                                                                                                                                                                 0      1
                                                                                                                                                                                                                                                                                                                   data
coverage (>99%) to just 3% in the Marshall Islands.                                    60
                                                                                                                                                                                                                                                                9
                                                                                                                   8                                                                                                                        10    12      7
                                                                                                                               8
Over a third of countries had
Few countries have data on trends in basic drinking           percentage points per year from 84% in 2015 to            4 out of 16 countries with data on trends in basic
     water coverage in schools. Figure 20 shows current            82% in 2019.                                              drinking water services are on track to achieve
     coverage and annual rates of change between                                                                             universal access by 2030
     2015 and 2019 among countries with
Definitions of drinking water availability vary within and between countries

                                                                                                                                                                                       Schools with drinking
                Region                                    Country                               Source         Year                            Original definition
                                                                                                                                                                                        water available (%)
                                            Bhutan                             EMIS                            2015   Enough water for drinking                                                 85

             Central and                    Bhutan                             EMIS                            2018   Functional 5-7 days/week                                                  71
            Southern Asia                   India                              National survey                 2018   More than 1.5 litres per person per day throughout the year               68
                                            Tajikistan                         World Bank Poverty Diagnostic   2017   Available daily in the last week                                          93
                                            Indonesia                          EMIS                            2016   Enough water                                                              84
                                            Indonesia                          EMIS                            2020   Sufficient water                                                          84
             Eastern and
                                            Cambodia                           EMIS                            2020   Available today on premises                                               83
          South-Eastern Asia
                                            Mongolia                           National survey                 2017   Sufficient water for drinking and handwashing                             77
                                            Philippines                        EMIS                            2016   Have faucets with water supply                                            62
  Latin America and the Caribbean           Peru                               National survey                 2017   Proportion of handwashing facilities with water available                 87
                                            Jordan                             National survey                 2015   Not in ‘bad’ or ‘very bad’ condition                                      93

           Northern Africa                  Lebanon                            National survey                 2017   Available on premises                                                     81
          and Western Asia                  West Bank and Gaza Strip           National survey                 2015   Not been unavailable in past 2 weeks                                      84
                                            Syrian Arab Republic               National survey                 2018   Available                                                                 50
                                            Fiji                               National survey                 2017   Functional at time of survey (now)                                        94
                                            Papua New Guinea                   EMIS                            2016   Functional more than 4 hrs/day                                            72
               Oceania
                                            Papua New Guinea                   EMIS                            2019   Available                                                                 64
                                            Solomon Islands                    National survey                 2016   Continuously available                                                    42
                                            Burundi                            National census                 2018   Excluding currently broken down (toujours en panne)                       50
                                            Ethiopia                           EMIS                            2017   Water available 5-7 days per week                                         25
                                            Ethiopia                           Young Lives School Survey       2017   Water available at the time of survey                                     43
                                            Ghana                              EMIS                            2019   Drinking water source available                                           88
                                            Guinea                             EMIS                            2016   Functional                                                                35
                                            Gambia                             EMIS                            2016   Unknown                                                                   70
                                            Guinea-Bissau                      National survey (mWater)        2019   Available (observed or reported)                                          70
          Sub-Saharan Africa                Liberia                            National survey                 2016   Functional water source                                                   92
                                            Mali                               National survey                 2017   Available during past two weeks                                           85
                                            Nigeria                            National survey                 2018   Currently available                                                       36
                                            Sierra Leone                       EMIS                            2019   Available during school hours                                             74
                                            Uganda                             National survey                 2016   Available throughout the year                                             75
                                            South Africa                       EMIS                            2016   Not unreliable                                                            78
                                            Zimbabwe                           EMIS                            2016   Water available/reliable                                                  67
                                            Zimbabwe                           EMIS                            2017   Consistently available                                                    67

TABLE 3   Definitions of drinking water availability, selected national data sources, 2015-20

                                                                                                                                                           SECTION 2   PROGRESS ON DRINKING WATER IN SCHOOLS   19
Limited drinking water services                                                    Coverage of piped and non-piped improved water in schools varies widely between countries

     The JMP classifies schools with access to an improved                                    Oceania                                                                     9                 Papua New Guinea (2019)                                              45

     source but no water available at the time of the survey
                                                                                                                                                                             3                   Nigeria (2018)                                                        56
     as having a ‘limited’ service. In 2019, 16% of schools                                                                                                                 5                     Liberia (2016)                                                 47
     worldwide had a ‘limited’ drinking water service,                                                                                                                      7           Central African Republic (2017)                         17
                                                                                                                                                                           7                 Guinea-Bissau (2019)                                                          59
     affecting 298 million school-aged children. The worst                                                                                                                9          Democratic Republic of the Congo (2015)                               36
     affected region was Central and Southern Asia where                                                                                                                11                       Guinea (2016)                                   20
                                                                                                                                                                   17                            Eswatini (2017)                                                                66
     more than one in five schools had a limited drinking                                                                                                        22                           Sierra Leone (2018)                                                                  74
                                                                                           Sub-Saharan
     water service, but the worst affected countries were                                     Africa                                                            23                               Malawi (2018)                                                                  69
                                                                                                                                                               26                                Uganda (2016)                                                                  68
     in Northern Africa and Western Asia. Two thirds                                                                                                           27                                Zambia (2017)                                                          56
     of schools in Libya (67%) and half of schools in the                                                                                                     28                                   Mali (2017)                                                        52
                                                                                                                                                         34                                      Somalia (2017)                                       25
     Syrian Arab Republic (49%) had an improved source                                                                                                   34                                     Zimbabwe (2018)                                                       53
     but no water available at the time of the survey, while                                                                                   43                                                 Ghana (2019)                                                   46
                                                                                                                             72                                                                                                    2
     at least 30% of schools in Benin, Cameroon, Nepal,                                                                     74
                                                                                                                                                                                         Sao Tome and Principe (2017)
                                                                                                                                                                                                                                                     24
                                                                                                                                                                                               Cabo Verde (2017)
     Paraguay, Senegal and the Solomon Islands also had                                                           88                                                                          South Africa (2017)                           12

     a limited service (Figure 19).                                                                                                                          22                      Lao People's Democratic Republic (2017)                                     45
                                                                                                                                                           27                                    Indonesia (2020)                                                     52
                                                                                           Eastern and
                                                                                                                                                          30
     National data show that schools use a variety of                                     South-Eastern
                                                                                                                                                41
                                                                                                                                                                                                Cambodia (2020)                                                 44
                                                                                              Asia                                                                                              Philippines (2017)                                   22
     improved drinking water sources11 and that many                                                                                      53                                                     Mongolia (2017)                                                 45
     schools around the world do not have access to
                                                                                                                                                                    14                         Bangladesh (2018)                                                                           83
     piped water. Figure 21 shows that the proportion of                                                                                                           17                          Afghanistan (2017)                                                          59
     schools with access to piped supplies versus other                                     Central and                                                          21                               India (2018)                                                                   70
                                                                                           Southern Asia                                             35                                         Sri Lanka (2018)                                                      51
     improved sources varies widely across countries and
                                                                                                                                     63                                                         Tajikistan (2017)                                    23
     regions12. In most countries in Europe and Northern                                                                        71                                                               Bhutan (2018)                                  16
     America, Latin America and the Caribbean and
                                                                                                                                                    40                                            Libya (2017)                                                  44
     Northern Africa and Western Asia, most schools                                                                                            45                                                Lebanon (2017)                                 15
                                                                                            Northern
     have piped water supplies, except for Libya and                                        Africa and
                                                                                                                                      58                                                   Syrian Arab Republic (2018)                                      40
                                                                                                                       79                                                                        Tunisia (2015)                            10
     Nicaragua. By contrast, in most countries in sub-                                     Western Asia
                                                                                                                 91                                                                              Jordan (2015)                             9
     Saharan Africa, East and South-Eastern Asia and                                                        96                                                                          West Bank and Gaza Strip (2016)            2

     Central and Southern Asia most schools use other
                                                                                                                                                     34                                         Nicaragua (2017)                                           38
     types of improved sources such as boreholes,                                          Latin America                    73                                                                    Brazil (2019)                            10
     rainwater or protected wells and springs. The                                            and the                  80                                                                         Peru (2017)                          6
                                                                                            Caribbean                 82                                                                       El Salvador (2018)                          11
     exceptions are Tajikistan, Bhutan, Mongolia, South                                                               83                                                                        Costa Rica (2018)                      6
     Africa, Cabo Verde and Sao Tome and Principe.
                                                                                          Europe and                                                                                        Russian Federation (2018)              2
                                                                                                         95
                                                                                        Northern America
     11
       Improved sources include piped water, boreholes or tubewells, protected dug
     wells, protected springs, rainwater, and packaged or delivered water.                                 100             80             60         40            20            0                                             0                20         40          60             80        100
     12
        Figure 21 shows coverage of piped and non-piped improved water based on                                        Proportion of schools with piped water                                                                  Proportion of schools with other improved water source
     selected individual national data sources with recent information available. For
     further details see the individual JMP country files .           FIGURE 21 Proportion of schools using piped and non-piped improved water sources, selected countries by region (%)

20   PROGRESS ON DRINKING WATER, SANITATION AND HYGIENE IN SCHOOLS: Special focus on COVID-19
Progress towards ensuring all improved sources have water available varies

                Timor-Leste                            Bhutan                              Uganda                              Zimbabwe
  100

                                                                                                            95
                                                                                 93
                                              89                      89                                              88                    87

   80

                                73
        71                                                                       70
                                69                                                                          68
                                                                      64                                                                    66
        64
   60                                         60
                                                                                                                      58

   40

   20

    0
         2015                 2019              2015               2019            2015                 2019            2015              2019

         Improved source             Basic service Limited service
                                     Improved source                   Basic service               Limited service

FIGURE 22 Proportion of schools with an improved source and a basic drinking water service, selected countries, 2015-19 (%)

Figure 22 shows that progress in reducing the                                 survey increased. Over the same period, Uganda
proportion of schools with a limited service has                              has increased coverage of improved sources in
been mixed. Between 2015 and 2019, Timor-Leste                                schools but the proportion with water available
not only increased coverage of improved sources                               has decreased, thereby increasing the share with
but also improved the availability of drinking water,                         a limited service. Meanwhile, in Zimbabwe the
gradually reducing the proportion of schools                                  proportion of schools meeting the standard for
with a limited service. In Bhutan coverage of                                 a basic service has increased, but the overall
improved sources remained unchanged but the                                   proportion of schools with an improved water source
proportion with water available at the time of the                            has declined.

                                                                                                                                                 SECTION 2   PROGRESS ON DRINKING WATER IN SCHOOLS   21
No drinking water service

     In 2019, 15% of schools around the world still had            287 million children had no drinking water service at their school in 2019
     no drinking water service, meaning they either used
                                                                                                                                               Oceania
     an unimproved source or had no water source at all.
     More than half of the 18 countries where >33% of                                                                                    ca    Europe and
                                                                                                                                   n Afri      Northern A
                                                                                                                            o rther rn Asia              meric
     schools had no water service in 2019 were in sub-                                                                     N este                             a
                                                                                                                              W
     Saharan Africa and there was at least one country                                                                    and
     where >25% had no water service in all regions,
     except for Europe and Northern America and
     Australia and New Zealand (Figure 19).

                                                                                                                                                           32
                                                                                                                                      Iraq
     Figure 23 shows the global distribution of the 287

                                                                                                                                                         o p ia
                                                                                                                                        2
                                                                                                                          M
     children with no drinking water service at their

                                                                                                                                                      Ethi
                                                                                                                           ex
                                                                                                                              ic o
                                                                                                                     Br
     school in 2019. Over half of them (164 million)

                                                                                                                       az

                                                                                                                                5
                                                                                                                          i
                                                                                                                          l
     were from sub-Saharan Africa and a quarter

                                                                                                                           6
                                                                                                                                                                                           24
     lived in just three countries: Ethiopia (32 million),                                   Ph                                                                                      ria
                                                                                                  ilip                                                                            ge
                                                                                                         p in                                                                  Ni
     Nigeria (24 million) and the Democratic Republic                                                           es
                                                                                                                     9
     of the Congo (18 million). Pakistan and India each                                 I ndo
                                                                                                n es i a
     contributed 23 million, although the school-age                                                       11
                                                                                                                                                                                                public
     population in the latter is six times greater. This is                                                                                                                            ratic Re 8
                                                                                                                                                                                Democ          o 1
     equivalent to the total number of children with no                                                                              287 million children                         of the C
                                                                                                                                                                                           on g

     water service in Latin America and the Caribbean                                                                                   with no water
     (24 million).                                                                                                                    service at school                                    Angola 8

                                                                                                                                                                                           Nige
     To calculate regional aggregates, the JMP imputes                                                a 23                                                                                         r 8
                                                                                              I ndi                                                                             Un
                                                                                                                                                                                     i t
                                                                                                                                                                                of d     e
     estimates for those countries with no data available                                                                                                                           Ta Re
                                                                                                                                                                                          nza pu
                                                                                                                                                                           M                    nia blic
     using the population-weighted average for that region.                                                                                                                  ad
                                                                                                                                                                      Cô          a ga               6
                                                                                                                                                                         te              sc
     In all SDG regions, there were data on the population                                                                                                                  d’              a r
                                                                                                                                                                               Iv                6
                                                                                                                            23
     with no drinking water service for over 50% of the                                                                                                                           oi

                                                                                                                                                            Bu Gui oon

                                                                                                                                                             Ch a Fa
                                                                                                                                                                                     re
                                                                                                                           an

                                                                                                                                                              rk nea

                                                                                                                                                               ad
                                                                                                                                                                                          5
                                                                                                                         st

                                                                                                                                                                in
                                                                                                                                                                Ca hana
     regional population of school-age children.
                                                                                                                   ki

                                                                                                                                                                   4
                                                                                                                 Pa

                                                                                                                                                                   me
                                                                                                                                                                    G

                                                                                                                                                                      so
                                                                                                                                                                       r

                                                                                                                                                                         3

                                                                                                                                                                         4
                                                                                                                                                                           3
                                                                                                                                                                           3
                                                                   FIGURE 23 School-age population (millions) with no drinking water service at school by region and country (2019)
                                                                                 Note: Countries with insufficient data shown in grey

22   PROGRESS ON DRINKING WATER, SANITATION AND HYGIENE IN SCHOOLS: Special focus on COVID-19
In sub-Saharan Africa some countries have                           Between 2015 and 2019, the proportion of schools        service in 2015. Since then, many countries have
significantly reduced the proportion of schools                     with no water service declined in all SDG regions,      reduced the proportion of schools with no service,
with no water service since 2015                                    except for Oceania and Eastern and South-Eastern        but countries with similar starting points have
                                                                    Asia where coverage remained unchanged. Figure          achieved very different rates of reduction. In 2015,
   100
                                                                    24 shows changes in the proportion of schools with      just over half of schools in Cameroon (53%) and
                                                                    no service among those countries with sufficient data   the Democratic Republic of the Congo (55%) had
                                                                    to estimate trends over the same period. The chart      no water service, but the former has since achieved
                                                                    highlights countries from sub-Saharan Africa where      a significant reduction of 17 percentage points
                                                                    nearly half of all schools had no drinking water        compared with just 4 percentage points in the latter.
    80

    60

                                                    Democratic
                                                    Republic of
                                                    the Congo

    40

                                                    Cameroon

    20

     0

         2015                                2019

         Countries in              Countries in
         sub-Saharan Africa        other regions

FIGURE 24 Proportion of schools with no drinking water service by
          country and region, 2015-19 (%)

                                                                                                                                  SECTION 2   PROGRESS ON DRINKING WATER IN SCHOOLS   23
BOX 3   Examples of additional indicators for monitoring drinking water services in schools

           Additional indicators used for monitoring                            In South Sudan, students and staff at 1 in 5 primary schools spent >30 min per round trip to collect
           drinking water services in schools                                   drinking water in 2017

           Guidelines for preventing and controlling COVID-19
           in schools highlight a range of additional concerns
           beyond having access to a basic drinking water                                 22%                                              15%
                                                                                                                                                                                25%
           service. These include having a readily accessible
                                                                                                                                                                                                                                 30 min round trip
           drink. This box contains examples of additional                                                       59%
                                                                                    19%
           indicators that have been used to monitor drinking                                                                                                                  20%
                                                                                                                                                               71%
           water services in schools.

           If schools do not have access to water supplies on
           premises, drinking water must either be collected or
           delivered from sources located elsewhere. The 2017                   FIGURE 25 Drinking water collection times reported by rural and urban schools in South Sudan, 2017 (%)
                                                                                                Source: South Sudan Education Cluster Assessment (2017)
           South Sudan Education Cluster Assessment found
           that students and staff at nearly half of primary
           schools (45%) in rural areas spent more than 10
           minutes per trip to collect drinking water, compared
           with fewer than a third (29%) in urban areas (Figure
                                                                               In Burundi, just 1 in 4 schools had a permanent                                       In Bhutan, fewer schools had sufficient water for
           25). This means that in one out of five schools                     water supply available all year round in 2018                                         cleaning toilets and for bathing in 2018
           in South Sudan students and staff spent over 30
           minutes per roundtrip to collect water from sources                                                                                                       100

           located off premises. Availability throughout the
                                                                                                                                           No water source
           year is also a challenge in many countries. The 2018                                                                                                       80
                                                                                                                                                                                82
           school infrastructure diagnostic in Burundi showed                             24                                               Currently                                                 79
                                                                                                                                           broken down
           that just 24% of pre-primary, primary and secondary                                                                                                        60                                                 66
                                                                                                                                           Sometimes
           schools had a permanent year-round water supply,                                                                                broken down
                                                                                                                                                                                                                                             58
                                                                                                                        44
           18% had seasonal or irregular supplies, 14% had                                                                                                            40
                                                                                                                                           Irregular
           supplies that were currently or sometimes broken                          12
           down, and nearly half (44%) had no water source at                                                                              Permanent in the
                                                                                                                                                                      20
                                                                                                                                           rainy season only
           all (Figure 26).
                                                                                           6                                               Permanent all year
                                                                                                  8       6                                round                       0
           Even if water is available, it may not be sufficient to                                                                                                           Sufficient          Sufficient          Sufficient           Sufficient
           meet all of the school’s needs. For example, the 2018                                                                                                              water for          drinking            water for            water for
                                                                                                                                                                            handwashing           water           cleaning toilets         bathing
           Annual Education Statistics for Bhutan show that while
           82% of schools had sufficient water for handwashing
           and 79% had sufficient water for drinking, only 66%                      FIGURE 26 Availability of drinking water among pre-primary,                      FIGURE 27 Proportion of schools with sufficient water available for
                                                                                              primary and secondary schools in Burundi, 2018 (%)                               different purposes in Bhutan, 2018 (%)
           had sufficient water for cleaning toilets and 58% had
                                                                                                    Source: Diagnostic des infrastructures et équipements                            Source: Annual Education Statistics, Ministry of Education Policy
           sufficient water for bathing (Figure 27).                                                scolaires du Burundi (DNIES), Ministère de l’Education                           and Planning Division, Bhutan (2018)
                                                                                                    Burundi (2018)

24   PROGRESS ON DRINKING WATER, SANITATION AND HYGIENE IN SCHOOLS: Special focus on COVID-19
Relatively few countries routinely collect information on the quality of drinking water in
schools, but a recent World Vision survey of 12 countries in sub-Saharan Africa found
widespread faecal contamination and signficiant variation between different types of supply.
In rural schools, boreholes, piped water and rainwater were less likely to be contaminated
than other improved sources, such as protected wells and springs, and unimproved sources
were twice as likely to be very heavily contaminated (Figure 28).

Faecal contamination of drinking water supplies is widespread in rural schools
in 12 countries in sub-Saharan Africa

       Boreholes                                         68                                      15            8        9

            Piped                                  57                                  19                10          14

       Rainwater                                   54                             17                14             16

Other improved                                47                            18              14                  21

    Unimproved                  24                  14              19                              42

                     0                  20                    40                 60                      80                 100

E. coli contamination                        Low risk          Moderate risk            High risk             Very high risk
Colony forming units per 100 mL              (100)

FIGURE 28     Proportion of rural schools using different types of drinking water sources by risk of faecal
              contamination in 12 countries in sub-Saharan Africa, 2017 (%)
              Source: Survey of drinking water quality in rural schools in Ethiopia, Kenya, Rwanda, Uganda, United Republic of
              Tanzania, Ghana, Mali, Niger, Zambia, Malawi, Mozambique and Zimbabwe, World Vision (2017)

                                                                                                                                  SECTION 2   PROGRESS ON DRINKING WATER IN SCHOOLS   25
You can also read