Mt Piper Power Station Ash Placement Project - APPENDIX D HYDROLOGY AND WATER QUALITY - Energy Australia
←
→
Page content transcription
If your browser does not render page correctly, please read the page content below
Mt Piper Power Station
Ash Placement Project
APPENDIX D
HYDROLOGY AND WATER QUALITY
August 2010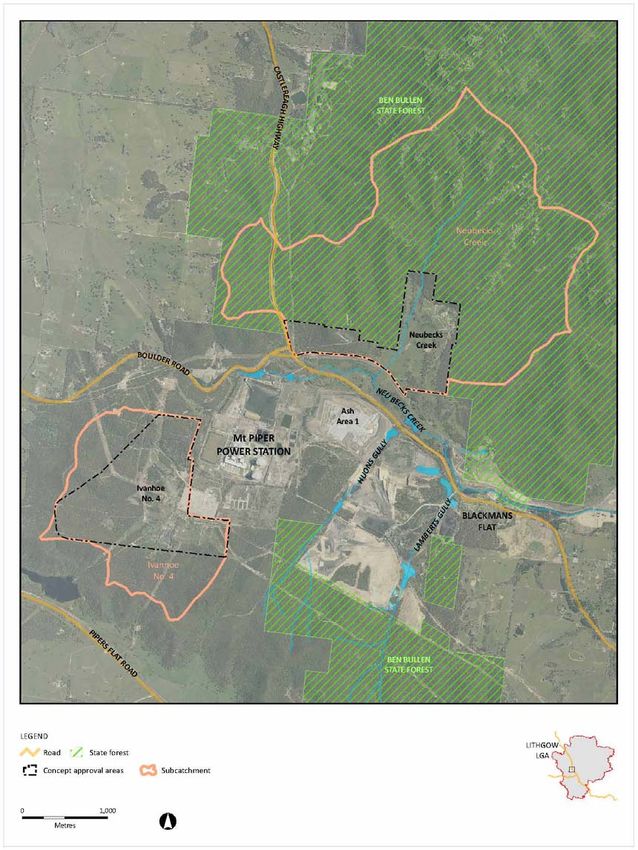
Mt Piper Power Station Ash Placement
Project
APPENDIX D
HYDROLOGY AND WATER QUALITY
August 2010
Sinclair Knight Merz
ABN 37 001 024 095
100 Christie Street
St Leonards NSW 2065 Australia
Postal Address
PO Box 164 St Leonards NSW 2065 Australia
Tel: +61 2 9928 2100
Fax: +61 2 9928 2500
Web: www.skmconsulting.com
LIMITATION: This report has been prepared on behalf of and for the exclusive use of Sinclair
Knight Merz Pty Ltd’s Client, and is subject to and issued in connection with the provisions of the
agreement between Sinclair Knight Merz and its Client. Sinclair Knight Merz accepts no liability or
responsibility whatsoever for or in respect of any use of or reliance upon this report by any third
party.
The SKM logo trade mark is a registered trade mark of Sinclair Knight Merz Pty Ltd.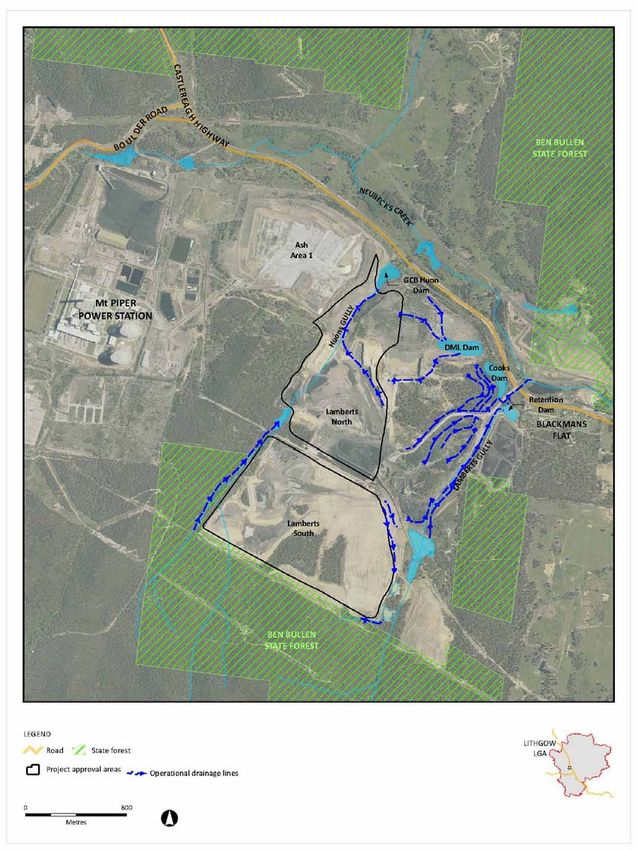
Mt Piper Power Station Ash Placement Project – Hydrology and Water Quality

Contents
1.       Introduction                                                                                                      1
         1.1.       Background                                                                                             1
         1.2.       Assessment Requirements                                                                                2
         1.3.       Approach                                                                                               3
2.       Surface Water Hydrology                                                                                           6
         2.1.       Regional Surface Water Hydrology                                                                      6
         2.2.       Local Surface Water Hydrology                                                                        10
         2.2.1.     Lamberts Gully                                                                                       10
         2.2.2.     Neubecks Creek and Ivanhoe No 4                                                                      14
         2.3.       Potential Impacts on Hydrology                                                                       16
         2.3.1.     Impacts on Regional Surface Water Hydrology                                                          16
         2.3.2.     Flooding Impacts                                                                                     17
         2.3.3.     Water Quality                                                                                        17
         2.3.4.     Cumulative Impacts                                                                                   18
         2.4.       Surface Water Management                                                                             18
         2.4.1.     Components of the Water Management System                                                            19
         2.4.2.     Water Balance Modelling                                                                              21
         2.4.3.     Water Balance Results                                                                                24
         2.4.4.     Neubecks Creek and Ivanhoe No 4                                                                      31
         2.5.       Conclusions                                                                                          32
         2.5.1.     Water Availability                                                                                   32
         2.5.2.     Flooding Impacts                                                                                     32
         2.5.3.     Water Quality                                                                                        32
3.       Groundwater                                                                                                     34
         3.1.       Geological environment                                                                               34
         3.1.1.     Regional Geology                                                                                     34
         3.1.2.     Mining Activities                                                                                    34
         3.1.3.     Soils and Landforms                                                                                  36
         3.1.4.     Regional hydrogeology                                                                                36
         3.2.       Previous investigations                                                                              37
         3.3.       Groundwater Modelling at Existing Ash Storage Area                                                   41
         3.4.       New Groundwater Drilling Program in Lamberts Gully                                                   42
         3.4.1.     Drilling methods                                                                                     42
         3.4.2.     Piezometer construction                                                                              43
         3.4.3.     Borehole BH 1                                                                                        44
         3.4.4.     Borehole BH 2                                                                                        45
         3.4.5.     Borehole BH 3                                                                                        45

SINCLAIR KNIGHT MERZ

I:\ENVR\Projects\EN02503\Deliverables\EA\Final for Exhibition\AppD_Mt Piper Ash_Hydrology and Water Quality_230810.doc   PAGE i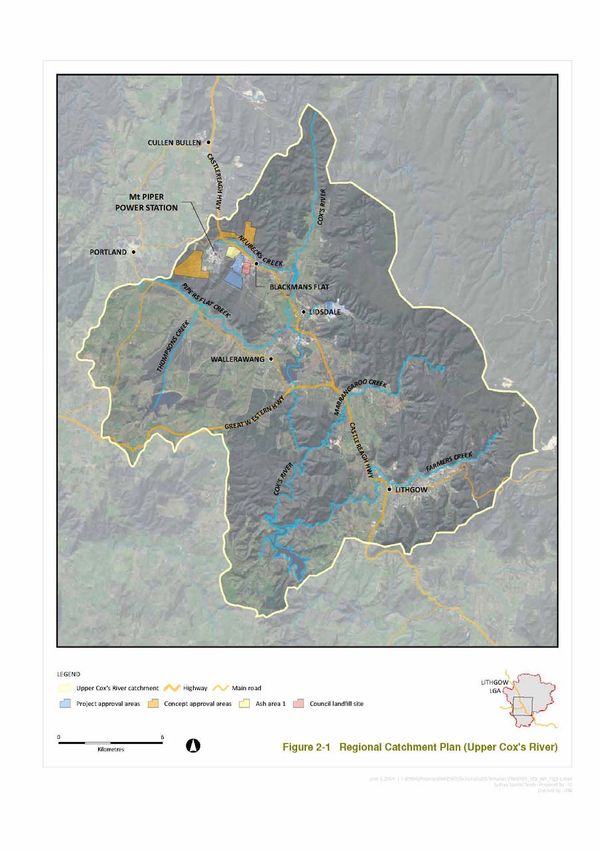
Mt Piper Power Station Ash Placement Project – Hydrology and Water Quality

         3.4.6.     Borehole BH 4                                                                                         46
         3.4.7.     Water quality                                                                                         46
         3.5.       Lamberts Gully Hydrogeology                                                                           47
         3.5.1.     Nature of the aquifer                                                                                 47
         3.5.2.     Lamberts North                                                                                        48
         3.5.3.     Lamberts South                                                                                        49
         3.5.4.     Conclusions                                                                                           49
         3.6.       Neubecks Creek and Ivanhoe No 4                                                                       50
4.       Surface water quality                                                                                           51
         4.1.       Assessment approach                                                                                   51
         4.2.       Existing Water Quality Conditions                                                                     51
         4.2.1.     Assessment of water quality                                                                           51
         4.2.2.     Surface Water Quality Neubecks Creek                                                                  53
         4.2.3.     Summary of findings                                                                                   57
5.       Impacts, Mitigation and Monitoring                                                                              59
         5.1.       Summary of Impacts                                                                                    59
         5.1.1.     Impacts on Surface Water Hydrology                                                                    59
         5.1.2.     Impacts on Groundwater                                                                                60
         5.1.3.     Surface Water Impacts                                                                                 62
         5.1.4.     Conclusion                                                                                            62
         5.2.       Operation                                                                                             63
         5.2.1.     Site Surface Water                                                                                    63
         5.2.2.     Groundwater                                                                                           64
         5.2.3.     Off-site Surface Water                                                                                65
         5.3.       Construction                                                                                          67
         5.3.1.     Construction Impacts                                                                                  67
         5.3.2.     Construction Environmental Safeguards                                                                 68
6.       References                                                                                                      70
Appendix A Bore Hole Data                                                                                                71

SINCLAIR KNIGHT MERZ

I:\ENVR\Projects\EN02503\Deliverables\EA\Final for Exhibition\AppD_Mt Piper Ash_Hydrology and Water Quality_230810.doc   PAGE ii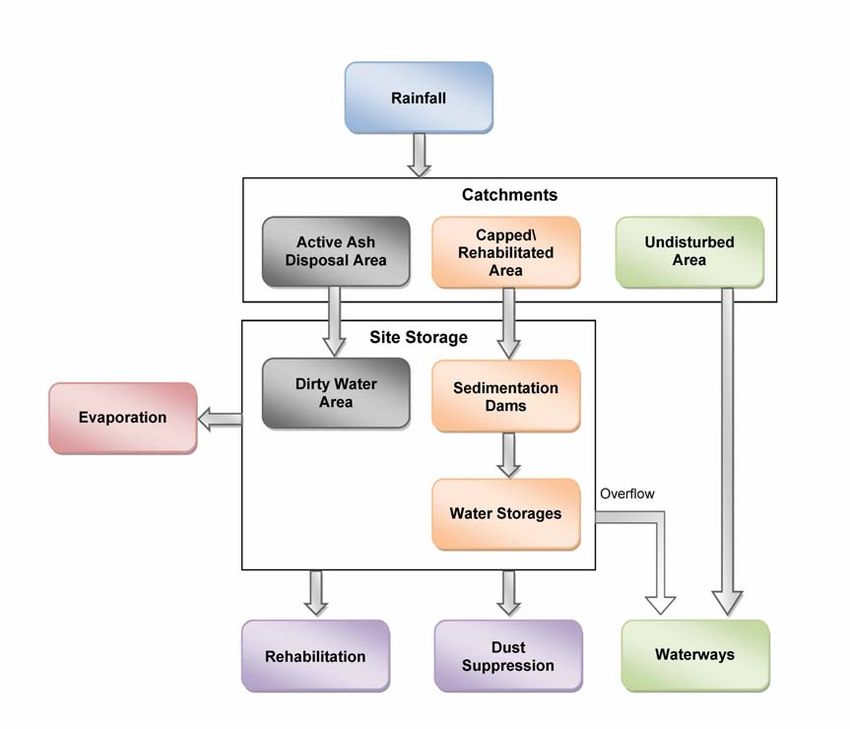
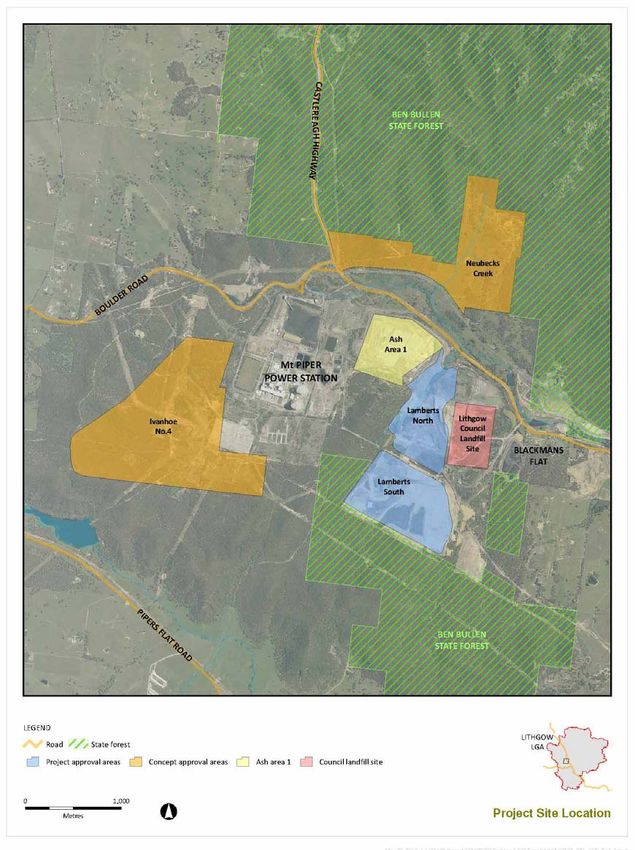
Mt Piper Power Station Ash Placement Project – Hydrology and Water Quality 1. Introduction 1.1. Background Delta Electricity owns and operates Mt Piper Power Station, a coal fired power station located approximately 17km north-west of Lithgow. As part of the operation of this power station, ash is created and required to be stored on-site, unless otherwise sold for beneficial reuse purposes. Delta has identified a need to expand its current ash placement facilities, which service the Mt Piper Power Station, to enable the further placement of ash once the existing ash storage area has reached capacity. Previous feasibility and site selection studies have selected four broad sites on which Delta is undertaking planning and assessment activities to obtain relevant approvals for ash placement. The four sites are described as: Lamberts North; Lambert South; Neubecks Creek; and Ivanhoe No. 4. With the ongoing operation of Units 1 and 2 at Mt Piper, the present ash placement area is expected to reach capacity within five to six years. Accordingly, there is a need to obtain development consent for ash placement beyond this time and throughout the power station’s economic life. As such, Delta is seeking Concept Approval and Project Approval for two of the proposed placement sites Lamberts North and Lamberts South and Concept Approval for the future development of Neubecks Creek and Ivanhoe No.4. Lamberts North and Lamberts South are currently being mined for coal and Project Approval is being sought for these sites to allow for their development for ash storage from around 2015. The ash storage available at Lamberts North and Lamberts South is sufficient to provide for the existing Mt Piper Power Station Units 1 and 2 until about 2042-2045, which is the effective life of the plant. A proposal to extend the generation capacity at the power station site by the construction of an additional 2000MW of gas or coal fired generation capacity was considered by the Department of Planning under Part 3A of the Environmental Planning and Assessment Act 1979 (EP&A Act). Concept approval was issued for the new power station, called Mt Piper Extension, on 12 January 2010. If the Mt Piper Extension project proceeds as a coal fired plant, the life of Lamberts North and Lamberts South would be less and they would effectively be filled by about 2026. SINCLAIR KNIGHT MERZ I:\ENVR\Projects\EN02503\Deliverables\EA\Final for Exhibition\AppD_Mt Piper Ash_Hydrology and Water Quality_230810.doc PAGE 1

Mt Piper Power Station Ash Placement Project – Hydrology and Water Quality
Concept approval only is being sought for Neubecks Creek and Ivanhoe No 4 as it is necessary to
provide additional ash storage should Mt Piper Extension proceed as a coal fired plant. Should Mt
Piper Extension proceed as a coal-fired plant project approval for the use of Neubecks Creek and
Ivanhoe No 4 as ash storage areas would be required before 2026.
The objectives of the proposal are:
To provide suitable ash placement areas to ensure the ongoing operation of the existing
power station beyond 2015, in order to maintain the existing level of power supply in NSW;
To provide sufficient storage areas for ash from the proposed Mt Piper Extension power
station should it be coal fired; and
To minimise and manage any environmental or social impacts which may result from the
construction and operation of the proposed ash placement areas.
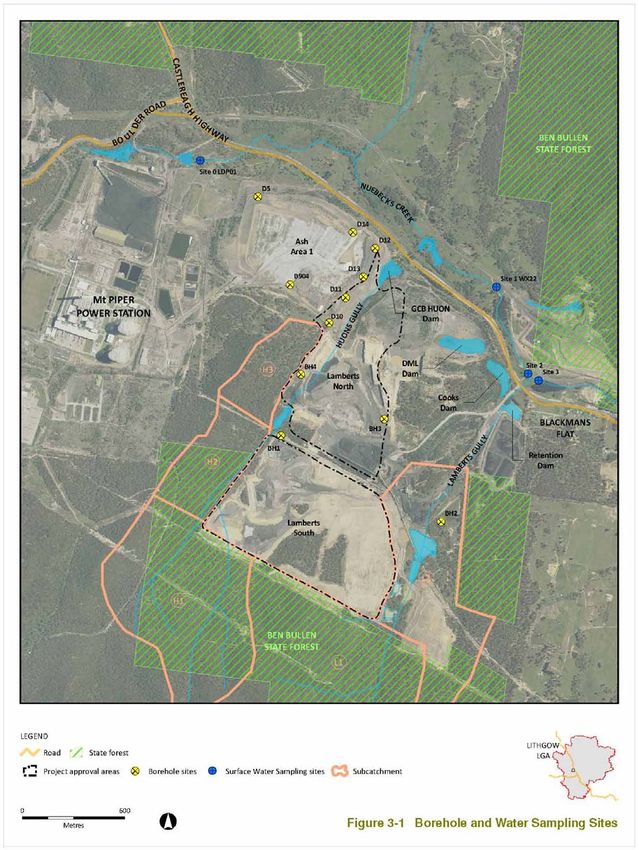
The general location of the Mt Piper Ash Placement areas is shown in Figure 1-1. Figure 1-2
shows the location of the Lamberts North and Lamberts South ash placement areas.
1.2. Assessment Requirements
The Director-General’s requirements for the Environmental Assessment were issued in February,
2010. The requirements specific to water management are:
For Neubecks Creek and Ivanhoe No 4 sites (concept plan application only) include an
analysis of potential surface water, hydrology, groundwater and water supply constraints to
the development of these sites including available mitigation and/or management options that
may be applied to achieve acceptable environmental outcomes, with consideration of
cumulative impacts from the project and other existing or proposed activities in close
proximity to the project site. The assessment must demonstrate sufficient water supply
availability to accommodate the requirements of the concept plan as a whole and that these
sites can be developed without significant risks to hydrology or groundwater resources, with
consideration to cumulative impacts. Key water related risk factors and/or design criteria
that would require further detailed investigation prior to the development of these sites must
be identified.
For the Lamberts North and Lamberts South sites the Environmental Assessment must
characterise and assess site hydrology and water management including drainage,
stormwater, flooding and water supply and provide an assessment of potential risks to surface
water and groundwater quality with consideration of relevant State policies and ANZECC
water quality guidelines. The water quality investigations must address the cumulative
impacts on water of the proposal in conjunction with other activities in the area such as
power generation, coal mining and a landfill, in particular the potential impact on the Coxs
River system, Huon Creek and Neubecks Creek. The Environmental Assessment must
SINCLAIR KNIGHT MERZ
I:\ENVR\Projects\EN02503\Deliverables\EA\Final for Exhibition\AppD_Mt Piper Ash_Hydrology and Water Quality_230810.doc PAGE 2Mt Piper Power Station Ash Placement Project – Hydrology and Water Quality
provide details of proposed water quality monitoring during construction and operation so as
to assess changes to the quality of receiving waters and the groundwater table.
Correspondence was also received from the NSW Office of Water and from the Sydney
Catchment Authority. Where relevant the requirements of these agencies are addressed in this
study.
1.3. Approach
This report addresses the requirements of the Director-General of Planning as follows:
Chapter 2 provides a review of surface water hydrology and identification of potential for
water quality impacts due to surface run-off in Neubecks Creek and Coxs River. A water
management system is described for the Lamberts North and Lamberts South sites to
demonstrate how water on the sites would be managed to minimise the risk of water
pollution in Neubecks Creek. Comments are made on the constraints to development and the
need for studies to be done to provide a water management system for Neubecks Creek and
Ivanhoe No 4 sites;
Chapter 3 reviews available information on groundwater quality and movement, using
existing bore hole data collected for the on-going monitoring of the existing ash storage area
(Area 1) and data from new bore holes drilled in Lamberts North and Lamberts South as part
of this study. It looks at the relative contribution to groundwater quality from past mine
workings and the existing ash storage area (Area 1), especially the placement of brine treated
ash. Based on data collection and modelling undertaken for Area 1 an assessment is made of
the potential for groundwater impacts to result from the use of Lamberts North and Lamberts
South as new ash storage areas. Comments are made on constraints to development and the
need for studies to be done to provide groundwater quality assessments for Neubecks Creek
and Ivanhoe No 4 sites;
Chapter 4 provides a review of available water quality data from Neubecks Creek and an
assessment of it against ANZECC/ARMCANZ (2000) Australian and New Zealand
Guidelines for Fresh and Marine Water Quality. It also provides an assessment of the
contribution to the existing water quality from groundwater inflow from mine workings and
the existing ash placement Area 1. Cumulative effects from other developments within the
Neubecks Creeks catchment are also considered;
Chapter 5 summarises the impacts on receiving water quality and identifies the measures
needed to mitigate any potential impacts on water quality during the life of the facility. It
outlines conceptual strategies to mitigate the potential impacts due to construction works and
the operation of the ash storage facilities. Monitoring plans are proposed in the context of
identifying impacts on water quality in Neubecks Creek from the placement of ash at
SINCLAIR KNIGHT MERZ
I:\ENVR\Projects\EN02503\Deliverables\EA\Final for Exhibition\AppD_Mt Piper Ash_Hydrology and Water Quality_230810.doc PAGE 3Mt Piper Power Station Ash Placement Project – Hydrology and Water Quality
Lamberts North and Lamberts South and providing a baseline for assessing potential impacts
from Neubecks Creek and Ivanhoe No 4 sites.
Figure 1-1 Study Area and Ash placement Sites
SINCLAIR KNIGHT MERZ
I:\ENVR\Projects\EN02503\Deliverables\EA\Final for Exhibition\AppD_Mt Piper Ash_Hydrology and Water Quality_230810.doc PAGE 4Mt Piper Power Station Ash Placement Project – Hydrology and Water Quality
Figure 1-2 Lamberts North and Lamberts South – Existing Site layout
SINCLAIR KNIGHT MERZ
I:\ENVR\Projects\EN02503\Deliverables\EA\Final for Exhibition\AppD_Mt Piper Ash_Hydrology and Water Quality_230810.doc PAGE 5Mt Piper Power Station Ash Placement Project – Hydrology and Water Quality
2. Surface Water Hydrology
2.1. Regional Surface Water Hydrology
The project investigation area is located within the Upper Coxs River Catchment. The main
drainage from the project area is Neubecks Creek (also known as Wangcol Creek) which drains
from the area west and north of Mt Piper Power Station to join the Coxs River north of Lidsdale.
The Upper Coxs River Catchment is 382 km2 in area and forms part of the Coxs River Catchment
which flows to Lake Burragorang (Warragamba Dam). The catchments are illustrated in Figure
2-1.
The Bureau of Meteorology (BoM) operates rainfall and evaporation gauges for several locations
in the vicinity of the project investigation area. The historical rainfall and evaporation records
were analysed to determine the climate at the Project investigation areas. A summary of the
rainfall and evaporation gauges is presented in Table 2-1.
Table 2-1 Rainfall and Evaporation Gauge Data
Gauge Number 063132 063079 063062 063005*
BoM Name Lidsdale (Maddox Sunny Corner Lithgow (Newnes Bathurst
Lane (Snowline) Forest Centre) Agricultural
Station
Open – Closed 1959 – present 1903 – present 1938 – 1999 1908 – present
No. of Years of Data 51 107 61 102
Location 3.4 km east of site 14 km west of site 18 km east of site 46 km west of
site
Latitude (South) -33.38 -33.39 -33.37 -33.43
Longitude (West) 150.08 149.90 150.24 149.56
Elevation (m) 890 1,220 1,050 713
Note: * Evaporation Gauge
Monthly rainfall and evaporation averages for the investigation area are presented in Figure 2-2.
The average annual rainfall for the area of the proposed ash placement facilities is 740 mm and
the average annual evaporation is 1350 mm. Rainfall is higher than evaporation for the Mt Piper
Area. The proposed ash placement facility will harvest rainfall runoff from the catchments of the
site, while the evaporation will be lost from water storages on the site. The water harvested from
the catchments of the site will exceed the evaporation lost from the water storages at times
through the year and therefore there will be water available on site to be used for dust suppression
and rehabilitation.
SINCLAIR KNIGHT MERZ
I:\ENVR\Projects\EN02503\Deliverables\EA\Final for Exhibition\AppD_Mt Piper Ash_Hydrology and Water Quality_230810.doc PAGE 6Mt Piper Power Station Ash Placement Project – Hydrology and Water Quality SINCLAIR KNIGHT MERZ I:\ENVR\Projects\EN02503\Deliverables\EA\Final for Exhibition\AppD_Mt Piper Ash_Hydrology and Water Quality_230810.doc PAGE 7
Mt Piper Power Station Ash Placement Project – Hydrology and Water Quality
Figure 2-2 Rainfall and Evaporation Data
Table 2-2 presents the statistics of the rainfall for the Lisdale (Maddox Lane) gauge. This table
shows the percentiles calculated for the historically recorded rainfall spanning the period from
1959 to present. These percentiles are percentages of the years that a certain amount of rainfall
has been received in the area.
The 5th and 10th percentile rainfall represent the dry periods, which received significantly below
average rainfall. The 10th percentile rainfall is 500 mm and this is 261 mm less than the average
annual rainfall for the area. Conversely, the 90th and 95th percentile represent wet periods when
there is significantly higher rainfall than the annual average. The 90th percentile rainfall is 942
mm which is 181 mm higher than the average annual rainfall.
SINCLAIR KNIGHT MERZ
I:\ENVR\Projects\EN02503\Deliverables\EA\Final for Exhibition\AppD_Mt Piper Ash_Hydrology and Water Quality_230810.doc PAGE 9Mt Piper Power Station Ash Placement Project – Hydrology and Water Quality
Table 2-2 Lidsdale (Maddox Lane) Rainfall Gauge Statistics
Statistic Annual Rainfall (mm)
Lowest Recorded 330
th
5 Percentile 463
th
10 Percentile 500
Average 761
50th Percentile (Median) 763
th
90 Percentile 942
th
95 Percentile 1,167
Highest Recorded 1,260
2.2. Local Surface Water Hydrology
2.2.1. Lamberts Gully
The project investigation area contains two waterways we have termed Huons Gully and
Lamberts Gully. These two gullies or waterways appear to have derived from the original
Lamberts Creek which was present when the Western Main Colliery holding was active. The
waterways have been disturbed by previous mining activities in the catchment. The location of
the original Lamberts Creek alignment is unclear but the existing drainage elements comprise
Huons Gully (known previously as Eastern Drain and more recently as Huons Creek) and
Lamberts Gully which both drain from south to north, with the headwaters of both waterways in
the Ben Bullen State Forest (see Figure 2-3). Huons Gully drains to a large pond known as
Huons Pond or Groundwater Collection basin (GCB), an impoundment which is not connected to
Neubecks Creek. The water from the GCB is used for various purposes on the site and is pumped
to other dams.
Lamberts Gully drains through the existing Lamberts Gully Coal Mine and then into Neubecks
Creek. The Lamberts Gully area lies within the Western Main Colliery and since the 1940s this
area has been worked by shallow underground and open cut mining. A summary of these
waterways has been presented in Table 2-3.
Table 2-3 Catchment Summary
Catchment Areas Waterway
Huons Gully Lamberts Gully
2
Total Catchment Area (km ) 2.11 3.00
Catchment Area Upstream of Proposed 1.15 2.59
Ash Placement Area (km2)
Catchment Previously Disturbed By 0.96 0.86
Mining (km2)
SINCLAIR KNIGHT MERZ
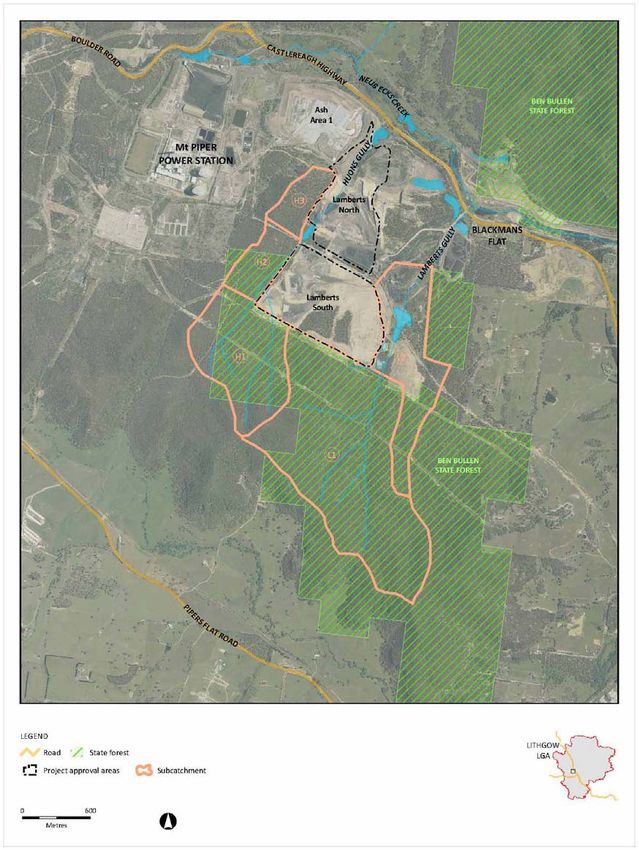
I:\ENVR\Projects\EN02503\Deliverables\EA\Final for Exhibition\AppD_Mt Piper Ash_Hydrology and Water Quality_230810.doc PAGE 10Mt Piper Power Station Ash Placement Project – Hydrology and Water Quality Area of Proposed Ash Placement (km2) 0.96 0.41 Catchments Delineation The flows for Huons Gully and Lamberts Gully were determined assuming 100 % of the disturbed areas would be managed on site. The catchments breakdown is shown in Figure 2-3 and a summary of the catchment areas is presented in Table 2-4. Table 2-4 Hydrologic Model Parameters Catchment Area (km2) H1 0.74 H2 0.23 H3 0.18 L1 1.92 L2 0.67 Design Rainfall Depths The design intensity-duration-frequency (IFD) rainfall curve was developed for the proposed ash placement facility at Lamberts North and Lamberts South. The IFD information was developed from Australian Rainfall and Runoff Volume 1 (Engineers Australia) and is shown in Figure 2-4. SINCLAIR KNIGHT MERZ I:\ENVR\Projects\EN02503\Deliverables\EA\Final for Exhibition\AppD_Mt Piper Ash_Hydrology and Water Quality_230810.doc PAGE 11
Mt Piper Power Station Ash Placement Project – Hydrology and Water Quality
Figure 2-3 Lamberts North and Lamberts South Catchment
SINCLAIR KNIGHT MERZ
I:\ENVR\Projects\EN02503\Deliverables\EA\Final for Exhibition\AppD_Mt Piper Ash_Hydrology and Water Quality_230810.doc PAGE 12Mt Piper Power Station Ash Placement Project – Hydrology and Water Quality
Figure 2-4 IFD Rainfall Information
Design Flow
There was no stream flow gauging information for the waterways in the project investigation
area. Therefore, the estimation of the design flows was undertaken using the Rational Method
from the Australian Rainfall and Runoff Volume 1 (Engineers Australia) for Eastern New South
Wales.
The parameters for the Rational Method Calculation is presented in Table 2-5 and the peak flows
for the 2, 10 and 100 year Average Recurrence Interval (ARI) flood events are presented in Table
2-6.
SINCLAIR KNIGHT MERZ
I:\ENVR\Projects\EN02503\Deliverables\EA\Final for Exhibition\AppD_Mt Piper Ash_Hydrology and Water Quality_230810.doc PAGE 13Mt Piper Power Station Ash Placement Project – Hydrology and Water Quality
Table 2-5 Rational Method Catchment Parameters
Parameter Huons Gully Lamberts Gully
2
Catchment Area (km ) 1.15 1.92
C10 0.40 0.40
FF2 0.70 0.70
FF10 1.00 1.00
FF100 1.50 1.50
Time of Concentration (minutes) 50 60
Average Intensity for Time of 55.0 50.4
Concentration (mm/hr) 100 Year ARI
Average Intensity for Time of 35.0 33.5
Concentration (mm/hr) 100 Year ARI
Average Intensity for Time of 23.6 25.0
Concentration (mm/hr) 100 Year ARI
Table 2-6 Peak Flows
ARI Huons Gully (m3/s) Lamberts Gully (m3/s)
2 2.2 3.5
10 3.5 7.2
100 10.6 16.1
2.2.2. Neubecks Creek and Ivanhoe No 4
The Ivanhoe No. 4 area includes a number of drainage lines. The catchment for these drainage
lines in the drain from the ridge that is on the western and southern sides of the Ivanhoe No. 4
Concept Area. The drainage lines drain from this ridge north and east through the Ivanhoe No. 4
Concept Area. The drainage lines combine and continue to drain north-east to the western arm of
Neubecks Creek.
The Neubecks Creek area includes a number of drainage lines and the northern arm of Neubecks
Creek. The catchment for these drainage lines and Neubecks Creek drain from North to South.
The drainage lines combines with Neubecks Creek, which continues to flow east.
The catchments are illustrated in Figure 2-5 and a summary of the catchment areas are presented
in Table 2-7.
SINCLAIR KNIGHT MERZ
I:\ENVR\Projects\EN02503\Deliverables\EA\Final for Exhibition\AppD_Mt Piper Ash_Hydrology and Water Quality_230810.doc PAGE 14Mt Piper Power Station Ash Placement Project – Hydrology and Water Quality
Figure 2-5 Neubecks Creek and Ivanhoe No 4 – Site
Catchments
SINCLAIR KNIGHT MERZ
I:\ENVR\Projects\EN02503\Deliverables\EA\Final for Exhibition\AppD_Mt Piper Ash_Hydrology and Water Quality_230810.doc PAGE 15Mt Piper Power Station Ash Placement Project – Hydrology and Water Quality
Table 2-7 Catchment Summary
Catchment Areas Concept Areas
Ivanhoe No. 4 Neubecks Creek
Total Catchment Area to Downstream 3.2 8.5
Extent of Concept Area (km2)
Catchment Area Upstream of Concept 1.9 7.3
Area (km2)
Area of Concept Area (km2) 1.3 1.2
2.3. Potential Impacts on Hydrology
The project has the potential to affect surface water resources in the vicinity of the project sites
including:
Changes to flooding characteristics;
Changes to regional surface water hydrology in terms of water availability;
Impacts on water quality; and
Cumulative impacts.
2.3.1. Impacts on Regional Surface Water Hydrology
The development of the proposed ash placement facility has the potential to affect the water
availability of the Upper Coxs River Catchment in two ways, by:
Reducing the volume of runoff to the Coxs River by reducing the catchment area; and
Requiring external water sources to supply water demands at the proposed ash placement
facility.
The project investigation area for the Lamberts North and Lamberts South ash placement
facilities is 1.4 km2, which is approximately 0.4 % of the Upper Cox River catchment (382 km2).
This is only a very small portion of the Upper Cox River Catchment and development of the ash
placement areas would have negligible impact on the catchment in terms of water availability. As
the Lamberts Gully project investigation area has been previously disturbed by mining, the runoff
from the water has already been removed from the Upper Cox River Catchment.
The Ivanhoe No. 4 area is 1.9 km2 and the Neubecks Creek area is 1.2 km2. This equates to
approximately 0.4 % and 0.3 % of the Upper Cox River Catchment for Ivanhoe No. 4 and the
Neubecks Creek areas respectively. These are only very small portions of the Upper Cox River
Catchment and will have negligible impact on the water catchment in terms of water availability.
SINCLAIR KNIGHT MERZ
I:\ENVR\Projects\EN02503\Deliverables\EA\Final for Exhibition\AppD_Mt Piper Ash_Hydrology and Water Quality_230810.doc PAGE 16Mt Piper Power Station Ash Placement Project – Hydrology and Water Quality
The development of the ash placement facility requires water to be used for rehabilitation and
dust suppression to supply to the operation. The water for the demands of the proposed ash
placement would be sourced from water harvested from the disturbed areas of the proposed ash
placement facility, as occurs at the existing ash Area 1. This would be achieved by the
development of a site water management system, which is outlined for Lamberts North and
Lamberts South in Section 2-4. A similar system would be required for Neubecks Creek and
Ivanhoe No 4 sites, using the same principles of sourcing all water needs from the ash storage
area.
2.3.2. Flooding Impacts
The development of the ash disposal facility has the potential to affect the flooding regime of the
local creeks by modifying the landform of the area to include the proposed ash placement facility.
The potential for flooding impacts is mostly likely due to the upstream catchments of the ash
placement facility. The development of the site water management system would include
diversion drains to separate clean water from undisturbed catchments upstream of the proposed
ash placement facility. The diversion drains would be designed to convey the 100 year ARI flood
event. This is outlined in site water management system for Lamberts North and Lamberts South
in Section 2-4. Similar arrangements would apply for Neubecks Creek and Ivanhoe No 4 sites.
2.3.3. Water Quality
As the proposed ash placement facility is located in the Upper Coxs River Catchment, releases of
water from the site would have the potential to affect the water quality of the Coxs River. The
proposed ash placement facility would generate water contaminated by sediment. The site water
management system would be designed to manage the contaminated water from the site and
minimise the risk of affecting the water quality of the Coxs River by:
Separating clean water from undisturbed catchments and dirty water on the site;
Managing the dirty water generated on site, based on the contaminants including sediment
dams for runoff containing sediment laden water and a dirty water area for water containing
runoff from the exposed ash placement areas;
Allowing no regular controlled releases from the site;
Reusing the water generated on site to satisfy the demands for rehabilitation and dust
suppression; and
Allowing water releases from sedimentation dams only in large rainfall events and only after
the water has been treated (by settlement) through the dams.
SINCLAIR KNIGHT MERZ
I:\ENVR\Projects\EN02503\Deliverables\EA\Final for Exhibition\AppD_Mt Piper Ash_Hydrology and Water Quality_230810.doc PAGE 17Mt Piper Power Station Ash Placement Project – Hydrology and Water Quality
2.3.4. Cumulative Impacts
The development of the proposed ash placement facilities represents only a small portion of the
Upper Cox River Catchment. However, a number of small areas affected can lead to a significant
impact to the catchment if the catchment is not considered as a whole. The development of the
proposed ash placement facility has the potential to add to the cumulative impact on the
catchment in terms of water quality and water availability.
As discussed above, the sites would have a water management system, which would result in the
potential impacts on water quality from the site operations being very low. Other inputs to the
cumulative water quality impacts in Neubecks Creek are addressed in more detail in Chapter 4,
where contributions to the water quality from the groundwater and from elsewhere within the
Neubecks Creek catchment are considered.
The proposed ash placement facility at Lamberts North and Lamberts South has previously been
disturbed by mining and therefore the area has already been removed from contributing runoff to
the Upper Cox River Catchment. The catchment areas of the Neubecks Creek and Ivanhoe No 4
sites are very small relative to the Upper Coxs River catchment.
The proposed ash placement facilities would not require water allocations or licences to operate,
as the facilities would be supplied by the water harvested from the disturbed areas of the sites.
Therefore, the development of the proposed ash placement facilities would not affect the water
availability of the Upper Coxs River Catchment.
2.4. Surface Water Management
The philosophy of the water management strategy is to provide adequate water to the proposed
ash storage facility to operate successfully while minimising environmental impacts by collecting
and managing dirty runoff water. A Water Management System will be developed with the
following key principles:
Stormwater runoff from undisturbed areas surrounding the Project site to be diverted away
from disturbed areas and released directly into adjacent waterways;
Design of any drainage systems operating for the life of the project to ensure erosion is
minimised;
Staging ash placement to minimise the operational area exposed at any one time to reduce the
potential for erosion;
Separating sediment-containing stormwater from other sources of polluted water on the site
such as the ash placement area;
Incorporating the reuse of contaminated stormwater into the overall water management
strategy for the project to meet the demands for rehabilitation and dust suppression; and
SINCLAIR KNIGHT MERZ
I:\ENVR\Projects\EN02503\Deliverables\EA\Final for Exhibition\AppD_Mt Piper Ash_Hydrology and Water Quality_230810.doc PAGE 18Mt Piper Power Station Ash Placement Project – Hydrology and Water Quality
Minimising the extent and duration of disturbed areas by implementing a progressive
rehabilitation strategy including prompt stabilisation of landforms.
The water management system proposed for Lamberts North and Lamberts South is described in
the sections following.
2.4.1. Components of the Water Management System
The key elements of the water management system are:
sediment dams;
dirty water area storage;
water storages; and
diversion drains.
Rainfall runoff on the proposed ash placement facility would be managed by a series of sediment
dams, water storages, a Dirty Water Storage Area and diversion drains. Water collected in the
Dirty Water Storage Area will be used for rehabilitation and dust suppression. As the ash
placement areas are progressively capped and rehabilitated, the runoff from these areas would be
directed to sediment dams.
Sediment Dams
Sediment dams would be required to entrap soil and other particles eroded from rehabilitated
areas due to rainfall runoff. There would be a number of sediment dams which accept the runoff
from capped and rehabilitated areas of both Lamberts North and Lamberts South.
The sediment dams would provide additional storage for water captured on site and water from
the sedimentation dams would be used for rehabilitation and dust suppression. There would be
no planned releases from the sediment dams to natural waterways off-site.
The sedimentation dams would be designed in accordance with the guidelines from the NSW
Department of Environment, Climate Change and Water Managing Urban Stormwater, Soils and
Construction, Volume 2E Mines and Quarries (2008).
SINCLAIR KNIGHT MERZ
I:\ENVR\Projects\EN02503\Deliverables\EA\Final for Exhibition\AppD_Mt Piper Ash_Hydrology and Water Quality_230810.doc PAGE 19Mt Piper Power Station Ash Placement Project – Hydrology and Water Quality
Dirty Water Storage Area
The Dirty Water Storage Area would be used to collect and store rainfall runoff from the active
ash placement area. The excess runoff stored in this area would be used for rehabilitation and
dust suppression as required. The Dirty Water Storage Area would be required to have a storage
capacity in excess of 500 ML and would move with the progression of the active ash placement
area.
Water Storages
There is a number of existing water storages on project site which would be utilised as part of the
Site Water Management System which would apply to Lamberts North. The existing water
storages on the site and their characteristics are shown in Figure 1-2 and presented in Table 2-8.
These storages were included as they are currently present on site. If they are not available, then
alternative dams of similar dimensions would be constructed.
Table 2-8 Water Storage Characteristics
Storage Function in Water Volume (ML) Surface Area (m2)
(name as shown in Management Strategy
Figure 1-2)
Huon Dam or GCB Emergency water storage in 16.8 8,400
large rainfall events
DML Dam Accepts runoff from Lamberts 15.9 15,870
North rehabilitated area
Cooks Dam Accepts runoff from existing 69.9 11,650
(Sediment Control Area 1 rehabilitated area
Dam) Accepts overflow from DML
Dam
Retention Dam Accepts overflow from 4.6 4,600
sediment dams
The water storages are to be used as part of the management system for sediment only
contaminated runoff from the capped and rehabilitated areas of the proposed ash placement
facility. The Retention Dam is the dam at the bottom of the system and is not designed to have
any planned releases to the waterway.
Similar dam structures are shown as existing in the Lamberts South area. Either these dams may
be used or similar dams created closer to the time they are required. The assessment undertaken
for the site water management system identifies the capacity required for these dams rather than
the suitability of those present.
Diversion Drains
There is an external catchment to the proposed ash placement facility, which is undisturbed land
in the Ben Bullen State forest. Diversion drains would be included in the proposed ash placement
SINCLAIR KNIGHT MERZ
I:\ENVR\Projects\EN02503\Deliverables\EA\Final for Exhibition\AppD_Mt Piper Ash_Hydrology and Water Quality_230810.doc PAGE 20Mt Piper Power Station Ash Placement Project – Hydrology and Water Quality
areas to manage clean water runoff from catchment external to the disturbed areas. The diversion
drains would be designed to convey the 100 year ARI flood event from the external catchments.
The estimates of the designed flows are presented in Section 2.2.1.
2.4.2. Water Balance Modelling
The performance of the water management system for Lamberts North and Lamberts South was
assessed for the operation of the existing Mt Piper Power Station (Units 1 and 2) and for the
operation of Units 1 and 2 with the operation of Mt Piper Extension should it be coal fired. The
modelling software program GoldSim was used. GoldSim is a software package developed by
the GoldSim Technology Group to model continuous systems and has the ability to track the
movement of water with time based inputs and operating rules.
The water balance model was established at a daily resolution and developed to predict the
operation of the proposed water management system. The results of the water balance illustrate
the project’s capacity to manage weather extremes over the 30 year project life. The objectives of
the water balance are to:
Control the release of water from the storages so that that releases occur in a manner that
minimises impacts upon downstream users and the environment;
Manage dam storages so as to have enough water to adequately supply the demands for
rehabilitation and dust suppression;
Control and manage the separation and use of clean and dirty water.
The water balance model was developed from a schematisation of the water management system,
based on the component descriptions outlined below. The water balance model schematisation is
illustrated in Figure 2-6.
The water balance model was based on stochastic rainfall generation. The purpose of the
stochastic rainfall generation is to develop a range of climate sequences for the life of the project
based on the recorded historical rainfall data of the Project area. The stochastic rainfall data was
generated from recorded historical data using the Stochastic Climate Library for 500 replicates
over a 30 year sequences of daily rainfall data. This method allows assessment of a wide range of
rainfall sequences which may be experienced over the life of the project and the calculation of a
range of exceedance probabilities.
The use of stochastic rainfall in the water balance modelling captures the variability and
uncertainty in climatic conditions. The stochastic rainfall developed simulates both ends of the
climatic spectrum, including extremely wet and extremely dry conditions as well as above
average, below average and average rainfall conditions. The stochastic rainfall data also accounts
for the seasonal variability of rainfall for the area. The stochastic rainfall is generated to have the
same statistical profile as the historically recorded rainfall.
SINCLAIR KNIGHT MERZ
I:\ENVR\Projects\EN02503\Deliverables\EA\Final for Exhibition\AppD_Mt Piper Ash_Hydrology and Water Quality_230810.doc PAGE 21Mt Piper Power Station Ash Placement Project – Hydrology and Water Quality
The stochastic rainfall data for the project site was developed based on the rainfall gauges
Lidsdale (Maddox Lane) rainfall gauge (063132) outlined in Table 2-9.
Table 2-9 Rainfall Gauge for Stochastic Rainfall Generation
Gauge Gauge Period of Data Application Comments
No. Name Record
063132 Lidsdale 1959-2010 Daily Project Site 3.4 km south-east of
(Maddox rainfall (downstream) of Project Site
Lane)
Figure 2-6 Water Balance Model Schematic
The water balance model generates runoff based on a conceptual soil storage capacity and base
flow index. The soil storage capacity represents the depth of soil storage, which must be filled
before runoff occurs. This soil storage capacity was applied based on land use. The base flow
SINCLAIR KNIGHT MERZ
I:\ENVR\Projects\EN02503\Deliverables\EA\Final for Exhibition\AppD_Mt Piper Ash_Hydrology and Water Quality_230810.doc PAGE 22Mt Piper Power Station Ash Placement Project – Hydrology and Water Quality
index designates the rainfall that becomes surface runoff and a proportion that goes to
groundwater. Table 2-10 outlines the conceptual soil storage capacities and base flow index for
project site.
Table 2-10 Conceptual Soil Storage Capacity Parameters
Land Use Soil Storage Capacity (mm) Baseflow Index (%)
Exposed Ash Area 20 10
Capped\Rehabilitated area 70 10
Disturbed Area 95 10
The conceptual soil storage capacity is an average of the overall soil storage capacity, which is
represented as a shallow, medium and deep soil store.
Table 2-11 outlines the water balance model inputs and demands assumed for the project.
Table 2-11 Water Balance Modelling Inputs and Demands
Variable Description
Rainfall Lidsdale (Maddox Lane) (0630132)
INPUTS
Runoff Rainfall converted to runoff via conceptual soil storages dependant
on land uses on the site.
Groundwater Groundwater seepage was ignored based on the very low inflows
predicted.
Evaporation Monthly average total evaporation was developed for the gauge at
Bathurst Agricultural Station (063005). This gauge covers the
DEMANDS
historical period of 1908 to 2010.
Storage seepage Ignored for conservatism.
Rehabilitation and Dust Demand of 250 kL/day for Mt Piper 1&2 and 450 kL/day for Mt
Suppression Piper 1&2 and Mt Piper Extension.
The demand for the proposed ash placement facility is 250 KL/day and 450 kL/day, which is for
dust suppression and rehabilitation. The ash is conditioned to approximately 18% moisture
content prior to transport using either freshwater or brine. The water demand for the conditioning
of the ash has not been considered as part of this assessment as it is reuse water from the power
station operations and is applied to ash before it is transported to the placement site.
Catchment areas have been developed for the proposed ash placement facility. These catchments
have been based on the proposed staging of the ash placement over the life of the project. A
summary of the catchment area is presented in Table 2-12. It has been assumed that runoff from
successfully rehabilitated areas, after five years of rehabilitation, will be allowed to be diverted
away from sediment dams and allowed to drain to the natural waterways.
SINCLAIR KNIGHT MERZ
I:\ENVR\Projects\EN02503\Deliverables\EA\Final for Exhibition\AppD_Mt Piper Ash_Hydrology and Water Quality_230810.doc PAGE 23Mt Piper Power Station Ash Placement Project – Hydrology and Water Quality
Table 2-12 Catchments Areas
Area (ha) Existing Mt Piper Project Mt Piper Extension Project
Ash Area 1 50 Rehabilitated at the beginning of Rehabilitated at the beginning of the
the Project Life. Project Life.
Lambert North 50 Active ash placement and Active ash placement and
progressively rehabilitated progressively rehabilitated between
between the year 0 and 13. the year 0 and 15.
(2015 – 2028) (2015 – 2020)
Lambert South 64 Active ash placement and Active ash placement and
progressively rehabilitated progressively rehabilitated between
between the year 13 and 30. the year 6 and 10.
(2028 – 2045) (2021 – 2026)
Exposed Ash 18 Moving active areas for the 30 Moving active areas for the 10 year
Area year Project life. Project life.
The storages of the existing Mine Water Management System have been sized either for
operational or runoff control depending on their purpose. A summary of the storages and their
sizing is shown in Table 2-13.
Table 2-13 Summary of Water Management System Storages
Storage Volume (ML)
Huon Dam 16.8
DML Dam 15.9
Cooks Dam 69.9
Retention Dam 4.6
Sediment Dams (total capacity required for all sediment dams) 400
Dirty Water Area > 500
2.4.3. Water Balance Results
The water balance model was used to predict the reliability of the demands for the operations
including the rehabilitation and dust suppression demands. The model also predicts the adequacy
of the site storage to manage extreme rainfall events. The model was run for the 30 year ash
placement sequence which equates to 10,958 days. There were 500 climate sequences of 30 year
run for the project life, which equals 15,000 years of simulated project life for the proposed ash
placement facility.
Water Supply Reliability – Existing Mt Piper Project
Water is required for the rehabilitation and the dust suppression demands for the project site. The
rehabilitation and dust suppression water demand varies depending on the amount of rainfall
received at the site. More rainfall means less watering required for dust suppression and
SINCLAIR KNIGHT MERZ
I:\ENVR\Projects\EN02503\Deliverables\EA\Final for Exhibition\AppD_Mt Piper Ash_Hydrology and Water Quality_230810.doc PAGE 24Mt Piper Power Station Ash Placement Project – Hydrology and Water Quality
rehabilitation. The water balance modelling assumes a constant daily water demand of 250
kL/day for Mt Piper Power Station, regardless of ash generated or local rainfall. The modelling
results are presented in two ways:
The overall project reliability – which calculates the total number of days in the 30 year
project life in which demand is fully satisfied; and
The annual reliability – which assesses the number of days per year that the demand is fully
supplied. This provides an added level of detail to assess which specific phase of the project
may have the potential for water storage.
For overall project reliability - The water balance model predicts the average dust suppression
and rehabilitation reliability for the project life is 82%. Therefore, on average the daily dust
suppression and rehabilitation demand is predicted to be satisfied 82% of the days of the project
life, assuming maximum daily water use indicated above. On the other 18% of days the water
available would be less than the 250 kL/day.
For annual reliability - The water supply reliability was assessed for a range of different
likelihoods i.e. the chance of the risk of water shortage occurring. The aim of this type of
assessment is to look at the results with the potential for water shortage and determine how likely
that is to occur.
Figure 2-7 shows the exceedance probabilities for the water supply rehabilitation and dust
suppression demand. This figure illustrates the likelihood of supplying the water demand, for
rehabilitation and dust suppression, in terms of percentage of days in each year the demand is
satisfied. This result shows that there is a 50 % chance that the water availability to fully supply
the demand for rehabilitation and dust suppression demand between is 300 to 354 days in any
given year. Therefore, if the project site were to receive the median rainfall (50th percentile
rainfall as outlined in Table 2-2), the water demand of 250 kL/day would be fully satisfied for
300-354 days in any given year. This is represented as the blue line in the figure. The site
therefore has an ability to supply a high degree of water supply reliability to the proposed ash
placement facility. A water supply reliability of 300 to 354 days (81 – 97 % of days) is generally
considered medium to high security for water supply reliability.
If the rainfall received at the project site was significantly below average (10th percentile rainfall
as outlined in Table 2-2), the water balance model predicts there is only a 10 % chance that the
proposed ash placement facility will be able to fully supply the water required for 150 to 240 of
the days in the year (this is the green line). These numbers are presented as a range because every
year is different in terms of how the rainfall occurs and how the site is operated. When rainfall is
significantly below average there is only a 1 in 10 chance that in any year the operation will be
able to fully supply the demands for fewer than about 180 days (ie when rainfall is significantly
SINCLAIR KNIGHT MERZ
I:\ENVR\Projects\EN02503\Deliverables\EA\Final for Exhibition\AppD_Mt Piper Ash_Hydrology and Water Quality_230810.doc PAGE 25Mt Piper Power Station Ash Placement Project – Hydrology and Water Quality
below average, for half of the year the full quota of 250 kL/day is able to be supplied; for the
other half of the year there is only a 10% chance that the full quota will be provided or a 90%
chance that the rainfall will be less than the full quota). Overall, there is a low likelihood that the
full water requirement may only be supplied for approximately half the time of the operation.
As discussed below the minimum requirement for dust management on the site is 120 kL/day.
There would be a substantially reduced risk of being able to provide 120 kL/day compared with
250 kL/day indicating, when linked to strict management of water storages, a moderate to high
likelihood that the 120 kL/day would always be available.
Figure 2-7 Water Availability for Rehabilitation and Dust Suppression Demand
The water balance modelling predicts there will be suitable water availability to supply the
rehabilitation and dust suppression demand for the proposed ash placement facility. The
consequence of a shortfall of water to supply rehabilitation is minor in that during periods of
median rainfall the shortfall would occur on no more than 3-19% of days of the year and during
very low rainfall the shortfall would occur on no more than one half of the days of the year. The
reliability of water supplied for rehabilitation is calculated on a daily basis and in the event of a
SINCLAIR KNIGHT MERZ
I:\ENVR\Projects\EN02503\Deliverables\EA\Final for Exhibition\AppD_Mt Piper Ash_Hydrology and Water Quality_230810.doc PAGE 26Mt Piper Power Station Ash Placement Project – Hydrology and Water Quality
shortfall occurring on a given day alternative management processes exist for use on that given
day or series of days.
As part of the Water Management System development, a component will be to manage times of
low availability of water on site. Water management in very low availability conditions would
comprise:
Controlling dust by minimising work areas and using DUSTEX instead of water. The most
distant and least used areas (about 40%) would be capped with a thin layer of overburden.
The remaining areas would be capped with sealant such as DUSTEX, thus allowing the
sprinklers to be turned off as no water would be required, with labour and time dedicated to
keeping the temporary capping intact. The working areas would be minimised and rotated to
allow continued placement without affecting production. The method would involve a small
area or pad for placement and ash would be progressively placed until the pad reaches
optimum height. The pad would then be coated with DUSTEX and the ash placement moved
to a different working area. Working areas could be rotated indefinitely by placing temporary
capping and placing ash over previously capped areas;
The use of water only for the management of roads and some working areas. Water carts
would be used to supply about 40 kL/hr for 3 hours per day (120 kL/day or less than half of
the nominated daily volume of water required). It should be noted that about 20% of the
water cart water is sourced from dirty water ponds and surface drains. This will reduce
demand on water by minimising usage, while maintaining an effective system for gathering
all water from the site.
Water requirements for rehabilitation are minimised by the use of native plants of local
provenance, ie species which are hardy and drought tolerant. In the case of extreme conditions, no
water would be available but these plants would be no worse off than the surrounding flora.
All of these activities form part of the current water management strategy for ash placement at Mt
Piper Power Stations and reflect the local water situation. Should the Mt Piper Power Station and
Mt Piper Extension be operating together during very low availability conditions, the water
management procedures for ash placement and the minimum water requirements of 120 kL/day
would be the same. Work face areas and access roads for the two plants operating would be
similar, although the placement rate would be higher.
Water Supply Reliability – Mt Piper Extension Project
Water is required for the rehabilitation and the dust suppression demands for the project site. The
rehabilitation and dust suppression demand varies depending on the amount of rainfall received at
the site. For the overall project reliability the water balance model assumes a constant daily
demand of 450 kL/day for Mt Piper and Mt Piper Extension power stations together, regardless of
actual need when ash production is low or local rainfall is occurring. The water balance model
SINCLAIR KNIGHT MERZ
I:\ENVR\Projects\EN02503\Deliverables\EA\Final for Exhibition\AppD_Mt Piper Ash_Hydrology and Water Quality_230810.doc PAGE 27Mt Piper Power Station Ash Placement Project – Hydrology and Water Quality predicts the average dust suppression and rehabilitation reliability for the project life is 80%. Therefore, on average the dust suppression and rehabilitation demand is predicted to be satisfied 80% of the days of the project life. For the annual reliability assessment Figure 2-8 shows the exceedance probabilities for the water supply rehabilitation and dust suppression demand. This figure illustrates the likelihood of supplying the water demand, for rehabilitation and dust suppression, in terms of percentage of days in each year the demand is satisfied. This result shows that there is a 50 % chance that the water availability to fully supply the demand for rehabilitation and dust suppression demand between 200 to 354 days in any given year. Therefore if the project were to receive the median rainfall (50th percentile rainfall as outlined in Table 2-2), the demand would be fully satisfied for 200 – 354 days in any given year. This is represented as the blue line in the figure. The site has an ability to supply a medium to high degree of water supply reliability to the proposed as placement facility. If the rainfall received at the project site was significantly below average (10th percentile rainfall as outlined in Table 2-2), the water balance model predicts there is only a 10 % chance that the proposed ash placement facility will be able to fully supply the water required for 85 to 200 of the days in the year (this is the green line). This is there is only a 1 in 10 chance that in any year the operation will be able to fully supply the demands for less than 180 days (ie a 10% chance there will be a shortfall in water available for one half of the year). SINCLAIR KNIGHT MERZ I:\ENVR\Projects\EN02503\Deliverables\EA\Final for Exhibition\AppD_Mt Piper Ash_Hydrology and Water Quality_230810.doc PAGE 28
Mt Piper Power Station Ash Placement Project – Hydrology and Water Quality
Figure 2-8 Water Availability Rehabilitation and Dust Suppression Demand
The water balance modelling predicts there will be suitable water availability to supply the
rehabilitation and dust suppression demand for the proposed ash placement facility. The
consequence of a shortfall of water to supply rehabilitation is minor in that during periods of
median rainfall the shortfall would occur on no more than 3-23% of days of the year and during
very low rainfall the shortfall would occur on no more than one half of the days of the year. This
is based on a daily water demand for dust suppression and rehabilitation of 250 kL/day for Mt
Piper alone and 450 kL/day for Mt Piper and Mt Piper Extension together, regardless of water
availability or water need. The reliability of water supplied for rehabilitation is calculated on a
daily basis and in the event of a shortfall occurring on a given day alternative management
processes exist for use on that given day or series of days. As part of the Water Management
System development, a component will be to manage times of low availability of water on site.
Water management in very low availability conditions was discussed above. All of these
activities form part of the current water management strategies and reflect the local water
situation.
SINCLAIR KNIGHT MERZ
I:\ENVR\Projects\EN02503\Deliverables\EA\Final for Exhibition\AppD_Mt Piper Ash_Hydrology and Water Quality_230810.doc PAGE 29Mt Piper Power Station Ash Placement Project – Hydrology and Water Quality
Releases from Site
Figure 2-9 shows the predicted range of storage volume for the Dirty Water Storage, which
manages runoff from the active ash placement areas. The figure shows the maximum result and a
range of exceedance probabilities over the project life.
Figure 2-9 Dirty Water Storage Area
The water balance model predicts that the maximum volume of water to be stored in the Dirty
Water Storage Area, as a result of a major rainfall event, is 200 ML. This maximum volume is
less than the volume of the Dirty Water Storage Area. Therefore, the model predicted there
would be no releases from Dirty Water Storage Area of the proposed ash placement facility for
15,000 years of simulated project life.
The sediment dams and existing water storages on the site will manage the runoff containing
sediment from the capped and rehabilitated areas. There would be no planned releases from this
system and the final retention dam would overflow to the waterway after the runoff has been
treated appropriately. The frequency of the overflows from the sediment dams system was
determined from the water balance model in terms of Average Recurrence Interval. This
assessment determined that for the 15,000 years simulated, there were 3,038 years in which water
overflowed from the sediment dams. This equates to an ARI of approximately 1 in 5 years and
SINCLAIR KNIGHT MERZ
I:\ENVR\Projects\EN02503\Deliverables\EA\Final for Exhibition\AppD_Mt Piper Ash_Hydrology and Water Quality_230810.doc PAGE 30Mt Piper Power Station Ash Placement Project – Hydrology and Water Quality
therefore, on average, the site would be predicted to have an overflow from the sedimentation
dams in six years of the 30 year project life.
This result represents the maximum likely overflows from the sediment dams over the life of the
proposed ash placement facility.
These results are the same for both the existing Mt Piper Project and the Mt Piper Extension
Project.
2.4.4. Neubecks Creek and Ivanhoe No 4
To manage the potential impacts of the development of the areas of Ivanhoe No. 4 and Neubecks
Creek, a site water management system at each site would need to be developed.
The philosophy of the water management strategy would be to provide adequate water to the
proposed ash placement facility to operate successfully while minimising environmental impacts
by collecting and managing dirty runoff water. A water management system developed for each
area would have the following key principles:
Stormwater runoff from undisturbed areas surrounding the site would be diverted away from
disturbed areas and released directly into adjacent waterways;
Design of any drainage systems operating for the life of the site to ensure erosion minimised;
Staging ash placement to minimise the operational area exposed at any one time to reduce the
potential for erosion;
Separating sediment-containing stormwater from other sources of polluted water on the site
such as the ash placement area;
Incorporating the reuse of contaminated stormwater into the overall water management
strategy for the Project to meet the demands for rehabilitation and dust suppression; and
Minimisation of extent and duration of disturbed areas by implementing a progressive
rehabilitation strategy including prompt stabilisation of landforms.
In the process of developing the water management system, a number of studies would need to be
undertaken for water management and to assess flooding. The development of the water
management for the site would require the development of a water balance model. The objectives
of the water balance model would be to:
Control the release of water from the storages so that that releases occur in a manner that
minimises impacts upon downstream users and the environment;
Manage dam storages so as to have enough water to adequately supply to demands for
rehabilitation and dust suppression;
Control and manage the separation and use of clean and dirty water.
SINCLAIR KNIGHT MERZ
I:\ENVR\Projects\EN02503\Deliverables\EA\Final for Exhibition\AppD_Mt Piper Ash_Hydrology and Water Quality_230810.doc PAGE 31You can also read